Embed Size (px)
Citation preview

One Way ANOVAOne Way ANOVA
©2005 Dr. B. C. Paul modified 2009©2005 Dr. B. C. Paul modified 2009
Note – The concepts presented in these slides are considered Note – The concepts presented in these slides are considered common knowledge to those familiar with statistics and similar ideas common knowledge to those familiar with statistics and similar ideas are found in many texts. The approach to the topic presented here are found in many texts. The approach to the topic presented here
was chosen by the author and is not known to follow outlines was chosen by the author and is not known to follow outlines covered in other books. The slides do contain screen shots taken covered in other books. The slides do contain screen shots taken
from the output of the program SPSS.from the output of the program SPSS.

Comparing PopulationsComparing Populations
We last considered a case where we We last considered a case where we compared two populations to compared two populations to determine if they were the samedetermine if they were the same The Red Rooster CarburetorThe Red Rooster Carburetor
Sometimes a particular variable Sometimes a particular variable involves many cases and involves many cases and populations – going two by two might populations – going two by two might take longer than Noah loading the take longer than Noah loading the arcarc

Consider the Case of the Red Consider the Case of the Red Rooster CarburetorRooster Carburetor We compared an array of cars with We compared an array of cars with
and without the carburetor to see if it and without the carburetor to see if it improved mileageimproved mileage It did but we needed a huge set of trialsIt did but we needed a huge set of trials
We picked one particular type of car We picked one particular type of car and went pair-wise to see if the and went pair-wise to see if the carburetor improved mileage on one carburetor improved mileage on one particular type of car and over a wide particular type of car and over a wide range of driversrange of drivers We needed fewer trials but we only We needed fewer trials but we only
knew about 1 type of car in the end.knew about 1 type of car in the end.

SupposeSuppose
Suppose we want to know Suppose we want to know whether the Red Rooster whether the Red Rooster Carburetor improves mileage in Carburetor improves mileage in a wide range of cars.a wide range of cars. Right now we only know it works Right now we only know it works
on average of a bunch of cars and on average of a bunch of cars and drivers and that it probably works drivers and that it probably works on Dodge Neons with a wide on Dodge Neons with a wide range of different driversrange of different drivers

Enter ANOVAEnter ANOVA
Ok What is ANOVAOk What is ANOVA ANOVA standards for Analysis of ANOVA standards for Analysis of
VarianceVariance The Technique puts test data The Technique puts test data
together in groups obtained under together in groups obtained under like conditionslike conditions It then looks at differences and It then looks at differences and
variability's between different groupsvariability's between different groups The technique tells us which changes in The technique tells us which changes in
conditions are producing abnormal conditions are producing abnormal changes in resultschanges in results
Those changes will then be considered Those changes will then be considered statistically significantstatistically significant

The ExperimentThe Experiment
We will repeat the Dodge Neon We will repeat the Dodge Neon experiment with several different experiment with several different types of carstypes of cars
What we want to know is What we want to know is whether the results we get from whether the results we get from the Red Rooster Carburetor are the Red Rooster Carburetor are different for different types of different for different types of cars cars

The DataThe Data
For a Dodge Neon where we For a Dodge Neon where we had 10 different drivers drive the had 10 different drivers drive the car before and after changing car before and after changing the Carburetor we foundthe Carburetor we found Results 21.13%, 17.12%, 26.19%, Results 21.13%, 17.12%, 26.19%,
24.68%, 21.71%, 16.79%, 24.68%, 21.71%, 16.79%, 20.48%, 22.51%, 22.85%, 22.34%20.48%, 22.51%, 22.85%, 22.34%
This represents improvement in This represents improvement in gas mileagegas mileage

More Test WorkMore Test Work
We had the same 10 drivers do We had the same 10 drivers do before and after drives in a Ford before and after drives in a Ford E350 Van, a Cadillac Deville, a E350 Van, a Cadillac Deville, a Honda Accord, a Chevy Malibu, and Honda Accord, a Chevy Malibu, and a Toyota Tundraa Toyota Tundra
We calculated our % improvement in We calculated our % improvement in fuel economy for each driver in each fuel economy for each driver in each carcar
Our Question – does the Our Question – does the improvement depend on the type of improvement depend on the type of car that was retrofit with the Red car that was retrofit with the Red Rooster Carburetor?Rooster Carburetor?

Setting Up ANOVASetting Up ANOVA
DodgeNeonsData
FordE350VanData
CadillacDevilleData
HondaAccordData
ChevyMalibuData
ToyotaTundraData
We group our gas mileage improvements by type of car

Ideas About ANOVAIdeas About ANOVA
If we take our data and square it – If we take our data and square it – big numbers will have big squares big numbers will have big squares and little numbers little squaresand little numbers little squares
All the numbers squared is our sum All the numbers squared is our sum of squares totalof squares total
We can get subtotal sums of squares We can get subtotal sums of squares within our individual “Treatments”within our individual “Treatments”
Anything not accounted for by the Anything not accounted for by the treatments must be due to random treatments must be due to random errorerror

Lets Do the ProblemLets Do the Problem
I’m not going to show you how I’m not going to show you how to calculate the sums of squaresto calculate the sums of squares
I’m not going to tell you much I’m not going to tell you much about the mathematical theory about the mathematical theory of why we are doing thisof why we are doing this
I will show you how to set this I will show you how to set this up and let SPSS run the up and let SPSS run the analysisanalysis

Set #1 Enter the Data in Set #1 Enter the Data in SPSSSPSS
Note that I entered before andAfter fuel economy improvementsFor each driver in column #1
I entered a numeric code for autoType in field #2 where 1 was a Neon2 is a Ford E350, 3 is a CadillacDeVille etc.

Step #2 Tell SPSS to do a Step #2 Tell SPSS to do a One Way ANOVAOne Way ANOVA
Pull down the menu underAnalyze
Highlight Compare Means
On the pop out menu highlightOne Way Anova and hit return

Make Improvement in Gas Make Improvement in Gas Mileage the “Dependent Variable”Mileage the “Dependent Variable”
Highlight ImprovementIn the box on the left
Click the arrow byDependent Variable toMove Improvement toThe dependent variableBox.

Make Auto the FactorMake Auto the Factor
Highlight Auto
Click on the arrow to move the variableInto the factor box.

Click OK and Read the Click OK and Read the ResultsResults

Understanding ResultsUnderstanding Results
First Thing ANOVA did was to compile the squaresOf the values in the different groupings.
We see of the total variability most of theDifferences are showing up inside the groupsWith very little difference between groups

Review the Degrees of Review the Degrees of FreedomFreedom
We have 6 types of carsWith n-1 degrees ofFreedom or 5.
We have 60 pieces of data to analyze so we have n-1 totalDegrees of Freedom.
Of the 59 total degrees of freedom we use up 5 of them onDifferent types of cards leaving 54 values free to send resultsIn random directions.

We get Our Mean Square by We get Our Mean Square by Divide the SS by the Degrees of Divide the SS by the Degrees of FreedomFreedom
Our Mean Square
This is giving us an idea of the average amount of variabilityComing from something – in this case variability by type of carAnd variability coming from everything else.

We next divide the mean square We next divide the mean square for the treatment by the mean for the treatment by the mean square for error (everything else)square for error (everything else)
Result of our Division
So what is this F business?

I Was Afraid You Were Going I Was Afraid You Were Going to Tell Meto Tell Me If our model fits the real world when If our model fits the real world when
we divide our normally distributed we divide our normally distributed mean square for treatments by our mean square for treatments by our normally distributed mean square normally distributed mean square error the resulting number has an F error the resulting number has an F distribution.distribution. F distribution is just another of those F distribution is just another of those
probability density functions that probability density functions that Sadisticians – woops Statisticians Sadisticians – woops Statisticians worked out proved and integrated and worked out proved and integrated and put results in tables.put results in tables.

As with Other TestsAs with Other Tests
Value we calculated goes on the X axis.
Integrate the area under the curve up to the value of X. ThisRepresents the chances of getting a less unusual result.
The area above that point representsThe risk you take if you reject the“Null Hypothesis”

So What is the “Null So What is the “Null Hypothesis” this timeHypothesis” this time The “Null Hypothesis” is the The “Null Hypothesis” is the
assumption that nothing beyond assumption that nothing beyond unaccounted for random variations unaccounted for random variations are taking place.are taking place.
In the case of a one way ANOVA the In the case of a one way ANOVA the “Null Hypothesis” is that our “Null Hypothesis” is that our treatment variable makes no treatment variable makes no differencedifference We will look for our test statistic to have We will look for our test statistic to have
such a high “degree of significance” that such a high “degree of significance” that we just can’t believe thatwe just can’t believe that

Looking at Our SignificanceLooking at Our Significance
The significance shown here is the area under the curveBeyond our point on the X axis.
One basically means that the whole Universe of opportunities isStill out there – Ie The type of Car being fit with the RedRooster Carburetor makes no difference compared to otherFactors that have not yet been explained.
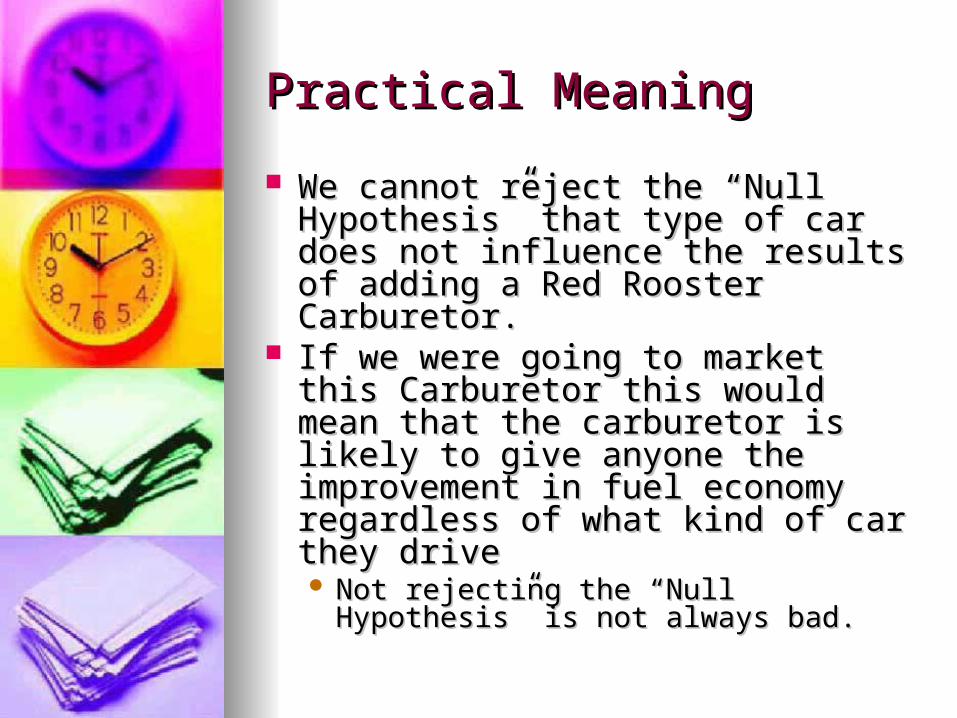
Practical MeaningPractical Meaning
We cannot reject the “Null We cannot reject the “Null Hypothesis” that type of car does not Hypothesis” that type of car does not influence the results of adding a Red influence the results of adding a Red Rooster Carburetor.Rooster Carburetor.
If we were going to market this If we were going to market this Carburetor this would mean that the Carburetor this would mean that the carburetor is likely to give anyone carburetor is likely to give anyone the improvement in fuel economy the improvement in fuel economy regardless of what kind of car they regardless of what kind of car they drivedrive Not rejecting the “Null Hypothesis” is not Not rejecting the “Null Hypothesis” is not
always bad.always bad.

Limitations in MeaningLimitations in Meaning
We would like to jump to We would like to jump to judgment and say “the type of judgment and say “the type of car makes no difference”.car makes no difference”.
Two numbers influence the F Two numbers influence the F tests.tests. Big F numbers can come from big Big F numbers can come from big
MS effects for treatmentsMS effects for treatments They can also come from little They can also come from little
denominator values for MS errordenominator values for MS error
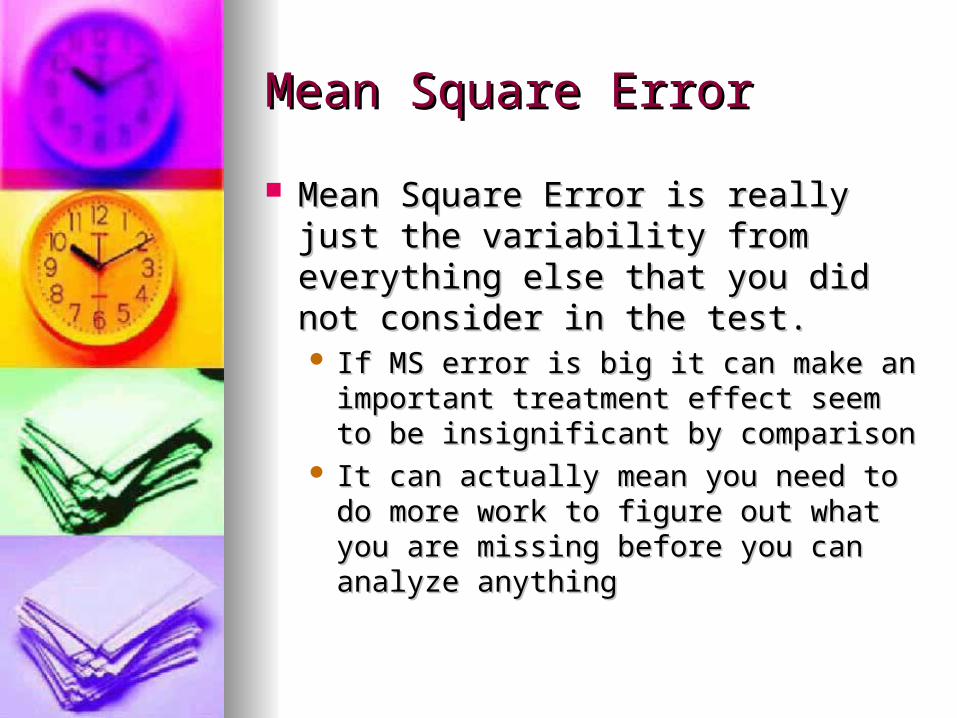
Mean Square ErrorMean Square Error
Mean Square Error is really just the Mean Square Error is really just the variability from everything else that variability from everything else that you did not consider in the test.you did not consider in the test. If MS error is big it can make an If MS error is big it can make an
important treatment effect seem to be important treatment effect seem to be insignificant by comparisoninsignificant by comparison
It can actually mean you need to do It can actually mean you need to do more work to figure out what you are more work to figure out what you are missing before you can analyze missing before you can analyze anythinganything

Assumptions and LimitationsAssumptions and Limitations
We assume we are studying normally We assume we are studying normally distributed populationsdistributed populations
We assume that the variance is the same We assume that the variance is the same (or negligibly close) for each of our (or negligibly close) for each of our treatmentstreatments Ie the variability in results for gas mileage Ie the variability in results for gas mileage
improvement are the same regardless of which improvement are the same regardless of which type of car was testedtype of car was tested
The math requires us to have the same The math requires us to have the same number tests for each different type of carnumber tests for each different type of car
There are specialized test arrangements There are specialized test arrangements that get you around some of these that get you around some of these standard limiting provisions.standard limiting provisions.

Now It’s Your TurnNow It’s Your Turn
Do Unit #3 Assignment #1 (also known as Do Unit #3 Assignment #1 (also known as assignment #5)assignment #5)
When you build a highway you want the pavement When you build a highway you want the pavement to take a long time before it breaks upto take a long time before it breaks up People are also looking for ways to make pavement People are also looking for ways to make pavement
mixes stonger, longer lasting and cheapermixes stonger, longer lasting and cheaper One possible way is to add Fly Ash and replace One possible way is to add Fly Ash and replace
cementcement When coal is burned in a power plant it contains some When coal is burned in a power plant it contains some
dirt that settled with the plant material in the swampdirt that settled with the plant material in the swamp Dirt does not burn but the little dirt particles melt and are Dirt does not burn but the little dirt particles melt and are
carried up the smokestack by the hot moving aircarried up the smokestack by the hot moving air We put clears on the smokestacks so we don’t dump We put clears on the smokestacks so we don’t dump
soot all over the country sidesoot all over the country side The stuff we collect is a gray or tan colored talcum The stuff we collect is a gray or tan colored talcum
powder like texture – its called fly ash.powder like texture – its called fly ash. Different amounts of fly ash are added to road Different amounts of fly ash are added to road
pavement mixes. The question is whether it pavement mixes. The question is whether it changes how long the road lasts.changes how long the road lasts.