Embed Size (px)
Citation preview
REGIONAL STEERING COMMITTEE ON HOMELESSNESS
February 28, 2012
One Step Forward…
Results of the 2011 Metro Vancouver Homeless Count

One Step Forward…
Results of the 2011 Metro Vancouver Homeless Count
The RSCH gratefully acknowledges the financial contributions of the following organizations to the 2011 Homeless Count, including the preparation of this report:

One Step Forward…
February 28, 2012
Page ii
TABLE OF CONTENTS
MESSAGE FROM THE REGIONAL STEERING COMMITTEE ON HOMELESSNESS .............................................................. vi
ACKNOWLEDGEMENTS ....................................................................................................................................... vii
EXECUTIVE SUMMARY
PROJECT AIM .............................................................................................................................................. viii
METHODOLOGY ........................................................................................................................................... viii
KEY FINDINGS .............................................................................................................................................. viii
INTRODUCTION
1.1 WHO WAS COUNTED? ........................................................................................................................ 1
1.2 WHO WAS NOT COUNTED? ................................................................................................................. 1
1.3 REPORT OUTLINE ............................................................................................................................... 1
METHODOLOGY
2.1 INTRODUCTION ................................................................................................................................. 3
2.2 OVERALL APPROACH ......................................................................................................................... 3
2.3 ‘COUNTED’ VS. ‘SURVEYED’ POPULATIONS ........................................................................................... 4
2.4 PEOPLE WITH NO FIXED ADDRESS ....................................................................................................... 5
2.5 COORDINATED APPROACH TO IMPLEMENTATION .................................................................................. 5
2.5.1 KEY PARTNERSHIPS .................................................................................................................. 6
2.5.2 VOLUNTEER RECRUITMENT & TRAINING ..................................................................................... 7
2.5.3 COUNT DAY PROCEDURES ......................................................................................................... 7
2.5.4 POST-COUNT COMMUNITY CONSULTATIONS ............................................................................... 9
2.6 STUDY LIMITATIONS .......................................................................................................................... 9
REGIONAL CONTEXT
3.1 INTRODUCTION ................................................................................................................................ 11
3.2 CHANGES IN PROGRAM DIRECTION .................................................................................................... 11
4.1 INTRODUCTION ................................................................................................................................ 14
4.2 TOTAL HOMELESS ............................................................................................................................ 14
4.3 REGIONAL TRENDS ........................................................................................................................... 15
REGIONAL HOMELESS POPULATION
5.1 INTRODUCTION ................................................................................................................................ 17
5.2 GENDER ......................................................................................................................................... 17
5.2 AGE ................................................................................................................................................ 18
5.3 ETHNICITY ...................................................................................................................................... 20

One Step Forward…
February 28, 2012
Page iii
5.4 SOURCES OF INCOME ........................................................................................................................ 21
5.5 LENGTH OF TIME HOMELESS.............................................................................................................. 22
HEALTH AND WELLBEING
6.1 INTRODUCTION ............................................................................................................................... 26
6.2 HEALTH CONDITIONS ....................................................................................................................... 26
6.3 SOCIAL ISOLATION .......................................................................................................................... 28
6.4 ACCESS TO FOOD ............................................................................................................................ 30
PATTERNS OF SERVICE USE
7.1 INTRODUCTION ................................................................................................................................ 31
7.2 WHERE THE UNSHELTERED HOMELESS STAYED ................................................................................... 31
7.3 REASONS UNSHELTERED DID NOT STAY IN SHELTER ........................................................................... 33
7.4 NUMBER OF DAYS SPENT IN SHELTER ................................................................................................ 34
7.5 SERVICES ACCESSED IN PAST YEAR .................................................................................................... 36
7.6 HOUSING BARRIERS ........................................................................................................................ 37
7.7 YOUTH SERVICES ............................................................................................................................ 39
7.8 REFUSAL OF SERVICES ..................................................................................................................... 40
7.9 ENDING HOMELESSNESS ................................................................................................................... 41
PROFILES OF SPECIAL POPULATIONS
8.1 INTRODUCTION ............................................................................................................................... 43
8.2 ABORIGINAL PEOPLE ....................................................................................................................... 43
8.3 WOMEN ........................................................................................................................................ 44
8.4 UNACCOMPANIED YOUTH ................................................................................................................. 47
8.5 SENIORS ........................................................................................................................................ 48
8.6 FAMILIES ....................................................................................................................................... 49
8.7 NEW CANADIANS ............................................................................................................................. 51
MUNICIPAL HOMELESS POPULATION
9.1 INTRODUCTION ............................................................................................................................... 53
9.2 TOTAL HOMELESS FOUND ................................................................................................................ 53
9.3 PROFILE OF THE SURVEYED HOMELESS .............................................................................................. 54
9.4 TIME SPENT IN MUNICIPALITY .......................................................................................................... 57
9.5 PLACE OF ORIGIN ............................................................................................................................ 58
CONCLUDING NOTES .………………………………..……………………………….……………………61
APPENDIICES
1 SURVEY INSTRUMENTS ......................................................................................................................... 62
2 NO FIXED ADDRESS LOCATIONS ............................................................................................................ 66
One Step Forward…
February 28, 2012
Page iv
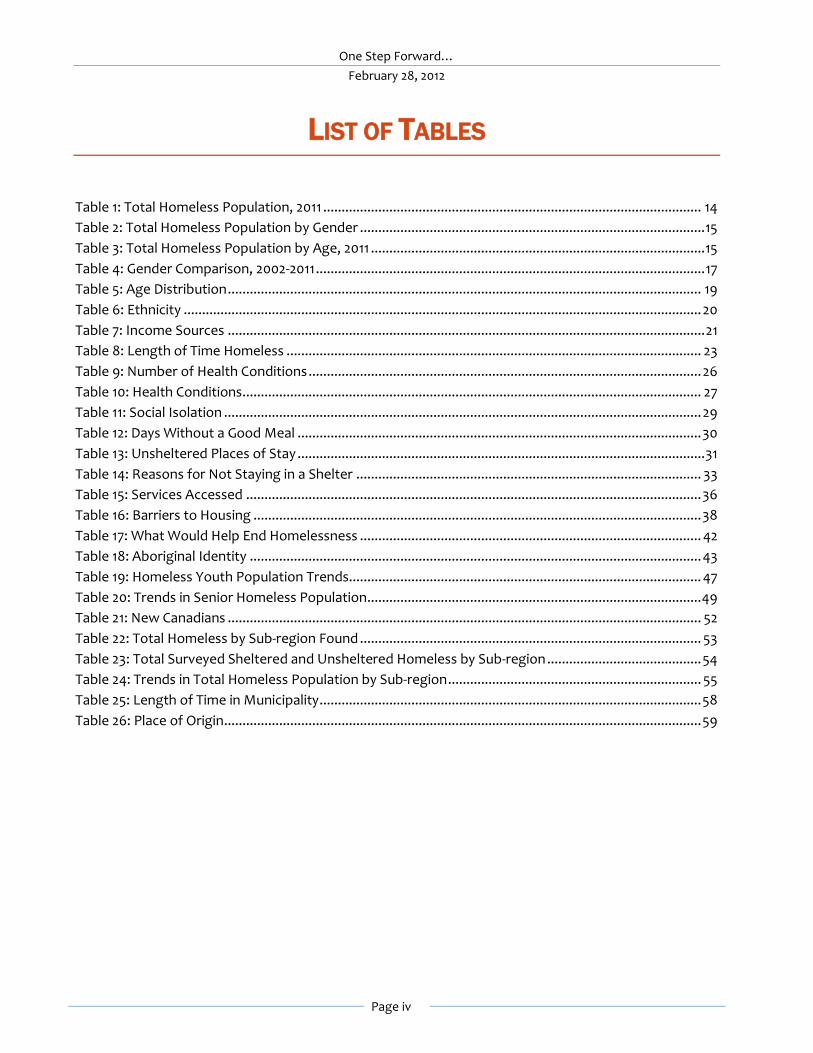
LIST OF TABLES
Table 1: Total Homeless Population, 2011 ....................................................................................................... 14
Table 2: Total Homeless Population by Gender .............................................................................................. 15
Table 3: Total Homeless Population by Age, 2011 ........................................................................................... 15
Table 4: Gender Comparison, 2002-2011 .......................................................................................................... 17
Table 5: Age Distribution ................................................................................................................................. 19
Table 6: Ethnicity ............................................................................................................................................. 20
Table 7: Income Sources .................................................................................................................................. 21
Table 8: Length of Time Homeless ................................................................................................................. 23
Table 9: Number of Health Conditions ........................................................................................................... 26
Table 10: Health Conditions ............................................................................................................................. 27
Table 11: Social Isolation .................................................................................................................................. 29
Table 12: Days Without a Good Meal .............................................................................................................. 30
Table 13: Unsheltered Places of Stay ............................................................................................................... 31
Table 14: Reasons for Not Staying in a Shelter .............................................................................................. 33
Table 15: Services Accessed ............................................................................................................................ 36
Table 16: Barriers to Housing .......................................................................................................................... 38
Table 17: What Would Help End Homelessness ............................................................................................. 42
Table 18: Aboriginal Identity ........................................................................................................................... 43
Table 19: Homeless Youth Population Trends................................................................................................ 47
Table 20: Trends in Senior Homeless Population ........................................................................................... 49
Table 21: New Canadians ................................................................................................................................. 52
Table 22: Total Homeless by Sub-region Found ............................................................................................. 53
Table 23: Total Surveyed Sheltered and Unsheltered Homeless by Sub-region .......................................... 54
Table 24: Trends in Total Homeless Population by Sub-region ..................................................................... 55
Table 25: Length of Time in Municipality ........................................................................................................ 58
Table 26: Place of Origin .................................................................................................................................. 59

One Step Forward…
February 28, 2012
Page v
LIST OF FIGURES
Figure 1: Precarious Housing Iceberg Paradigm ............................................................................................... 1
Figure 2: Trends in Number of Homeless ....................................................................................................... 16
Figure 3: Trend in Female Composition of Total Homeless Population ....................................................... 18
Figure 4: Trends in Youth, Adult and Senior Populations.............................................................................. 19
Figure 5: Proportion of Homeless On Income Assistance ............................................................................. 22
Figure 6: Length of Time Homeless by Age ................................................................................................... 24
Figure 7: Length of Time Homeless by Gender .............................................................................................. 24
Figure 8: Proportion of Long Term Homeless ............................................................................................... 25
Figure 9: Health Trends ................................................................................................................................... 28
Figure 10: Unaccompanied Homeless ............................................................................................................ 29
Figure 11: Where Homeless Stayed Previous Night........................................................................................ 32
Figure 12: Reasons Unsheltered Did Not Use Shelters .................................................................................. 34
Figure 13: Number of Days in Shelter ............................................................................................................. 35
Figure 14: Usage of Health Services ................................................................................................................ 37
Figure 15: Withdrawal of Youth Services ........................................................................................................ 40
Figure 16: Trend in Aboriginal Homelessness ................................................................................................ 44
Figure 17: Age and Shelter Distribution of Homeless women ....................................................................... 45
Figure 18: Growth Trends Among Homeless Women ................................................................................... 46
Figure 19: Homeless Families ........................................................................................................................... 51
One Step Forward…
February 28, 2012
Page vi
Message from the Regional Steering Committee on Homelessness
The results of the 2011 regional Homeless Count may prove that the Metro Vancouver region has moved ‘one step forward’ in addressing homelessness. For the first time since the regional Count was initiated in 2002, the homeless population has not grown in the three years since the previous count –– an accomplishment to be acknowledged, especially in a time of global economic recession, rising housing costs, shrinking affordable housing stocks and few increases for people on fixed incomes such as seniors and those receiving Income Assistance and Disability Pensions.
New targeted federal and provincial government partnerships with local municipalities and community agencies have made a significant difference since 2008. We thank these partners for their successful efforts. These resources working to link people who are homeless with income, housing and supports are what we refer to as the ‘three ways to home’, because we know the combination of these three things are what is needed to both prevent and reduce homelessness. Continuing to make these resources available will be important to ensure Count numbers do not increase in the future. Of special concern is the number of homeless families found in 2011, the highest ever reported. We also know that Count numbers reflect the bare minimum of total homeless, often only capturing the visible homeless.
Local efforts are always the key to ensuring a successful Count process. We would like to thank the Community Homelessness Tables and Local Coordinators, the City of Vancouver Housing Policy Division, the Aboriginal Homelessness Steering Committee, and Watari Hard Target for partnering with us on this project. Once again, these local groups demonstrated a strong capacity to organize to conduct the Count. These partnerships are what will ensure the success of future Counts.
We would also like to thank the United Way of the Lower Mainland, Vancouver Foundation, City of Vancouver, and Surrey Homelessness and Housing Society for contributing financial assistance to support the 2011 Homeless Count.
More community and government partnerships are needed to continue our efforts toward lasting solutions to homelessness without taking any steps back. Let us move further forward in the next three years, continuing to build on what works for those with mental health and addiction issues, while creating more specialized solutions for those who continue to struggle to find safe and affordable homes in Metro Vancouver, especially Aboriginal peoples, women, youth and seniors. Together, we have the knowledge and the capacity to solve homelessness in Metro Vancouver.
Alice Sundberg and Susan Papadionissiou, Co-Chairs Greater Vancouver Regional Steering Committee on Homelessness
One Step Forward…
February 28, 2012
Page vii
Acknowledgements
The Metro Vancouver Homelessness Secretariat would like to acknowledge the RSCH Governance Working Group (Annie Mauboules, Susan Papadionissiou, Jacqui Mendes, Yves Trudel, Patrick Stewart, Liza Jimenez, Leslie Stern, and Ron Savoy) and members of the Core Technical Advisory Committee (Dr. Julian Somers, Catharine Hume, Karen Hemmingson, Margaret Eberle, Judy Graves, Rebecca Siggner and Janet Kreda). Thanks also to OrgCode Consulting Inc. for implementing the 2011 Homeless Count strategy developed by the community and its many partners. Working in partnership with the Metro Vancouver Homelessness Secretariat, OrgCode Consulting Inc. trained volunteers and local community coordinators, monitored 2011 Count Day activities, conducted pre-narrative consultations throughout Metro Vancouver, and aggregated and analyzed the survey data that resulted in the preliminary report, released in May 2011. Thank you to Patrick Stewart and the Aboriginal Homelessness Steering Committee and InFocus Consulting (Dave Pranteau, Dave Baspaly and Lee Faurot) for guiding and implementing the Aboriginal component of the Count and contributing expertise and knowledge to the Final Report. The work of the local Community Homelessness Tables and Local Coordinators (Irene Jackson, Erin Barber, Brough Milner, Jonquil Hallgate, Peter Fedos, Shayne Williams, Sandy Burpee, Wanda Mulholland, Colleen Fitzpatrick, John Stark, Dave Brown, Leya Eguchi, Fraser Holland, Lynda Brummit, Cecilia Hudec, Harry Monk, and Stephanie Ediger) and staff at the City of Vancouver Housing Policy Division (Judy Graves and Liza Jimenez) has been endless. The success of the 2011 Count is greatly indebted to these partners. Thanks to Watari Hard Target and Natasha Van Borek for expertly piloting the first Youth Implementation Strategy. Thank you to all of the youth agencies that hosted youth hubs on Count Day and designated youth outreach workers who worked effortlessly to include as many homeless youth as possible in the Count. Thanks to the Greater Vancouver Shelter Strategy (GVSS) and all shelter and service providers for providing invaluable direction and support for the 2011 Count. Thanks also to the GVSS for continuing to allow the 2011 Count to use the GVSS shelter logo. Thanks also to BC Housing for providing shelter data to augment survey data as much as possible, and for providing staff volunteers on Count Day. And a final word of thanks to the funders of the 2011 Count: United Way of the Lower Mainland, Vancouver Foundation, City of Vancouver, and Surrey Homelessness and Housing Society. Thank you for contributing to this important research. Homelessness Secretariat February 28, 2012

One Step Forward…
February 28, 2012
Page viii
EXECUTIVE SUMMARY
Project Aim
The 2011 Metro Vancouver Homeless Count was commissioned by the Greater Vancouver Regional Steering Committee on Homelessness (RSCH) to update the number of homeless people in the region, the demographic profile of those surveyed or enumerated on Count Day, and trends on the nature and character of homelessness with reference to the three previous Counts in 2002, 2005 and 2008.
Methodology
The 2011 Homeless Count used the same methodology as the 2005 and 2008 Counts, with some exceptions.1 As in previous Counts, the 2011 Count was designed as a 24-hour point in time snapshot of homelessness in the region. It consisted of two parts -- a night time component calculated to count people in sheltered facilities, and a day time component designed to count people on the streets and other non-residential locations where homeless people were known to assemble.
Key Findings
The key findings of the project were as follows: 1. Total Population
Total homeless population was unchanged. The total number of homeless people found in the region was virtually unchanged from 2008. 2,650 people were found compared to 2,660 counted in 2008. This represented an absolute reduction of 10 people or 0.4%.
Unsheltered homelessness decreased dramatically. The number of homeless people who remained unsheltered was less than half the number found in 2008. In 2008, there were 1,574 people without shelter compared to 758 in 2011, a 52% reduction.
Sheltered homelessness increased significantly. The reduction in the level of unsheltered homelessness was accompanied by a dramatic increase in the number and proportion of people found in sheltered facilities. Overall, there was a 74% increase in the number of people in emergency shelters and similar facilities -- from 1,086 in 2008 to 1,892 in 2011. As a consequence, 71% of the total homeless population was sheltered in 2011, compared to 41% in 2008 – a 30% improvement.
More than 100 people were sheltered in institutions. 112 people or 4% of the total homeless population were sheltered in institutions such as jails, remand centres, hospitals, emergency rooms, detox centers, psychiatric units and other temporary facilities. These individuals had no homes to return to upon release and were therefore likely to return to the streets, unless they were provided with transition assistance during discharge.
1 See Chapter 2, Methodology.

One Step Forward…
February 28, 2012
Page ix
People stayed in emergency shelters for shorter periods of time. Although more people used the emergency shelter system, they stayed there for short periods of time. Those found in shelters reported using shelters on average for 78 cumulative days. Overall, 77% of those surveyed in shelters reported that they stayed in shelters for less than 3 months during the previous 12 months.
Increases in shelter beds, including low-barrier shelter beds, facilitated the movement of people to shelters. Post-Count community consultations indicated that the major shift of the total homeless population from unsheltered environments to shelter facilities was attributable in part to one of major changes in the regional shelter infrastructure that occurred between 2008 and 2011 -- the addition of 556 shelter beds across the region. Particularly, the majority of the beds were provided under the BC Housing and City of Vancouver low-barrier Homeless Emergency Action Team (HEAT) temporary shelter initiative in Vancouver. It was acknowledged that this initiative and other new shelter programs in the region facilitated the transition of people, especially those who may have experienced barriers to shelters in the past, from the streets to shelters.
2. Population Groups
Aboriginal people remained overrepresented in the homeless population. Twenty-seven percent (27%) of the surveyed homeless population self-identified as Aboriginal, although Aboriginal people comprised only about 2% of the general population of Metro Vancouver. Although in absolute and percentage terms the number of Aboriginal people was lower than in previous Counts, Aboriginal people remained significantly overrepresented in the region’s homeless population. During post-Count community consultations, Aboriginal community leaders called for more resources and dedicated culturally-sensitive services to assist Aboriginal people to exit homelessness.
Youth homelessness increased. A total of 397 unaccompanied youth under the age of 25 were found. This was the highest number of unaccompanied homeless youth ever found in the region – a 9% increase from 2008 and a 34% change from 2005. Seventy-nine or 25% of the unaccompanied youth who were surveyed reported that they had been affected by the withdrawal of youth services by one or more agency of government.
Female share of the homeless population increased. The proportion of females in the homeless population has been rising since 2005. In 2005, one of four homeless person (26%) was female but by 2011 nearly one in three (30%) was female.
Number of homeless families increased. Fifty-six homeless families with 54 children were found. This was the highest number of families ever recorded in a Count. The majority of the children, 32 of the 54, were 12 years or younger, including 5 under the age of one, 19 between ages one and five, and two between six and 12 years. The majority of the homeless families (55%) reported being homeless due to family breakdown, abuse or conflict.
More seniors remained homeless longer and were susceptible to high shelter costs. More than 200 people aged 55 years and older were found homeless in 2011. Although the absolute number of homeless seniors did not indicate a change in trend since 2008, nearly 48% of the seniors found in 2011 were considered long term homeless – people who had been without a home for at least one year. Large segments of this population also faced health issues.
One Step Forward…
February 28, 2012
Page x
Approximately 50% had two or more health conditions, including 53% with medical conditions, 45% physical disabilities, 31% with addictions, and 20% with mental health challenges. In 2002, eviction was the leading reason (25%) seniors cited for being homeless, but in 2011, one in two (50%) cited high rent or low income as a reason why they remained homeless.
Francophones remained a significant population group. The number and proportion of Francophone people who are homeless declined between 2008 and 2011. However, Francophones remained the largest ethnic homeless population after Aboriginal people.
Many new Canadians identified among the homeless. Fifty-eight homeless people identified themselves as new Canadians. This population was more likely to be sheltered than unsheltered, suggesting that cultural considerations may need to be taken into consideration for future facility and service development decisions.
3. Health and Wellbeing
Health conditions have worsened. Incidence of multiple health challenges among the homeless increased significantly. Nearly two out of three homeless people surveyed (62%) reported multiple health conditions, including one in three (31%) that reported three or four health challenges. Only a handful of people (3) reported no health conditions at all.
Unsheltered homeless population had difficulties accessing food. Nearly 70% of the unsheltered homeless population had not had a good meal for two or more days when they were encountered on Count Day. On the other hand, 75% of the sheltered reported eating a good meal within 24 hours of the Count.
4. Gateway Services
People in shelters were more likely to access housing and support services. Compared to those who were unsheltered, people found in shelters were more likely to be connected to many types of important services offered by governments and service providers to assist in the transition out of homelessness. For example, people found in shelters were more than three times as likely as those found unsheltered to access transitional housing services, and almost twice as likely to use housing help services. In addition, they were much more likely to access non-emergency hospital services, employment services, mental health services, and legal services.
More people had access to Income Assistance. Over half of the homeless population surveyed (52%) had access to Income Assistance. A slightly higher percentage (53%) of those who were sheltered had access to income assistance compared to those who were unsheltered (51%). Overall, those who were sheltered were more likely to report access to virtually all government transfer payments and employment than their unsheltered counterparts.
Meal programs and soup kitchens were important, although access to food was an issue for many homeless people. Meal programs and soup kitchens were the most frequently used services by the homeless, with nearly 53% of the homeless surveyed indicating that they accessed those programs in the previous 12 months. The two services were equally accessed by the sheltered and unsheltered populations.

One Step Forward…
February 28, 2012
Page xi
Despite the high level of usage of meal programs and soup kitchens, access to food was a problem for many homeless people. Approximately 45% of the homeless surveyed reported that they had not had a “good meal” in two days or more. Perhaps more importantly, people who were unsheltered were almost three times likely than the sheltered to say that they had not eaten a good meal in two days or more (70% versus 25%).
5. Barriers to Ending Homelessness
Low income and high rent were most frequently cited reasons for continuing homelessness. Almost everyone surveyed (98%), sheltered and unsheltered, would choose housing over homelessness. However, they most often reported not being able to do so because of low incomes or high rent. Fifty-eight percent (58%) of those surveyed said their income was too low, and 54% said rents were too high. For nearly one in three (32%), addiction was also an obstacle to securing housing.
One Step Forward… Results of the 2011 Metro Vancouver Homeless Count
The Greater Vancouver Regional Steering Committee on Homelessness
Page 1
1. INTRODUCTION
Since 2002, the Greater Vancouver Regional Steering Committee on Homelessness (RSCH) has conducted a regional Count every three years in an attempt to identify the number of people who are homeless in Metro Vancouver during a 24-hour period. The fourth Homeless Count in Metro Vancouver was conducted on March 15 and 16, 2011. The 24-hour point-in-time Count is a widely accepted methodology that includes an enumeration or survey2 to determine certain characteristics of the homeless population. 1.1 Who Was Counted?
The 2011 Count included people found homeless in the Metro Vancouver region and staying in emergency shelters, transition houses for women and children fleeing abuse, youth safe houses, hospitals, jails and addictions treatment facilities, on the streets, in parks or other outdoor locations, as well as those accessing services.
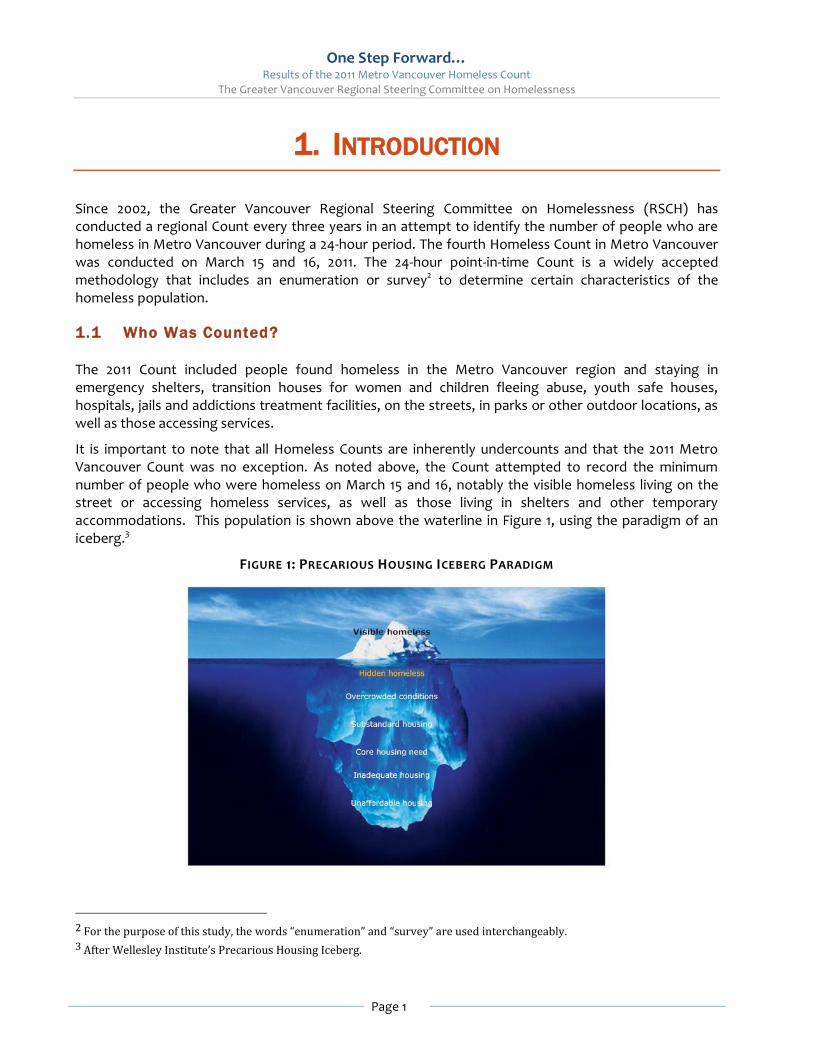
It is important to note that all Homeless Counts are inherently undercounts and that the 2011 Metro Vancouver Count was no exception. As noted above, the Count attempted to record the minimum number of people who were homeless on March 15 and 16, notably the visible homeless living on the street or accessing homeless services, as well as those living in shelters and other temporary accommodations. This population is shown above the waterline in Figure 1, using the paradigm of an iceberg.3
FIGURE 1: PRECARIOUS HOUSING ICEBERG PARADIGM
2 For the purpose of this study, the words “enumeration” and “survey” are used interchangeably. 3 After Wellesley Institute’s Precarious Housing Iceberg.
One Step Forward… Results of the 2011 Metro Vancouver Homeless Count
The Greater Vancouver Regional Steering Committee on Homelessness
Page 1
The post-Count community consultations identified the
following as reasons why people may have appeared to be
homeless when in fact they were not, or may have reported
that they paid rent when in fact they did not.
Access Food Banks. Some food banks require a person
to have an address in order to receive food. Some people
may come to an arrangement with a friend or family
member to access food banks and other services.
Stay in Short-term Recovery Homes. A number of
informal and unlicensed recovery homes for people with
addictions operate throughout the region. Some people
have reported abuses including paying a full month’s
shelter portion to the recovery house and being
subsequently evicted after one or two weeks.
Provide ‘Alternative’ Rent Payments. Some people,
particularly youth, may have an informal arrangement
such as buying groceries for the house or doing chores
instead of paying rent. Women may also go home with
men for a place to stay.
Live in Precarious Substandard Housing. Some
people approached may have had a place to stay but
preferred to stay elsewhere due to mental health issues,
bed bugs, being overcrowded, or felt that their
apartment is unsafe. Some people may spend all their
income on rent and access homeless services because
they have no way to pay for food. Some may stay in
illegal rooming houses, where month-to-month rent is
cheap for a small single room.
Fear of Losing Shelter Allowance. Some people may
not have had a place for which they paid rent but may
have been afraid of losing a shelter allowance if they
admitted the fact. Recipients of Income Assistance are
entitled to a shelter allowance that must go directly to
pay for shelter costs. In most cases this is $375 per
month.
1.2 Who Was Not Counted?
Despite efforts to count all those in shelters and the visible homeless, there were many people who could not be found on Count Day by Homeless Count Surveyors. For example, outreach workers could not contact all clients for a variety of reasons during the Count time frame. Community service providers also reported that some people purposely avoided Surveyors to remain undetected.
Besides these individuals, others were excluded from the Count for methodological reasons, as will be explained later in Chapter 2. These included individuals or families who, during the time of the Count, were at-risk of homelessness or precariously housed. Some of these individuals were encountered on Count Day and told Surveyors that they had a place where they paid rent.
Historically, the Count has not included a person as homeless if he or she pays rent for housing. As in previous Counts, the 2011 Count survey contained a screening question that asked respondents: Did you pay rent?” to distinguish those who were precariously housed from the absolute homeless. If the respondent answered ‘yes’, the Surveyor was instructed to end the survey. As a result of this approach, a total of 534 surveys were screened out of the total homelessness numbers in 2011. This means that Surveyors approached over 500 people believing that they were homeless – because they were using a soup kitchen or food bank. The high number of people who were screened out of the study in this manner draws attention to the need for additional research on the population that is at risk of homelessness.4 1.3 Report Outline
This report provides the final number of homeless people found across Metro Vancouver in March 2011 with comparison to results from the previous three Counts in 2002, 2005, and 2008.
Responses to the Count survey questions are aggregated, analyzed and reported along several
4 Another consideration would be to ask those who say “yes” to the rent screening question to complete a separate survey on risk of homelessness. This would allow the community to learn about the hidden homeless population at the same time as the visible homeless population.

One Step Forward… Results of the 2011 Metro Vancouver Homeless Count
The Greater Vancouver Regional Steering Committee on Homelessness
Page 2
dimensions, such as sheltered and unsheltered. The Count survey instruments are shown in Appendix 1 of this report.
The style, structure and content of the 2011 Count final report differs slightly from previous Count reports. Due to the change in homeless population trend in 2011, the newly introduced post-Count local consultations, and ongoing requests from community members to provide local context for the data, the 2011 report contains more regional context and explanation than previous counts. Although many of the tables are directly comparable to previous reports, refinements have been made to draw attention to the more significant results of the 2011 Count.
The following sets out the structure or Chapters in this report:
a) Methodology: Provides an overview of the approaches taken to Count the homeless in the region, including the design and implementation of those approaches. Partnerships created towards the implementation, such as with the Aboriginal Homelessness Steering Committee, Community Homelessness Tables, and Watari Hard Target Youth committee, are also discussed.
b) Regional Context: Provides context for the changes in the homeless population observed in 2011 relative to previous Counts. Specifically, it provides an overview of the specialized programs that emerged between 2008 and 2011.
c) Regional Homeless Population: Provides an overview of the total number and characteristics of homeless people found from a regional perspective.
d) Profile of Regional Homeless Population: Provides a breakdown of the surveyed homeless population according age, gender, ethnicity, sources of income, and similar characteristics. The numbers and proportions reported in this and subsequent Chapters of the report differ from those reported under items c) and h) because the basis of analysis was the surveyed homeless population rather than the total homeless population.
e) Health and Wellbeing: Explores the general wellbeing of the surveyed homeless population, including their health conditions, level of isolation and access to food.
f) Patterns of Service Use: Provides analyses of the types of community resources used by the homeless, the barriers that prevented them from securing stable housing and circumstances that could help end their homelessness.
g) Profiles of Special Populations: Discusses the characteristics of populations of interest, including people of Aboriginal ancestry, youth, women, families, seniors and new Canadians.
h) Municipal Homeless Population: Provides a broad overview of the number of homeless people found in Metro Vancouver’s communities. The information in the Chapter serves as a precursor to Volume 2 of the Count report to be released later with detailed profiles of homelessness in communities and among specific population groups.
`

One Step Forward… Results of the 2011 Metro Vancouver Homeless Count
The Greater Vancouver Regional Steering Committee on Homelessness
Page 3
2. METHODOLOGY
2.1 Introduction
Past Count reports placed the extensive description of the Count methodology in an Appendix as reference material and provided summaries in the body of the report. However, because of the revisions to the methodology detailed in this Chapter, the significant roles played by community groups in shaping both the design and implementation of the revisions, as well as the outcome of the Count, it was felt necessary to expand upon the Count methodology early in the report. 2.2 Overall Approach
The 2011 Metro Vancouver Homeless Count was a 24-hour snapshot intended to determine the minimum number of people who were homeless in the region from midnight on March 15 to midnight on March16. The 2011 Count window was comparable to 2008. Those who were sheltered were counted between 4:00pm and midnight on March 15 and included the survey or enumeration of individuals and families staying in shelters, transition houses, youth safe houses, as well as those who had no fixed address (NFA) temporarily staying in institutions such as hospitals and in the custody of law enforcement agencies. Those who were unsheltered were counted on March 16 from early in the morning to midnight. The primary survey or enumeration tools were the unsheltered or daytime survey and the sheltered or evening survey instruments. The surveys were reviewed multiple times and extensively pre-tested with people who were homeless prior to the Count.5 Both surveys contained enhanced screening questions to reduce duplication or double counting. The unsheltered survey contained an observation section where Surveyors could note the approximate age and gender of people who were suspected of being homeless but were not able to respond to the survey questions.6 The methodology used for the 2011 Homeless Count was largely based on previous Metro Vancouver Count methodologies, with the following key differences:
1. The 2008 screening questions in both the unsheltered and sheltered survey instruments were modified to reduce the risk of capturing people who should not be counted. The unsheltered survey instrument specifically asked: “Did you sleep in a shelter last night?”; and “Were you released from an emergency department, hospital, detoxification centre or jail after midnight last night?” New screening questions were also included in the shelter survey instrument. These questions were: “Will you be sleeping in a shelter tonight?”; “Have you already completed a shelter survey tonight?”; and “Do you have a place you pay rent for?”
5 The Unsheltered and Sheltered Surveys can be found in Appendix 1. 6 The “observed homeless” numbers were not included in the overall numbers because there was the possibility that they were counted elsewhere in the region during the 24 hour Count window.

One Step Forward… Results of the 2011 Metro Vancouver Homeless Count
The Greater Vancouver Regional Steering Committee on Homelessness
Page 4
2. Seven new questions were added to the both survey instruments to help determine service
needs. These questions were:
a. “What brought you to this city?” b. “If under 25, have you been affected by a change or withdrawal of services?” c. “Are you a newcomer to Canada?” d. “Do you need services in a language other than English?” e. “Are there any services that you have refused in the past 12 months?” f. “When was the last time you had a good meal?” and g. “What one thing would help end your homelessness?”
3. Surveyors were instructed not to wake up people who were sleeping for the purpose of
administering the unsheltered or daytime survey instrument, as waking up people was considered by the 2011 Count planners to be both disrespectful and dangerous.
4. Limited information on people with no fixed address (NFA) was collected in a coordinated
fashion for the first time. In previous years, those with no fixed address were not included in the Count because the screening procedure was not sufficiently robust to address the risk of double-counting.
5. A coordinator was hired to develop and implement a defined strategy to count homeless
youth who were acknowledged by the community to have been underreported in previous Counts. The strategy involved partnering with youth-serving agencies and outreach workers as well as the creation of youth hubs on Count Day. A targeted social media campaign was also developed as part of the implementation strategy.
6. Post-Count consultations were conducted with the Aboriginal Homelessness Steering
Committee (AHSC), Community Homelessness Tables (CHTs), City of Vancouver and Watari Hard Target group to gather community perspectives on the Count processes and results. The results of these consultations were included in this report as contextual information.
2.3 ‘Counted’ vs. ‘Surveyed’ Populations
As in previous Counts, there is an important distinction between the number of people “counted” as homeless and the number of people who were “surveyed” or “enumerated” as homeless. The former group is referred to in the report as the “total homeless” while the latter group is characterized as the “surveyed homeless.” The number of people who were counted as homeless includes the following:
1. people staying in emergency shelters, transition houses and youth safe houses; 2. people who were found on the street or other outdoor locations (such as drop-in centres,
bottle depots and food lineups, etc.); and 3. people with no fixed address found in health, correction and recovery facilities on the night of
March 15.
One Step Forward… Results of the 2011 Metro Vancouver Homeless Count
The Greater Vancouver Regional Steering Committee on Homelessness
Page 5
The “surveyed” homeless population includes all those who were counted as homeless as stated above, and also completed one of the two Count survey instruments on March 15 or 16. It should be noted that the number of people counted and the number of people surveyed or enumerated vary significantly between the sheltered and unsheltered populations. This is because not all clients in the shelters agreed to, or were available to be surveyed. As well, surveys were not administered to those with no fixed address counted in hospitals, jails, detoxification and recovery centres. In contrast, all people found homeless during the daytime were surveyed with the exception of those who were ‘observed’. As in previous Counts, the observed homeless found in unsheltered locations were not included in either the total or surveyed homeless population, as it could not be confirmed that they were homeless or had already been counted in a sheltered location or at another unsheltered location.
2.4 People with No Fixed Address
The 2011 Homeless Count was the first to comprehensively include people staying in temporary facilities with no fixed address to return to upon discharge. The facilities included jails, remand centres, hospitals, emergency rooms, detoxification beds, psychiatric units and similar service centres that housed people on a temporary basis. These individuals were counted in the facilities shown in Appendix 2, where they spent the evening of March 15. In addition to counting them, facility managers were asked to provide information about the age and gender of those counted. The unsheltered survey instrument contained a screening question to prevent the double-counting of anyone who was subsequently discharged from the facilities. 2.5 Coordinated Approach to Implementation
Since 2002, the implementation of the Metro Vancouver regional Homeless Count has become an increasingly collaborative process drawing on the strengths of many key stakeholders and partnerships. The RSCH delegated oversight of the 2011 Count to its Governance Working Group (GWG) which was in turn advised by a Core Technical Advisory group selected for their technical and research expertise. The Metro Vancouver Homelessness Secretariat, which provides administrative support to the RSCH, was directly responsible for managing the 2011 Homeless Count. The Secretariat provided assistance to the Count Consultant, OrgCode, and facilitated input by partners such as the Aboriginal Homelessness Steering Committee (AHSC), City of Vancouver, and local Community Homelessness Tables (CHTs). In 2011, as in previous counts, specific emphasis was placed on counting homeless youth and Aboriginal people. To this end, InFocus Consulting of Vancouver was engaged to guide the effort to identify and count homeless Aboriginal people. A special youth implementation plan was also piloted in 2011 in an attempt to address youth undercount issues.
One Step Forward… Results of the 2011 Metro Vancouver Homeless Count
The Greater Vancouver Regional Steering Committee on Homelessness
Page 6
2.5.1 Key Partnerships
The Aboriginal Homelessness Steering Committee (AHSC)
The Aboriginal Homelessness Steering Committee (AHSC), the sister-agency to the Regional Steering Committee on Homelessness, provided key direction throughout the 2011 Homeless Count –– from input in the design of the survey instruments to media releases and consultations for the purpose of identifying key contextual pieces for this report. As well, many AHSC member agencies participated in the Count in various capacities. Historically, the regional Homeless Count has recognized the ongoing need for cultural sensitivity in its approach and implementation. Accordingly, on the recommendation of the AHSC, InFocus Consulting was engaged as an Aboriginal consultant to work with Aboriginal service providers to identify locations where homeless Aboriginal people would be found, recruit Aboriginal volunteers to administer the survey instruments to Aboriginal people, and engage Aboriginal homeless-serving agencies throughout the region. It is important to note that InFocus Consulting has been part of the regional Count process since 2005, and that all Aboriginal count activities occurred within the framework of the overall Count implementation plan.
Community Homelessness Tables (CHTs) & City of Vancouver
Nine Community Homelessness Tables (CHTs)7 and the City of Vancouver played key leadership roles in the Count implementation process. Local Count Coordinators were identified at each CHT to map survey locations for Count Day and assist in recruiting volunteers. Local Count Coordinators also participated in a half-day, pre-Count planning session on March 11 where they received materials required for Count Day. The materials included volunteer maps with designated areas and boundaries for each group of volunteer Surveyors. Local Coordinators also organized, directed and supported volunteers on the ground on Count Day and reported directly to the Count Consultant. As the City of Vancouver does not have a Community Homelessness Table (CHT), the City requested that its staff should play the role of a CHT and assume responsibility for recruiting and coordinating volunteers for the Vancouver portion of the Count. This request was in keeping with the lead role City staff played in previous Counts –– coordinating the Vancouver portion of the Count. The City’s request was granted by the Governance Working Group in order to maintain consistency with previous Count procedures and strengthen the partnership between the RSCH and the City. Accordingly, City staff recruited volunteers, mapped locations of where homeless people would be found, organized area-stations or hubs, and assigned volunteers on Count Day. Volunteer training venues were also secured by City staff, although all volunteer training sessions were conducted by the Count Consultant. A local coordinator was engaged to coordinate the Count process in all Vancouver shelters, and on Count Day key City staff provided progress reports directly to the Count Consultant.
7 These included: Burnaby Homelessness Task Force, New Westminster Homelessness Coalition, Surrey Housing and Homelessness Task Force, Tri-Cities Homelessness Task Force, North Shore Homelessness Task Force, Richmond Homelessness Coalition, Delta Homelessness Task Group, Langley Homelessness Task Force, and the Maple Ridge Homelessness Task Force.

One Step Forward… Results of the 2011 Metro Vancouver Homeless Count
The Greater Vancouver Regional Steering Committee on Homelessness
Page 7
Watari Youth Hard Target
Watari Hard Target, a regionally represented body of youth outreach workers, was identified as a key partner for the pilot process to count homeless youth through the 2011 Youth Implementation Strategy. The Youth Implementation Strategy was developed and coordinated by a contracted Youth Coordinator. The strategy included the set up of youth hubs in partnership with youth-serving organizations across the region. The strategy was coordinated with not only the overall Count process, but also was closely aligned with the implementation of the Aboriginal strategy by InFocus Consulting, as well as the efforts of the Community Homelessness Tables and the City of Vancouver.
Local Health and Police Authorit ies
Health region officials reported gender and age information for homeless people who were staying in various health facilities overnight on March 15. The same information was provided by the RCMP and five independent police forces across the region. 2.5.2 Volunteer Recruitment & Training
A total of 515 volunteers were recruited to complete the 2011 Count.8 Volunteers included individuals with lived experience, students, police officers, staff from all levels of government, members of the faith community, politicians, and the general public. Volunteers outside the City of Vancouver were recruited through networking by the local community coordinators, a regional advertising campaign, posters, email, and word of mouth. The City of Vancouver focused its volunteer recruitment effort on people with past Count experience or direct experience with people who are homeless. These people were reached through the same person to person registration process employed by the City in previous counts. All volunteers were asked to attend a mandatory 90-minute training session focused primarily on how to administer the Count survey instruments. Volunteers also received safety instructions and contact information for local community coordinators, the Metro Vancouver command centre, and other emergency numbers. 2.5.3 Count Day Procedures
The Count Consultant provided general oversight of Count Day activities across the region from a command centre at the offices of Metro Vancouver.9 Local community command centres dispatched volunteer Surveyors throughout the region and kept in contact with them by phone from 4:00pm on March 15 through to midnight on March 16. The Count window closed shortly after midnight when all volunteers were accounted for and the closure of all local community command centres was confirmed.
8 There were more than 75 people working alongside the 515 volunteers “on the ground,” including professional outreach workers, local community coordinators, Metro Vancouver regional staff, and municipal staff. 9 Head office is located at 4330 Kingsway, Burnaby.
One Step Forward… Results of the 2011 Metro Vancouver Homeless Count
The Greater Vancouver Regional Steering Committee on Homelessness
Page 8
Sheltered Component
The overnight component of the Count on March 15 attempted to survey all individuals staying at emergency shelters, transition houses and safe houses on the evening of March 15. Greater Vancouver Shelter Strategy (GVSS)10 members were consulted on how best to conduct interviews in shelters. There were four approaches used to gather anonymous information about the sheltered homeless population:
1. Shelter staff conducted the survey and completed a shelter statistics form during the designated Count window;
2. Volunteer Surveyors administered the survey instrument at a time specified by the shelter
during the designated Count window (volunteers were not sent to transition houses and youth safe houses);
3. BC Housing provided aggregate data for shelters that receive provincial funding; and
4. Vancouver Coastal Health Authority, Fraser Health Authority, RCMP and five independent
police forces reported gender and age information for people with no fixed address staying in various health and correctional facilities overnight on March 15.
It is noted that on the evening of March 15, there was a significant amount of rainfall (17.4mm) in some parts of the region. Some Count observers believe the rainfall might have forced some unsheltered homeless from their usual outdoor sleeping locations.
Unsheltered (Street/Service) Component
The effort to count the unsheltered homeless focused primarily on finding people in public areas or locations where the homeless were known to congregate. These places included streets, doorways, alleys, wooded areas, parks, as well as service centres where food, housing, income and medical assistance were provided. The implemetation of this “known location” approach was only possible because of the assistance provided by professional outreach workers who collaborated with local community coordinators to identify and map locations where homeless people were likely be found on March 16. The mapping exercise was key to determining the number of volunteers needed for the Count. In each of the local communities on Count Day, volunteers were briefed by the local community coordinators before being dispatched to their assigned survey areas. The volunteers were equipped with maps and detailed descriptions of their assigned survey areas. The volunteers administered the survey instrument in teams of two or more and on shifts that lasted anywhere from two to four hours. Most communities launched their Count exercise by dispatching volunteers at dawn on March 16. Areas that were considered difficult to reach by regular volunteers or where the hard to house were thought to be located were assigned to professional outreach workers.
10 The GVSS is a regional network of shelter providers and includes representatives of all levels of government and other organizations that strive to meet the needs of people who are homeless or at risk of homelessness.

One Step Forward… Results of the 2011 Metro Vancouver Homeless Count
The Greater Vancouver Regional Steering Committee on Homelessness
Page 9
The late winter weather conditions for the Count during the daytime on March 16 were ideal for the Surveyors. The daytime high was 10.5 degrees Celsius, with very light winds and precipitation was limited to less than two millimeters in a few Metro Vancouver municipalities. 2.5.4 Post-Count Community Consultations
As indicated above, the Count Consultant met with the Count implementation partners throughout the region to seek community input in the preparation of the final Count report. This consultation process enhanced the quality of this report by matching community expertise and local knowledge with Count data. 2.6 Study Limitations
The following are some of the known limitations of the 2011 Homeless Count.
Methodology
Although the Count methodology outlined above is a recognized approach to identifying people who are homeless during a limited period of time, the approach inherently precludes the identification of all people who are homeless during the period. The 24-hour snapshot best captures the minimum number of homeless people, especially those who are staying in shelters, transition houses, and youth safe houses and those who are visibly homeless on the street or accessing homeless services over a 24-hour period. It is not designed to capture the ‘hidden homeless’ or those who tend to stay temporarily with friends and family and avoid services. Although the pilot youth implementation strategy was successful overall, it was felt more time was needed to organize more youth hubs across the region. A longer planning timeframe would also have allowed for the inclusion of highly marginalized youth, including Aboriginal and LGBT youth. Changing Location Patterns
Rain in several municipalities on the evening of March 15 meant that many people who were homeless could not be found in their usual outdoor sleeping locations. As well, locations where homeless Aboriginal people were known to be staying in previous Counts had changed dramatically in Surrey. Development along the Fraser River had resulted in deeper entrenchment of people in surrounding woods where they could not be found by Count volunteers. Local outreach teams in several municipalities also noted that known 'camp' locations in wooded areas had been deserted on Count Day. Lower Response Rates in Shelters
The response rate to the sheltered survey instrument was lower in 2011 than in previous Counts. Of the 1,824 adults and unaccopanied youth who stayed in shelters, transition houses and youth safe

One Step Forward… Results of the 2011 Metro Vancouver Homeless Count
The Greater Vancouver Regional Steering Committee on Homelessness
Page 10
houses on the evening of March 15, only 934 or 51% were surveyed.11 In contrast, 84% (849 of 1,006) of those staying in shelters during the 2008 Count were surveyed, while 86% (952 of 1,105) of the sheltered population was surveyed in 2005.
11 Major reasons included lack of availability and refusal of Surveyors’ requests to be interviewed.
One Step Forward… Results of the 2011 Metro Vancouver Homeless Count
The Greater Vancouver Regional Steering Committee on Homelessness
Page 11
3. REGIONAL CONTEXT
3.1 Introduction
This Chapter of the report discusses the context in which the 2011 Homeless Count took place. The context statement is particularly useful in light of the results of the Count reported and the apparent changes in the profile of the homeless population compared to previous Counts. While the Count research was not designed to identify correlations between the regional context and the results of the Count, the context nevertheless allows readers to draw their own conclusions or seek further explanation. The focus of this regional context statement reflects the direction of programming for the homeless that occurred in the region between 2008 and 2011. 3.2 Changes in Program Direction
Between the 2008 and 2011 Homeless Counts, the region made significant progress in housing homeless people. Records suggest that approximately 13,000 people were housed through federal and provincial programs during the period. These included the following:
1. Approximately 290 people housed through the At Home/Chez Soi Project, Mental Health Commission of Canada;
2. 6,550 people placed in housing by BC Housing through the Emergency Shelter Program;
3. 3,550 people placed in housing by BC Housing through the Homeless Outreach and Aboriginal
Homeless Outreach Programs; and
4. 2,338 people placed by the Ministry of Social Development through the Homelessness Integration Program (HIP).
In addition, there were shifts in programs’ focus between 2008 and 2011. “Housing First” and case management approaches were adopted to match programs and services with clients’ distinct and changing needs.12 As the homeless population in the region became increasingly diverse and complex, the Housing First and case management models were identified as best practices in housing people who were previously homeless and struggling with often very complex mental health and addiction issues. BC Housing made over 10,000 housing placements in the region between 2008 and 2011. The Province also purchased 871 new Single Room Occupancy (SRO) housing units during the period, bringing the
12 ‘Housing first’ focuses on rapidly housing someone who is homeless and following up with the necessary long or short term services to prevent homelessness from reoccurring using a case management approach to best address the individual’s needs.
One Step Forward… Results of the 2011 Metro Vancouver Homeless Count
The Greater Vancouver Regional Steering Committee on Homelessness
Page 12
region’s complement of SRO units to 1,500.13 In addition to the SROs, 2,100 supportive housing units were developed through Memoranda of Understanding (MOU) between Metro Vancouver municipalities and BC Housing, with some units becoming operational during the three year period.14 As noted earlier, approximately 2,338 people were placed through the Ministry of Social Development’s Homelessness Integration Program (HIP) between March 2009 and December 2010. Of these, 2,005 people in Vancouver were placed in SROs, market housing or subsidized housing and 383 people in Surrey were placed in SROs. Among the people placed through HIP in Vancouver, 51% were considered chronically or likely “chronically homeless,” with mental health and/or addiction issues.15 In Surrey, 216 people or 56% of the people housed in SROs were considered chronically homeless. The majority of people placed through the HIP project — 85% in Vancouver and 86% in Surrey — were also aligned with Income Assistance. Aligning more people who are homeless with Income Assistance has been a targeted initiative of the provincial government’s HIP program. Income Assistance plays a significant role in exiting homelessness; if a person is already on Income Assistance when housing is located, it is easier to secure the housing with an additional shelter allowance. Having an income while homeless also decreases the need to seek income through other means. Non-profit service providers and the Health Authorities (Vancouver Coastal and Fraser) also continued to provide outreach and individual case management services to people struggling with housing, mental health and addictions, building on best practice and years of experience. With respect to regional trends, it should be noted that a large majority of the sheltered homeless population in the Metro Vancouver region was located in the City of Vancouver; therefore, significant changes in the City of Vancouver’s homeless population created regional impacts. Two key program changes occurred in the City of Vancouver that impacted the most visible homeless population since 2008. These changes were the addition of a low-barrier shelter program, including an Aboriginal-run low barrier shelter, and a “housing first” pilot project targeting individuals with mental health and addictions. While new shelter beds emerged throughout the region between 2008 and 2011, the partnership between the City of Vancouver and BC Housing to develop and operate low-barrier shelters (HEAT and Temporary Winter shelters) most impacted the number of sheltered hoomeless people counted in 2011. The HEAT and temporary Winter Response shelters provided unique opportunities to connect people who did not access traditional shelters, connecting a new population of homeless with significant barriers to housing with food and nutrition, outreach and other services. The Aboriginal community attributed better housing linkages and lower numbers of Aboriginal homeless to the first Aboriginal-run shelter at 201 Central in Vancouver.
13 An SRO is a single resident occupancy unit that is usually part of a multiple unit property comprised of single room dwelling units. Each unit is for occupancy by a single eligible individual. 14
Supportive services assist formerly homeless persons to successful living in housing and are provided during the transition from the streets or shelters into permanent or permanent supportive housing. 15
A person who has been homeless for one year or more or who has experienced four or more episodes of homelessness
in the past three years is considered “chronically homeless.”

One Step Forward… Results of the 2011 Metro Vancouver Homeless Count
The Greater Vancouver Regional Steering Committee on Homelessness
Page 13
The Mental Health Commission of Canada’s At Home/Chez Soi project directly housed some of the most visible and vulnerable people who were homeless in Vancouver since the 2008 count. The pilot project, due to end in 2013, is evaluating approaches to supporting people with mental health and addiction barriers to remain in housing. In the City of Vancouver, it is uncertain whether participants will remain housed and receive the support levels required to prevent the reoccurrence of homelessness once the At Home/Chez Soi project ends in 2013. Many low-barrier shelters, including the Aboriginal 201 Central HEAT shelter, are also scheduled to close over the next two years with the opening of more supportive housing units under the MOU with BC Housing. Four temporary Winter Response Vancouver shelters (Cardero, Howe, Broadway & Kitsalano) included in the 2011 Count closed in April 2011. As noted in Section 1.2, the 2011 Count research incidentally noted that many people approached as visibly homeless on March 16 were rather precariously housed; people who were struggling to stay housed in substandard, unsafe or unaffordable housing conditions. The precariously housed and “at risk” of homeless populations were consistently mentioned as an increasing population in the region during consultations with the Community Homelessness Tables (CHTs), warranting research beyond the scope of this report. In summary, Metro Vancouver homeless trends between 2008 and 2011 were influenced by several key initiatives in the region, primarily in the City of Vancouver. Overall, more than 10,000 people were placed in housing between the 2008 and 2011 counts. “Housing First” programs for people with mental health and addictions issues, new shelter and supportive housing units, integrated housing and service outreach programs, and emphasis on aligning people with Income Assistance contributed to the results of the 2011 Homeless Count. Without these collective efforts, the regional homelessness numbers would present quite differently.
One Step Forward… Results of the 2011 Metro Vancouver Homeless Count
The Greater Vancouver Regional Steering Committee on Homelessness
Page 14
4. REGIONAL HOMELESS POPULATION
4.1 Introduction
This Chapter of the report provides a general overview of the results of the 2011 Homeless Count from a regional perspective. Specifically, it looks at the changes in the regional homeless population across the sheltered and unsheltered (street/service) populations. The age and gender distributions are also examined to provide a baseline for further analysis later in the report. 4.2 Total Homeless
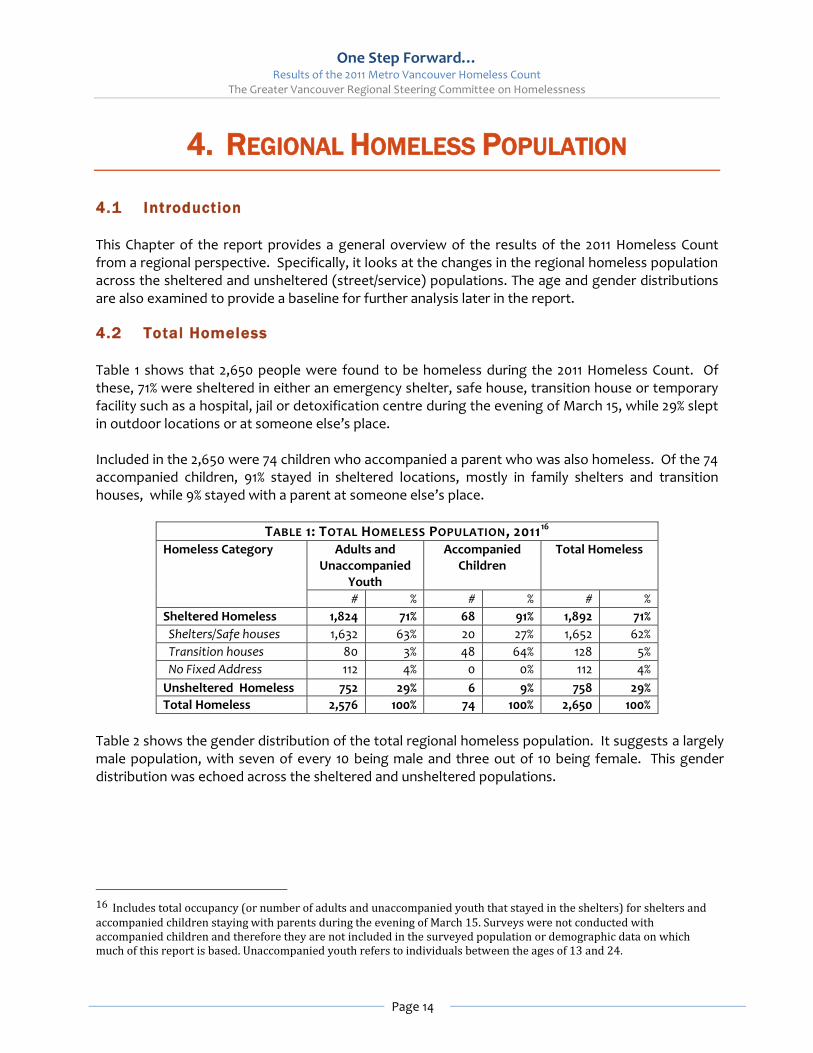
Table 1 shows that 2,650 people were found to be homeless during the 2011 Homeless Count. Of these, 71% were sheltered in either an emergency shelter, safe house, transition house or temporary facility such as a hospital, jail or detoxification centre during the evening of March 15, while 29% slept in outdoor locations or at someone else’s place. Included in the 2,650 were 74 children who accompanied a parent who was also homeless. Of the 74 accompanied children, 91% stayed in sheltered locations, mostly in family shelters and transition houses, while 9% stayed with a parent at someone else’s place.
TABLE 1: TOTAL HOMELESS POPULATION, 201116
Homeless Category Adults and Unaccompanied
Youth
Accompanied Children
Total Homeless
# % # % # %
Sheltered Homeless 1,824 71% 68 91% 1,892 71%
Shelters/Safe houses 1,632 63% 20 27% 1,652 62%
Transition houses 80 3% 48 64% 128 5%
No Fixed Address 112 4% 0 0% 112 4%
Unsheltered Homeless 752 29% 6 9% 758 29%
Total Homeless 2,576 100% 74 100% 2,650 100%
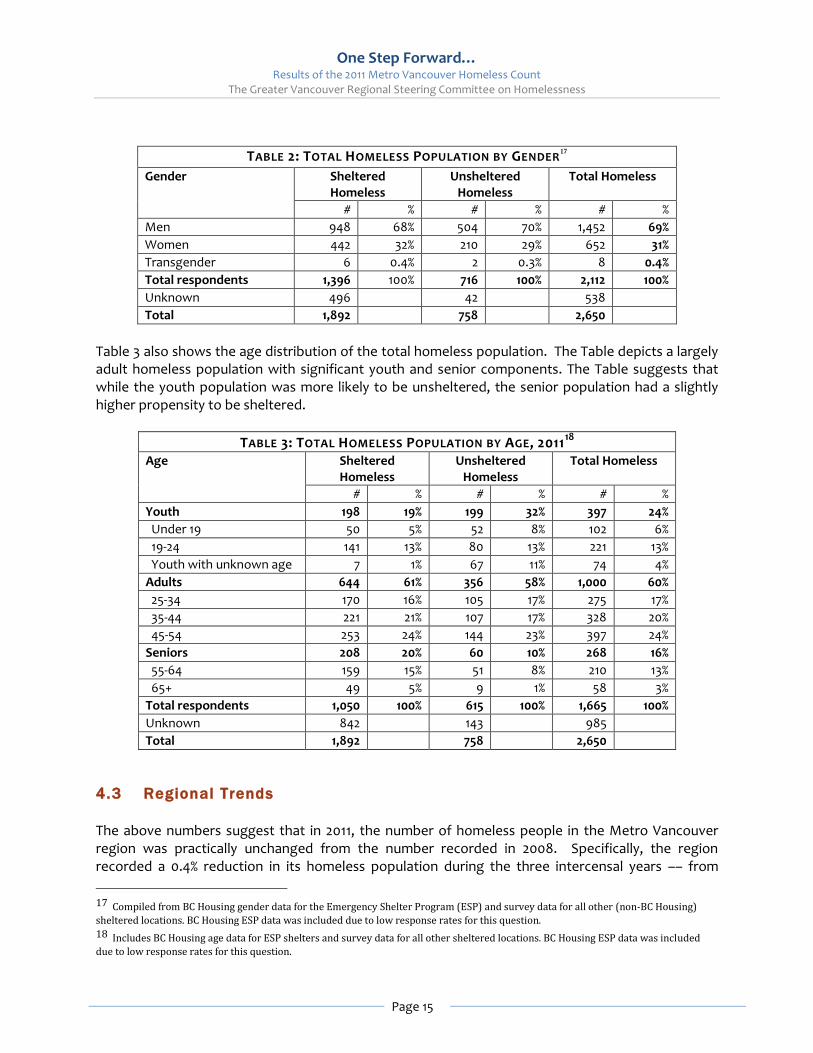
Table 2 shows the gender distribution of the total regional homeless population. It suggests a largely male population, with seven of every 10 being male and three out of 10 being female. This gender distribution was echoed across the sheltered and unsheltered populations.
16 Includes total occupancy (or number of adults and unaccompanied youth that stayed in the shelters) for shelters and accompanied children staying with parents during the evening of March 15. Surveys were not conducted with accompanied children and therefore they are not included in the surveyed population or demographic data on which much of this report is based. Unaccompanied youth refers to individuals between the ages of 13 and 24.
One Step Forward… Results of the 2011 Metro Vancouver Homeless Count
The Greater Vancouver Regional Steering Committee on Homelessness
Page 15
TABLE 2: TOTAL HOMELESS POPULATION BY GENDER17
Gender Sheltered Homeless
Unsheltered Homeless
Total Homeless
# % # % # %
Men 948 68% 504 70% 1,452 69%
Women 442 32% 210 29% 652 31%
Transgender 6 0.4% 2 0.3% 8 0.4%
Total respondents 1,396 100% 716 100% 2,112 100%
Unknown 496 42 538
Total 1,892 758 2,650
Table 3 also shows the age distribution of the total homeless population. The Table depicts a largely adult homeless population with significant youth and senior components. The Table suggests that while the youth population was more likely to be unsheltered, the senior population had a slightly higher propensity to be sheltered.
TABLE 3: TOTAL HOMELESS POPULATION BY AGE, 201118
Age Sheltered Homeless
Unsheltered Homeless
Total Homeless
# % # % # %
Youth 198 19% 199 32% 397 24%
Under 19 50 5% 52 8% 102 6%
19-24 141 13% 80 13% 221 13%
Youth with unknown age 7 1% 67 11% 74 4%
Adults 644 61% 356 58% 1,000 60%
25-34 170 16% 105 17% 275 17%
35-44 221 21% 107 17% 328 20%
45-54 253 24% 144 23% 397 24%
Seniors 208 20% 60 10% 268 16%
55-64 159 15% 51 8% 210 13%
65+ 49 5% 9 1% 58 3%
Total respondents 1,050 100% 615 100% 1,665 100%
Unknown 842 143 985
Total 1,892 758 2,650
4.3 Regional Trends
The above numbers suggest that in 2011, the number of homeless people in the Metro Vancouver region was practically unchanged from the number recorded in 2008. Specifically, the region recorded a 0.4% reduction in its homeless population during the three intercensal years –– from
17 Compiled from BC Housing gender data for the Emergency Shelter Program (ESP) and survey data for all other (non-BC Housing)
sheltered locations. BC Housing ESP data was included due to low response rates for this question. 18 Includes BC Housing age data for ESP shelters and survey data for all other sheltered locations. BC Housing ESP data was included
due to low response rates for this question.
One Step Forward… Results of the 2011 Metro Vancouver Homeless Count
The Greater Vancouver Regional Steering Committee on Homelessness
Page 16
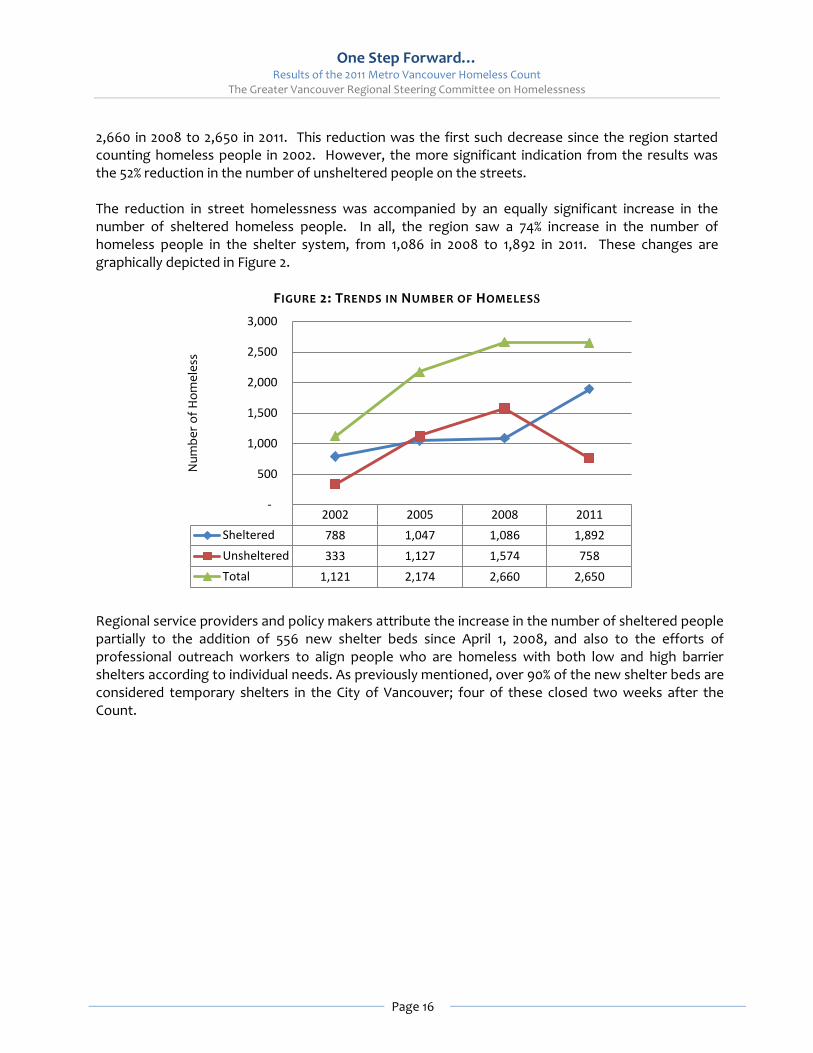
2,660 in 2008 to 2,650 in 2011. This reduction was the first such decrease since the region started counting homeless people in 2002. However, the more significant indication from the results was the 52% reduction in the number of unsheltered people on the streets. The reduction in street homelessness was accompanied by an equally significant increase in the number of sheltered homeless people. In all, the region saw a 74% increase in the number of homeless people in the shelter system, from 1,086 in 2008 to 1,892 in 2011. These changes are graphically depicted in Figure 2.
FIGURE 2: TRENDS IN NUMBER OF HOMELESS
Regional service providers and policy makers attribute the increase in the number of sheltered people partially to the addition of 556 new shelter beds since April 1, 2008, and also to the efforts of professional outreach workers to align people who are homeless with both low and high barrier shelters according to individual needs. As previously mentioned, over 90% of the new shelter beds are considered temporary shelters in the City of Vancouver; four of these closed two weeks after the Count.
2002 2005 2008 2011
Sheltered 788 1,047 1,086 1,892
Unsheltered 333 1,127 1,574 758
Total 1,121 2,174 2,660 2,650
-
500
1,000
1,500
2,000
2,500
3,000
Nu
mb
er
of
Ho
me
less

One Step Forward… Results of the 2011 Metro Vancouver Homeless Count
The Greater Vancouver Regional Steering Committee on Homelessness
Page 17
5. PROFILE OF REGIONAL HOMELESS POPULATION
5.1 Introduction
This Chapter of the report presents a profile of the homeless population that was surveyed on March 15 and 16. This analysis offers an insight into the demographic characteristics of the homeless population, including gender, age, ethnicity, sources of income, among other characteristics. The analysis flows primarily from the responses that those were surveyed gave in response to the following questions:
1. How old are you?19 2. What ethnic or cultural group do you identify yourself with? 3. Are you a newcomer to Canada? 4. Where do you get your money from?
Variations in responses between the sheltered and unsheltered populations are also provided where they are significant. As well, significant trends over the four Homeless Counts are noted. It should be stressed that this Chapter and the balance of this report are based on the information obtained from those who agreed or were found and available to be interviewed by Count Surveyors on March 15 and 16. The surveyed population comprised 1,686 of the 2,650 people found homeless on Count Day (64%), and included 752 of those who were unsheltered and 934 of those who were sheltered. 5.2 Gender
Table 4 shows that as was seen in Chapter 4, men were overrepresented in the surveyed homeless population, accounting for nearly seven out of every 10 homeless people. This distribution generally suggests that the surveyed homeless population was not significantly different from the total homeless population.
TABLE 4: GENDER COMPARISON, 2002-201120
Gender Surveyed Homeless 2002
Surveyed Homeless 2005
Surveyed Homeless 2008
Surveyed Homeless 2011
# % # % # % # %
Men 700 68% 1,483 73% 1,679 72% 1,146 70%
Women 333 32% 534 26% 619 27% 489 30%
Transgendered - - 9 0.40% 22 1% 2 0.1%
Total respondents 1,033 100% 2,026 100% 2,320 100% 1,637 100%
Unknown 17 31 89 49
Total 1,050 2,057 2,409 1,686
19
This question was posed in both the unsheltered and sheltered surveys and was recorded for those with No Fixed Address. 20 Totals for all years are calculated based on number of surveys.
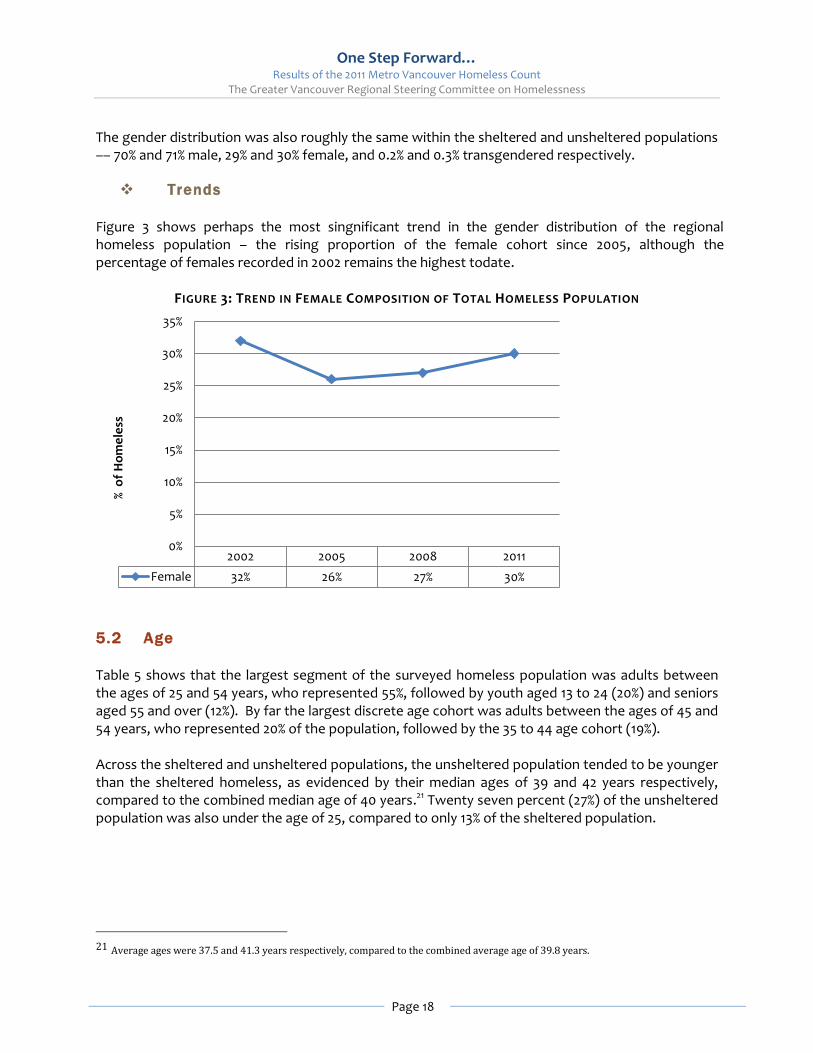
One Step Forward… Results of the 2011 Metro Vancouver Homeless Count
The Greater Vancouver Regional Steering Committee on Homelessness
Page 18
The gender distribution was also roughly the same within the sheltered and unsheltered populations –– 70% and 71% male, 29% and 30% female, and 0.2% and 0.3% transgendered respectively.
Trends
Figure 3 shows perhaps the most singnificant trend in the gender distribution of the regional homeless population – the rising proportion of the female cohort since 2005, although the percentage of females recorded in 2002 remains the highest todate.
FIGURE 3: TREND IN FEMALE COMPOSITION OF TOTAL HOMELESS POPULATION
5.2 Age
Table 5 shows that the largest segment of the surveyed homeless population was adults between the ages of 25 and 54 years, who represented 55%, followed by youth aged 13 to 24 (20%) and seniors aged 55 and over (12%). By far the largest discrete age cohort was adults between the ages of 45 and 54 years, who represented 20% of the population, followed by the 35 to 44 age cohort (19%). Across the sheltered and unsheltered populations, the unsheltered population tended to be younger than the sheltered homeless, as evidenced by their median ages of 39 and 42 years respectively, compared to the combined median age of 40 years.21 Twenty seven percent (27%) of the unsheltered population was also under the age of 25, compared to only 13% of the sheltered population.
21 Average ages were 37.5 and 41.3 years respectively, compared to the combined average age of 39.8 years.
2002 2005 2008 2011
Female 32% 26% 27% 30%
0%
5%
10%
15%
20%
25%
30%
35%
% o
f H
om
ele
ss

One Step Forward… Results of the 2011 Metro Vancouver Homeless Count
The Greater Vancouver Regional Steering Committee on Homelessness
Page 19
TABLE 5: AGE DISTRIBUTION
Age Sheltered Homeless
Unsheltered Homeless
Surveyed Homeless
# % # % # %
Youth 122 13% 199 27% 321 20%
Under 19 19 2% 52 7% 71 4%
19-24 91 10% 80 11% 171 10%
Youth with unknown age
12 1% 67 9% 79 5%
Adults 546 60% 356 49% 902 55%
25-34 151 17% 105 14% 256 16%
35-44 208 23% 107 15% 315 19%
45-54 187 21% 144 20% 331 20%
Seniors 141 15% 60 8% 201 12%
55-64 105 12% 51 7% 156 10%
65+ 36 4% 9 1% 45 3%
Adults with unknown age 103 11% 111 15% 214 13%
Total respondents 912 100% 726 100% 1,638 100%
Unknown 22 26 48
Total 934 752 1,686
Trends
Notable trends in the age distribution of the homeless population between 2002 and 2011 include a 5% increase in the youth population between 2008 and 2011, from 15% to 20% of the surveyed population; and the emergence of the 45 to 54 year old cohort as the largest segment of the homeless population, surpassing the 35 to 44 cohort, which was the largest in 2008 (see Figure 4 below).
FIGURE 4: TRENDS IN YOUTH, ADULT AND SENIOR POPULATIONS
15% 15% 20%
76% 76% 68%
9% 9% 12% 0%
10%
20%
30%
40%
50%
60%
70%
80%
2005 2008 2011
% o
f H
om
eles
s
Count Years
Youth
Adults
Seniors
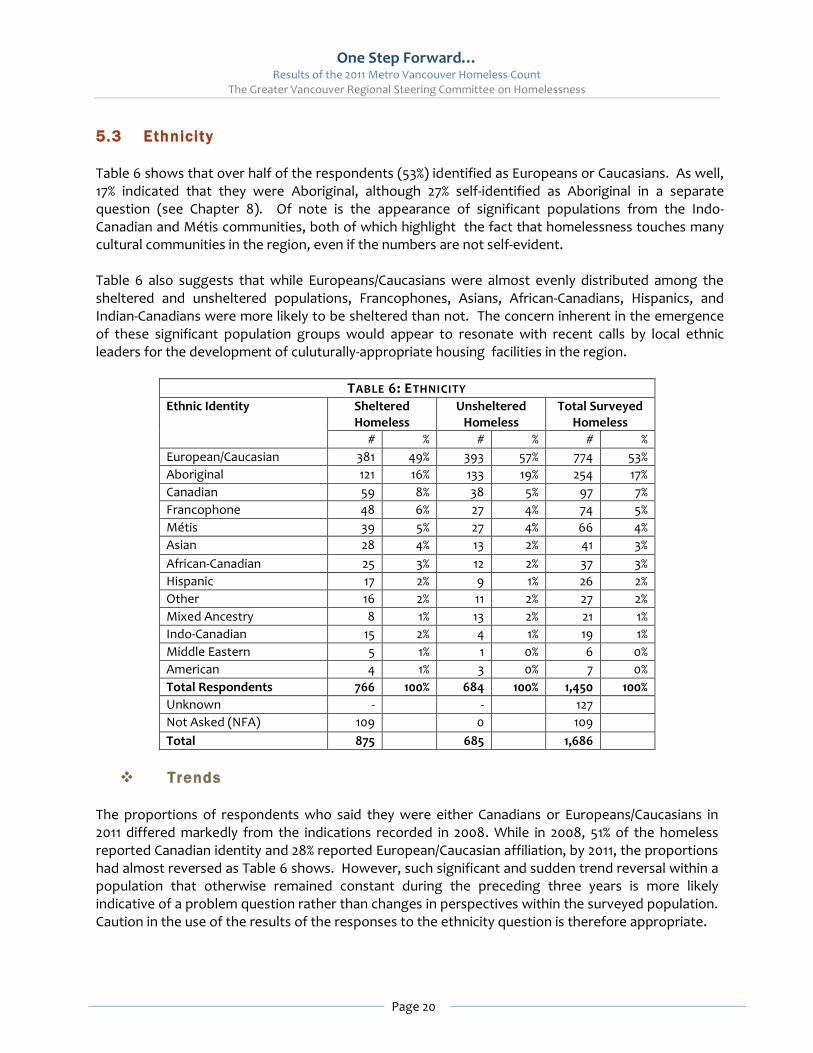
One Step Forward… Results of the 2011 Metro Vancouver Homeless Count
The Greater Vancouver Regional Steering Committee on Homelessness
Page 20
5.3 Ethnicity
Table 6 shows that over half of the respondents (53%) identified as Europeans or Caucasians. As well, 17% indicated that they were Aboriginal, although 27% self-identified as Aboriginal in a separate question (see Chapter 8). Of note is the appearance of significant populations from the Indo-Canadian and Métis communities, both of which highlight the fact that homelessness touches many cultural communities in the region, even if the numbers are not self-evident. Table 6 also suggests that while Europeans/Caucasians were almost evenly distributed among the sheltered and unsheltered populations, Francophones, Asians, African-Canadians, Hispanics, and Indian-Canadians were more likely to be sheltered than not. The concern inherent in the emergence of these significant population groups would appear to resonate with recent calls by local ethnic leaders for the development of culuturally-appropriate housing facilities in the region.
TABLE 6: ETHNICITY
Ethnic Identity Sheltered Homeless
Unsheltered Homeless
Total Surveyed Homeless
# % # % # %
European/Caucasian 381 49% 393 57% 774 53%
Aboriginal 121 16% 133 19% 254 17%
Canadian 59 8% 38 5% 97 7%
Francophone 48 6% 27 4% 74 5%
Métis 39 5% 27 4% 66 4%
Asian 28 4% 13 2% 41 3%
African-Canadian 25 3% 12 2% 37 3%
Hispanic 17 2% 9 1% 26 2%
Other 16 2% 11 2% 27 2%
Mixed Ancestry 8 1% 13 2% 21 1%
Indo-Canadian 15 2% 4 1% 19 1%
Middle Eastern 5 1% 1 0% 6 0%
American 4 1% 3 0% 7 0%
Total Respondents 766 100% 684 100% 1,450 100%
Unknown - - 127
Not Asked (NFA) 109 0 109
Total 875 685 1,686
Trends
The proportions of respondents who said they were either Canadians or Europeans/Caucasians in 2011 differed markedly from the indications recorded in 2008. While in 2008, 51% of the homeless reported Canadian identity and 28% reported European/Caucasian affiliation, by 2011, the proportions had almost reversed as Table 6 shows. However, such significant and sudden trend reversal within a population that otherwise remained constant during the preceding three years is more likely indicative of a problem question rather than changes in perspectives within the surveyed population. Caution in the use of the results of the responses to the ethnicity question is therefore appropriate.
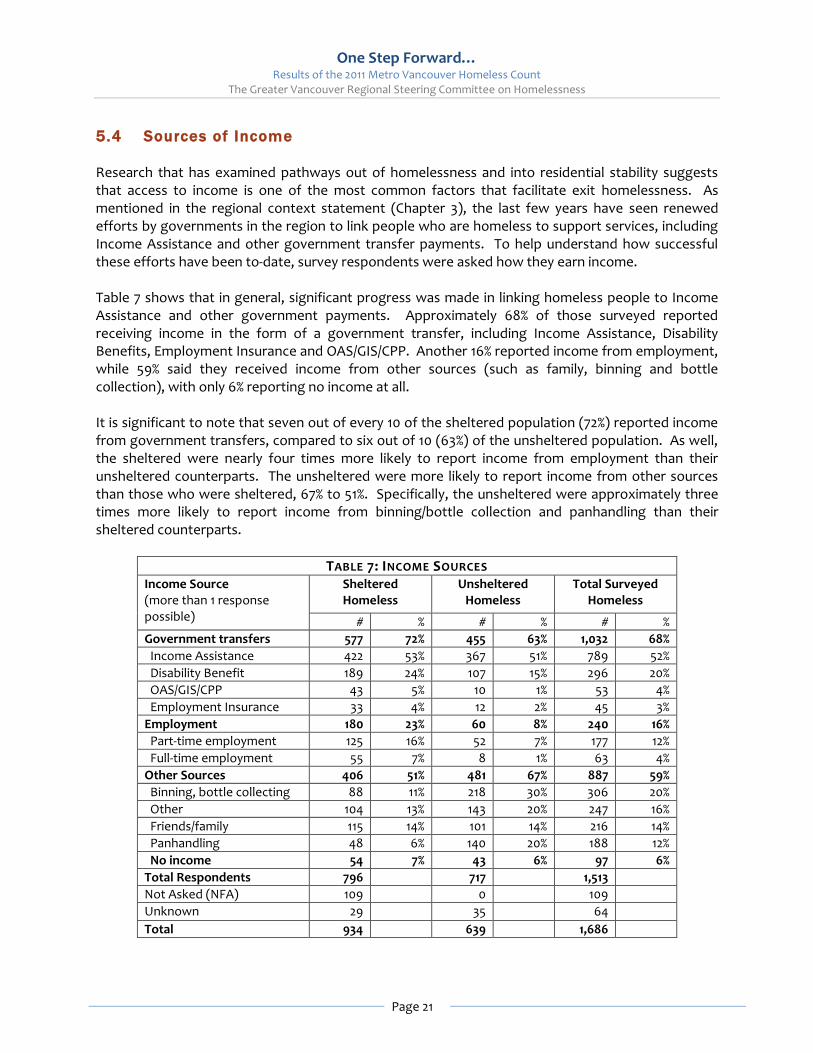
One Step Forward… Results of the 2011 Metro Vancouver Homeless Count
The Greater Vancouver Regional Steering Committee on Homelessness
Page 21
5.4 Sources of Income
Research that has examined pathways out of homelessness and into residential stability suggests that access to income is one of the most common factors that facilitate exit homelessness. As mentioned in the regional context statement (Chapter 3), the last few years have seen renewed efforts by governments in the region to link people who are homeless to support services, including Income Assistance and other government transfer payments. To help understand how successful these efforts have been to-date, survey respondents were asked how they earn income. Table 7 shows that in general, significant progress was made in linking homeless people to Income Assistance and other government payments. Approximately 68% of those surveyed reported receiving income in the form of a government transfer, including Income Assistance, Disability Benefits, Employment Insurance and OAS/GIS/CPP. Another 16% reported income from employment, while 59% said they received income from other sources (such as family, binning and bottle collection), with only 6% reporting no income at all. It is significant to note that seven out of every 10 of the sheltered population (72%) reported income from government transfers, compared to six out of 10 (63%) of the unsheltered population. As well, the sheltered were nearly four times more likely to report income from employment than their unsheltered counterparts. The unsheltered were more likely to report income from other sources than those who were sheltered, 67% to 51%. Specifically, the unsheltered were approximately three times more likely to report income from binning/bottle collection and panhandling than their sheltered counterparts.
TABLE 7: INCOME SOURCES
Income Source (more than 1 response possible)
Sheltered Homeless
Unsheltered Homeless
Total Surveyed Homeless
# % # % # %
Government transfers 577 72% 455 63% 1,032 68%
Income Assistance 422 53% 367 51% 789 52%
Disability Benefit 189 24% 107 15% 296 20%
OAS/GIS/CPP 43 5% 10 1% 53 4%
Employment Insurance 33 4% 12 2% 45 3%
Employment 180 23% 60 8% 240 16%
Part-time employment 125 16% 52 7% 177 12%
Full-time employment 55 7% 8 1% 63 4%
Other Sources 406 51% 481 67% 887 59%
Binning, bottle collecting 88 11% 218 30% 306 20%
Other 104 13% 143 20% 247 16%
Friends/family 115 14% 101 14% 216 14%
Panhandling 48 6% 140 20% 188 12%
No income 54 7% 43 6% 97 6%
Total Respondents 796 717 1,513
Not Asked (NFA) 109 0 109
Unknown 29 35 64
Total 934 639 1,686

One Step Forward… Results of the 2011 Metro Vancouver Homeless Count
The Greater Vancouver Regional Steering Committee on Homelessness
Page 22
Trends
Historically, the proportion of homeless people who had employment rose from 11% in 2002 to 14% in 2005 and then to 19% in 2008 before dipping to 16% in 2011. However, as indicated above, the most promising statistic from the 2011 Count from the point of view of income could be seen in both the absolute number and proportion of homeless people who were able to access government transfer payments. As can be seen in Figure 5, the percentage of homeless people receiving Income Assistance reached an all-time high of 52% in 2011, up from a historic low of 30% only six years prior.
FIGURE 5: PROPORTION OF HOMELESS ON INCOME ASSISTANCE
5.5 Length of Time Homeless
The length of time individuals and families remain homeless is a key metric on the success of existing programs to house people who are homeless. For example, it can be seen as an indication of the efficiency with which facilities such as emergency shelters are turning over, which is essential for addressing demand. Given the potential significance of this metric to policy-making and service provision, respondents to the Count survey were asked how long they had been without a place of their own. Table 8 depicts the length of time that respondents reported they were homeless. On the whole, 55% of the respondents reported having been homeless for six months or more, including 40% or two out of every five who reported being homeless for one year or more. Approximately 30% of the respondents reported being homeless for one to six months, while 15% indicated that they were homeless for less than one month. Members of the community who were consulted as part of the preparation of this report also reiterated that nearly one in two homeless person remained so for at least six months. The community suggested that this was likely because it often takes two or three months for the
2002 2005 2008 2011
Income Assistance 40% 30% 43% 52%
40%
30%
43%
52%
0%
10%
20%
30%
40%
50%
60%
% o
f H
om
ele
ss

One Step Forward… Results of the 2011 Metro Vancouver Homeless Count
The Greater Vancouver Regional Steering Committee on Homelessness
Page 23
homeless to accumulate funds for their first and last month rent and make other arrangements to transition to being housed. The length of time people remained homeless varied between the sheltered and unsheltered populations, as Table 8 shows. The unsheltered homeless were more likely to be homeless for a longer period than those found in shelters. Specifically, while 66% of the unsheltered reported being homeless for six months or more, 46% of the sheltered reported a similar duration of homelessness. Perhaps a more significant difference between the sheltered and unsheltered populations on this issue was the indication that one in two of the unsheltered (50%) was homeless for at least one year, while one in three of the sheltered (32%) had the same experience. These statistics appear to support the increasing role of the emergency shelters systems in the region as hubs and gateways out of homelessness and into stable housing.
TABLE 8: LENGTH OF TIME HOMELESS
Length of Time Sheltered Homeless
Unsheltered Homeless
Total Surveyed Homeless
# % # % # %
Less than 1 month 169 21% 64 9% 233 15%
1 month to under 6 months 268 33% 184 26% 452 30%
6 months to under 1 year 110 14% 112 16% 222 15%
1 year or more 256 32% 354 50% 610 40%
Total respondents 803 100% 714 100% 1,517 100%
Not Asked (NFA) 109 0 109
Unknown 22 38 60
Total 934 752 1,686
Research suggests that the length of time a person stays homeless increases with age and is longer for males, never married persons, and those who have been incarcerated in the past.22 Figure 6 shows that in most cases of duration, the number of people found to be homeless increased with age until age 45 to 54, when the number dropped sharply. The reason for the sudden reduction in the number of homeless during the senior years warrants further investigation.
22 Sam Allgood and Raymond S. Warren Jr., “The Duration of Homelessness: Evidence from a National Survey,” Department of
Economics, University of Nebraska, Lincoln, NE, USA.

One Step Forward… Results of the 2011 Metro Vancouver Homeless Count
The Greater Vancouver Regional Steering Committee on Homelessness
Page 24
FIGURE 6: LENGTH OF TIME HOMELESS BY AGE
As well, Figure 7 suggests that consistent with research, there were significantly more men homeless at the longer end of the homelessness duration spectrum than women.
FIGURE 7: LENGTH OF TIME HOMELESS BY GENDER
0
20
40
60
80
100
120
140
Under 19 19 to 24 25 to 34 35 to 44 45 to 54 55 to 64 65 and Over
Nu
mb
er
of
H
om
ele
ss
Age Group
less than 1 month
1 to 6 months
6 to 12 months
1 year or more
0
50
100
150
200
250
300
350
400
450
500
less than 1 month 1 to 6 months 6 to 12 months 1 year or more
Nu
mb
er
of
Ho
me
less
Length of Time Homeless
male
female
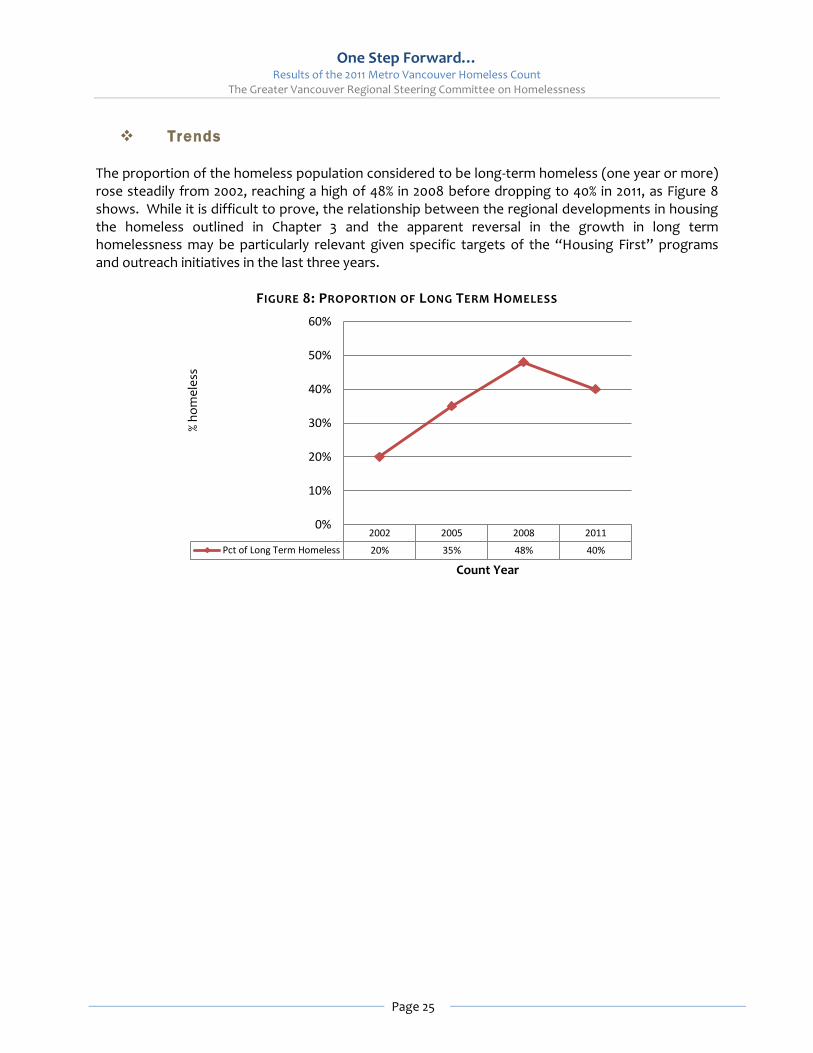
One Step Forward… Results of the 2011 Metro Vancouver Homeless Count
The Greater Vancouver Regional Steering Committee on Homelessness
Page 25
Trends
The proportion of the homeless population considered to be long-term homeless (one year or more) rose steadily from 2002, reaching a high of 48% in 2008 before dropping to 40% in 2011, as Figure 8 shows. While it is difficult to prove, the relationship between the regional developments in housing the homeless outlined in Chapter 3 and the apparent reversal in the growth in long term homelessness may be particularly relevant given specific targets of the “Housing First” programs and outreach initiatives in the last three years.
FIGURE 8: PROPORTION OF LONG TERM HOMELESS
2002 2005 2008 2011
Pct of Long Term Homeless 20% 35% 48% 40%
0%
10%
20%
30%
40%
50%
60%
% h
om
ele
ss
Count Year

One Step Forward… Results of the 2011 Metro Vancouver Homeless Count
The Greater Vancouver Regional Steering Committee on Homelessness
Page 26
6. HEALTH AND WELLBEING
6.1 Introduction
People who are homeless most often experience a mix of physical and mental health issues. In an effort to better understand the scope and depth of the health issues facing the homeless in Metro Vancouver, and also to allow resources and investments to be targeted appropriately, the regional Count has always asked questions about health and wellbeing. This Chapter provides an overview of what was heard during the 2011 Count, with focus on health, social isolation and access to food. 6.2 Health Conditions
As in previous years, respondents were asked if they had any medical or physical conditions, addictions or mental health issues. A medical condition refers to chronic problems such as asthma and diabetes, while physical disability denotes to impairments affecting mobility. As was the case in past Counts, the analysis of health conditions reflects respondents’ self-reports as well as the subjective opinions of Count Surveyors. Table 9 shows that the majority of respondents (62%) reported multiple health conditions, while two out of every five (38%) reported one health condition. Nearly one in three or 31% indicated suffering from three or four conditions. Only a handful (3) of those who responded to the health question reported no health condition whatsoever. The sheltered population was more likely to report multiple health conditions than the unsheltered population. Conversely, the unsheltered population was more likely to report one or no health condition.
TABLE 9: NUMBER OF HEALTH CONDITIONS
Number of Health Conditions
Sheltered Homeless
Unsheltered Homeless
Total Surveyed Homeless
# % # % # %
Two Conditions 191 33% 156 29% 347 31%
Three Conditions 130 22% 98 18% 228 20%
Four Conditions 55 9% 64 12% 119 11%
Multiple Conditions 363 64% 287 59% 650 62%
One health condition 201 35% 225 41% 425 38%
No health conditions 2 0.3% 1 0.2% 3 0.3%
Total Respondents 579 100% 544 100% 1,123 100%
Unknown 246 208 453
Not Asked (NFA) 109 0 109
Total 934 752 1,686
Table 10 shows that the most frequently reported health condition was addiction (54%), followed by medical condition (47%), physical disability (36%), and mental illness (35%).

One Step Forward… Results of the 2011 Metro Vancouver Homeless Count
The Greater Vancouver Regional Steering Committee on Homelessness
Page 27
There were some significant divergences between the health conditions of the sheltered and unsheltered populations. The prevalence of addiction was much higher among the unsheltered population than among the sheltered population (63% compared to 47%). As well, the sheltered homeless were slightly more likely than the unsheltered to report a medical health issue (47% compared to 46%).
TABLE 10: HEALTH CONDITIONS
Type of Health Condition (more than 1 response possible)
Sheltered Homeless
Unsheltered Homeless
Total Surveyed Homeless
# % # % # %
Addiction 345 47% 367 63% 712 54%
Medical condition 343 47% 265 46% 608 47%
Physical condition 245 33% 225 39% 470 36%
Mental illness 257 35% 206 36% 463 35%
Total respondents 734 580 1,314
Unknown 91 172 263
Not Asked (NFA) 109 - 109
Total 934 752 1,686
Trends
The health conditions of the homeless population reported over the last four Counts depict three significant trends, which when considered together, describe a population whose health conditions are worsening rather rapidly:
1. The proportion of the people that reported one health condition increased significantly
between 2008 and 2011 – rose from 27% to 38%.
2. The proportion of people that reported multiple health conditions increased significantly between 2005 and 2011. In 2005, 35% of the population reported more than one health condition. By 2008, this proportion had reached 45%, and by 2011 nearly 62% or three out of every five reported two or more health issues.
3. The incidence of poor health rose across virtually all four health conditions surveyed, and was reflected in a drastic reduction in the healthy part of the population from 35% in 2002 to a negligible percentage of 0.3% in 2011. In 2005 and 2008, roughly one in four (26% and 28% respectively) of the population reported no health conditions, but by 2011, nearly two in five (38%) were coping with complex health issues.
These trends, broadly depicted in Figure 9, appear to support suggestions from the community that the remaining population on our streets and in the shelter system would likely be hard to house because of their poor health conditions, and that the provision of supportive housing must be an integral part of efforts to assist them to exit homelessness.

One Step Forward… Results of the 2011 Metro Vancouver Homeless Count
The Greater Vancouver Regional Steering Committee on Homelessness
Page 28
FIGURE 9: HEALTH TRENDS
6.3 Social Isolation
Social isolation is recognized as one of the reasons why people become homeless and remain so for a long time. It is also acknowledged that addressing isolation issues is an important consideration in preventing and reducing homelessness. For this reason, the Count posed several questions to test the degree of isolation within the homeless population. The first of these questions asked people whether they were alone or accompanied on Count Day. The results, reported in Table 11, suggests a very socially isolated homeless community in which three out of four respondents (75%) reported being alone. Of those who indicated that that they had company, 42% said that they were with a friend, 31% said they were with a partner, 15% reported being in the company of their children, while 8% noted that they had pets with them. Table 11 further shows that the unsheltered were much more likely than the sheltered to be with someone on Count Day –– nearly 33% of the unsheltered reported that they had company, compared to only 18% of the sheltered homelessness. It is noteworthy that friends were the predominant company found among the unsheltered population, whereas the prevalent company among the sheltered was children.
2005 2008 2011
No Health Condition 26% 38% 0.30%
One Health Condition 39% 27% 38%
Multiple Health Conditions 35% 46% 62%
0%
10%
20%
30%
40%
50%
60%
70%
% H
om
ele
ss
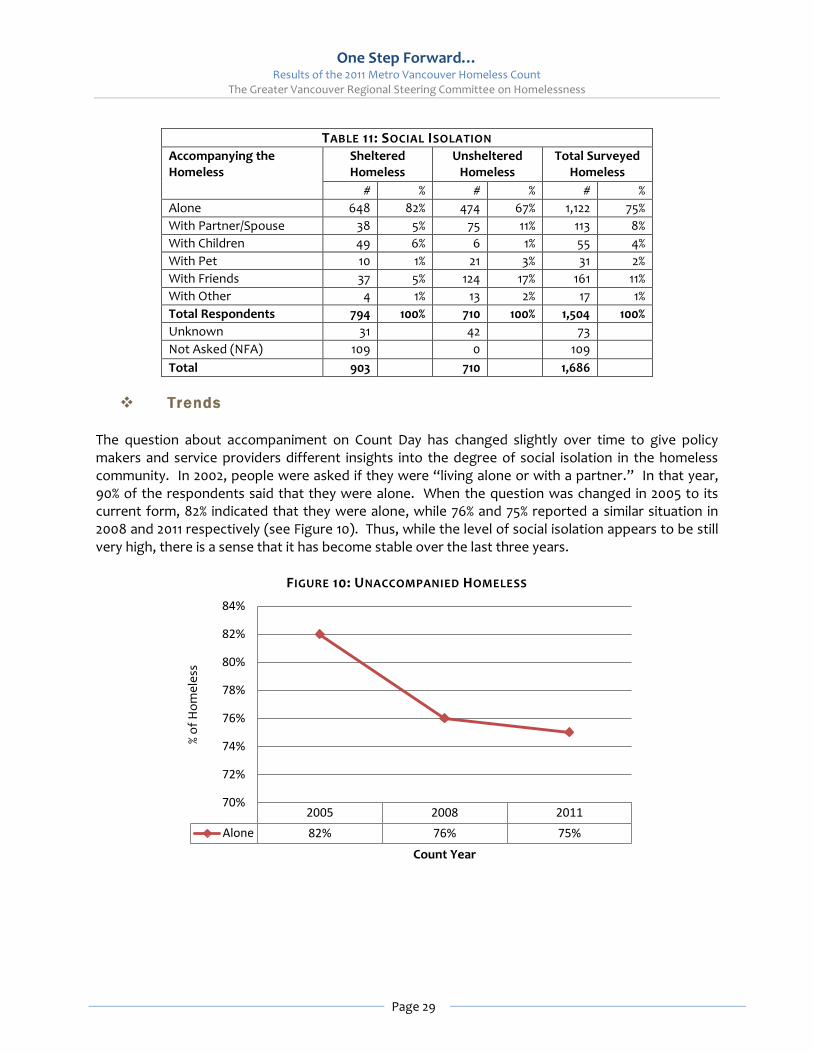
One Step Forward… Results of the 2011 Metro Vancouver Homeless Count
The Greater Vancouver Regional Steering Committee on Homelessness
Page 29
TABLE 11: SOCIAL ISOLATION
Accompanying the Homeless
Sheltered Homeless
Unsheltered Homeless
Total Surveyed Homeless
# % # % # %
Alone 648 82% 474 67% 1,122 75%
With Partner/Spouse 38 5% 75 11% 113 8%
With Children 49 6% 6 1% 55 4%
With Pet 10 1% 21 3% 31 2%
With Friends 37 5% 124 17% 161 11%
With Other 4 1% 13 2% 17 1%
Total Respondents 794 100% 710 100% 1,504 100%
Unknown 31 42 73
Not Asked (NFA) 109 0 109
Total 903 710 1,686
Trends
The question about accompaniment on Count Day has changed slightly over time to give policy makers and service providers different insights into the degree of social isolation in the homeless community. In 2002, people were asked if they were “living alone or with a partner.” In that year, 90% of the respondents said that they were alone. When the question was changed in 2005 to its current form, 82% indicated that they were alone, while 76% and 75% reported a similar situation in 2008 and 2011 respectively (see Figure 10). Thus, while the level of social isolation appears to be still very high, there is a sense that it has become stable over the last three years.
FIGURE 10: UNACCOMPANIED HOMELESS
2005 2008 2011
Alone 82% 76% 75%
70%
72%
74%
76%
78%
80%
82%
84%
Count Year
% o
f H
om
ele
ss
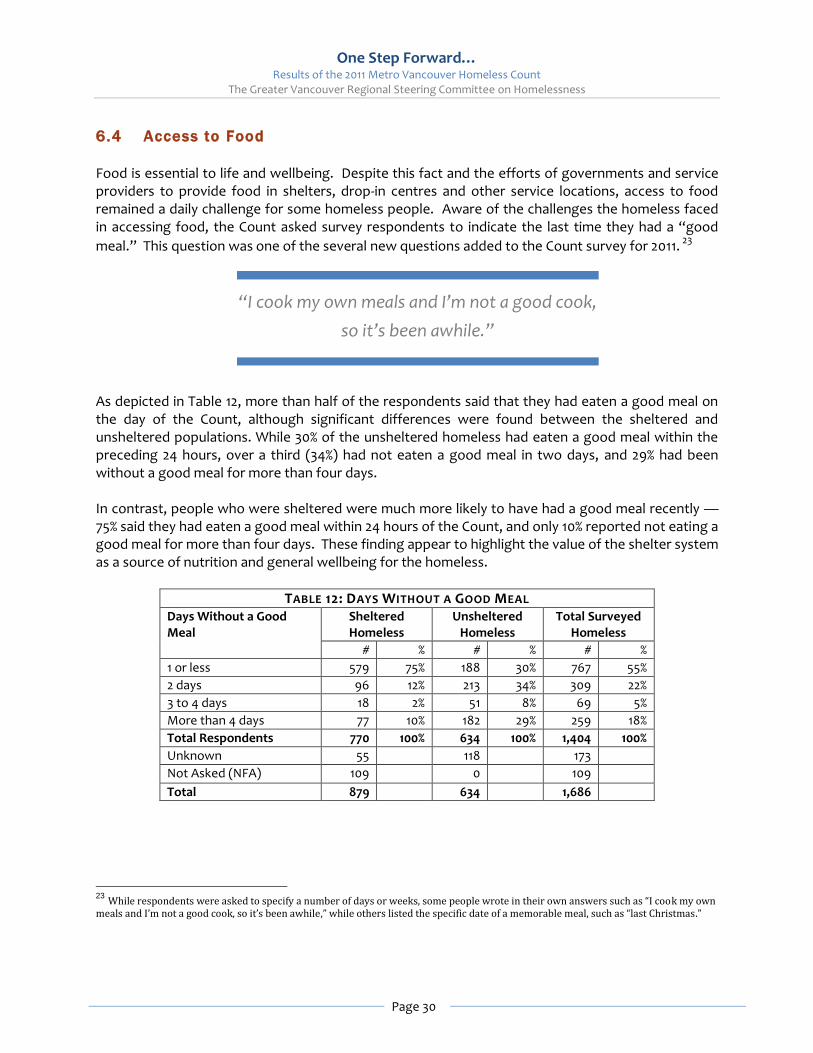
One Step Forward… Results of the 2011 Metro Vancouver Homeless Count
The Greater Vancouver Regional Steering Committee on Homelessness
Page 30
6.4 Access to Food
Food is essential to life and wellbeing. Despite this fact and the efforts of governments and service providers to provide food in shelters, drop-in centres and other service locations, access to food remained a daily challenge for some homeless people. Aware of the challenges the homeless faced in accessing food, the Count asked survey respondents to indicate the last time they had a “good
meal.” This question was one of the several new questions added to the Count survey for 2011. 23
As depicted in Table 12, more than half of the respondents said that they had eaten a good meal on the day of the Count, although significant differences were found between the sheltered and unsheltered populations. While 30% of the unsheltered homeless had eaten a good meal within the preceding 24 hours, over a third (34%) had not eaten a good meal in two days, and 29% had been without a good meal for more than four days. In contrast, people who were sheltered were much more likely to have had a good meal recently —75% said they had eaten a good meal within 24 hours of the Count, and only 10% reported not eating a good meal for more than four days. These finding appear to highlight the value of the shelter system as a source of nutrition and general wellbeing for the homeless.
TABLE 12: DAYS WITHOUT A GOOD MEAL
Days Without a Good Meal
Sheltered Homeless
Unsheltered Homeless
Total Surveyed Homeless
# % # % # %
1 or less 579 75% 188 30% 767 55%
2 days 96 12% 213 34% 309 22%
3 to 4 days 18 2% 51 8% 69 5%
More than 4 days 77 10% 182 29% 259 18%
Total Respondents 770 100% 634 100% 1,404 100%
Unknown 55 118 173
Not Asked (NFA) 109 0 109
Total 879 634 1,686
23
While respondents were asked to specify a number of days or weeks, some people wrote in their own answers such as “I cook my own meals and I’m not a good cook, so it’s been awhile,” while others listed the specific date of a memorable meal, such as “last Christmas.”
“I cook my own meals and I’m not a good cook,
so it’s been awhile.”
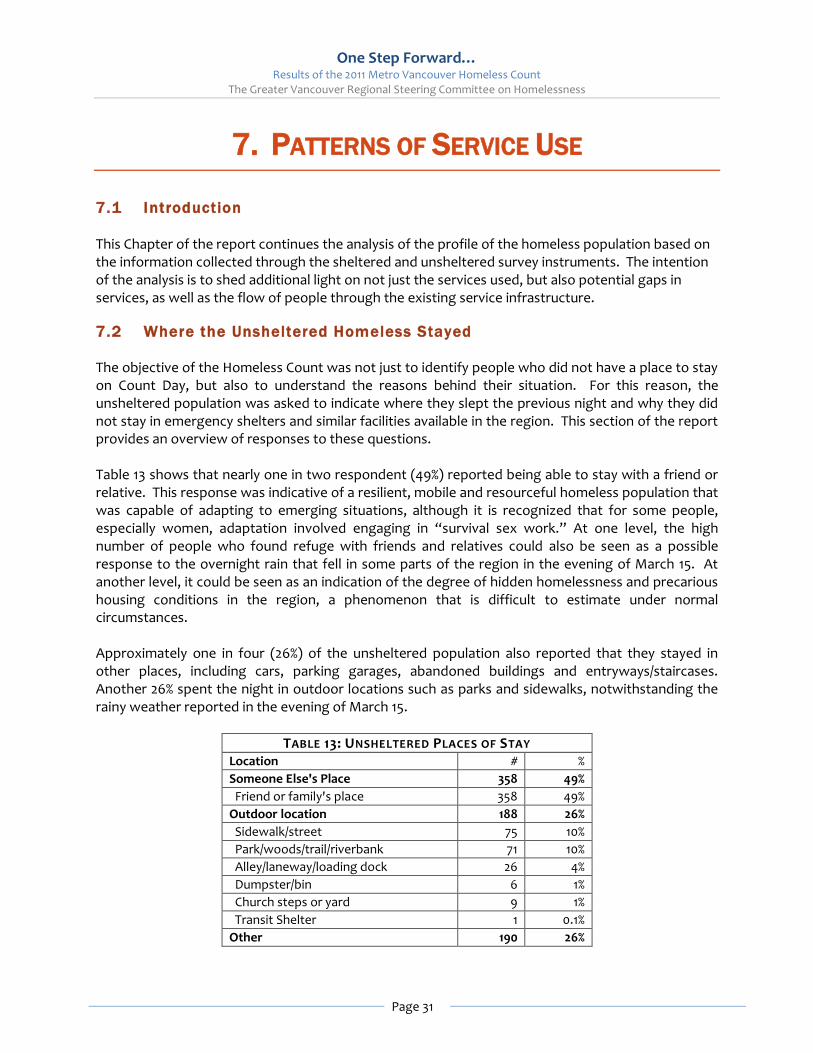
One Step Forward… Results of the 2011 Metro Vancouver Homeless Count
The Greater Vancouver Regional Steering Committee on Homelessness
Page 31
7. PATTERNS OF SERVICE USE
7.1 Introduction
This Chapter of the report continues the analysis of the profile of the homeless population based on the information collected through the sheltered and unsheltered survey instruments. The intention of the analysis is to shed additional light on not just the services used, but also potential gaps in services, as well as the flow of people through the existing service infrastructure. 7.2 Where the Unsheltered Homeless Stayed
The objective of the Homeless Count was not just to identify people who did not have a place to stay on Count Day, but also to understand the reasons behind their situation. For this reason, the unsheltered population was asked to indicate where they slept the previous night and why they did not stay in emergency shelters and similar facilities available in the region. This section of the report provides an overview of responses to these questions. Table 13 shows that nearly one in two respondent (49%) reported being able to stay with a friend or relative. This response was indicative of a resilient, mobile and resourceful homeless population that was capable of adapting to emerging situations, although it is recognized that for some people, especially women, adaptation involved engaging in “survival sex work.” At one level, the high number of people who found refuge with friends and relatives could also be seen as a possible response to the overnight rain that fell in some parts of the region in the evening of March 15. At another level, it could be seen as an indication of the degree of hidden homelessness and precarious housing conditions in the region, a phenomenon that is difficult to estimate under normal circumstances. Approximately one in four (26%) of the unsheltered population also reported that they stayed in other places, including cars, parking garages, abandoned buildings and entryways/staircases. Another 26% spent the night in outdoor locations such as parks and sidewalks, notwithstanding the rainy weather reported in the evening of March 15.
TABLE 13: UNSHELTERED PLACES OF STAY
Location # %
Someone Else's Place 358 49%
Friend or family's place 358 49%
Outdoor location 188 26%
Sidewalk/street 75 10%
Park/woods/trail/riverbank 71 10%
Alley/laneway/loading dock 26 4%
Dumpster/bin 6 1%
Church steps or yard 9 1%
Transit Shelter 1 0.1%
Other 190 26%
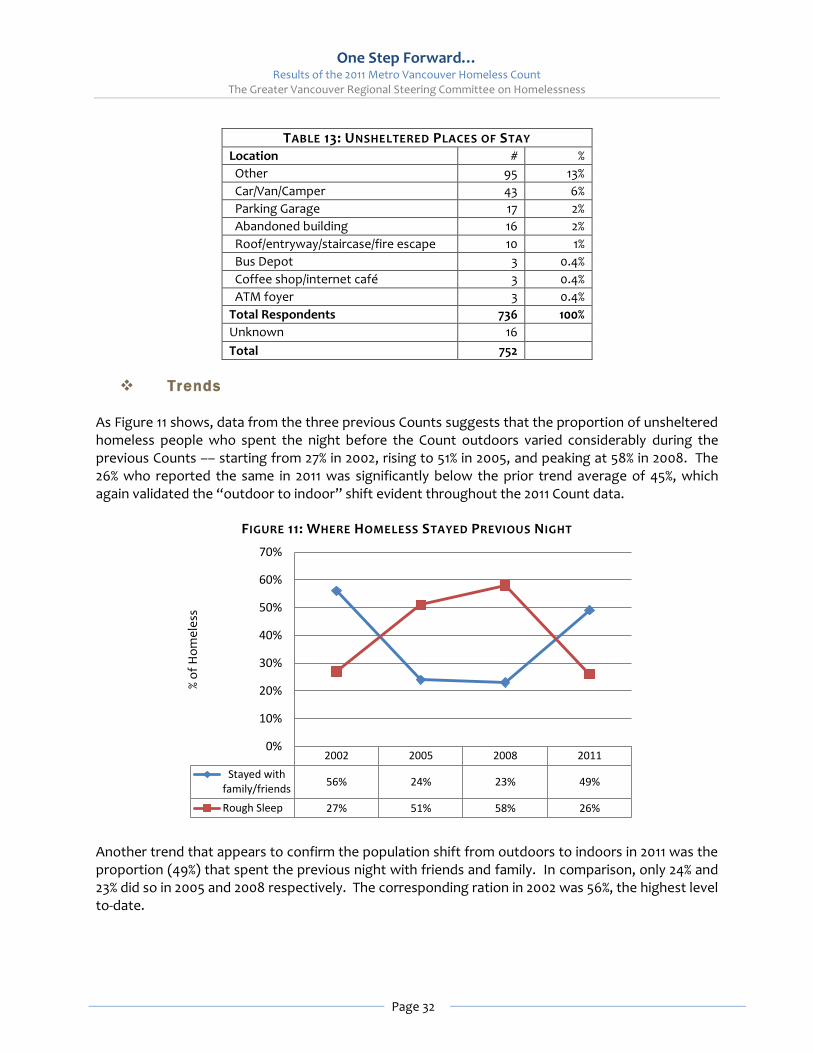
One Step Forward… Results of the 2011 Metro Vancouver Homeless Count
The Greater Vancouver Regional Steering Committee on Homelessness
Page 32
TABLE 13: UNSHELTERED PLACES OF STAY
Location # %
Other 95 13%
Car/Van/Camper 43 6%
Parking Garage 17 2%
Abandoned building 16 2%
Roof/entryway/staircase/fire escape 10 1%
Bus Depot 3 0.4%
Coffee shop/internet café 3 0.4%
ATM foyer 3 0.4%
Total Respondents 736 100%
Unknown 16
Total 752
Trends
As Figure 11 shows, data from the three previous Counts suggests that the proportion of unsheltered homeless people who spent the night before the Count outdoors varied considerably during the previous Counts –– starting from 27% in 2002, rising to 51% in 2005, and peaking at 58% in 2008. The 26% who reported the same in 2011 was significantly below the prior trend average of 45%, which again validated the “outdoor to indoor” shift evident throughout the 2011 Count data.
FIGURE 11: WHERE HOMELESS STAYED PREVIOUS NIGHT
Another trend that appears to confirm the population shift from outdoors to indoors in 2011 was the proportion (49%) that spent the previous night with friends and family. In comparison, only 24% and 23% did so in 2005 and 2008 respectively. The corresponding ration in 2002 was 56%, the highest level to-date.
2002 2005 2008 2011
Stayed withfamily/friends
56% 24% 23% 49%
Rough Sleep 27% 51% 58% 26%
0%
10%
20%
30%
40%
50%
60%
70%
% o
f H
om
ele
ss
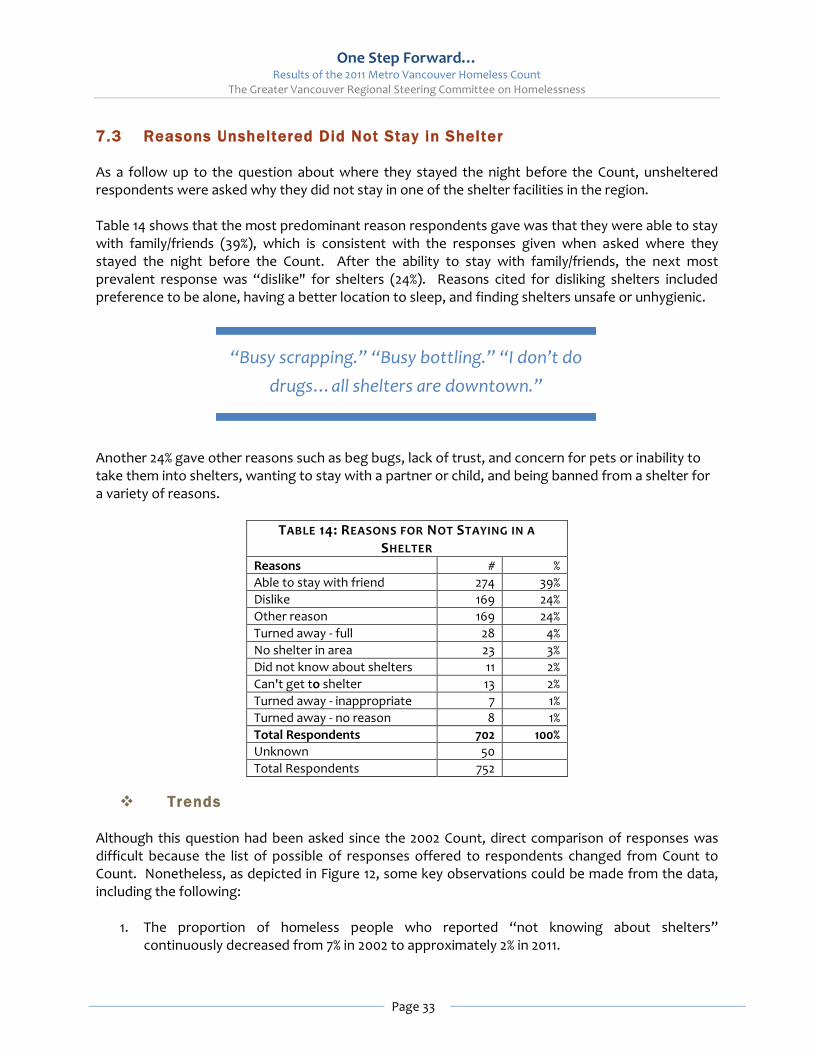
One Step Forward… Results of the 2011 Metro Vancouver Homeless Count
The Greater Vancouver Regional Steering Committee on Homelessness
Page 33
7.3 Reasons Unsheltered Did Not Stay in Shelter
As a follow up to the question about where they stayed the night before the Count, unsheltered respondents were asked why they did not stay in one of the shelter facilities in the region. Table 14 shows that the most predominant reason respondents gave was that they were able to stay with family/friends (39%), which is consistent with the responses given when asked where they stayed the night before the Count. After the ability to stay with family/friends, the next most prevalent response was “dislike" for shelters (24%). Reasons cited for disliking shelters included preference to be alone, having a better location to sleep, and finding shelters unsafe or unhygienic. Another 24% gave other reasons such as beg bugs, lack of trust, and concern for pets or inability to take them into shelters, wanting to stay with a partner or child, and being banned from a shelter for a variety of reasons.
TABLE 14: REASONS FOR NOT STAYING IN A
SHELTER
Reasons # %
Able to stay with friend 274 39%
Dislike 169 24%
Other reason 169 24%
Turned away - full 28 4%
No shelter in area 23 3%
Did not know about shelters 11 2%
Can't get to shelter 13 2%
Turned away - inappropriate 7 1%
Turned away - no reason 8 1%
Total Respondents 702 100%
Unknown 50
Total Respondents 752
Trends
Although this question had been asked since the 2002 Count, direct comparison of responses was difficult because the list of possible of responses offered to respondents changed from Count to Count. Nonetheless, as depicted in Figure 12, some key observations could be made from the data, including the following:
1. The proportion of homeless people who reported “not knowing about shelters” continuously decreased from 7% in 2002 to approximately 2% in 2011.
“Busy scrapping.” “Busy bottling.” “I don’t do
drugs…all shelters are downtown.”
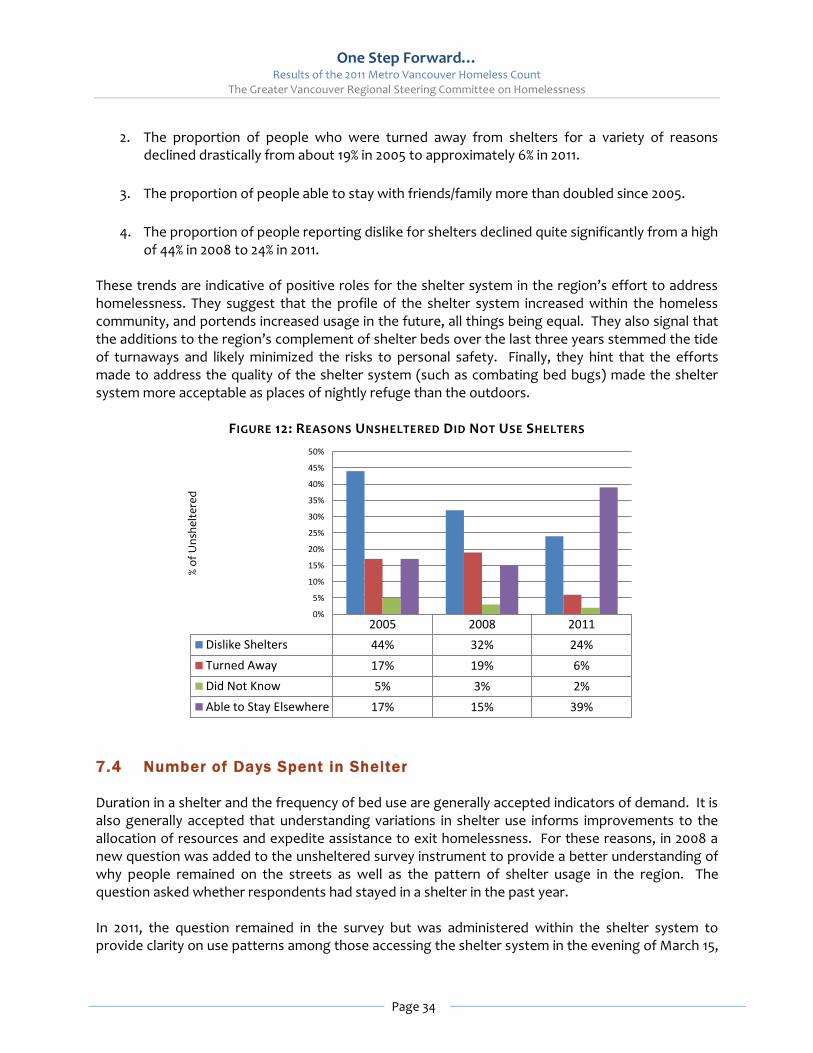
One Step Forward… Results of the 2011 Metro Vancouver Homeless Count
The Greater Vancouver Regional Steering Committee on Homelessness
Page 34
2. The proportion of people who were turned away from shelters for a variety of reasons declined drastically from about 19% in 2005 to approximately 6% in 2011.
3. The proportion of people able to stay with friends/family more than doubled since 2005.
4. The proportion of people reporting dislike for shelters declined quite significantly from a high of 44% in 2008 to 24% in 2011.
These trends are indicative of positive roles for the shelter system in the region’s effort to address homelessness. They suggest that the profile of the shelter system increased within the homeless community, and portends increased usage in the future, all things being equal. They also signal that the additions to the region’s complement of shelter beds over the last three years stemmed the tide of turnaways and likely minimized the risks to personal safety. Finally, they hint that the efforts made to address the quality of the shelter system (such as combating bed bugs) made the shelter system more acceptable as places of nightly refuge than the outdoors.
FIGURE 12: REASONS UNSHELTERED DID NOT USE SHELTERS
7.4 Number of Days Spent in Shelter
Duration in a shelter and the frequency of bed use are generally accepted indicators of demand. It is also generally accepted that understanding variations in shelter use informs improvements to the allocation of resources and expedite assistance to exit homelessness. For these reasons, in 2008 a new question was added to the unsheltered survey instrument to provide a better understanding of why people remained on the streets as well as the pattern of shelter usage in the region. The question asked whether respondents had stayed in a shelter in the past year. In 2011, the question remained in the survey but was administered within the shelter system to provide clarity on use patterns among those accessing the shelter system in the evening of March 15,
2005 2008 2011
Dislike Shelters 44% 32% 24%
Turned Away 17% 19% 6%
Did Not Know 5% 3% 2%
Able to Stay Elsewhere 17% 15% 39%
0%
5%
10%
15%
20%
25%
30%
35%
40%
45%
50%
% o
f U
nsh
elt
ere
d
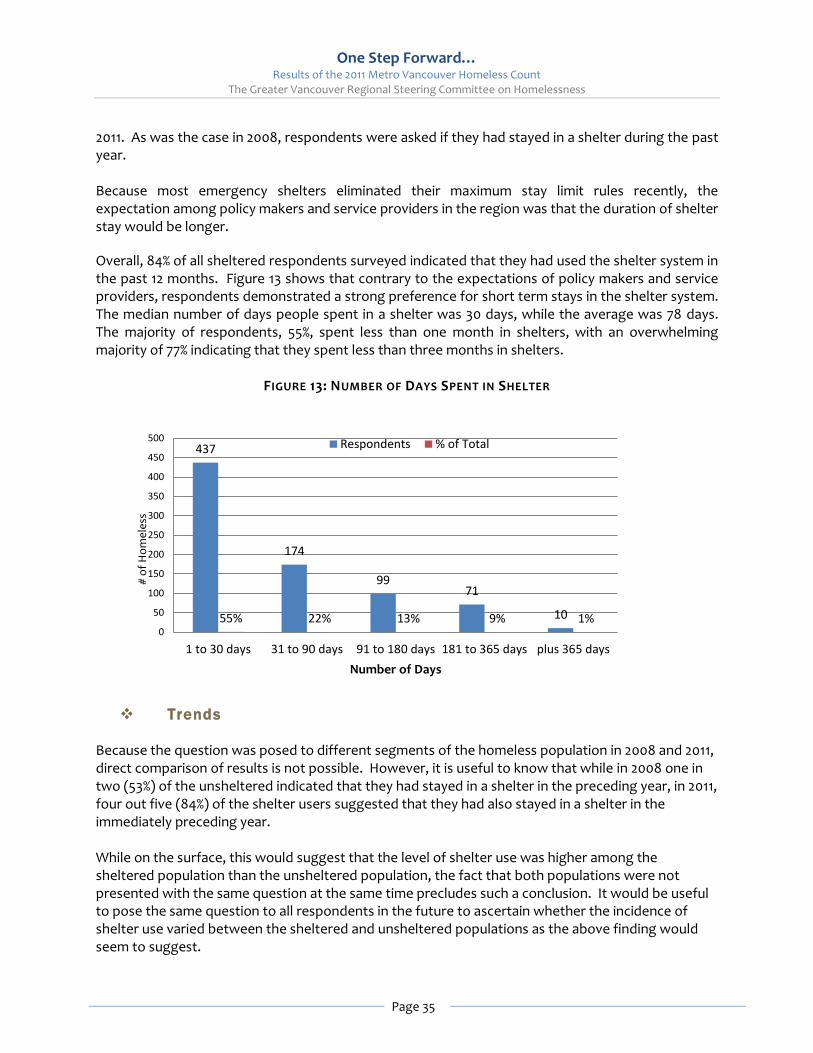
One Step Forward… Results of the 2011 Metro Vancouver Homeless Count
The Greater Vancouver Regional Steering Committee on Homelessness
Page 35
2011. As was the case in 2008, respondents were asked if they had stayed in a shelter during the past year. Because most emergency shelters eliminated their maximum stay limit rules recently, the expectation among policy makers and service providers in the region was that the duration of shelter stay would be longer.
Overall, 84% of all sheltered respondents surveyed indicated that they had used the shelter system in the past 12 months. Figure 13 shows that contrary to the expectations of policy makers and service providers, respondents demonstrated a strong preference for short term stays in the shelter system. The median number of days people spent in a shelter was 30 days, while the average was 78 days. The majority of respondents, 55%, spent less than one month in shelters, with an overwhelming majority of 77% indicating that they spent less than three months in shelters.
FIGURE 13: NUMBER OF DAYS SPENT IN SHELTER
Trends
Because the question was posed to different segments of the homeless population in 2008 and 2011, direct comparison of results is not possible. However, it is useful to know that while in 2008 one in two (53%) of the unsheltered indicated that they had stayed in a shelter in the preceding year, in 2011, four out five (84%) of the shelter users suggested that they had also stayed in a shelter in the immediately preceding year. While on the surface, this would suggest that the level of shelter use was higher among the sheltered population than the unsheltered population, the fact that both populations were not presented with the same question at the same time precludes such a conclusion. It would be useful to pose the same question to all respondents in the future to ascertain whether the incidence of shelter use varied between the sheltered and unsheltered populations as the above finding would seem to suggest.
437
174
99 71
10 55% 22% 13% 9% 1% 0
50
100
150
200
250
300
350
400
450
500
1 to 30 days 31 to 90 days 91 to 180 days 181 to 365 days plus 365 days
# o
f H
om
ele
ss
Number of Days
Respondents % of Total

One Step Forward… Results of the 2011 Metro Vancouver Homeless Count
The Greater Vancouver Regional Steering Committee on Homelessness
Page 36
7.5 Services Accessed in Past Year
Nearly 88% or 1,483 of those surveyed indicated the types of services they had used in the past 12 months when they were asked. Table 15 suggests that overall, the top three services used by the homeless were meal programs (53%), health clinics (49%), and drop-in centres (48%), although these frequencies varied between the sheltered and unsheltered populations.
TABLE 15: SERVICES ACCESSED Services Accessed (more than one response possible)
Sheltered Homeless
N=796
Unsheltered Homeless
N=687
Total Surveyed Homeless N=1,483
# % # % # %
Meal programs/soup kitchens 410 52% 373 54% 783 53%
Health clinic 438 55% 284 41% 722 49%
Drop-in centre 373 47% 333 48% 706 48%
Emergency room 366 46% 251 37% 617 42%
Food banks 296 37% 316 46% 612 41%
Outreach 292 37% 245 36% 537 36%
Hospital (non-emergency) 325 41% 193 28% 518 35%
Employment services/job help 292 37% 172 25% 464 31%
Ambulance 252 32% 148 22% 400 27%
Addiction services 232 29% 156 23% 388 26%
Dentist/dental clinic 241 30% 146 21% 387 26%
Mental health services 204 26% 121 18% 325 22%
Legal services 169 21% 92 13% 261 18%
Housing help/eviction prevention 165 21% 79 11% 244 16%
Transitional housing 159 20% 42 6% 201 14%
Parole/services for ex-offenders 87 11% 57 8% 144 10%
Other 65 8% 62 9% 127 9%
No services used 19 2% 44 6% 63 4%
Budgeting/trusteeship 36 5% 9 1% 45 3%
Newcomer services 34 4% 5 1% 39 3%
Total Respondents 796 687 1,483
Unknown 29 65 94
Not Asked (NFA) 109 0 109
Total 905 752 1,686
Those who were sheltered were more likely to access health services than those were unsheltered. Specifically, more sheltered people used ambulances (32% vs. 22%), emergency room (46% vs. 37%), hospitals (41% vs. 35%) and health clinic (55% vs. 41%). On average, the sheltered homeless used 5.4 services. As well, the sheltered homeless were more than three times as likely as the unsheltered homeless to access transitional housing (20% vs. 6%), and almost twice as likely to use housing help services (21% vs. 11%). In contrast, the unsheltered homeless were more likely to use dental clinics (30% vs. 20%), mental health services (26% vs. 17%), and addiction services (29% vs. 22%). They were also slightly more likely

One Step Forward… Results of the 2011 Metro Vancouver Homeless Count
The Greater Vancouver Regional Steering Committee on Homelessness
Page 37
to use food-related services – 52% accessed meal programs compared to 51% of the sheltered. In addition, 44% of the unsheltered used food banks compared to 37% of the sheltered respondents. Only 4% of all respondents indicated that they had no interaction at all with any of the services offered across the region.
Trends
All previous Count surveys included questions about the use of health related services, as the community attempted to identify links between homelessness and the used of health services. However, in 2008, a new question was added to the surveys to investigate the use of health services in the preceding year. Again, in 2011, the community became interested in the use of non-health services and so expanded the question to probe for information on other services. While the changes in the service use question make direct comparison difficult, Figure 14 suggests that at least over the past two Counts, the use of health services has remained relatively stable in virtually all health service areas, except in mental health services where demand appears to have increased since 2008.
FIGURE 14: USAGE OF HEALTH SERVICES
7.6 Housing Barriers
Without doubt the overriding goal of the region is to provide housing and supports to allow all those who are currently homeless to transition to stable, long-term housing and wellbeing. In keeping with this goal, and as was reported in Chapter 3 in the regional context statement, a myriad of programs and services were created across the region to enable this process. However, service providers and community leaders in the region, backed by research, have pointed out that a key to expediting transitions from homelessness to stable housing is understanding and addressing barriers to housing. To this end, each Count has asked the homeless to indicate the issues that kept them from
53%
44%
33%
27% 26%
15%
49%
42%
35%
27% 26% 22%
0%
10%
20%
30%
40%
50%
60%
health clinic emergencyroom
hospital ambulance addiction mentalhealth
% o
f H
om
ele
ss
Health Services
2008
2011
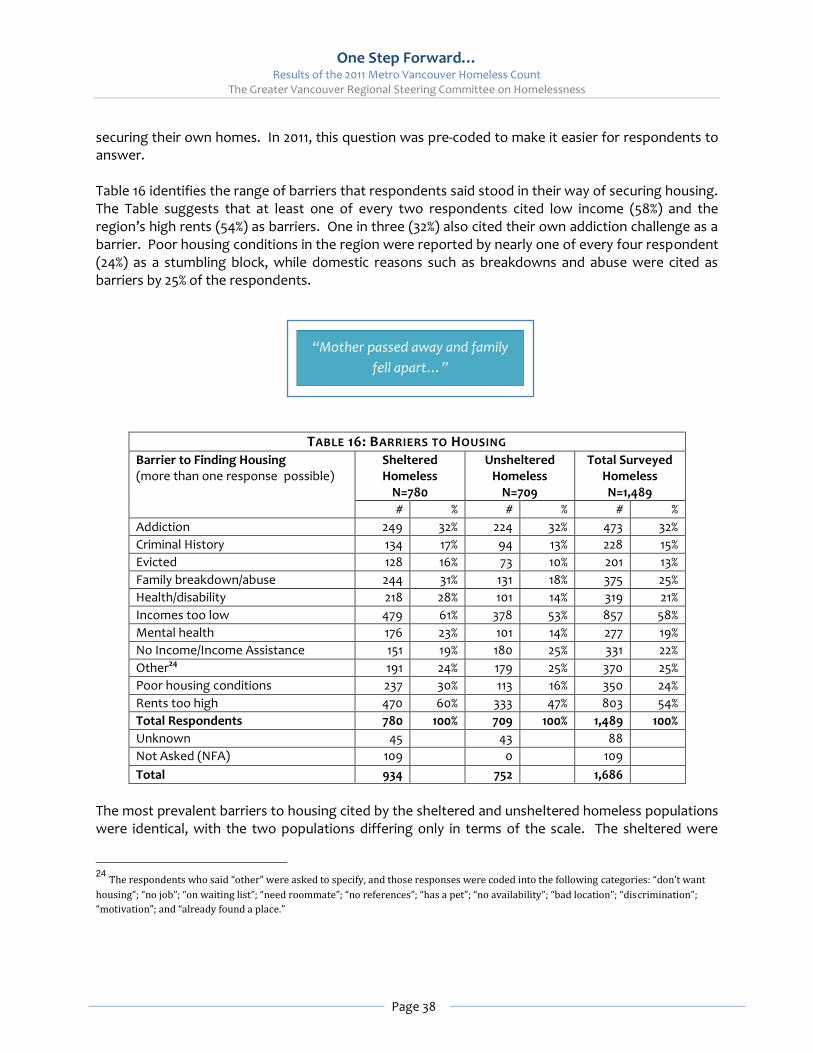
One Step Forward… Results of the 2011 Metro Vancouver Homeless Count
The Greater Vancouver Regional Steering Committee on Homelessness
Page 38
securing their own homes. In 2011, this question was pre-coded to make it easier for respondents to answer. Table 16 identifies the range of barriers that respondents said stood in their way of securing housing. The Table suggests that at least one of every two respondents cited low income (58%) and the region’s high rents (54%) as barriers. One in three (32%) also cited their own addiction challenge as a barrier. Poor housing conditions in the region were reported by nearly one of every four respondent (24%) as a stumbling block, while domestic reasons such as breakdowns and abuse were cited as barriers by 25% of the respondents.
TABLE 16: BARRIERS TO HOUSING Barrier to Finding Housing (more than one response possible)
Sheltered Homeless
N=780
Unsheltered Homeless
N=709
Total Surveyed Homeless N=1,489
# % # % # %
Addiction 249 32% 224 32% 473 32%
Criminal History 134 17% 94 13% 228 15%
Evicted 128 16% 73 10% 201 13%
Family breakdown/abuse 244 31% 131 18% 375 25%
Health/disability 218 28% 101 14% 319 21%
Incomes too low 479 61% 378 53% 857 58%
Mental health 176 23% 101 14% 277 19%
No Income/Income Assistance 151 19% 180 25% 331 22%
Other24 191 24% 179 25% 370 25%
Poor housing conditions 237 30% 113 16% 350 24%
Rents too high 470 60% 333 47% 803 54%
Total Respondents 780 100% 709 100% 1,489 100%
Unknown 45 43 88
Not Asked (NFA) 109 0 109
Total 934 752 1,686
The most prevalent barriers to housing cited by the sheltered and unsheltered homeless populations were identical, with the two populations differing only in terms of the scale. The sheltered were
24
The respondents who said “other” were asked to specify, and those responses were coded into the following categories: “don’t want
housing”; “no job”; “on waiting list”; “need roommate”; “no references”; “has a pet”; “no availability”; “bad location”; “discrimination”;
“motivation”; and “already found a place.”
“Mother passed away and family
fell apart…”

One Step Forward… Results of the 2011 Metro Vancouver Homeless Count
The Greater Vancouver Regional Steering Committee on Homelessness
Page 39
more likely than the unsheltered to report high rent (61% to 47%) and low income (60% to 53%) as barriers. Poor housing conditions were a barrier to nearly one in three of the sheltered (30%), but only 16% of the unsheltered saw that as a constraint.
Trends
As indicated above, although this question was asked in the past, the format has varied over the years and thus undermined the value of comparing the 2011 responses to findings from previous Count years. However, it is important to note that a consistent theme in the response from 2008 and 2011 was low income reported as the most pressing barrier to people looking to find a home. The consistency of this message from the homeless population strengthens the RSCH’s long-standing view that the pathway out of homelessness in the region must include living wage income and housing with support services. 7.7 Youth Services
Since about 2005, the RSCH has recommended in excess of $2 million of the region’s Homelessness Partnering Strategy funds annually (approximately 20% of the regions program allocation) for the provision of Safe House services to youth in the North Shore, Vancouver and Maple Ridge. Recognizing that gaps in youth safe houses services have occurred in those areas of the region in part due to the loss or withdrawal of services to youth, the RSCH included a question on the issue in the 2011 Count survey to try to gain a better understanding of the problem. The question asked youth under 25 whether they had been affected by the withdrawal of youth services and at what age they were affected. Of the 321 unaccompanied youth that responded to the Count survey, 79 or 25% indicated that they had been affected by the withdrawal of services. Of the 79 youth, 52 or 66% were unsheltered while 27 or 35% were found in the shelter system. In terms of the age when services were withdrawn or lost, Figure 15 suggests that the vast majority of the youth lost services when they were 18 or 19 years of age. The reasons why the youth lost services was not part of the inquiry; however, it remains important for the RSCH to develop further understanding of the issue through dialogue with not only the affected youth, but also the provincial government agencies involved in the provision of youth services.
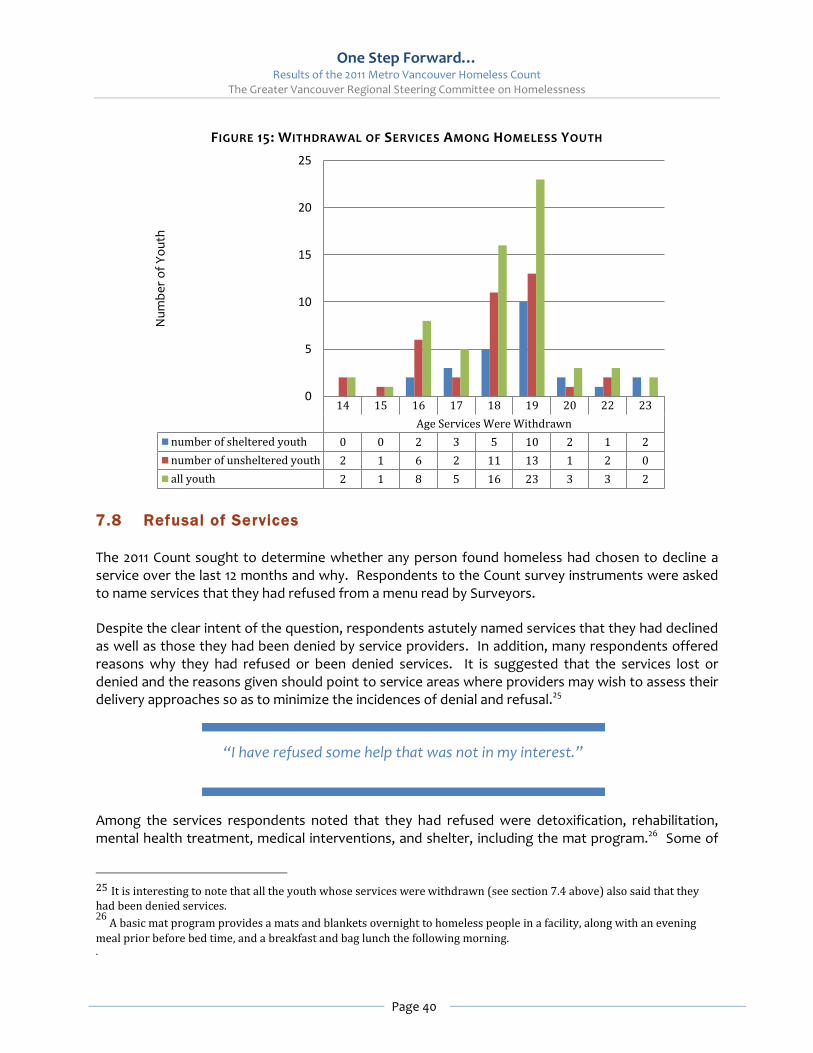
One Step Forward… Results of the 2011 Metro Vancouver Homeless Count
The Greater Vancouver Regional Steering Committee on Homelessness
Page 40
FIGURE 15: WITHDRAWAL OF SERVICES AMONG HOMELESS YOUTH
7.8 Refusal of Services
The 2011 Count sought to determine whether any person found homeless had chosen to decline a service over the last 12 months and why. Respondents to the Count survey instruments were asked to name services that they had refused from a menu read by Surveyors. Despite the clear intent of the question, respondents astutely named services that they had declined as well as those they had been denied by service providers. In addition, many respondents offered reasons why they had refused or been denied services. It is suggested that the services lost or denied and the reasons given should point to service areas where providers may wish to assess their delivery approaches so as to minimize the incidences of denial and refusal.25 Among the services respondents noted that they had refused were detoxification, rehabilitation, mental health treatment, medical interventions, and shelter, including the mat program.26 Some of
25 It is interesting to note that all the youth whose services were withdrawn (see section 7.4 above) also said that they had been denied services. 26
A basic mat program provides a mats and blankets overnight to homeless people in a facility, along with an evening
meal prior before bed time, and a breakfast and bag lunch the following morning. .
14 15 16 17 18 19 20 22 23
Age Services Were Withdrawn
number of sheltered youth 0 0 2 3 5 10 2 1 2
number of unsheltered youth 2 1 6 2 11 13 1 2 0
all youth 2 1 8 5 16 23 3 3 2
0
5
10
15
20
25N
um
be
r o
f Y
ou
th
“I have refused some help that was not in my interest.”

One Step Forward… Results of the 2011 Metro Vancouver Homeless Count
The Greater Vancouver Regional Steering Committee on Homelessness
Page 41
the reasons the respondents cited included too many forms to complete, pride, lack of suitability, and lack of interest. On the service provider side, respondents noted that they had been refused shelter, social assistance, pensions, legal assistance and job help. 7.9 Ending Homelessness
Part of the community practice in Metro Vancouver is including the voices of the homeless in the search for solutions. With this in mind, the Count survey asked respondents to identify the one thing that they thought would help end their homelessness. The 2011 Count was the first to pose this question. An overwhelming majority of those who responded to the Count survey addressed this question – a testimony to the interest of the homeless community itself in finding solutions to homelessness and a validation for including the question in the survey. Although the question asked respondents to identify “one thing,” nearly three of every five respondents identified multiple items, once again pointing to the awareness of the homeless community of the complexity of the issues they face daily and the multi-pronged approach needed to end homelessness. As Table 17 shows, the most common response from the 1,399 people that addressed the question was housing/affordable housing (33%), followed by support services (22%), and income (15%). A number of respondents gave more personal reasons — 4% said they needed to fix a relationship, 1% said they needed to finish school, 5% said they needed to end their addiction, and 3% said they needed personal growth. Other respondents stressed the need for more services — 9% said they needed more or better services, and 1% specified needing legal help. Some who responded finding a job (17%) also requested employment services. Most of those who said help finding a place (5%) also wanted housing help services such as someone to help make viewing appointments and fill out applications. Approximately 2% of respondents said improving their health, including mental health, would end their homelessness. Respondents who said they needed to end their addiction (5%) also wanted addiction services. While the response pattern was similar across the sheltered and unsheltered homeless population, there were some notable differences. Sheltered homeless people were more likely to specify affordable housing (36% versus 31%), while the unsheltered homeless were more likely to view income as more significant (17% versus 14%). The unsheltered population was also more likely to express a desire to mend their relationships than the sheltered population (6% versus 3%).
“A place to live and people being less judgmental.”

One Step Forward… Results of the 2011 Metro Vancouver Homeless Count
The Greater Vancouver Regional Steering Committee on Homelessness
Page 42
TABLE 17: WHAT WOULD HELP END HOMELESSNESS
Item Sheltered Homeless
Unsheltered Homeless
Total Surveyed Homeless
# % # % # %
Housing 274 36% 194 31% 468 33%
Supports services 165 21% 143 23% 308 22%
Income 106 14% 109 17% 215 15%
Employment 105 14% 79 13% 184 13%
Housing and other services 55 7% 42 7% 97 7%
Other 39 5% 32 5% 71 5%
Income and other services 11 1% 13 2% 24 2%
Transportation 12 2% 7 1% 19 1%
Don't know 4 1% 9 1% 13 1%
Total 771 100% 628 100% 1,399 100%

One Step Forward… Results of the 2011 Metro Vancouver Homeless Count
The Greater Vancouver Regional Steering Committee on Homelessness
Page 43
8. PROFILES OF SPECIAL POPULATIONS
8.1 Introduction
Due to specialization in the delivery of homeless services across the region, there is a high degree of interest in different segments of the homeless population. Accordingly, this Chapter of the report presents the profiles of five such populations –– Aboriginal people, women, youth, seniors, families, and new Canadians.
8.2 Aboriginal People
Nearly one in four (27% or 394) of the surveyed homeless population was a person of Aboriginal ancestry. As Table 18 shows, people of Aboriginal ancestry were found in both sheltered and unsheltered locations in the region on March 15 andd 16, with a slightly higher percentage found among the sheltered population.
TABLE 18: ABORIGINAL IDENTITY27
Identity Sheltered Homeless
Unsheltered Homeless
Total Surveyed Homeless
# % # % # %
Aboriginal 196 25% 198 29% 394 27%
Not Aboriginal 589 75% 485 71% 1,074 73%
Total Respondents 785 100% 683 100% 1,468 100%
Not Asked (NFA) 109 - 109
Unknown 40 69 109
Total 934 752 1,686
The Aboriginal homeless population had a higher female population (38%) and a lower senior population (8%) than the general homeless population. As well, people of Aboriginal ancestry represented a majority (52%) of youth aged 13 to 24, and 28% of all unaccompanied children. Consultations with the urban Aboriginal community suggested that the reasons for Aboriginal homeless add layers of complexity over and above the general reasons for homelessness. These extra complexities include things such as the legacy of residential schools, isolation and extreme poverty on some First Nation reserves, and prevalent health issues and rates of addiction that remain higher than the general population. The uniqueness of these issues, the community suggested, warrants a culturally specialized, holistic and informed approach in the region with the understanding that the urban Aboriginal population is made up of multiple nations and cultural strengths while facing ongoing systemic barriers to housing, health and wellbeing. It was also the view of the community, and indeed the RSCH, that the overrepresentation of Aboriginal people in the homeless population relative to their share of the metropolitan population
27 66 people identified themselves as Métis in response to another question but did not self-identify as Aboriginal people when asked.

One Step Forward… Results of the 2011 Metro Vancouver Homeless Count
The Greater Vancouver Regional Steering Committee on Homelessness
Page 44
(2%) strengthens the community’s preference for culturally-sensitive approaches to addressing Aboriginal homelessness.
Trends
Figure 16 suggests that while the proportion of Aboriginal people in the homeless population has declined since the 2008 Count, there remains a significant underestimate generally of the number of homeless in the Aboriginal community. Aboriginal people typically have a high incidence of hidden homelessness and that the percentage of Aboriginal homeless who have been raised apart from their cultural families may not know they are Aboriginal or may not self-identify as Aboriginal as a result of dislocation. Consultations with the urban Aboriginal community suggested that this year’s estimate of Aboriginal homeless people may be especially conservative because of relocation patterns due to new development in Surrey along the Fraser River.
FIGURE 16: TREND IN ABORIGINAL HOMELESSNESS
8.3 Women
As was reported in Chapter 4, a total of 652 women representing 31% of the total homeless population were found on March 15 and 16. However, the focus of the analysis in this part is on the 489 who were surveyed. They represented 29% of the surveyed homeless population. Within this group of women, three out of every five (57%) were sheltered while two out of five (43%) were unsheltered. Other than 34 women found in institutions where people with no fixed address were counted, the vast majority of women (88%) were sheltered in emergency shelters and transition houses across the region. Likely because of the number and variety of shelter facilities in Vancouver, the majority of the sheltered homeless women (51%) were found in Vancouver. The largest proportion of the unsheltered female population (34%) was found in Surrey, followed by Vancouver with 22%.
17%
30%
32%
27%
0%
5%
10%
15%
20%
25%
30%
35%
2002 2005 2008 2011
% o
f H
om
ele
ss
Count Year

One Step Forward… Results of the 2011 Metro Vancouver Homeless Count
The Greater Vancouver Regional Steering Committee on Homelessness
Page 45
As Figure 17 shows, the female homeless population was considerably younger than the general homeless population. The median age was 34 years compared to 40 years within the general homeless population. The women population also had a higher ratio of youth (27%) than the general homeless proportion (20%). People of Aboriginal ancestry were overrepresented in the female homeless population compared to the general homeless population (34% compared to 27%). On the other hand, homeless women had a lower ratio of seniors (9%) than the general homeless population (12%). Homeless women were also more likely than the general homeless population to be homeless for a shorter period of time – only 30% of the women had been homeless for more than one year, compared to 40% across the general homeless population. While homeless women were less likely than the general homeless population to report income from government transfers and employment, they were more likely than the general population (21% versus 16%) to report income from other sources. Very few homeless women reported being newcomers to Canada (22 or 5%).
FIGURE 17: AGE AND SHELTER DISTRIBUTION OF HOMELESS WOMEN
Research on women and homelessness28 and the post-Count community consultations in the region attributed the under-representation of females in the homeless population to several factors. First, it was suggested that the Count primarily captures women who are homeless only if they are perceived as visibly homeless or are accessing shelters, transition houses, youth safe houses or other homelessness services. However, it was suggested that most women who experience homelessness remain hidden to protect themselves and avoid homeless shelter locations and services by staying with friends or family or entering into a relationship for a place to stay.
28 Novac, Sylvia (1996) No Room of Her Own: A Literature Review of Women and Homelessness. Klodoawsky, Fran (2006)
Landscapes on the Margins: Gender and homelessness in Canada.
Sheltered Unsheltered Total
Youth 57 76 133
Adults 186 124 310
Seniors 34 8 42
0
50
100
150
200
250
300
350
Nu
mb
er
of
Wo
me
n
Age Group and Shelter Type

One Step Forward… Results of the 2011 Metro Vancouver Homeless Count
The Greater Vancouver Regional Steering Committee on Homelessness
Page 46
Research also suggests that women who are homeless tend to have experienced family breakdown and are more vulnerable to ongoing violence and income insecurity, and therefore more likely to trade sexual acts for secure tenancy or income. Community stakeholders contacted during the post-Count consultations agreed with these observations and suggested that it was not only women that were vulnerable in this manner, but also youth, seniors and Aboriginal people were equally vulnerable. Perhaps the best indicator of the vulnerability of women found in the 2011 Count was the fact that 64% of unsheltered women surveyed stayed at someone else’s place the previous night, while 16% stayed in an outdoor location. Yet another indicator was the fact that over half (57%) of the female population found homeless on March 15 and 16 were staying in a sheltered location, including all 80 people found in transition houses.
Trends
As Figure 18 shows, the proportion of women in the regional homeless population has remained relatively steady since counting began in 2002. What appeared to be trending upwards was the proportion of youth in the female homeless population. As recently as 2008, adults represented 73% of the female homeless population while youth constituted 21%. The 2011 Count suggested that the proportion of youth had increased to 27% of female homeless.
FIGURE 18: GROWTH TRENDS AMONG HOMELESS WOMEN
Another notable trend which was consistent with the noted vulnerabilities of the female homeless population was the decline in the proportion of females who were alone at the time of the Count. In 2005, 71% of all female homeless people reported being alone. The 2011 Count showed that this ratio had been reduced by almost half to 36%. In 2002, when the Count asked people to indicate the reasons why they were homeless, the highest ranked reason cited by women was family breakdown (46%). In 2011, while family breakdown remained a major reason, it ranked third (36%) behind low income (55%) and high rent (51%).
29% 30% 33% 32% 31%
39%
23% 23%
29% 29%
32%
26% 27% 30% 29%
2002 2005 2008 2011 4-Count Average
% o
f H
om
ele
ss
Count Year
sheltered homeless unsheltered homeless total homeless
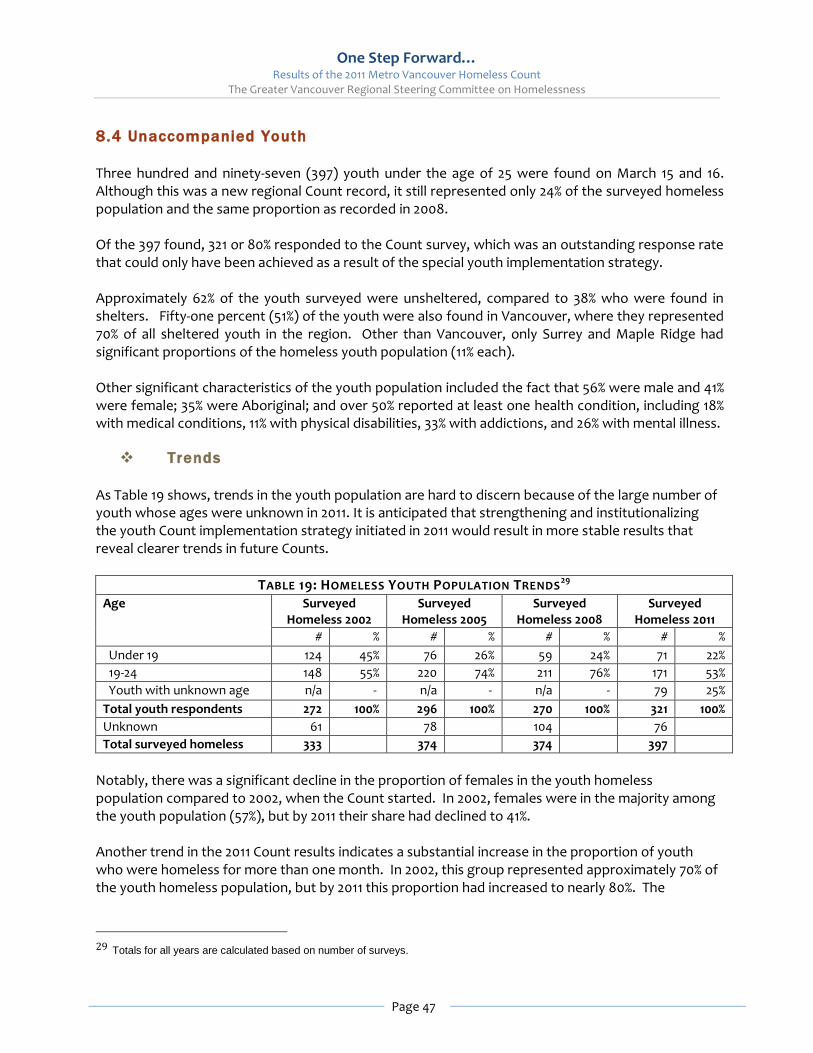
One Step Forward… Results of the 2011 Metro Vancouver Homeless Count
The Greater Vancouver Regional Steering Committee on Homelessness
Page 47
8.4 Unaccompanied Youth
Three hundred and ninety-seven (397) youth under the age of 25 were found on March 15 and 16. Although this was a new regional Count record, it still represented only 24% of the surveyed homeless population and the same proportion as recorded in 2008. Of the 397 found, 321 or 80% responded to the Count survey, which was an outstanding response rate that could only have been achieved as a result of the special youth implementation strategy. Approximately 62% of the youth surveyed were unsheltered, compared to 38% who were found in shelters. Fifty-one percent (51%) of the youth were also found in Vancouver, where they represented 70% of all sheltered youth in the region. Other than Vancouver, only Surrey and Maple Ridge had significant proportions of the homeless youth population (11% each). Other significant characteristics of the youth population included the fact that 56% were male and 41% were female; 35% were Aboriginal; and over 50% reported at least one health condition, including 18% with medical conditions, 11% with physical disabilities, 33% with addictions, and 26% with mental illness.
Trends
As Table 19 shows, trends in the youth population are hard to discern because of the large number of youth whose ages were unknown in 2011. It is anticipated that strengthening and institutionalizing the youth Count implementation strategy initiated in 2011 would result in more stable results that reveal clearer trends in future Counts.
TABLE 19: HOMELESS YOUTH POPULATION TRENDS29
Age Surveyed Homeless 2002
Surveyed Homeless 2005
Surveyed Homeless 2008
Surveyed Homeless 2011
# % # % # % # %
Under 19 124 45% 76 26% 59 24% 71 22%
19-24 148 55% 220 74% 211 76% 171 53%
Youth with unknown age n/a - n/a - n/a - 79 25%
Total youth respondents 272 100% 296 100% 270 100% 321 100%
Unknown 61 78 104 76
Total surveyed homeless 333 374 374 397
Notably, there was a significant decline in the proportion of females in the youth homeless population compared to 2002, when the Count started. In 2002, females were in the majority among the youth population (57%), but by 2011 their share had declined to 41%. Another trend in the 2011 Count results indicates a substantial increase in the proportion of youth who were homeless for more than one month. In 2002, this group represented approximately 70% of the youth homeless population, but by 2011 this proportion had increased to nearly 80%. The
29 Totals for all years are calculated based on number of surveys.
One Step Forward… Results of the 2011 Metro Vancouver Homeless Count
The Greater Vancouver Regional Steering Committee on Homelessness
Page 48
proportion of the youth population considered to be long term homeless (homeless for more than one year) also increased from about 20% in 2002 to 26% in 2011. In regards to health trends in the homeless youth population, in 2002 youth under the age of 19 were less likely to report health issues other than addiction, the 2011 youth population reported disorders in all the health areas surveyed. 8.5 Seniors Due to the rapid onset of aging and the health consequences of homelessness, people who are 55 years or older and homeless are classified as seniors. In 2011, 268 individuals or 16% of the surveyed homeless population in the region fell into the senior category. This compares to 13% of the general regional population that is 55 years or older. Approximately 75% (201) of the seniors found responded to the Count survey. Of these, the vast majority of them (77%) were male compared to 70% of males in the general surveyed homeless population,. A significant majority of them (70%) were also sheltered, including 18 who were sheltered in institutions. Although, the vast majority was found in shelters, a significant proportion, 44%, reported that they spent the previous night at outdoor locations. Approximately 87% reported being alone on Count Day. One in two or 48% had been homeless for one year or more, while 65% reported that they lived in the same municipality for five years or more. With respect to community experience, almost one in two or (48%) seniors were found in Vancouver, while one in five (20%) was found in Surrey. New Westminster had the next highest segment of the senior population, with approximately 8.5%, followed by the North Shore with 7%. Thirty-two or 16% of the seniors found reported Aboriginal ancestry while only eight indicated that they were new Canadians, including three who said that they required non-English services. Seniors were likely to report low income (50%) and high rent (49%) as reasons why they did not have a place of their own.
Trends
Table 20 shows the growth of the senior population over the last four Homeless Counts. A notable trend is the rising number of the 65 and over age cohort. The significant increase in the absolute number of people in this cohort in 2011 would appear to be indicative of what the region could look expect as both the general regional population and the homeless population age.

One Step Forward… Results of the 2011 Metro Vancouver Homeless Count
The Greater Vancouver Regional Steering Committee on Homelessness
Page 49
There has also been considerable evolution in the reasons why seniors became homeless. In 2002, evition was the leading reason cited by 25% of the population. However, as mentioned above, by 2011, the cost of housing and low income had become the most frequently cited reasons, with approximately 50% of those surveyed pointing to these as factors. Only 25 seniors reported that eviction was a reason why they did not have a home. The proportion of seniors reporting medical conditions also increased above the 2002 Count levels. While in 2002, 49% of seniors reported a medical condition, followed by 35% with a physical disability, 27% with an addiction, and 18% with a mental illness, in 2011, 53% of the seniors reported medical a condition, 45% reported a physical disability, 31% reported an addiction, while 20% indicated a mental health challenge. 8.6 Families
One of the most common public misconceptions about homelessness is that it afflicts only single men and women. However, one of the fastest growing segments of the homeless population is families with children. In 2011, 56 individuals or 3% of the homeless people found reported being accompanied by children. This was the highest number of homeless families found in the region since counting began in 2002. Community consultations revealed that this number could actually be significantly higher, especially as homeless parents risk having their children put in care if they are homeless. The overwhelming majority of the families (50 of 56) were sheltered and 34% (or 19 families) reported Aboriginal identity. The sheltered families were accompanied by 48 children, while those on the streets had six children with them, including one family with five children found in Surrey.31 Eighteen of the 50 families found in shelters were in emergency shelters while the remaining 32 were in transition houses. As one would also expect, 47 of the 56 were also headed by females.
30 Totals for all years are calculated based on number of surveys. 31 These are included in the 74 accompanied children counted in the overall homeless population and reported in Table 4.1.
TABLE 20: TRENDS IN SENIOR HOMELESS POPULATION30
Age Surveyed Homeless 2002
Surveyed Homeless 2005
Surveyed Homeless 2008
Surveyed Homeless 2011
# % # % # % # %
Age 55 to 64 37 72% 139 78% 180 84% 156 78%
Age 65 and up 14 28% 32 22% 32 16% 45 22%
Total Respondents 51 100% 171 100% 212 100% 201 100%
Unknown 61 78 104 262
Total 112 249 316 463
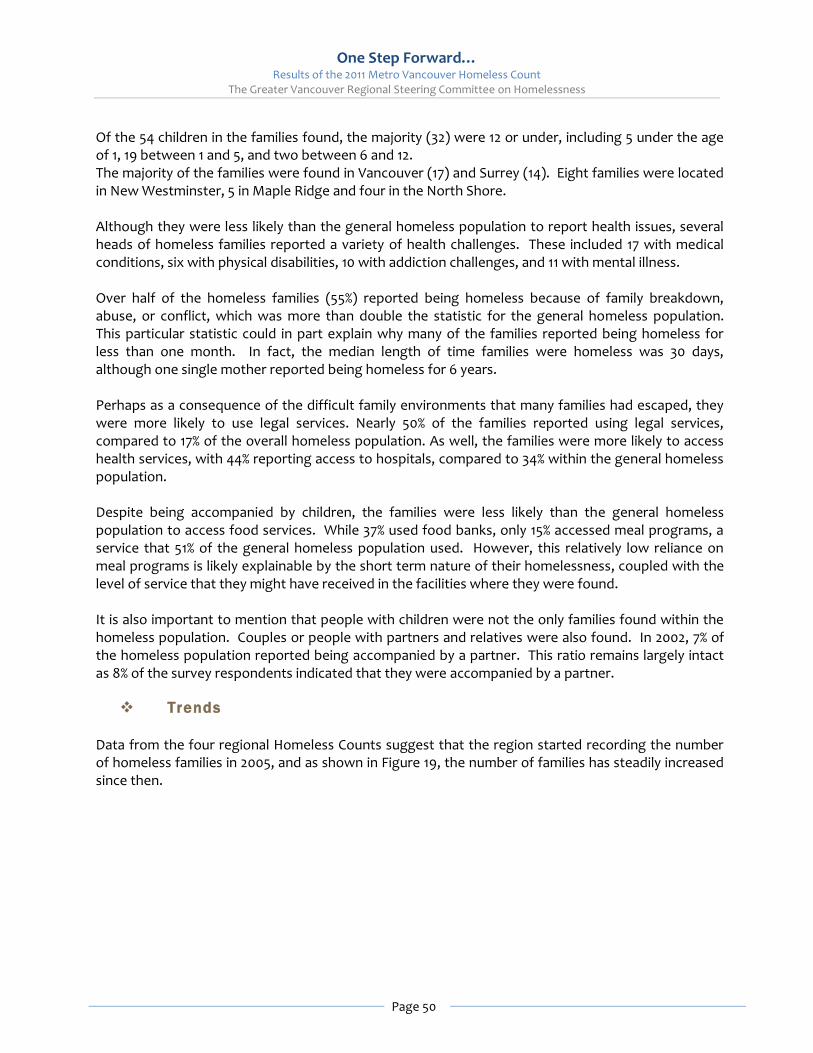
One Step Forward… Results of the 2011 Metro Vancouver Homeless Count
The Greater Vancouver Regional Steering Committee on Homelessness
Page 50
Of the 54 children in the families found, the majority (32) were 12 or under, including 5 under the age of 1, 19 between 1 and 5, and two between 6 and 12. The majority of the families were found in Vancouver (17) and Surrey (14). Eight families were located in New Westminster, 5 in Maple Ridge and four in the North Shore. Although they were less likely than the general homeless population to report health issues, several heads of homeless families reported a variety of health challenges. These included 17 with medical conditions, six with physical disabilities, 10 with addiction challenges, and 11 with mental illness. Over half of the homeless families (55%) reported being homeless because of family breakdown, abuse, or conflict, which was more than double the statistic for the general homeless population. This particular statistic could in part explain why many of the families reported being homeless for less than one month. In fact, the median length of time families were homeless was 30 days, although one single mother reported being homeless for 6 years. Perhaps as a consequence of the difficult family environments that many families had escaped, they were more likely to use legal services. Nearly 50% of the families reported using legal services, compared to 17% of the overall homeless population. As well, the families were more likely to access health services, with 44% reporting access to hospitals, compared to 34% within the general homeless population. Despite being accompanied by children, the families were less likely than the general homeless population to access food services. While 37% used food banks, only 15% accessed meal programs, a service that 51% of the general homeless population used. However, this relatively low reliance on meal programs is likely explainable by the short term nature of their homelessness, coupled with the level of service that they might have received in the facilities where they were found. It is also important to mention that people with children were not the only families found within the homeless population. Couples or people with partners and relatives were also found. In 2002, 7% of the homeless population reported being accompanied by a partner. This ratio remains largely intact as 8% of the survey respondents indicated that they were accompanied by a partner.
Trends
Data from the four regional Homeless Counts suggest that the region started recording the number of homeless families in 2005, and as shown in Figure 19, the number of families has steadily increased since then.
One Step Forward… Results of the 2011 Metro Vancouver Homeless Count
The Greater Vancouver Regional Steering Committee on Homelessness
Page 51
FIGURE 19: HOMELESS FAMILIES
8.7 New Canadians
In an effort to orient services to new Canadians who are finding themselves homeless in the region, respondents were asked to indicate whether they considered themselves newcomers to Canada. Table 21 shows that 58 people or 3.4% of the survey respondents said that they were newcomers to Canada. The Table also suggests that the newcomers were more likely to be sheltered than unsheltered, representing 9% and 2% respectively of the sheltered and unsheltered populations. The profile of the newcomer population suggests that 30% were Asian, 21% European/Caucasian, 20% Hispanic, 9% African-Canadian, 7% Francophone and 5% Indo-Canadian. Newcomers also had a higher proportion of women (39%) than the overall population (30%). As well, newcomers used fewer services than the overall homeless population – the most used services were job help, health clinics and the emergency room. Most newcomers reported no source of income, and 28% said they were employed. As this question was posed in English, it is likely some newcomers were missed due to language barriers. The likelihood of this is underscored by the fact that 36 or 62% of those who responded to the question also said that they required services in a language other than English.
40 43
56
0
10
20
30
40
50
60
2005 2008 2011
Nu
mb
er
Count Year
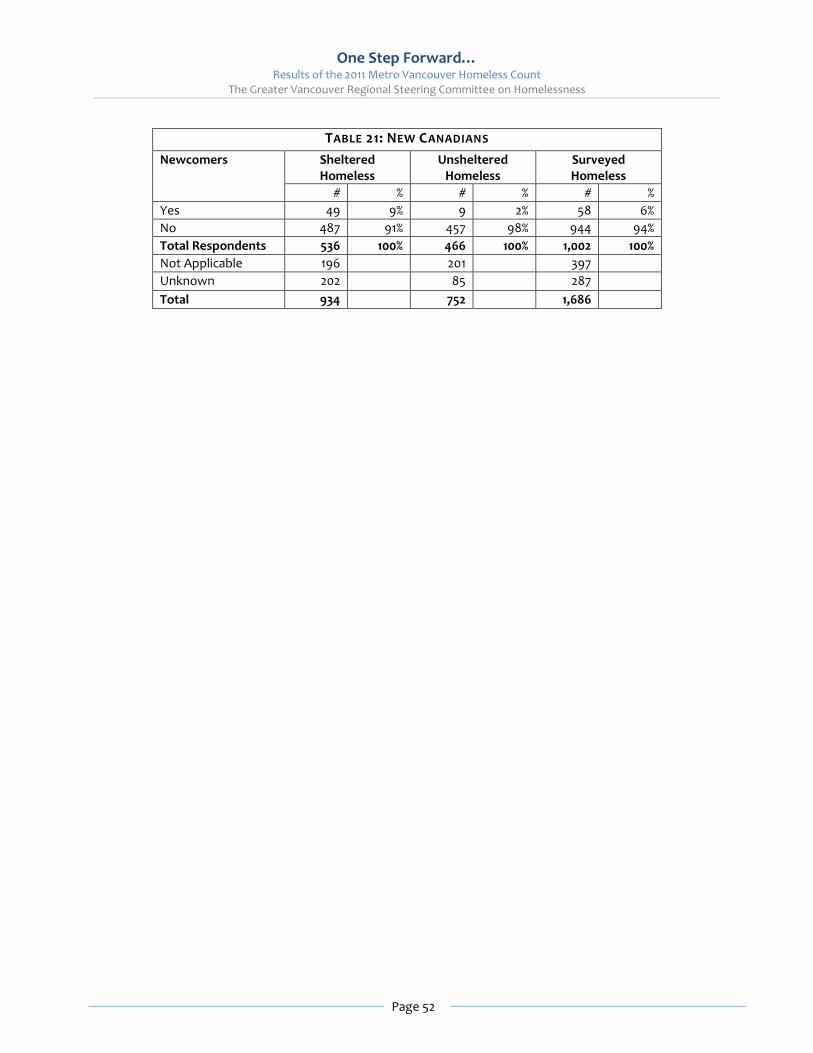
One Step Forward… Results of the 2011 Metro Vancouver Homeless Count
The Greater Vancouver Regional Steering Committee on Homelessness
Page 52
TABLE 21: NEW CANADIANS
Newcomers Sheltered Homeless
Unsheltered Homeless
Surveyed Homeless
# % # % # %
Yes 49 9% 9 2% 58 6%
No 487 91% 457 98% 944 94%
Total Respondents 536 100% 466 100% 1,002 100%
Not Applicable 196 201 397
Unknown 202 85 287
Total 934 752 1,686

One Step Forward… Results of the 2011 Metro Vancouver Homeless Count
The Greater Vancouver Regional Steering Committee on Homelessness
Page 53
9. MUNICIPAL HOMELESS POPULATION
9.1 Introduction
This Chapter provides an overview of the minimum number of homeless found within the municipalities participating in the Count. Community Homelessness Tables provided local context to increase understanding on changes or trends since the 2008 Count.32 Although there are 24 local authorities in the region, for the purpose of the Count and this Chapter, the region is consolidated into eleven sub-regions: Burnaby, Delta, Langley (City of Langley & Langley Township), Maple Ridge/Pitt Meadows, New Westminster, North Shore (North Vancouver District, North Vancouver City and West Vancouver), Richmond, Surrey, Tri-Cities (Coquitlam, Port Coquitlam, Port Moody), Vancouver and White Rock. 9.2 Total Homeless Found
Table 22 shows the distribution of the total homeless or 2,650 people found on March 15 and 16 across the eleven sub-regions. Three out of every four homeless people were found in either Vancouver or Surrey, with Vancouver having the largest concentration (60%), followed by Surrey (15%). The balance of the homeless found was distributed across the remaining nine sub-regions with no more than 5% in any other sub-region.
TABLE 22: TOTAL HOMELESS BY SUB-REGION FOUND
Sub-region Sheltered Unsheltered Total
Adults & Unaccompanied
Youth
Accompanied Children
No Fixed Address
Adults & Unaccompanied
Youth
Accompanied Children
Homeless % of Homeless
Burnaby 6 2 0 70 0 78 3%
Delta 0 0 1 5 0 6 0.2%
Langley 39 3 1 60 0 103 4%
Maple Ridge 39 7 1 63 0 110 4%
New Westminster 79 9 3 41 0 132 5%
North Shore 61 6 0 54 1 122 5%
Richmond 13 2 0 34 0 49 2%
Surrey 142 17 11 225 5 400 15%
Tri-Cities 16 3 1 28 0 48 2%
Vancouver 1,317 19 91 154 0 1,581 60%
White Rock 0 0 0 8 0 8 0.3%
Unspecified 0 0 3 10 0 13 0.5%
TOTAL 1,712 68 112 752 6 2,650 100%
32 A detailed profile of homelessness in municipalities where significant homeless populations were found will be released following consultations with the Community Homelessness Tables on the nature of the profiles
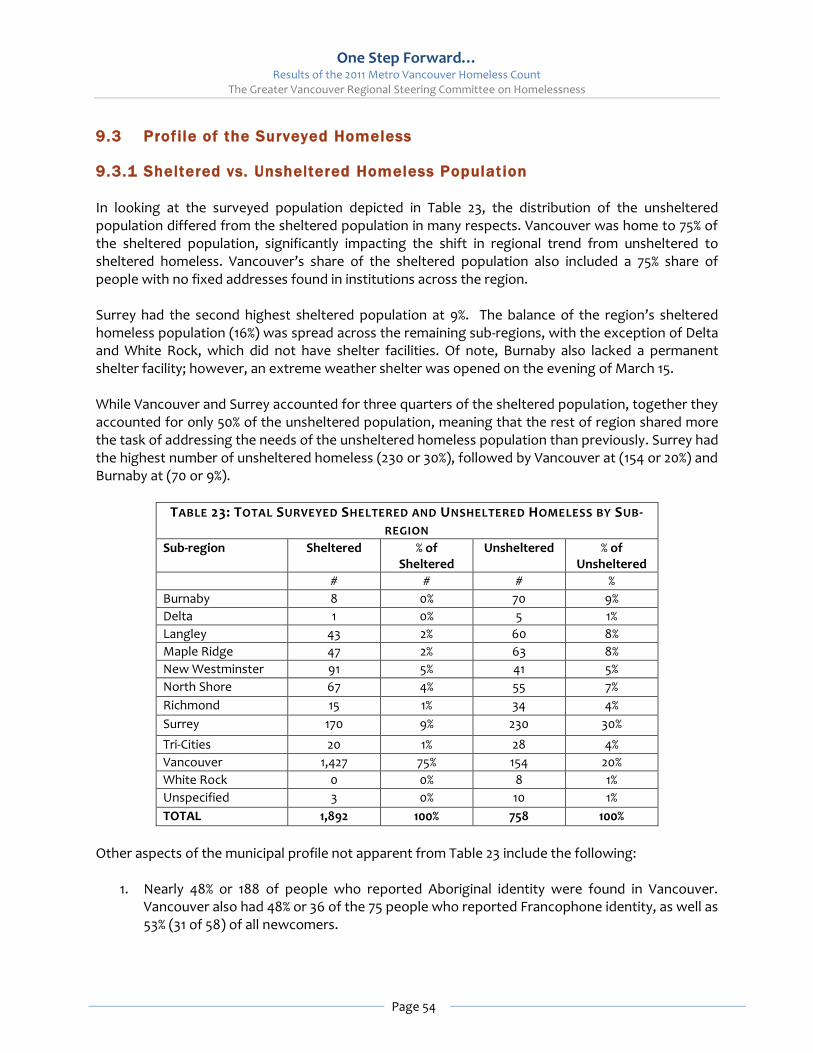
One Step Forward… Results of the 2011 Metro Vancouver Homeless Count
The Greater Vancouver Regional Steering Committee on Homelessness
Page 54
9.3 Profile of the Surveyed Homeless
9.3.1 Sheltered vs. Unsheltered Homeless Populat ion
In looking at the surveyed population depicted in Table 23, the distribution of the unsheltered population differed from the sheltered population in many respects. Vancouver was home to 75% of the sheltered population, significantly impacting the shift in regional trend from unsheltered to sheltered homeless. Vancouver’s share of the sheltered population also included a 75% share of people with no fixed addresses found in institutions across the region. Surrey had the second highest sheltered population at 9%. The balance of the region’s sheltered homeless population (16%) was spread across the remaining sub-regions, with the exception of Delta and White Rock, which did not have shelter facilities. Of note, Burnaby also lacked a permanent shelter facility; however, an extreme weather shelter was opened on the evening of March 15. While Vancouver and Surrey accounted for three quarters of the sheltered population, together they accounted for only 50% of the unsheltered population, meaning that the rest of region shared more the task of addressing the needs of the unsheltered homeless population than previously. Surrey had the highest number of unsheltered homeless (230 or 30%), followed by Vancouver at (154 or 20%) and Burnaby at (70 or 9%).
TABLE 23: TOTAL SURVEYED SHELTERED AND UNSHELTERED HOMELESS BY SUB-REGION
Sub-region Sheltered % of Sheltered
Unsheltered % of Unsheltered
# # # %
Burnaby 8 0% 70 9%
Delta 1 0% 5 1%
Langley 43 2% 60 8%
Maple Ridge 47 2% 63 8%
New Westminster 91 5% 41 5%
North Shore 67 4% 55 7%
Richmond 15 1% 34 4%
Surrey 170 9% 230 30%
Tri-Cities 20 1% 28 4%
Vancouver 1,427 75% 154 20%
White Rock 0 0% 8 1%
Unspecified 3 0% 10 1%
TOTAL 1,892 100% 758 100%
Other aspects of the municipal profile not apparent from Table 23 include the following:
1. Nearly 48% or 188 of people who reported Aboriginal identity were found in Vancouver. Vancouver also had 48% or 36 of the 75 people who reported Francophone identity, as well as 53% (31 of 58) of all newcomers.
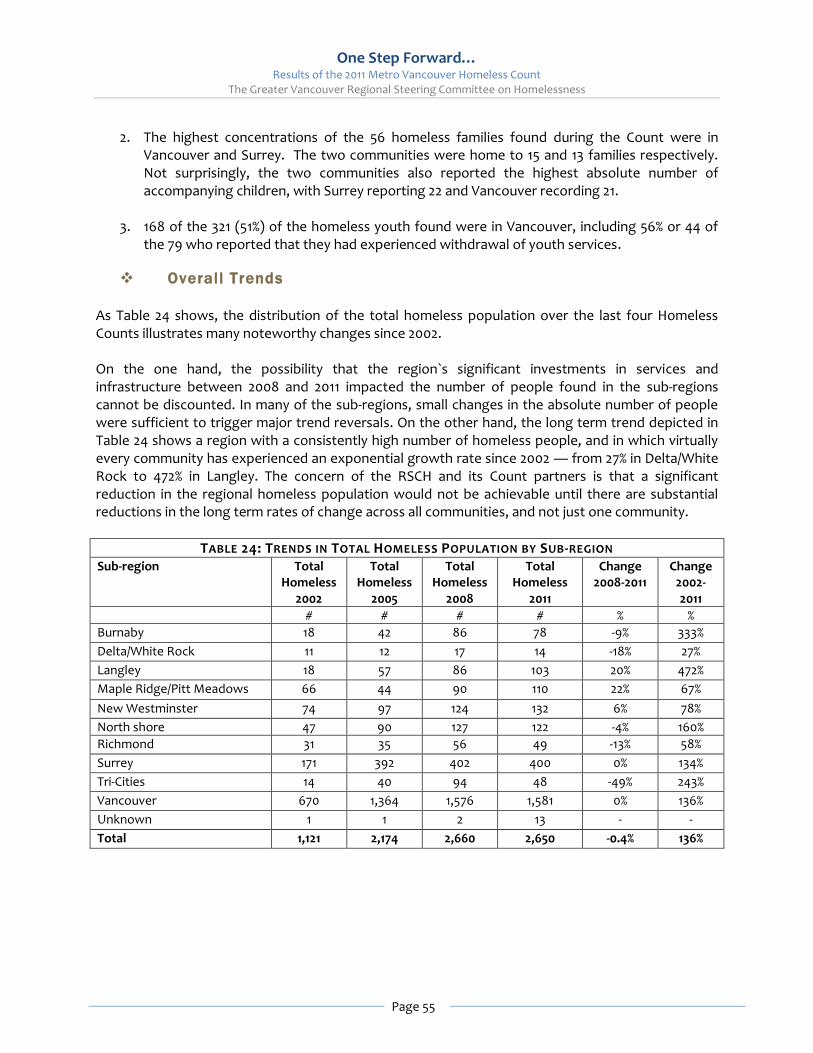
One Step Forward… Results of the 2011 Metro Vancouver Homeless Count
The Greater Vancouver Regional Steering Committee on Homelessness
Page 55
2. The highest concentrations of the 56 homeless families found during the Count were in Vancouver and Surrey. The two communities were home to 15 and 13 families respectively. Not surprisingly, the two communities also reported the highest absolute number of accompanying children, with Surrey reporting 22 and Vancouver recording 21.
3. 168 of the 321 (51%) of the homeless youth found were in Vancouver, including 56% or 44 of the 79 who reported that they had experienced withdrawal of youth services.
Overall Trends
As Table 24 shows, the distribution of the total homeless population over the last four Homeless Counts illustrates many noteworthy changes since 2002. On the one hand, the possibility that the region`s significant investments in services and infrastructure between 2008 and 2011 impacted the number of people found in the sub-regions cannot be discounted. In many of the sub-regions, small changes in the absolute number of people were sufficient to trigger major trend reversals. On the other hand, the long term trend depicted in Table 24 shows a region with a consistently high number of homeless people, and in which virtually every community has experienced an exponential growth rate since 2002 ― from 27% in Delta/White Rock to 472% in Langley. The concern of the RSCH and its Count partners is that a significant reduction in the regional homeless population would not be achievable until there are substantial reductions in the long term rates of change across all communities, and not just one community.
TABLE 24: TRENDS IN TOTAL HOMELESS POPULATION BY SUB-REGION
Sub-region Total Homeless
2002
Total Homeless
2005
Total Homeless
2008
Total Homeless
2011
Change 2008-2011
Change 2002-2011
# # # # % %
Burnaby 18 42 86 78 -9% 333%
Delta/White Rock 11 12 17 14 -18% 27%
Langley 18 57 86 103 20% 472%
Maple Ridge/Pitt Meadows 66 44 90 110 22% 67%
New Westminster 74 97 124 132 6% 78%
North shore 47 90 127 122 -4% 160%
Richmond 31 35 56 49 -13% 58%
Surrey 171 392 402 400 0% 134%
Tri-Cities 14 40 94 48 -49% 243%
Vancouver 670 1,364 1,576 1,581 0% 136%
Unknown 1 1 2 13 - -
Total 1,121 2,174 2,660 2,650 -0.4% 136%

One Step Forward… Results of the 2011 Metro Vancouver Homeless Count
The Greater Vancouver Regional Steering Committee on Homelessness
Page 56
Local Trends
In the three years between the 2008 and 2011 Counts, the overall regional homeless population showed a remarkable degree of stability against a challenging social and economic regional environment. Overall growth slowed to 0.4%, with the major population centres reporting no growth at all statistically. Despite overall growth stabilizing in Vancouver and Surrey, governments, community service and housing providers noted several local changes in the homeless population since 2008. In Vancouver, the role of shelters in exiting homelessness was noted as significant, especially in terms of expanding shelter spaces for people with significant barriers to traditional shelters. Food security and nutrition was especially important in low-barrier shelters which assisted in meeting basic needs first before integrating other services to assist with health and housing services. Culturally appropriate shelters and services, such as the 201 Central Aboriginal shelter, also worked effectively to assist people within their cultural communities. Stakeholders in Surrey indicated that a high number of vulnerable “at-risk” or hidden homeless people were not included in the 2011 Homeless Count as a result of people staying in informal addiction recovery houses (only recovery houses operated by the Fraser Health Authority were included in the 2011 Count). Many addiction recovery houses in Surrey were subject to closure on grounds of building maintenance standard violations or for client abuse, if discovered. Outreach workers reported being aware of several people who would not have had places to return to (people with no fixed address) without the recovery houses. This underscored the need for more detox and drug and alcohol recovery centres to prevent cycles of homelessness in the community. Surrey also had the highest number of unsheltered Aboriginal homeless and stakeholders noted that there was a large number of young female sex trade workers, which emphasized the need for both Aboriginal and women's shelter and housing solutions in the community. Lastly, homeless families were identified as a significant issue in Surrey. New Westminster experienced minimal growth in the found homeless population between 2008 and 2011. Community service providers noted that many families were homeless and “at-risk” of homelessness in New Westminster. They noted that the shelter servicing women and children was consistently full and there remained a high demand for food banks and soup kitchens. The number of people who were homeless and stayed with family or friends was also significant, especially given the number of shelters in the area. The need to create long term supportive and transitional housing, especially for families and those wishing to get off the streets and shelters with transitional assistance was as an urgent need recognized by community stakeholders. In Maple Ridge/Pitt Meadows, youth accounted for much of the growth in the homeless population, while in Langley increases in the sheltered population due to the opening of a new shelter and an increase in homeless youth were offered as potential explanations.33 Specifically, it was noted that in Maple Ridge/Pitt Meadows, while seven youth were found in 2008, 24 were found in 2011. In Langley,
33 Opened in November 2009.
One Step Forward… Results of the 2011 Metro Vancouver Homeless Count
The Greater Vancouver Regional Steering Committee on Homelessness
Page 57
not only did the number of youth found in 2008 double in 2011 (from 9 to 18), but also there were 19 more sheltered homeless in 2011 than in 2008. Both Langley and Maple Ridge felt the need to build more integrative services, including specialized integrative services for youth, to address local homelessness issues. Langley also felt the need to revitalize the volunteer community involved in servicing many of the homelessness programs, as well as address issues of food security and a fragile low-income housing stock undergoing rapidly physical deterioration. In Burnaby, where the numbers appeared to be slightly lower than in 2011, it is significant to note that the overall growth since 2002 is approximately 333%, and the difference between 2008 and 2011 is likely more an indication of saturation rather than population decrease. Due to heavy rains in the evening of March 15, the fact that Burnaby does not have a permanent shelter may also have compromised the counting of those who typically slept outdoors at locations known to Burnaby outreach teams. As well, an increase in mobile outreach services was seen as part of the explanation for the stabilization in the numbers, although there remained a high population of long term homeless in Burnaby. Burnaby also recorded had a younger than average homeless population (median age of 35 years compared to 40 for the region), many of whom grew up in Burnaby and were unlikely to access services in areas outside of the municipality. Specialized services, emergency shelter and affordable housing were seen as needed in Burnaby to address homelessness in the community. Of all the eleven sub-regions covered by the Count, the Tri-Cities saw the highest reduction in number of homeless people (minus 49%) between 2008 and 2011. However, again it is important to note that the overall growth in the number of homeless people since 2002 is remained very high at 243%. The success of outreach in the Tri-Cities was enhanced by the close link between outreach workers and addictions recovery beds within the same community organization. The community suggested that outreach had proven three times more successful in assisting people who were homeless to leave the streets, especially over the winter months when the Cold Wet Weather (CWW) Map Program operated. Specialized approaches to reach the large number of long term homeless as well as a permanent shelter were seen as needed and critical to the sub-region's targeted approach to eliminating homelessness.
9.4 Time Spent in Municipality
As has been done in the preceding Chapters, the following analysis of the homeless found in the eleven sub-regions is based on the surveyed population rather than the total homeless population reported in Table 9.134 As was the case in previous Counts, respondents to the 2011 Count survey were asked how long they had lived in the municipality in which they were found. This question was asked to determine the degree of mobility within the homeless community, and also address perceptions that homeless people migrate from one municipality to the next to access services.
34 The value of using the surveyed population as the basis of analysis lies in the depth of investigation that is possible to inform discussion and decision-making.

One Step Forward… Results of the 2011 Metro Vancouver Homeless Count
The Greater Vancouver Regional Steering Committee on Homelessness
Page 58
Table 25 below shows that the vast majority of the respondents were not new to the municipality where they were found. Three out of four (75%) had been in the municipality longer than one year, including 42% that had been there for 10 years or more. Across the sheltered and unsheltered populations, the unsheltered population was more likely to have been in the municipality where they were found longer, with nearly 85% reporting that they had been in their municipality for one year or more, compared to 65% of the sheltered population.
TABLE 25: LENGTH OF TIME IN MUNICIPALITY
Length of Time Sheltered Homeless
Unsheltered Homeless
Surveyed Homeless
# % # % # %
Less than 1 year 275 34% 104 15% 379 25%
1 year to under 5 years 130 16% 166 23% 296 19%
5 years to under 10 years 91 11% 107 15% 198 13%
10 years or more 308 38% 337 47% 645 42%
Total respondents 804 100% 714 100% 1,518 100%
Unknown 21 38 59
Not asked 109 - 109
Total 913 752 1,686
In looking at municipalities of the region, the majority of the homeless in each municipality reported being in the municipality for one year or more. In smaller centres like Delta and White Rock, all the people found reported being in the municipality for one year or more. In Richmond 91% of the population reported being residents for one year or more, and in the Tri-Cities 81% reported the same amount of time spent. Seventy-eight percent (78%) of those found in Surrey and 76% of those found in Vancouver reported themselves as residents over the same period.
Trends
The question about time spent in a municipality was first asked in 2008, and a comparison of the 2008 and 2011 data suggests that people marginally spent shorter lengths of time on average in municipalities in 2011 than they did in 2008. Specifically, in 2008, 83% of respondents said that they had been in their municipality for one year or more, while 20% said they had been there for less than one year. As Table 9.4 shows, the comparative figures for 2011 were 75% and 25% respectively. Between the sheltered and unsheltered populations, the unsheltered population was more likely to have been in their municipality longer than their sheltered counterparts. In both 2008 and 2011, 85% of the unsheltered indicated that they had been in their municipalities for at least one year at the time of the Count. In comparison, 69% and 65% of the sheltered had been in their municipalities for at least one year in 2008 and 2011 respectively. 9.5 Place of Origin
In a further attempt to understand the migration patterns of the region’s homeless population, respondents to the Count survey were asked to indicate their place of origin. However, differences

One Step Forward… Results of the 2011 Metro Vancouver Homeless Count
The Greater Vancouver Regional Steering Committee on Homelessness
Page 59
in the way in which respondents interpreted the question appear to suggest that responses captured by the survey may be different, and must therefore be treated with some caution. For example, someone who reported that they were from somewhere else in Canada may have been born there, but lived most of their life — including years housed and possibly even employed — in BC. In other words, the propensity of people to have experienced a longer history within BC than what they reported to the Surveyor was quite possible, and they may even identify as a resident of BC. However, as reported in Table 26 below, nearly two out of five homeless people reported that they were from the Metro Vancouver region, compared to one in three from the rest of Canada, and one in five from other parts of BC. Among the unsheltered homeless, nearly one in two reported that they originated from the region. In contrast, only one in three of the sheltered population reported being from the region.
TABLE 26: PLACE OF ORIGIN
Where Came From Sheltered Homeless
Unsheltered Homeless
Surveyed Homeless
# % # % # %
Metro Vancouver 253 32% 316 48% 569 39%
Rest of BC 161 21% 110 17% 271 19%
Elsewhere in Canada 298 38% 198 30% 496 34%
Outside Canada 71 9% 37 6% 108 7%
Total Respondents 783 100% 661 100% 1,444 100%
Unknown _ _ 133
Not asked 109 _ 109
Total 892 661 1,686
Respondents were also asked what brought them to their current municipality. The top three reasons for both the sheltered and unsheltered populations were homeless services such as housing, outreach, food (25%), family and friends (20%) and work or a hope to find work (16%). Family and friends was a higher priority for the unsheltered homeless population than it was for the sheltered (26% and 16% respectively). Sheltered homeless were more likely to arrive for work or in search of work than the unsheltered (18% versus 14%).
Trends
Due to the change in the wording of this question, trends over Count years cannot be easily identified. In 2002 and 2005 the question was “in what city was your last permanent home,” while in 2008, the question was “where do you call home.” This year’s question, “where do you come from,” is significantly different; however there are points of interest to be made:
“Born here, raised here.”
One Step Forward… Results of the 2011 Metro Vancouver Homeless Count
The Greater Vancouver Regional Steering Committee on Homelessness
Page 60
o In 2002 and 2005, over 70% responded that their last permanent home was in Greater
Vancouver. This indicates that they may have had a fixed address in the region before becoming homeless.
o In 2008, again, over 70% responded that somewhere in the Metro Vancouver was their home.
o In 2011, only 40% responded that the Metro Vancouver was where they “came from”. As mentioned earlier, due to the interpretation of the question, it is questionable whether the character of homeless population changed by 30% in three years.

One Step Forward… Results of the 2011 Metro Vancouver Homeless Count
The Greater Vancouver Regional Steering Committee on Homelessness
Page 61
10. CONCLUDING NOTES
This report shows considerable advancement against a previously intractable problem of homelessness in the Metro Vancouver region. However, the progress described represents but one step in the region`s effort to prevent, reduce and ultimately eliminate homelessness. As with any lasting endeavor, each progress or milestone must be sustained to prevent retreat or regression. The framework for sustaining progress includes the recognition that:
Action matters. The successes of the region narrated in this report became possible only when governments and communities put resources behind ideas, ideas that often challenged conventional wisdom. More such actions would be required to take more steps forward in the future.
There is still more to be done. The region cannot be comforted by the progress made so far, let alone be lulled into a false notion that arresting the growth in homelessness evidenced in this report is “mission accomplished,” as the achievements noted neither satisfy the long term interests of those who remain on our streets and in our shelters, and are waiting to be placed in affordable and adequate housing, nor fulfill the community`s long-held goal of ending homelessness.
Investments must continue. Achieving the regional goal of eliminating homelessness requires the community to continue to invest in a mix of infrastructure and services that serve as catalysts for people to exit homelessness and avoid the lack of initiatives that could create conditions for street entrenchment. This means continuing to invest in supportive housing for those who need assistance to remain housed; in programs and services for special populations that cannot be accommodated by regular facilities and services, such as seniors, women, families, youth and Aboriginal people; in employment opportunities for those that are able to work and need to earn income and maintain dignity; and most of all, in affordable housing to prevent those who are on the margins from becoming homeless.
The community must contribute. The amount of work that remains to be done is quite significant. In an era of fiscal restraint and belt tightening, there is little doubt that governments will be restrained in their expenditures and make choices as to where they wish to invest their resources. Offsetting these expected tough choices to keep the momentum generated in the last few years going will require the community to contribute financial and in-kind resources. This includes businesses, non-profits, foundations, the faith community, as well as individuals.
Action must be favoured over inaction. The concerted community efforts of the last few years have allowed it to prove to itself that positive steps result in positive change, and that inaction has consequences, human as well as economic. Homelessness is not an isolated community burden; it has connections to and ramifications for other problems in all communities, unemployment, substance abuse and family breakdown, to name just a few. The community must envision a region of people with few, not more, of these challenges.

One Step Forward… Results of the 2011 Metro Vancouver Homeless Count
The Greater Vancouver Regional Steering Committee on Homelessness
Page 62
APPENDICES
1 Survey Instruments

One Step Forward… Results of the 2011 Metro Vancouver Homeless Count
The Greater Vancouver Regional Steering Committee on Homelessness
Page 63
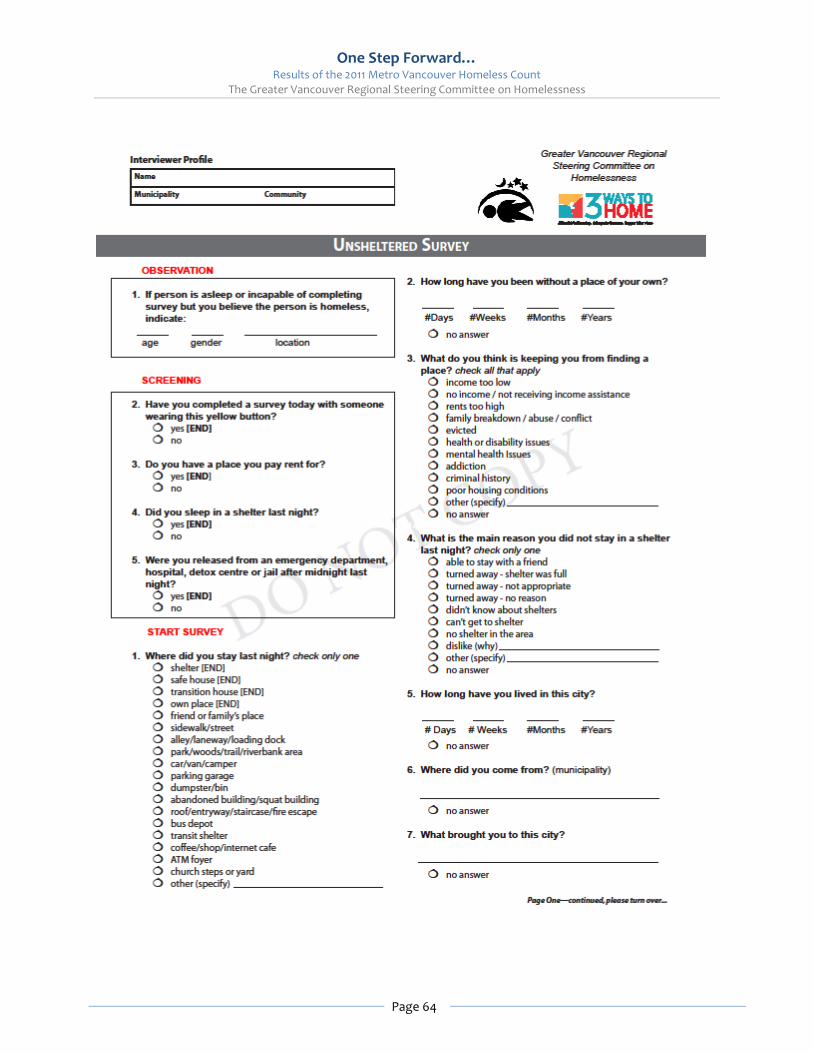
One Step Forward… Results of the 2011 Metro Vancouver Homeless Count
The Greater Vancouver Regional Steering Committee on Homelessness
Page 64

One Step Forward… Results of the 2011 Metro Vancouver Homeless Count
The Greater Vancouver Regional Steering Committee on Homelessness
Page 65

One Step Forward… Results of the 2011 Metro Vancouver Homeless Count
The Greater Vancouver Regional Steering Committee on Homelessness
Page 66
2 No Fixed Address Locations
Health & Rehab Centres
BC Women’s Hospital & Health Centre FSGV Detox, South Vancouver GF Strong Rehab Centre, Vancouver Langley Memorial Hospital St. Paul’s Hospital Phoenix Centre Ridge Meadows Hospital Royal Columbian Hospital Surrey Creekside Surrey Memorial Hospital UBC Hospital Vancouver Coastal Health -- Mental Health Programs Vancouver General Hospital
Police Units Delta Police Department Port Moody Police Department RCMP ‘Division E’ – Lower Mainland District Vancouver Police Department