Embed Size (px)
Citation preview
1
Christian Aid Occasional Paper No. 2 April 2009
One size fits all? IMF tax policy in sub-Saharan Africa John Marshall Abstract Examining tax-policy recommendations spanning the period 1998-2008 from all available official International Monetary Fund (IMF) papers for 18 economies in sub-Saharan Africa, this paper shows that there is strong empirical support for the claim that the IMF has promoted the ‘tax consensus’ – often in spite of evidence that the implied policies are failing to meet their objectives. Looking at how policy recommendations differ across time and country reveals that many of the central tenets of the tax consensus are uniformly promoted by the IMF regardless of important country-specific characteristics. Consequently, many countries are failing to realise the critical economic, social and political benefits associated with effective and inclusive taxation.
Christian Aid’s Occasional Paper (OP) series reflects work carried out by Christian Aid staff and others on a range of development topics. Although OPs are addressed to an audience including policy-makers, academics, the media, other non-governmental organisations and the general public, some prior knowledge of the topic may be needed to understand fully some of the papers.
Disclaimer: OPs are published in the name of the author(s). Their views do not necessarily reflect those of Christian Aid and should not be so attributed.
2
Introduction After many years of relative neglect in development thinking, tax policy is again being given more serious attention. A functioning state that can meet the basic needs of its citizens must rely ultimately on its own revenues to meet developmental objectives. Aid flows are not only often volatile1 and sensitive to political variables,2 but in the longer term domestic revenues are required to maintain aid-funded programmes and to compensate for the potential loss of revenues from structural reforms such as trade liberalisation.3 However, a strong tax policy serves a number of other key functions:4
• effective tax structures create incentives to improve governance, strengthening and protecting channels of political representation5 as well as fostering inclusion and reducing corruption
• it has the capacity to redistribute wealth
• it may serve to efficiently re-price market equilibria to reflect the social costs and benefits, as in the case of ‘sin’ taxes (eg taxes on alcohol, tobacco etc).
Organisation for Economic Co-operation and Development (OECD) countries generally collect tax revenues of around 35 per cent of gross domestic product (GDP), or even higher. Over the past 25 years, tax revenues in sub-Saharan Africa have stagnated at levels often below 15 per cent of GDP, with the exceptions occurring primarily in resource-rich countries where revenue growth is principally attributable to governments more effectively capturing the benefits of their natural resources.6 While conflict has certainly played a role in some cases, the low level of tax revenues across poorer economies in general implies more systematic difficulties. A number of researchers have argued, either explicitly or implicitly, that at least some of the blame can be laid at the door of the ‘tax consensus’7 – a general set of principles which multilateral donors, in particular, have adhered to in their tax-policy recommendations to developing countries (see section 1 below). The conditions attached to the loans and technical assistance that the IMF provides, as well as the investor confidence that positive reports can inspire,8 make the IMF a powerful figure in policy evolution. It would however be wrong to overstate the IMF’s power to directly influence any specific government policy.9 The IMF is frequently singled out for criticism that its emphasis on fiscal austerity is to the detriment of key expenditures such as education and health.10 Less attention has been paid to the Fund’s responsibility for tax-policy recommendations. This paper examines the role of the IMF in promoting particular tax policies in 18 sub-Saharan African countries, drawing on official documents to create a unique dataset summarising Fund recommendations. In addition, a new dataset of tax revenues for each country is created. This allows analysis of the question of whether the IMF in practice attempts to impose a ‘one-size-fits-all’ tax policy on countries, regardless of their specific situation. Regrettably, the evidence presented is broadly supportive of this hypothesis for key areas of tax policy. Furthermore, where policies are sensitive to specific features they prove as likely to be wrong-headed as conforming to prudent theory.
3
Section 1: The ‘tax consensus’ ‘During recent decades, a powerful consensus has developed [which] has included not only the structure of taxes, but also the level of tax rates… to refuse to subscribe to it would be imprudent as well as incurring disapproval from [the IMF and World Bank].’11 The tax consensus can be summarised as requiring that countries aim for tax neutrality and typically for revenues of the order of 15-20 per cent.12 ‘Tax neutrality’ is the theoretical outcome in which the tax system does not change economic incentives (eg for efficient production, consumption, investment etc). In practice, tax neutrality implies a shift away from direct taxation (the taxation of income and profits) and from trade taxation, and towards consumption taxation. Any revenue losses should, in theory, be compensated for by increases in the tax base and the efficiency of collection. Redistribution will occur – if at all – through government expenditures, not via taxation. More specifically, the consensus has:
• encouraged reductions in the rates of corporate and, to a lesser extent, personal income taxation
• supported trade liberalisation (reduction of both export and import taxation)
• encouraged the introduction or expansion of sales taxes (and a value added tax, VAT, in particular), often including an element of regional harmonisation
• emphasised, especially in recent years, the need to reduce the number of incentives and exemptions across the tax code
• proposed significant structural overhauls to the tax administration. An important paper by Christopher Heady, head of tax policy and statistics at the OECD, highlights that the theoretical basis for the tax consensus rests on two key assumptions being met: first, ‘that the economy will deliver an efficient (Pareto-optimal) allocation of resources in the absence of distortionary taxes [and second], that there is a large variety of tax instruments available to the government.’13 If taxes are the only distortion present, then tax neutrality follows logically as a goal since the economy would otherwise deliver maximum efficiency. As Heady points out, these assumptions are ‘in some respects… clearly inappropriate’ for developing countries.14 First, governments typically will not have available a range of instruments to address goals of revenue mobilisation and of redistribution, especially in low-income countries. The inability of many governments to make direct cash transfers to households, for example, means that the distributive implications of tax cannot be ignored, and so many non-neutral tax and/or subsidy options should not simply be taken off the table. The second, and perhaps the more damning critique, is that the widespread presence of market failures means that the pre-tax economy will not be efficient. Basic economic theory therefore implies that many non-neutral tax options should at least be considered. The key prescription of aiming for tax neutrality, justified by the desire to avoid introducing economic distortions, may make little sense if the original situation is already characterised by serious deviations from the ‘perfect market’ outcome.
4
Direct taxes Suggested reductions in corporate and personal income tax rates are often justified by the argument that with increasing international competition, high direct tax rates can restrict and distort investment and hinder returns to other factors, such as labour.15 The value of reducing tax rates is challenged where: other important investment incentives, such as the rule of law, are missing options;16 the distributional impact may be regressive;17 and the location-specific nature of resource-rich countries enables some nations to escape downward international pressures.18 Although the possibility of tax-base expansion in response to lower rates receives limited support generally,19 the response is likely to be weakest in the least-developed countries, which are often characterised by large informal sectors and use direct taxes to partially address leakage in other parts of the tax system.20 Investment tax incentives are a controversial policy tool. In theory, incentives can be used to stimulate foreign and domestic investment, and their use is widespread. Research suggests that incentives create less distortion than lower or differentiated tax rates,21 and that incentives can secure investments with economies of scale.22 However, the IMF has sought to reduce such incentives as a means of ensuring budgetary balance, and sometimes of removing political discretion, and its staff have recently argued that incentives, especially tax holidays, can be ineffective in inducing long-term investment23 and expensive.24 The tax consensus ignores the use of property and wealth taxes. These may be politically difficult to levy,25 but can be strongly progressive26 and may be an optimal policy in the case of market distortions and instrument constraints.27 Trade taxes Trade liberalisation is a core element of the consensus. The argument for import-tariff reduction is that if a small economy reduces its tariffs, it increases the flow of imports that can face domestic consumption taxes, and so a well-administered rise in the consumption tax equivalent to the drop in the tariff will leave prices at the same level while raising greater revenue from a broader tax base. The liberalisation of both import and export rates may also be a dynamic engine for economic growth28 and for reducing inequality in the case of export taxes.29 In reality such gains are more complicated. First, the revenue response has proved to be very weak, particularly so in the poorest countries where trade taxes constitute a significant proportion of revenue.30 Second, more advanced modelling shows that import tariffs are welfare increasing, even for a revenue-neutral switch away from VAT in the presence of a large informal sector.31 Further, research suggests that a tariff on the untaxed sector may be imposed to protect the taxed sector.32 Third, the growth benefits of trade liberalisation appear to have been overstated,33 and the considerable range of experiences suggests that other economic features – including economies of scale and natural resource endowments – also matter. Indirect taxes A key tenet of the tax consensus has been the focus on indirect taxes34 – in particular a shift toward a VAT, which is often regionally harmonised. Consumption taxes are favoured because they are believed to minimise distortions,35 while a VAT is preferred to sales taxes because it need not distort input prices in the same way.36 The use of a harmonised VAT system across African trading blocs, which may increase the efficiency of production37 and tax administration38 while seeking to prevent a ‘race to the bottom’ for investment, investment volatility and cross-border smuggling, has also been supported in a number of regional trading zones.39 Although indirect taxes are not inherently regressive, the
5
distributional impact of indirect taxes depends on tax administration, the extent of the informal economy, the consumption bundles of different social groups, and whether the poor act as both consumers and producers of the same good.40 Although VAT is attractive in theory, a number of problematic issues often arise. First, the multiple rates critical to distributional concerns in the cases of inefficiencies41 are often ignored in favour of a simple revenue-maximising single-rate structure.42 Second, efficacious administration is difficult to achieve because of demanding book-keeping standards,43 and the potential for fraud which arises from the refundable nature of the VAT.44 Empirically, VAT does not appear to dramatically help collection compared to other sales taxes,45 and may be detrimental in poorer African countries where efficiency rates are significantly lower than in Europe.46 Moreover, indirect taxes when implemented have proved regressive,47 and appear to become more so as the economy develops.48 The use of excises and ‘sin’ taxes to address social externalities and raise revenue by taxing relatively income-inelastic goods has also proved popular in the tax consensus. However, the base has often been too broad, losing sight of its limited objectives.49 In particular, kerosene and paraffin taxes affecting both poor consumers and producers were quintessentially regressive in India,50 while ‘sin’ taxes have had highly variable distributional impacts.51 Tax base and administration Critical to IMF recommendations has been the view that developing economies can improve revenue mobilisation and become increasingly competitive, without the need to raise tax rates, by realising significant gains from streamlining the tax base and enhancing administrative efficiency.52 In particular, tax institutions need to be improved to encompass large taxpayers and agricultural- and informal-sector activity, but also to resist significant levels of evasion.53 A popular, albeit expensive and imperfect, organisational reform in sub-Saharan Africa is the introduction of semi-autonomous revenue authorities with separate legal status and which pay higher wages to increase compliance, catalyse broader tax reforms and replace weak civil services.54 However, these important aims are no simple task. First, effective micro- and top-level governance is required to perpetuate the successful operation of tax collection, but also to foster popular investment in the political system55 – a problem exacerbated by unpopular austerity programmes, whether IMF-initiated or not.56 Second, the presence of large agricultural or informal sectors increases the difficulty of this task.57 Third, to foster a desire to pay taxes the populace must feel represented and invested in the political system. Inferences Tax neutrality, strong revenue mobilisation and global competitiveness are highly attractive outcomes for any developing country. This first-best scenario seldom occurs in developing countries where the underlying prerequisites fail to hold, and this makes such prescriptions sub-optimal.58 IMF researchers Vito Tanzi and Howell Zee concluded that tax policy is ‘often the art of the possible rather than the pursuit of the optimal’.59 Effective tax policy must consider the complex structural and political realities that characterise individual countries. Some common tenets – such as removing export taxes, reducing some exemptions, expanding the tax base and improving administrative efficiency – can be agreed upon, but a one-size-fits-all approach is plainly insufficient.
6
Section 2: New data and overview of findings 1. Data Underpinning this paper are two new datasets created from IMF documents relating to sub-Saharan African countries. The unique dataset is one which summarises IMF tax-policy recommendations across a range of tax types and policy areas. The other is a new dataset of government revenue measures, with greater coverage and consistency than the IMF’s own Government Financial Statistics (GFS) database (see appendix 1 for details of this). The dataset of policy recommendations relies on analysis of publicly available IMF documents for 18 countries. Country selection, while limited by time constraints, is not random but based upon the selection of a wide range of country characteristics spanning wealth, economic growth, tax base, political conflict, geography and natural resources. The inclusion of IMF documents is defined by two criteria. First, case selection is restricted to official policy documents, specifically this includes: Article IV consultations (hereafter AIV); Poverty Reduction and Growth Facility (PRGF) papers; Policy Support Instrument (PSI) documents; Selected Issues (SI) papers where they address tax policy; Heavily Indebted Poor Country (HIPC) initiative documents; Policy Framework Papers (PFP); and staff programme assessment papers (ASSESS). Second, emphasis placed on future policy often precludes the use of essentially reflective documents such as Recent Economic Developments and some SI papers. Accordingly, policy recommendations are drawn from the broadest-possible range of official IMF country documents that contain forward-looking advice and assessments on a country’s tax system. Also examined for comparison are the government-written Poverty Reduction Strategy Papers (PRSPs). Although the independence of governments in preparing these has sometimes been questioned, these may shed some light on the extent to which government views differ. Research has found pro-poor spending initiatives contained in PRSPs often conflict with PRGF expenditure-reduction plans (notably in Ethiopia and Senegal),60 while compliance with fiscal conditions is less than perfect.61 The coverage of these papers across the 18 countries is varied and can be sporadic. Time-series can run from 1996 to 2008.62 The number of observations per country varies from five in Equatorial Guinea to 25 in Mozambique, with a mean of 12.4 per country. This considerable range is partly explicable by countries following different numbers of IMF programmes and frequencies of assessment. However, it also reflects the fact that most IMF documents are published only with the agreement of the member country. Selection bias is a potential problem given that it is reasonable to assume that countries are likely to want to shield critical documents from public inspection, especially given the IMF’s clout in international credit markets.63 In the case of Kenya, for example, very few documents are publicly available. However, any bias may be minimal if it is assumed that specific tax recommendations are unlikely to substantially influence investment flows or general confidence in government, or unlikely to be believed by governments to do so, and thus act as a reason to suppress publication and accordingly bias the publicly available sentiment of recommendations. If there is a bias towards the publication of less-critical documents, this may introduce a bias in favour of publication by countries where consensus policies are already in place, and hence may reduce the extent to which IMF recommendations appear to reflect the consensus.
7
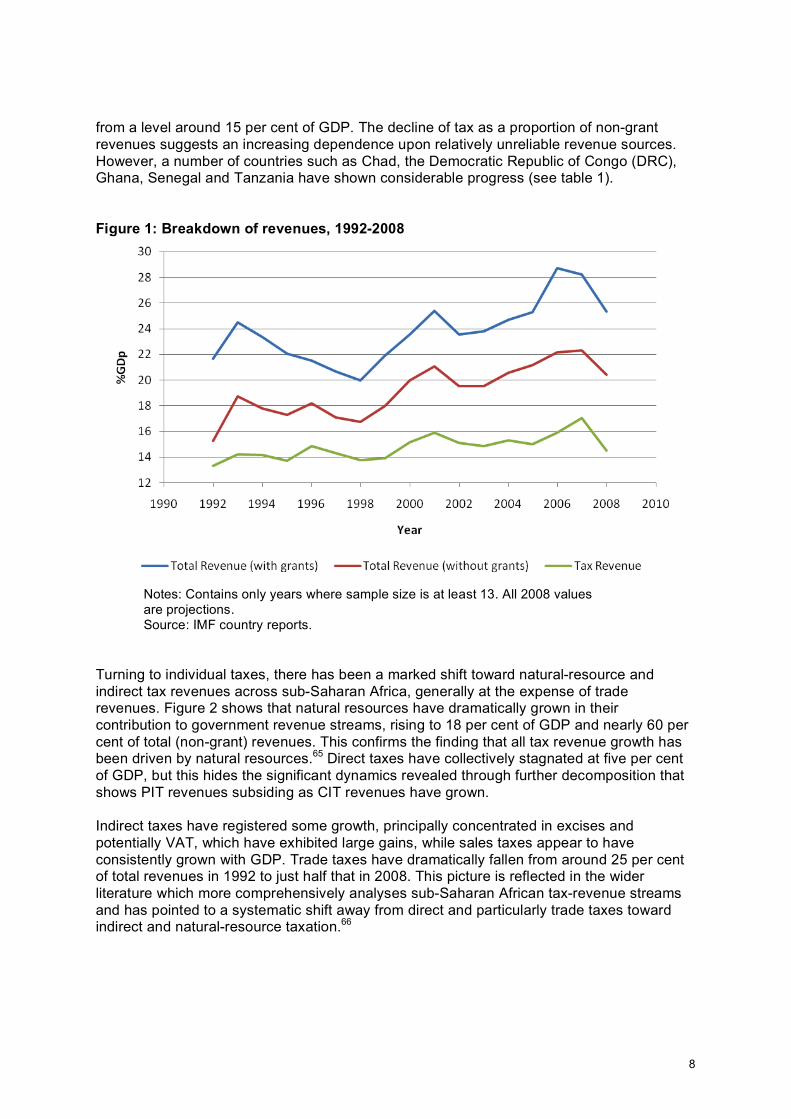
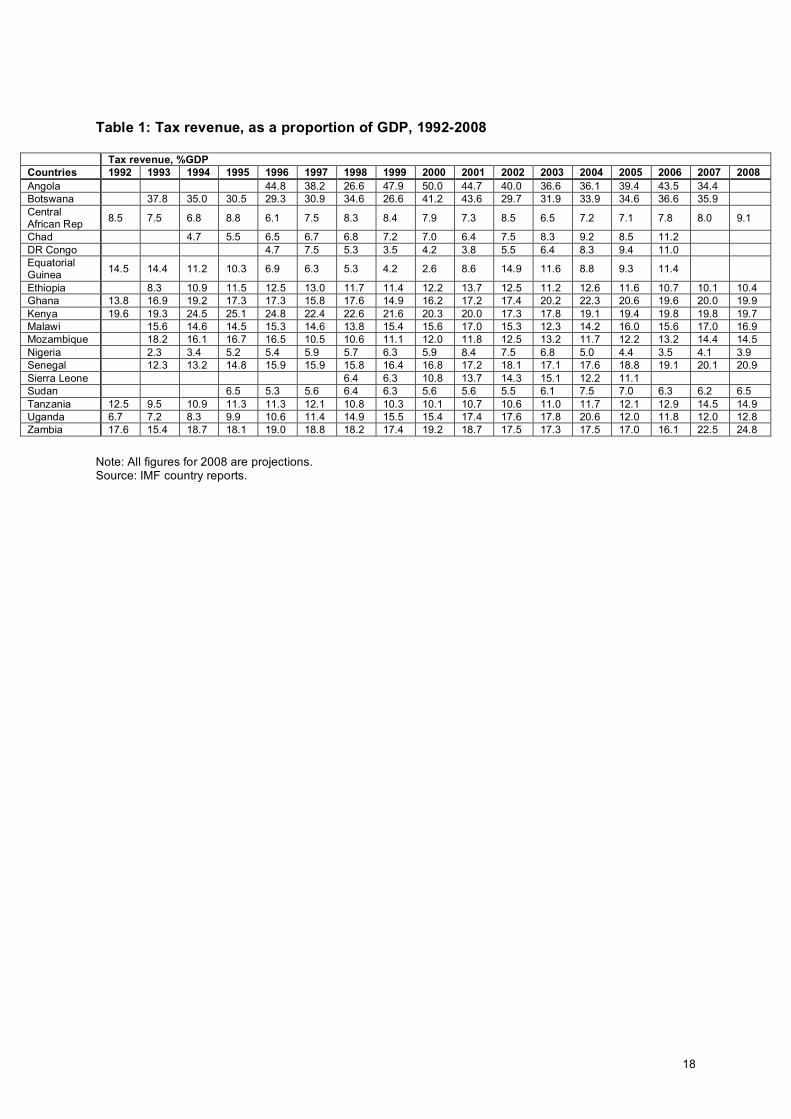
Policy positions are coded according to a simple distinction between recommendations to increase, decrease or maintain tax policies, and where no mention of changes is made. This is performed for tax rates, tax base, exemptions/incentives and administrative efficiency across a range of taxes that accord with the principal features of the tax consensus outlined in section 1: corporate income tax (CIT), personal income tax (PIT), property tax, wealth tax, VAT, non-VAT sales and stamp, excises (including petrol and ‘sin’ taxes), export taxes and duties, import taxes and tariffs, and natural-resource taxes. Changes in rates are determined to apply to changes in the actual tax rates of existing taxes (so newly introduced taxes do not register here) as well as alterations to thresholds that effectively change rates; this includes changes in sub-rates such as the CIT rate for agricultural firms. Alterations to the tax base include changes to coverage and the introduction and removal of taxes, and may also include changes in tax-rate thresholds where they are likely to affect the tax base. Efficiency recommendations pertain to tax administration and the expedition of tax procedures. Tax exemptions and incentives consider the use of tax holidays, low-tax zones and other investment-code incentives. Interpretation issues will arise. Where conflicting recommendations are made, the impact thought likely to dominate has been registered. Another issue of interpretation refers to tacit staff agreement with government policy. As the staff appraisal section of country papers is relatively unsubstantial and generally synoptic, recommendations primarily reside in the text’s consideration of upcoming and medium-term policy strategies, and therefore recommendations can be confused with simply outlining the government’s proposals. Accordingly recommendations are coded conservatively, veering against coding increases or decreases, where interpretation or tacit approval of policy is uncertain. The full dataset of recommendations and the original documents are available on request. A final issue of interpretation concerns the attribution of the views expressed in these official IMF documents – in particular whether it is reasonable to define these as the IMF view when IMF researchers include some of the leading thinkers globally on domestic taxation issues. In these official documents, the IMF has a direct opportunity to influence government policy. Research papers, on the other hand, which are not examined here, may be influential over time but only reflect the views of individual research staff. 2. Tax in sub-Saharan Africa Revenue streams in sub-Saharan Africa are typically much lower than those in the industrialised world. However, this simple observation hides both the heterogeneity across countries and the variety in composition of revenues. Figure 1 shows how relatively flat tax revenues on average have combined with increasing grant revenues for total average revenues that increased from around 20 per cent in 1998 to peak above 28 per cent in 2006. The averages are somewhat misleading compared to the country detail given in table 1 – for example, in the Central African Republic, Sierra Leone and Zambia grants have recently exceeded non-grant revenues, and could easily subside in the face of aid cuts during the global downturn and endanger essential social spending and investments. The major concern is weak tax/GDP ratios – the main source of sustainable revenue and a critical component in many developmental aims. Supporting the latest findings across sub-Saharan Africa,64 this sub-sample shows tax revenues have barely risen in the past 14 years
8
from a level around 15 per cent of GDP. The decline of tax as a proportion of non-grant revenues suggests an increasing dependence upon relatively unreliable revenue sources. However, a number of countries such as Chad, the Democratic Republic of Congo (DRC), Ghana, Senegal and Tanzania have shown considerable progress (see table 1). Figure 1: Breakdown of revenues, 1992-2008
Notes: Contains only years where sample size is at least 13. All 2008 values are projections. Source: IMF country reports.
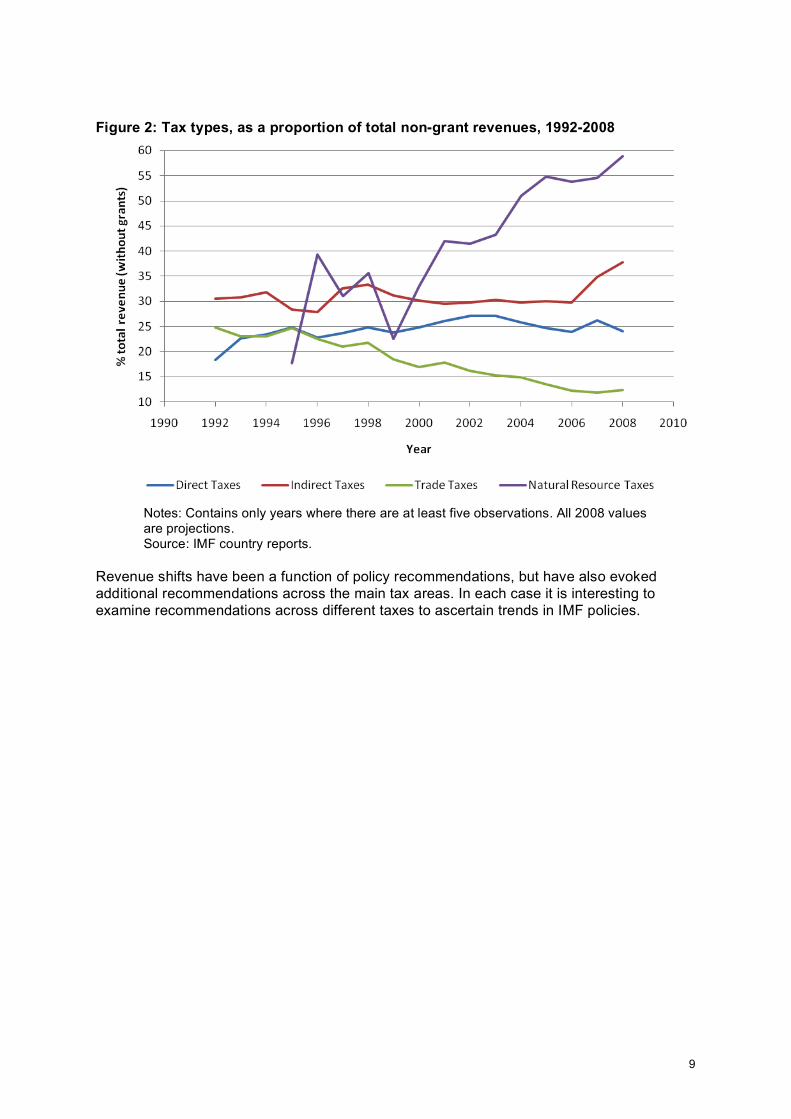
Turning to individual taxes, there has been a marked shift toward natural-resource and indirect tax revenues across sub-Saharan Africa, generally at the expense of trade revenues. Figure 2 shows that natural resources have dramatically grown in their contribution to government revenue streams, rising to 18 per cent of GDP and nearly 60 per cent of total (non-grant) revenues. This confirms the finding that all tax revenue growth has been driven by natural resources.65 Direct taxes have collectively stagnated at five per cent of GDP, but this hides the significant dynamics revealed through further decomposition that shows PIT revenues subsiding as CIT revenues have grown. Indirect taxes have registered some growth, principally concentrated in excises and potentially VAT, which have exhibited large gains, while sales taxes appear to have consistently grown with GDP. Trade taxes have dramatically fallen from around 25 per cent of total revenues in 1992 to just half that in 2008. This picture is reflected in the wider literature which more comprehensively analyses sub-Saharan African tax-revenue streams and has pointed to a systematic shift away from direct and particularly trade taxes toward indirect and natural-resource taxation.66
9
Figure 2: Tax types, as a proportion of total non-grant revenues, 1992-2008
Notes: Contains only years where there are at least five observations. All 2008 values are projections. Source: IMF country reports.
Revenue shifts have been a function of policy recommendations, but have also evoked additional recommendations across the main tax areas. In each case it is interesting to examine recommendations across different taxes to ascertain trends in IMF policies.
10
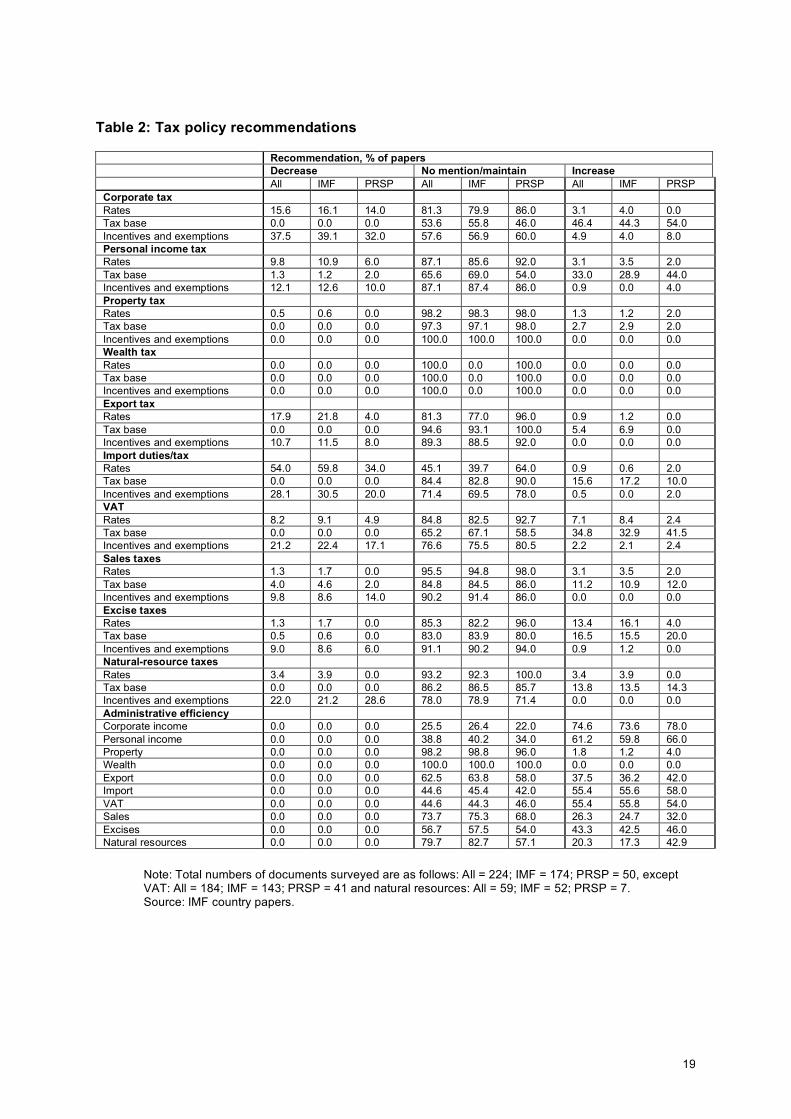
3. IMF recommendations Table 2 summarises the main recommendations made in the documents surveyed, distinguishing between IMF papers and national government PRSP documents. Direct taxes Reducing CIT rates has been stressed in 16.1 per cent of IMF papers. Although causality is complicated, it seems likely that this approach is reflected in the 12 per cent point average reduction in statutory CIT rates experienced across sub-Saharan Africa since 1990, and may continue with sub-Saharan African rates remaining relatively high in the global context.67 Further, CIT rates have become far more homogeneous with dispersion around the mean declining over the same period.68 A far more frequent policy emphasis is on enhancing CIT collection with 44.3 per cent of papers recommending enhancing the base – in many cases, such as Ghana, expanding the tax base is the most important feature. Principal among the specific recommendations has been the introduction of taxpayer-identification numbers, medium- and large-taxpayer units, and anti-fraud units alongside legislation that collectively seek to expand the tax base and capture the informal sector in the tax net. Of additional interest is the considerable number of documents seeking reductions in the number of exemptions and investment incentives offered by the tax code (eg the multiple incentives contained in Sudan’s Investment Encouragement Act). IMF staff argued that these incentives lack economic merit and are susceptible to corruption.69 However, the notable difference between IMF and PRSP papers with respect to increasing incentives is reflected in their increase in use across sub-Saharan Africa. Tax holidays are especially popular,70 although more recent documents show a move toward free or reduced-rate zones. PIT has generally been a less-significant issue in country reports than CIT. As with CIT, the thrust of recommendations supports the standard prescription of reducing rates and exemptions – although again this has proved less popular among governments in their PRSPs. Enhancing the base for mobilisation again proves the most frequent recommendation, although in a few cases the tax base is reduced to allow for a larger untaxed initial income. Interestingly, broadening the tax base proves far more popular with domestic government than IMF staff, reflecting the IMF’s general stance moving away from the use of PIT as a revenue-mobilising device. Reference to property and wealth taxes is very sparse – in the case of wealth taxes no single specific recommendation is made in the whole sample. The few property tax recommendations have focused upon increasing revenues through rate and base increases. In part this reflects the limited use of these taxes, which may be a function of political pressures rather than IMF stricture.71 Nevertheless, significant revenues can be raised through such taxes – in 2007, property taxes represented five per cent of total revenues in UK and three per cent in France (data from GFS).
Trade taxes Across the range of taxes, trade liberalisation is the most frequent recommendation in terms of changes to tax rates: 59.8 per cent of IMF papers argue for import-tariff reductions and 21.8 per cent advocate lowering export-tax rates. This finding corroborates the long-standing focus upon trade liberalisation, and suggests that the possible value of trade taxes in imperfect markets has been ignored. Many tariff reductions are set in the context of phased
11
harmonisation within regional trading groups. Export-tax policy is more fervent with recommendations frequently advocating the complete and immediate removal of such taxes, as in the cases of Angola, Equatorial Guinea, Nigeria and Sudan.72 The removal of exemptions and incentives, as part of a synchronisation strategy before wider tariff reduction, is endorsed by the IMF – particularly in the case of import tariffs where 30.5 per cent of IMF papers recommend this course. The emphasis on administrative improvement, as opposed to expansion of the tax base, may reflect the comparative ease of tracking goods through customs. Pertinent differences exist between the IMF and PRSP papers, with the IMF papers showing noticeably more enthusiasm for reducing both import and export taxes. Just four per cent of government papers recommend cutting export taxes compared to more than five times that share of IMF papers. A third of government papers recommend cutting import tariffs compared to nearly two-thirds of IMF papers. A similar, if less dramatic, story is told of exemptions/incentives. Considering that the PRSP papers are unlikely to be written entirely independently of IMF influence (of whatever kind), these dramatic differences suggest that a strong policy divergence often exists between staff and sub-Saharan African governments. Indirect taxes IMF country reports have strongly pushed the introduction of VAT in sub-Saharan Africa: only in Angola of the countries without VAT (at the time) did staff not recommend its introduction.73 This is reflected in the 32.9 per cent of IMF papers that endorse increasing the VAT base as opposed to the relatively meagre 10.9 per cent seeking to expand sales taxes. In the case of VAT, and to a lesser extent sales taxes, a reasonable emphasis has been placed on altering rates – the fact that increases and reductions are almost equally distributed reflects the IMF’s competing objectives of minimising business burdens and shifting toward tax harmonisation. The IMF has suggested that raising VAT rates as a response to low revenues is likely to increase evasion.74 Of particular interest is government reluctance to institute any rate changes. Although the use of rates and exemptions for VAT and sales taxes is clearly a complicated issue with numerous implications, the IMF has strongly supported a uniform rate and removing exemptions for most goods, or all goods in the case of Ethiopia.75 Excises are treated slightly differently. IMF recommendations strongly focus upon increasing rates as a means of increasing revenues while minimising adverse distributional impacts.76 That PRSPs do not endorse increasing excise rates suggests that political economy considerations may prevent what appears to be a sensible recommendation. Indirect taxation’s base receives significant attention from the IMF. This is demonstrated in the frequent recommendations to enhance the base of sales taxes but especially VAT and excises – particularly for the complex VAT that has at times, as in Ethiopia,77 been poorly administered. This strong emphasis fits with an approach seeking to shift toward indirect taxation, although it should be noted that the less efficaciously collected direct taxes have continued to receive greater interest. As with direct taxation, PRSPs consistently show greater support for enhancing collection (through broadening the base and enhancing administrative efficiency) than changing rates – this could be attributable to domestic governments acting more conservatively toward structural overhauls than staff who operate with greater detachment. Natural-resource taxes Despite the dearth of theory concerning natural-resource taxation, the IMF has made some recommendations in this important area for many sub-Saharan African economies. Rates
12
receive limited emphasis, with the key focus of policy instead looking to expanding the base, reducing the many exemptions that often exist for key natural resources and have restricted what may prove a fruitful revenue source, and improving the efficiency of an area frequently characterised by predatory corruption in places such as Angola, Chad, the DRC, Nigeria, Sierra Leone and Sudan. The shift toward increasing resource revenues has been a marked development – the evolution of natural-resource revenues exploded over the past two decades (see table 1 and especially Equatorial Guinea), and represents an increasingly large proportion of government revenues. IMF reports have increasingly advocated sensible policies regarding fiscal sustainability. In Botswana, a strong focus is given to enhancing non-resource revenue mobilisation in recognition of unsustainable diamond revenues;78 in Equatorial Guinea, where oil generates 85 per cent of GDP and 95 per cent of revenues, the IMF emphasises the use of a fiscal rule that ‘limits recurrent expenditure to non-oil revenue and finances capital expenditure from oil revenue’.79 Fiscal rules are advocated in Equatorial Guinea and Nigeria to ensure intergenerational equity by safeguarding current revenues for future generations and to avoid budgeting volatility.80 Administrative efficiency A primary focus of IMF recommendations has been improving the existing administrative system and thereby alleviating the revenue constraints imposed by ineffective capacity. As table 2 shows, this tenet of the tax consensus is the most frequently cited and meets with unequivocal support from domestic governments who show greater eagerness to improve efficiency across nine of the ten tax categories in their PRSPs. A number of specific recommendations are regularly made to enhance efficiency. First, implementing a unified and autonomous revenue authority (RA) or significantly enhancing inter-agency integration. Second, and partly facilitating a centralised RA, IMF staff often recommend computerisation of the entire taxation system. Third, IMF staff suggest adopting a more frequent and thorough formal auditing system able to address undervaluation and evasion; for Sudan it is suggested that the audit and collection functions are separated.81 Fourth, IMF assistance invariably supports the introduction of specialised units capable of reducing fraud by focusing on medium- and large-taxpayers, and taxpayer-identification numbers, simplifying the system and enhancing compliance by incorporating the informal sector. Finally, customs offices are often identified as underperforming, and represent a key issue in places such as Chad where the number of checks, system honesty and general efficiency all require improvement. These recommendations fit with the suggestion that policy should continue to focus upon ‘strengthening the technical capacity and organisation of revenue authorities through computerisation and improved operating procedures’82 in addition to stricter enforcement and improved audit facilities. Governance Given that good governance is associated with multiple desirable outcomes including improvement in revenue mobilisation, it is unsurprising that it plays an important role in IMF recommendations. While no specific prescription has been applied, recommendations have focused upon reforms of:
• legal institutions to support accountability and transparency in addition to establishing enforcement agencies
• the rules that constrain the governing classes
13
• civil society, by fostering integration between government, private institutions and the people, in the case of Ghana,83 and facilitating citizenship in the DRC to reduce fraud.84
These reforms are of central importance to many countries given the poor record of many sub-Saharan African countries on transparency, corruption and governance;85 this is especially pertinent to resource countries such as Angola, Chad, Nigeria and Sudan, as well as the DRC where the government is described as a ‘predator’.86
14
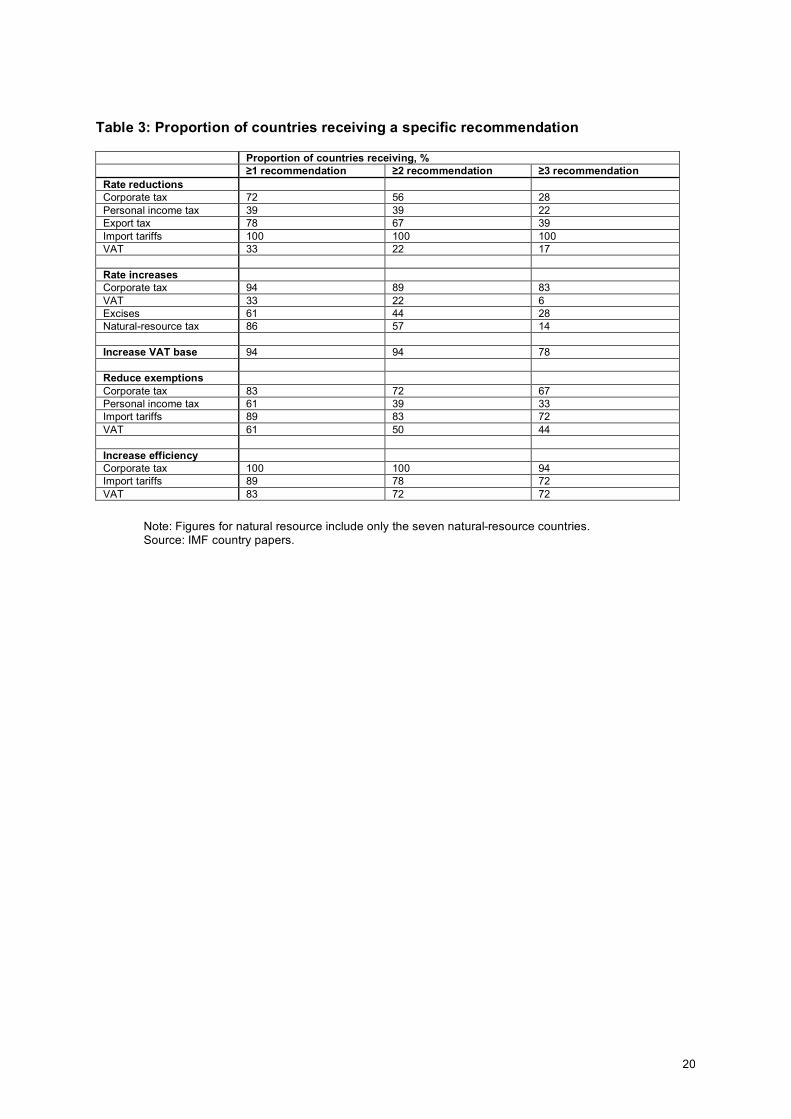
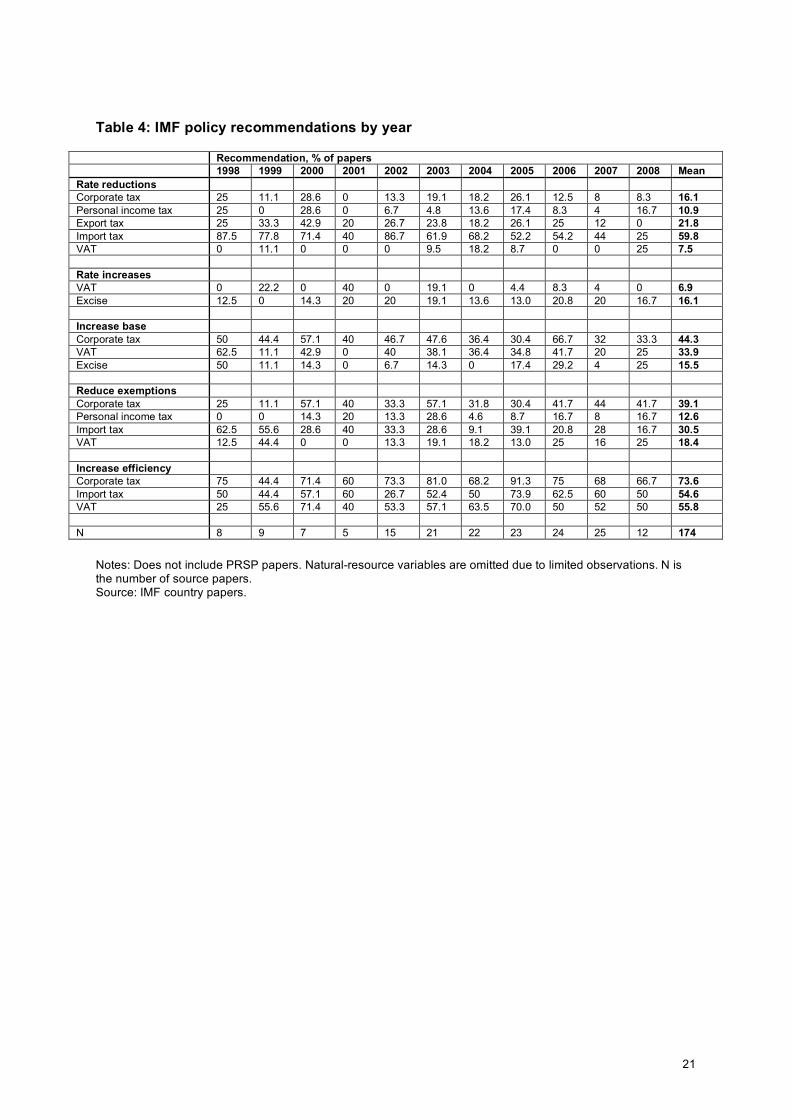
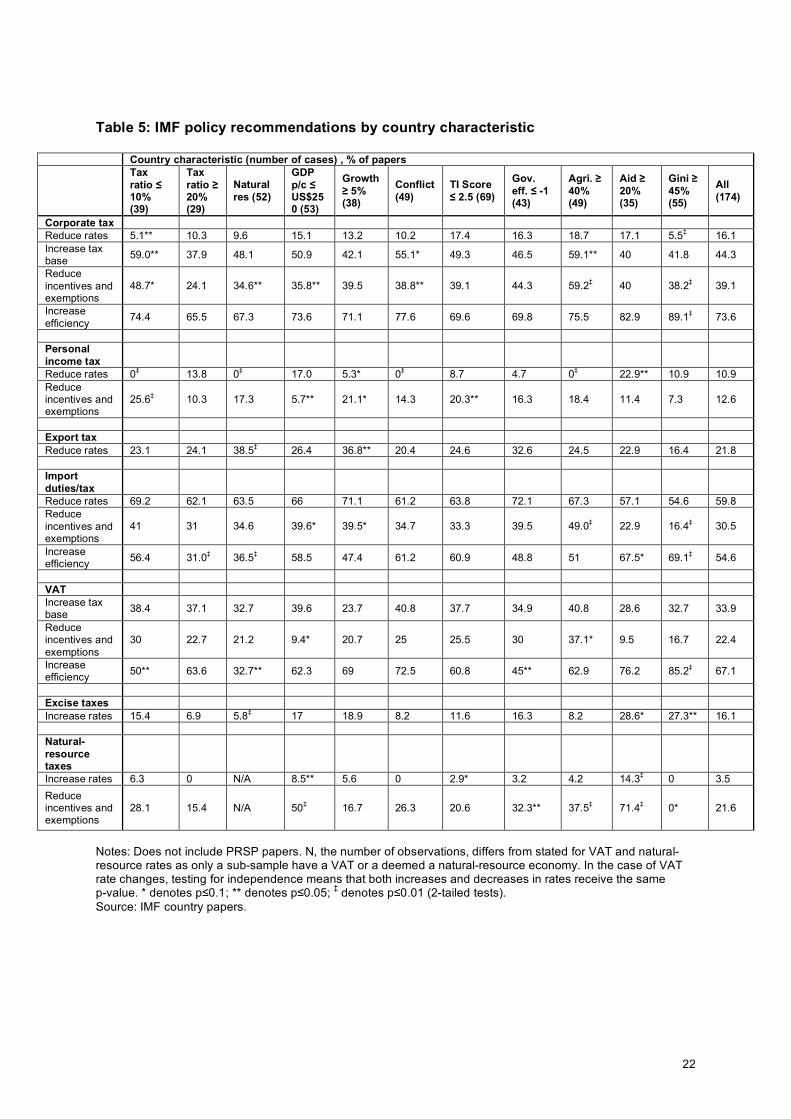
Section 3: Analysis of main findings The IMF’s tax consensus, reflected in revenue trends across the sample of 18 sub-Saharan African nations, has focused upon reducing corporate, personal and trade tax rates in favour of expanding the base of consumption taxes. Additionally, the increasing prevalence of VAT and particular forms of tax administration and base enhancement are widely observed in specific country papers. Attempts to more successfully tax natural resources have apparently resulted in an explosion of such revenues, although this has also been sensitive to commodity prices. Underpinning all recommendations is a greater interest in enhancing domestic revenues than previous IMF country interactions. Moreover, the IMF’s country reports exhibit a greater propensity toward significant structural overhauls than do domestic government’s more conservative PRSP papers, which prefer administrative reforms to altering tax rates and changing tax systems. In spite of greater IMF interest in revenue mobilisation, many of the structural policies expounded induce considerable risk and strain on the system, if not jeopardise collection efforts as a whole. It is perhaps only the administrative improvements that have prevented revenues from actually subsiding, while many of the reforms are likely to cause adverse distributional effects. Where revenue performance has been weaker than expected, as in Botswana, fiscal austerity is still evidenced through spending reductions.87 In 2003, the IMF’s Independent Evaluation Office (IEO) responded to the ‘one-size-fits-all’ critique and published a report examining claims that programmes always included fiscal austerity.88 Given that none of the tax-policy recommendations above, perhaps bar efficiency gains, are made in every paper, it may be argued that there is scant evidence of a ‘one-size-fits-all’ approach. However, we should not expect all papers to continue to make the same recommendations. Once a structural reform has been instituted, subsequent recommendations are unnecessary. In the case of tax rates, which act along a continuum, there is a point where going further has no additional value. Base and efficiency recommendations are likely to be more frequent given that these can always be improved. Moreover, unlike the broad fiscal targets referred to by the IEO, it is often unfeasible for countries to simultaneously pursue a wide range of reforms – and in cases that require sequencing, impossible. Examination of table 3 shows the prescriptions of the tax consensus have been endorsed fairly uniformly across the sample, with almost all recommendations applied to the majority of countries at least once. In particular, recommendations to decrease CIT rates, increase the tax base, reduce import tariffs and increase administrative efficiency have formed the staple of the recommendations made in sub-Saharan Africa. However, recommendations to reduce PIT rates and exemptions have proved notably less popular. The temporal dimension is more difficult to reliably assess. As table 4 shows, there are relatively few recommendations available before 2002. However, a number of tentative inferences may be offered. First, import tariff and incentive reductions and expansions of the VAT base have become less prevalent, although this probably reflects structural adjustments that took place at an earlier stage. Second, IMF staff less frequently recommend reducing CIT and PIT rates toward the end of the time frame, placing greater emphasis on reducing incentives for both these taxes. Overall, however, IMF recommendations have remained remarkably stable over time. Table 5 sets out the result of basic hypothesis testing to identify whether particular country characteristics are associated with a difference in approach in IMF policy recommendations
15
– that is, does one size fit all? Hypothesis tests are employed to determine whether the distribution of recommendations for a particular sub-sample (defined by a specific country characteristic) is independent of the full sample of recommendations.89 Unsophisticated descriptive analysis cannot tell the whole picture, so (unreported) panel regression analysis was also employed to assess these results.90 Specifically, we examine whether recommendations differ significantly for country groups with the following characteristics: very low or relatively high tax/GDP ratios, natural-resource wealth, very low per capita income, high growth, conflict, high corruption, inefficient government, an economy dominated by agriculture, high reliance on aid, and very high inequality. Inevitably the cut-off points for defining some characteristics must be relatively arbitrary. Looking through table 5, there are relatively few significant results (those with one or more asterisks). Some findings are reassuring, for example a recommendation to reduce CIT rates is less likely in countries with the lowest tax/GDP ratios (and regression analysis suggests such recommendations are independent of the existing tax rate). Excises appear to be used as a means of countering distributional concerns (although this is not corroborated by sophisticated regression analysis, while the other findings highlighted here are). In general, export-tax and import-tariff reductions appear to be favoured regardless of characteristics. Regression analysis suggests that the significant negative impact of natural-resource economies on export tax actually reflects the need for lower rates for high-export countries. Recommendations to broaden the tax base suggest that IMF policy is applied fairly uniformly in the case of VAT and especially CIT.91 Neither the greater capacity to institute structural reforms in non-conflict countries nor the need to do so in agriculture or resource-based economies are reflected in IMF policy recommendations. Looking at tax incentives and exemptions reveals the robust finding that exemptions are strongly opposed where the agricultural component of the economy is large. Reducing exemptions and incentives seems to be popular where the tax ratio is lowest (although this is not supported in the regression analysis). It is a matter for concern that VAT exemptions appear to be used as means of increasing the tax ratio, in spite of their distributional importance; moreover, the IMF appears to be reluctant to reduce exemptions on imports – goods that are relatively likely to be consumed by the rich. The strong impact of GDP, which varies dramatically by tax type, is found to be significant in all regressions. Improving tax administration is widely applied across the gamut of taxes in sub-Saharan Africa. As expected, import collection is less-strongly supported when revenues are already relatively high. However, a number of oddities present themselves: countries that we might expect to need the strongest improvements to support public good provision and political representation – such as those with the lowest tax ratios, the smallest GDP per capita and largest agricultural sectors – either fail to differ from the cross-country average or actually receive fewer recommendations. Collection efforts are less frequently encouraged in natural-resource countries, which may be ill-advised given that this not only weakens societal inclusion but ignores the non-sustainability of most natural resources. The cross-tabulations presented in table 5 provide a valuable insight, suggesting that for the most part individual country characteristics do not strongly influence IMF policy
16
recommendations. There are clear avenues for IMF policy to be improved – primarily by catering recommendations to specific countries and reassessing unwavering support for policies such as trade liberalisation. There are some reasons to believe that policy is improving.
17
Conclusion Examining tax-policy recommendations from all available official IMF papers for 18 economies in sub-Saharan Africa, spanning the period 1998-2008, this paper has found strong support for the claim that the IMF has promoted the tax consensus – often in spite of evidence that the implied policies are failing to meet their objectives. Looking at how little policy recommendations differ across time and country reveals that many of the central tenets of the tax consensus are uniformly promoted by the IMF regardless of important country-specific characteristics. Certainly, there does not appear to be the diversity or magnitude of characteristic-specific differences in recommendations that the theoretical and empirical tax literature would propose. Where differences do exist, they are almost equally split between theoretically sound and wrong-headed recommendations for developing countries. Consequently, many countries are failing to realise the critical economic, social and political benefits associated with effective and inclusive taxation. As the IMF seems set to take a more important role, as directed by the London meeting of the G20 countries in April 2009, it becomes crucial that the institution is able to show that it can function as a channel to promote development by transmitting best practice between similar countries in the global South. The wider development community, including NGOs and donor countries, must ensure that the option of the IMF continuing to promote inappropriate policies on a uniform basis is not left open.
18
Table 1: Tax revenue, as a proportion of GDP, 1992-2008
Tax revenue, %GDP Countries 1992 1993 1994 1995 1996 1997 1998 1999 2000 2001 2002 2003 2004 2005 2006 2007 2008 Angola 44.8 38.2 26.6 47.9 50.0 44.7 40.0 36.6 36.1 39.4 43.5 34.4 Botswana 37.8 35.0 30.5 29.3 30.9 34.6 26.6 41.2 43.6 29.7 31.9 33.9 34.6 36.6 35.9 Central African Rep 8.5 7.5 6.8 8.8 6.1 7.5 8.3 8.4 7.9 7.3 8.5 6.5 7.2 7.1 7.8 8.0 9.1
Chad 4.7 5.5 6.5 6.7 6.8 7.2 7.0 6.4 7.5 8.3 9.2 8.5 11.2 DR Congo 4.7 7.5 5.3 3.5 4.2 3.8 5.5 6.4 8.3 9.4 11.0 Equatorial Guinea 14.5 14.4 11.2 10.3 6.9 6.3 5.3 4.2 2.6 8.6 14.9 11.6 8.8 9.3 11.4
Ethiopia 8.3 10.9 11.5 12.5 13.0 11.7 11.4 12.2 13.7 12.5 11.2 12.6 11.6 10.7 10.1 10.4 Ghana 13.8 16.9 19.2 17.3 17.3 15.8 17.6 14.9 16.2 17.2 17.4 20.2 22.3 20.6 19.6 20.0 19.9 Kenya 19.6 19.3 24.5 25.1 24.8 22.4 22.6 21.6 20.3 20.0 17.3 17.8 19.1 19.4 19.8 19.8 19.7 Malawi 15.6 14.6 14.5 15.3 14.6 13.8 15.4 15.6 17.0 15.3 12.3 14.2 16.0 15.6 17.0 16.9 Mozambique 18.2 16.1 16.7 16.5 10.5 10.6 11.1 12.0 11.8 12.5 13.2 11.7 12.2 13.2 14.4 14.5 Nigeria 2.3 3.4 5.2 5.4 5.9 5.7 6.3 5.9 8.4 7.5 6.8 5.0 4.4 3.5 4.1 3.9 Senegal 12.3 13.2 14.8 15.9 15.9 15.8 16.4 16.8 17.2 18.1 17.1 17.6 18.8 19.1 20.1 20.9 Sierra Leone 6.4 6.3 10.8 13.7 14.3 15.1 12.2 11.1 Sudan 6.5 5.3 5.6 6.4 6.3 5.6 5.6 5.5 6.1 7.5 7.0 6.3 6.2 6.5 Tanzania 12.5 9.5 10.9 11.3 11.3 12.1 10.8 10.3 10.1 10.7 10.6 11.0 11.7 12.1 12.9 14.5 14.9 Uganda 6.7 7.2 8.3 9.9 10.6 11.4 14.9 15.5 15.4 17.4 17.6 17.8 20.6 12.0 11.8 12.0 12.8 Zambia 17.6 15.4 18.7 18.1 19.0 18.8 18.2 17.4 19.2 18.7 17.5 17.3 17.5 17.0 16.1 22.5 24.8
Note: All figures for 2008 are projections. Source: IMF country reports.
19
Table 2: Tax policy recommendations
Recommendation, % of papers Decrease No mention/maintain Increase All IMF PRSP All IMF PRSP All IMF PRSP Corporate tax Rates 15.6 16.1 14.0 81.3 79.9 86.0 3.1 4.0 0.0 Tax base 0.0 0.0 0.0 53.6 55.8 46.0 46.4 44.3 54.0 Incentives and exemptions 37.5 39.1 32.0 57.6 56.9 60.0 4.9 4.0 8.0 Personal income tax Rates 9.8 10.9 6.0 87.1 85.6 92.0 3.1 3.5 2.0 Tax base 1.3 1.2 2.0 65.6 69.0 54.0 33.0 28.9 44.0 Incentives and exemptions 12.1 12.6 10.0 87.1 87.4 86.0 0.9 0.0 4.0 Property tax Rates 0.5 0.6 0.0 98.2 98.3 98.0 1.3 1.2 2.0 Tax base 0.0 0.0 0.0 97.3 97.1 98.0 2.7 2.9 2.0 Incentives and exemptions 0.0 0.0 0.0 100.0 100.0 100.0 0.0 0.0 0.0 Wealth tax Rates 0.0 0.0 0.0 100.0 0.0 100.0 0.0 0.0 0.0 Tax base 0.0 0.0 0.0 100.0 0.0 100.0 0.0 0.0 0.0 Incentives and exemptions 0.0 0.0 0.0 100.0 0.0 100.0 0.0 0.0 0.0 Export tax Rates 17.9 21.8 4.0 81.3 77.0 96.0 0.9 1.2 0.0 Tax base 0.0 0.0 0.0 94.6 93.1 100.0 5.4 6.9 0.0 Incentives and exemptions 10.7 11.5 8.0 89.3 88.5 92.0 0.0 0.0 0.0 Import duties/tax Rates 54.0 59.8 34.0 45.1 39.7 64.0 0.9 0.6 2.0 Tax base 0.0 0.0 0.0 84.4 82.8 90.0 15.6 17.2 10.0 Incentives and exemptions 28.1 30.5 20.0 71.4 69.5 78.0 0.5 0.0 2.0 VAT Rates 8.2 9.1 4.9 84.8 82.5 92.7 7.1 8.4 2.4 Tax base 0.0 0.0 0.0 65.2 67.1 58.5 34.8 32.9 41.5 Incentives and exemptions 21.2 22.4 17.1 76.6 75.5 80.5 2.2 2.1 2.4 Sales taxes Rates 1.3 1.7 0.0 95.5 94.8 98.0 3.1 3.5 2.0 Tax base 4.0 4.6 2.0 84.8 84.5 86.0 11.2 10.9 12.0 Incentives and exemptions 9.8 8.6 14.0 90.2 91.4 86.0 0.0 0.0 0.0 Excise taxes Rates 1.3 1.7 0.0 85.3 82.2 96.0 13.4 16.1 4.0 Tax base 0.5 0.6 0.0 83.0 83.9 80.0 16.5 15.5 20.0 Incentives and exemptions 9.0 8.6 6.0 91.1 90.2 94.0 0.9 1.2 0.0 Natural-resource taxes Rates 3.4 3.9 0.0 93.2 92.3 100.0 3.4 3.9 0.0 Tax base 0.0 0.0 0.0 86.2 86.5 85.7 13.8 13.5 14.3 Incentives and exemptions 22.0 21.2 28.6 78.0 78.9 71.4 0.0 0.0 0.0 Administrative efficiency Corporate income 0.0 0.0 0.0 25.5 26.4 22.0 74.6 73.6 78.0 Personal income 0.0 0.0 0.0 38.8 40.2 34.0 61.2 59.8 66.0 Property 0.0 0.0 0.0 98.2 98.8 96.0 1.8 1.2 4.0 Wealth 0.0 0.0 0.0 100.0 100.0 100.0 0.0 0.0 0.0 Export 0.0 0.0 0.0 62.5 63.8 58.0 37.5 36.2 42.0 Import 0.0 0.0 0.0 44.6 45.4 42.0 55.4 55.6 58.0 VAT 0.0 0.0 0.0 44.6 44.3 46.0 55.4 55.8 54.0 Sales 0.0 0.0 0.0 73.7 75.3 68.0 26.3 24.7 32.0 Excises 0.0 0.0 0.0 56.7 57.5 54.0 43.3 42.5 46.0 Natural resources 0.0 0.0 0.0 79.7 82.7 57.1 20.3 17.3 42.9
Note: Total numbers of documents surveyed are as follows: All = 224; IMF = 174; PRSP = 50, except VAT: All = 184; IMF = 143; PRSP = 41 and natural resources: All = 59; IMF = 52; PRSP = 7. Source: IMF country papers.
20
Table 3: Proportion of countries receiving a specific recommendation
Proportion of countries receiving, % ≥1 recommendation ≥2 recommendation ≥3 recommendation Rate reductions Corporate tax 72 56 28 Personal income tax 39 39 22 Export tax 78 67 39 Import tariffs 100 100 100 VAT 33 22 17 Rate increases Corporate tax 94 89 83 VAT 33 22 6 Excises 61 44 28 Natural-resource tax 86 57 14 Increase VAT base 94 94 78 Reduce exemptions Corporate tax 83 72 67 Personal income tax 61 39 33 Import tariffs 89 83 72 VAT 61 50 44 Increase efficiency Corporate tax 100 100 94 Import tariffs 89 78 72 VAT 83 72 72
Note: Figures for natural resource include only the seven natural-resource countries. Source: IMF country papers.
21
Table 4: IMF policy recommendations by year
Recommendation, % of papers 1998 1999 2000 2001 2002 2003 2004 2005 2006 2007 2008 Mean Rate reductions Corporate tax 25 11.1 28.6 0 13.3 19.1 18.2 26.1 12.5 8 8.3 16.1 Personal income tax 25 0 28.6 0 6.7 4.8 13.6 17.4 8.3 4 16.7 10.9 Export tax 25 33.3 42.9 20 26.7 23.8 18.2 26.1 25 12 0 21.8 Import tax 87.5 77.8 71.4 40 86.7 61.9 68.2 52.2 54.2 44 25 59.8 VAT 0 11.1 0 0 0 9.5 18.2 8.7 0 0 25 7.5 Rate increases VAT 0 22.2 0 40 0 19.1 0 4.4 8.3 4 0 6.9 Excise 12.5 0 14.3 20 20 19.1 13.6 13.0 20.8 20 16.7 16.1 Increase base Corporate tax 50 44.4 57.1 40 46.7 47.6 36.4 30.4 66.7 32 33.3 44.3 VAT 62.5 11.1 42.9 0 40 38.1 36.4 34.8 41.7 20 25 33.9 Excise 50 11.1 14.3 0 6.7 14.3 0 17.4 29.2 4 25 15.5 Reduce exemptions Corporate tax 25 11.1 57.1 40 33.3 57.1 31.8 30.4 41.7 44 41.7 39.1 Personal income tax 0 0 14.3 20 13.3 28.6 4.6 8.7 16.7 8 16.7 12.6 Import tax 62.5 55.6 28.6 40 33.3 28.6 9.1 39.1 20.8 28 16.7 30.5 VAT 12.5 44.4 0 0 13.3 19.1 18.2 13.0 25 16 25 18.4 Increase efficiency Corporate tax 75 44.4 71.4 60 73.3 81.0 68.2 91.3 75 68 66.7 73.6 Import tax 50 44.4 57.1 60 26.7 52.4 50 73.9 62.5 60 50 54.6 VAT 25 55.6 71.4 40 53.3 57.1 63.5 70.0 50 52 50 55.8 N 8 9 7 5 15 21 22 23 24 25 12 174
Notes: Does not include PRSP papers. Natural-resource variables are omitted due to limited observations. N is the number of source papers. Source: IMF country papers.
22
Table 5: IMF policy recommendations by country characteristic
Country characteristic (number of cases) , % of papers Tax
ratio ≤ 10% (39)
Tax ratio ≥ 20% (29)
Natural res (52)
GDP p/c ≤ US$250 (53)
Growth ≥ 5% (38)
Conflict (49)
TI Score ≤ 2.5 (69)
Gov. eff. ≤ -1 (43)
Agri. ≥ 40% (49)
Aid ≥ 20% (35)
Gini ≥ 45% (55)
All (174)
Corporate tax Reduce rates 5.1** 10.3 9.6 15.1 13.2 10.2 17.4 16.3 18.7 17.1 5.5‡ 16.1 Increase tax base 59.0** 37.9 48.1 50.9 42.1 55.1* 49.3 46.5 59.1** 40 41.8 44.3
Reduce incentives and exemptions
48.7* 24.1 34.6** 35.8** 39.5 38.8** 39.1 44.3 59.2‡ 40 38.2‡ 39.1
Increase efficiency 74.4 65.5 67.3 73.6 71.1 77.6 69.6 69.8 75.5 82.9 89.1‡ 73.6
Personal income tax
Reduce rates 0‡ 13.8 0‡ 17.0 5.3* 0‡ 8.7 4.7 0‡ 22.9** 10.9 10.9 Reduce incentives and exemptions
25.6‡ 10.3 17.3 5.7** 21.1* 14.3 20.3** 16.3 18.4 11.4 7.3 12.6
Export tax Reduce rates 23.1 24.1 38.5‡ 26.4 36.8** 20.4 24.6 32.6 24.5 22.9 16.4 21.8 Import duties/tax
Reduce rates 69.2 62.1 63.5 66 71.1 61.2 63.8 72.1 67.3 57.1 54.6 59.8 Reduce incentives and exemptions
41 31 34.6 39.6* 39.5* 34.7 33.3 39.5 49.0‡ 22.9 16.4‡ 30.5
Increase efficiency 56.4 31.0‡ 36.5‡ 58.5 47.4 61.2 60.9 48.8 51 67.5* 69.1‡ 54.6
VAT Increase tax base 38.4 37.1 32.7 39.6 23.7 40.8 37.7 34.9 40.8 28.6 32.7 33.9
Reduce incentives and exemptions
30 22.7 21.2 9.4* 20.7 25 25.5 30 37.1* 9.5 16.7 22.4
Increase efficiency 50** 63.6 32.7** 62.3 69 72.5 60.8 45** 62.9 76.2 85.2‡ 67.1
Excise taxes Increase rates 15.4 6.9 5.8‡ 17 18.9 8.2 11.6 16.3 8.2 28.6* 27.3** 16.1 Natural- resource taxes
Increase rates 6.3 0 N/A 8.5** 5.6 0 2.9* 3.2 4.2 14.3‡ 0 3.5 Reduce incentives and exemptions
28.1 15.4 N/A 50‡ 16.7 26.3 20.6 32.3** 37.5‡ 71.4‡ 0* 21.6
Notes: Does not include PRSP papers. N, the number of observations, differs from stated for VAT and natural-resource rates as only a sub-sample have a VAT or a deemed a natural-resource economy. In the case of VAT rate changes, testing for independence means that both increases and decreases in rates receive the same p-value. * denotes p≤0.1; ** denotes p≤0.05; ‡ denotes p≤0.01 (2-tailed tests). Source: IMF country papers.
23
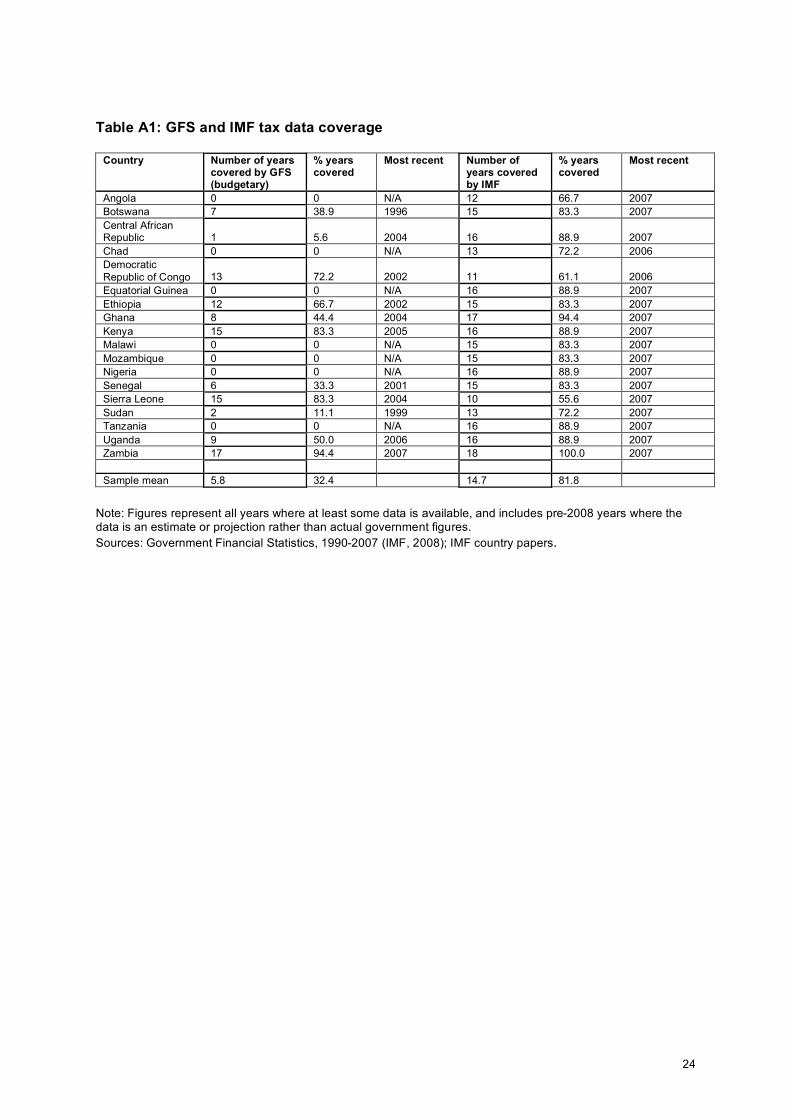
Appendix 1: Data on tax revenues Accompanying the tax-policy recommendations is a new dataset providing detailed decompositions of government revenue measures and greater coverage than the widely used Government Financial Statistics (GFS) database (IMF, 2008). This dataset builds upon that employed by Keen and Mansour (2008), and is derived from the IMF’s country documents which are deemed to be more reliable than GFS sources (Baunsgaard and Keen, 2005). Wherever possible the IMF’s Statistical Appendix (SA) documents have been used, as these provide the most extensively disaggregated (federal-level) financial statistics.92 These provide breakdowns for direct, indirect, trade and (sometimes) natural-resource revenues (which formed the basis for Keen and Mansour’s analysis). Often they further distinguish taxes under these umbrellas: in most cases they allow for CIT and PIT to be broken down for direct tax revenues; indirect taxes are usually decomposed into sales, excise and VAT components, and often distinguish between indirect revenues on domestic and imported goods; trade taxes are separated between import and export duties, and indirect tax revenues from imported goods have been manually excluded where the data does not initially do so.93 Where SAs offer incomplete time-series coverage, the more limited data from AIV, PSI and PRGF papers has been employed. The IMF data show a remarkable degree of internal consistency, with differences generally arising only from retrospective accounting adjustments (except in a few exceptional cases).94 Where data conflicts, that from the more recent paper is used. The main issue of reliability concerns the most recent years where figures may be projections assuming upturns in mobilisation from direct taxes in particular. In spite of these minor issues, this new dataset is valuable for research into sub-Saharan Africa, tracing revenue evolution as far back as 1990 for a region where the GFS budgetary dataset is particularly sparse and often inconsistent.95 As table A1 shows, over the period 1990-2007 the IMF’s government data has considerably more extensive and recent coverage. In only two cases does GFS data cover more years, while on average IMF data covers more than double the number of years of GFS data; in every case the IMF data is at least as recent as the GFS statistics, with the GFS offering nothing in the case of seven countries. Although the IMF data lacks the decomposition of a few GFS series, it comprehensively covers the main tax streams, while the GFS is frequently characterised by significant gaps in some variables in addition to inconsistent variable availability and definition across country. That the two datasets are almost perfectly correlated gives further justification to strongly preferring the IMF dataset.96
24
Table A1: GFS and IMF tax data coverage
Country Number of years covered by GFS (budgetary)
% years covered
Most recent Number of years covered by IMF
% years covered
Most recent
Angola 0 0 N/A 12 66.7 2007 Botswana 7 38.9 1996 15 83.3 2007 Central African Republic 1 5.6 2004 16 88.9 2007 Chad 0 0 N/A 13 72.2 2006 Democratic Republic of Congo 13 72.2 2002 11 61.1 2006 Equatorial Guinea 0 0 N/A 16 88.9 2007 Ethiopia 12 66.7 2002 15 83.3 2007 Ghana 8 44.4 2004 17 94.4 2007 Kenya 15 83.3 2005 16 88.9 2007 Malawi 0 0 N/A 15 83.3 2007 Mozambique 0 0 N/A 15 83.3 2007 Nigeria 0 0 N/A 16 88.9 2007 Senegal 6 33.3 2001 15 83.3 2007 Sierra Leone 15 83.3 2004 10 55.6 2007 Sudan 2 11.1 1999 13 72.2 2007 Tanzania 0 0 N/A 16 88.9 2007 Uganda 9 50.0 2006 16 88.9 2007 Zambia 17 94.4 2007 18 100.0 2007 Sample mean 5.8 32.4 14.7 81.8
Note: Figures represent all years where at least some data is available, and includes pre-2008 years where the data is an estimate or projection rather than actual government figures. Sources: Government Financial Statistics, 1990-2007 (IMF, 2008); IMF country papers.
25
1. A Bulir & A J Hamann, Volatility of Development Aid: From the Frying Pan into the Fire?, IMF, 2006; R Lensink & O Morrissey, ‘Aid instability as a measure of uncertainty and the positive impact of aid on growth’, Journal of Development Studies, Vol 36, No. 3, 2000; M A Robe and S Pallage, ‘Foreign aid and the business cycle’, Review of International Economics, Vol 9, No. 4, 2001.
2. A Alesina & D Dollar, ‘Who Gives Foreign Aid to Whom and Why?’ Journal of Economic Growth, Vol 5, No. 1, 2000.
3. S Gupta & S Tareq, ‘Mobilizing Revenue: Strengthening domestic revenue bases is key to creating fiscal space for Africa's developmental needs’, Finance and Development, Vol 45, No. 3, 2008.
4. A Cobham, The tax consensus has failed: Recommendations to policy makers and donors, researchers and civil society, Oxford Council on Good Governance Economy Recommendation No. 8, 2007.
5. D Brautigam, O Fjeldstad and M Moore (eds), Taxation and state-building in developing countries: capacity and consent, Cambridge University Press, 2008; M Ross, ‘Does taxation lead to representation’, British Journal of Political Science, Vol 34, 2004.
6. S Gupta & S Tareq, ‘Mobilizing Revenue: Strengthening domestic revenue bases is key to creating fiscal space for Africa's developmental needs’, Finance and Development, Vol 45, No. 3, 2008; M Keen & M Mansour, Revenue Mobilization in Sub-Saharan Africa: Key Challenges from Globalization, IMF, 2008.
7. C Heady, ‘Taxation policy in low-income countries’, in T Addison & A Roe, Fiscal Policy for Development, Palgrave Macmillan/UNU WIDER, 2004; A Cobham, The tax consensus has failed: Recommendations to policy makers and donors, researchers and civil society, Oxford Council on Good Governance Economy Recommendation No. 8, 2007; L Damme, T Misrahi & S Orel, The IMF’s regressive secret: Tax policy advice and its distributional impact, Bretton Woods Project Update, No. 61, 2008. 8. M Edwards, ‘Investor Responses to IMF Program Suspensions: Is Noncompliance Costly?’, Social Science Quarterly, Vol 84, No. 4, 2005; P Dhonte, Conditionality as an Instrument of Borrower Credibility, IMF Paper on Policy Analysis and Assessment PPAA 97/2, 1997; L Martin & B Simmons, ‘Theoretical and Empirical Studies of International Institutions’, International Organization, Vol 52, No. 4, 1998; B Simmons, ‘International Law and State Behavior: Commitment and Compliance in International Monetary Affairs’, American Political Science Review, Vol 94, No. 4, 2000.
9. Meltzer Commission, Report of the International Financial Institution Advisory Commission to the US Congress, mimeo, 2000; I Nooruddin & J Simmons, ‘The Politics of Hard Choices: IMF Programs and Government Spending’, International Organization, Vol 60, 2006; A Przeworski & J Vreeland, ‘The effect of IMF programs on economic growth’, Journal of Development Economics, Vol 62, 2000; J Vreeland, ‘IMF program compliance: Aggregate index versus policy specific research strategies’, Review of International Organization, Vol 1, 2006.
10. G Cornia, ‘Adjustment Policies 1980-1985: Effects on Child Welfare’, in G Cornia, R Jolly & F Stewart, Adjustment with a Human Face Volume 1, Oxford University Press, 1987; I Nooruddin & J Simmons, ‘The Politics of Hard Choices: IMF Programs and Government Spending’, International Organization, Vol 60, 2006; M Torrance & E Lochery, An analysis of the IFIs' fiscal policy recommendations, Oxford Council on Good Governance, 2006; E Voyvoda & E Yeldan, ‘IMF Programmes, Fiscal Policy and Growth: Investigation of Macroeconomic Alternatives in an OLG Model of Growth for Turkey’, Comparative Economic Studies, Vol 47, 2005.
11. C Adam and D Bevan, ‘Fiscal policy design in low-income countries’ in T Addison, & A Roe, Fiscal Policy for Development, Palgrave Macmillan/UNU WIDER, 2004. 12. Ibid.
13. C Heady, ‘Taxation policy in low-income countries’, in T Addison & A Roe, Fiscal Policy for Development, Palgrave Macmillan/UNU WIDER, 2004; p139. 14. Ibid. 15. L Bretschger & F Hettich, ‘Globalisation, capital mobility and tax competition: theory and evidence for OECD countries’, European Journal of Political Economy, Vol 18, 2002; M Keen & M Mansour, Revenue Mobilization in Sub-Saharan Africa: Key Challenges from Globalization, IMF, 2008; V Tanzi & H Zee, Tax Policy for Emerging Markets: Developing Countries, IMF Working Paper No. 00/35, 2000. 16. D Dharmapala & J Hines Jr, Which Countries Become Tax Havens, NBER Working Paper No. 12802, 2006.
26
17. N Gemmell & O Morrissey. ‘Distribution and Poverty Impacts of Tax Structure Reform in Developing Countries: How Little We Know’, Development Policy Review, Vol 23, No. 2, 2005.
18. M Keen & M Mansour, Revenue Mobilization in Sub-Saharan Africa: Key Challenges from Globalization, IMF, 2008.
19. M Devereux, M & P Sorensen, The Corporate Income Tax: International Trends and Options for Fundamental Reform, European Economy, Economic Paper, No. 264, 2006; M Keen & A Simone, ‘Tax Policy in Developing Countries: Some Lessons for the 1990s and Some Challenges Ahead’, in S Gupta, G Inchauste & B Clements, Helping Countries Develop: The Role of Fiscal Policy, IMF, 2004; K Stewart & M Webb, ‘International competition in corporate taxation: evidence from the OECD time series’, Economic Policy, Vol 23, No. 45, 2006.
20. F Schneider, Size and Measurement of the Informal Economy in 110 Countries Around the World, World Bank, 2002.
21. C Heady, ‘Taxation policy in low-income countries’, in T Addison, & A Roe, Fiscal Policy for Development, Palgrave Macmillan/UNU WIDER, 2004.
22. V Tanzi & H Zee, Tax Policy for Emerging Markets: Developing Countries, IMF Working Paper No. 00/35, 2000.
23. M Keen & M Mansour, Revenue Mobilization in Sub-Saharan Africa: Key Challenges from Globalization, IMF, 2008.
24. J Chai, & R Goyal, Tax concessions and foreign direct investment in the Eastern Caribbean Currency Union, IMF Working Paper No. WP/08/257, 2008.
25. R Bates, Markets and States in Tropical Africa, California University Press, 1981; M Lipton, ‘Urban Bias’, in T Forsyth (ed), Encyclopedia of International Development, Routledge, 2005.
26. N Gemmell & O Morrissey, ‘Distribution and Poverty Impacts of Tax Structure Reform in Developing Countries: How Little We Know’, Development Policy Review, Vol 23, No. 2, 2005.
27. C Heady, ‘Taxation policy in low-income countries’, in T Addison, & A Roe, Fiscal Policy for Development, Palgrave Macmillan/UNU WIDER, 2004. 28. G Grossman & E Helpman, Innovation and Growth in the Global Economy, MIT Press, 1991.
29. D Chen, J Matovu & R Reinnika, ‘A Quest for Revenue and Tax Incidence in Uganda’, in R Reinnikka & P Collier (eds), Uganda's Recovery: The Role of Farms, Firms and Government, World Bank, 2001; K-Y Chu, H Davoodi & S Gupta, Income Distribution, Tax and and Government Social Spending Policies in Developing Countries, UNU/WIDER Working Papers, 2000; N Gemmell & O Morrissey, ‘Distribution and Poverty Impacts of Tax Structure Reform in Developing Countries: How Little We Know’, Development Policy Review, Vol 23, No. 2, 2005; G Grossman & E Helpman, Innovation and Growth in the Global Economy, MIT Press, 1991. 30. T Baunsgaard & M Keen, Tax Revenue and (or?) Trade Liberalization, IMF, 2005.
31. M Emran & J Stiglitz, ‘On selective indirect tax reform in developing countries’, Journal of Public Economics, Vol 89, No. 4, 2005.
32. R Gordon & W Li, Tax Structure in Developing Countries: Many Puzzles and a Possible Explanation, NBER Working Paper No. 11267, 2005.
33. D Rodrik & F Rodriguez, ‘Trade Policy and Economic Growth: A Skeptics Guide to the Cross-National Evidence’, in B Bernanke & K Rogoff (eds), Macroeconomics Annual 2000, MIT Press, 2001. More recently, Rodrik states the view that the cross-country evidence can be straightforwardly summarised as showing no systematic relationship between tariff and other restrictions, and subsequent economic growth (D Rodrik, One Economics, Many Recipes: Globalisation, Institutions and Economic Growth, Princeton, 2007).
34. S Gupta & S Tareq, ‘Mobilizing Revenue: Strengthening domestic revenue bases is key to creating fiscal space for Africa's developmental needs’, Finance and Development, Vol 45, No. 3, 2008.
35. N Azaria & Z Robinson, ‘The Revenue Raising Capabilities of a VAT System in Developing Countries’, South African Journal of Economic and Management Studies, Vol 8, No. 1, 2005; L Bretschger & F Hettich, ‘Globalisation, capital mobility and tax competition: theory and evidence for OECD countries’, European Journal of Political Economy, Vol 18, 2002. 36. M Keen, VAT Attacks, IMF Working Paper No. 07/142, 2007.
37. N Azaria & Z Robinson, ‘The Revenue Raising Capabilities of a VAT System in Developing Countries’, South African Journal of Economic and Management Studies, Vol 8, No. 1, 2005.
38. L Doe, Harmonization of Domestic Consumption Taxes in Central and Western African Countries, IMF Working Paper 06/8, 2006.
27
39. It should be noted that considerable differences in compliance, revenue mobilisation, rates and incentives generally continue to exist in the WAEMU and CEMAC African trading blocs (ibid).
40. N Gemmell & O Morrissey, ‘Distribution and Poverty Impacts of Tax Structure Reform in Developing Countries: How Little We Know’, Development Policy Review, Vol 23, No. 2, 2005.
41. C Heady, ‘Taxation policy in low-income countries’, in T Addison & A Roe, Fiscal Policy for Development, Palgrave Macmillan/UNU WIDER, 2004.
42. N Azaria & Z Robinson, ‘The Revenue Raising Capabilities of a VAT System in Developing Countries’, South African Journal of Economic and Management Studies, Vol 8, No. 1, 2005.
43. M Keen & A Simone, ‘Tax Policy in Developing Countries: Some Lessons for the 1990s and Some Challenges Ahead’, in S Gupta, G Inchauste & B Clements, Helping Countries Develop: The Role of Fiscal Policy, IMF, 2004. 44. M Keen, VAT Attacks, IMF Working Paper No. 07/142, 2007.
45. T Baunsgaard & M Keen, Tax Revenue and (or?) Trade Liberalization, IMF, 2005; L Ebrill, M Keen, J Bodin, & V Summers, The Modern VAT, IMF, 2001; M Keen & B Lockwood, The Value-Added Tax: Its Causes and Consequences, IMF Working Paper No. 07/183, 2007.
46. N Azaria & Z Robinson, ‘The Revenue Raising Capabilities of a VAT System in Developing Countries’, South African Journal of Economic and Management Studies, Vol 8, No. 1, 2005.
47. N Gemmell & O Morrissey, ‘Distribution and Poverty Impacts of Tax Structure Reform in Developing Countries: How Little We Know’, Development Policy Review, Vol 23, No. 2, 2005.
48. S Munoz & S Cho, ‘Social Impact of a Tax Reform: Case of Ethiopia’, in S Gupta, B Clements & G Inchauste, Helping Countries Develop: The Role of Fiscal Policy, IMF, 2004.
49. V Tanzi & H Zee, Tax Policy for Emerging Markets: Developing Countries, IMF Working Paper No. 00/35, 2000. 50. E Ahmed & N Stern, ‘Alternative Sources of Government Revenue: Illustrations from India 1979-80’, in D Newbery & N Stern (eds), The Theory of Taxation for Developing Countries, Oxford University Press, 1987; E Ahmed & N Stern, The Theory and Practice of Tax Reform in Developing Countries, Cambridge University Press, 1991.
51. N Gemmell & O Morrissey, ‘Distribution and Poverty Impacts of Tax Structure Reform in Developing Countries: How Little We Know’, Development Policy Review, Vol 23, No. 2, 2005.
52. S Gupta & S Tareq, ‘Mobilizing Revenue: Strengthening domestic revenue bases is key to creating fiscal space for Africa's developmental needs’, Finance and Development, Vol 45, No. 3, 2008; M Keen & A Simone, ‘Tax Policy in Developing Countries: Some Lessons for the 1990s and Some Challenges Ahead’, in S Gupta, G Inchauste & B Clements, Helping Countries Develop: The Role of Fiscal Policy, IMF, 2004.
53. A Cobham, R Baird & A Hogg, The Morning After The Night Before: The impact of the financial crisis on the developing world, Christian Aid, 2008.
54. O-H Fjeldstad & M Moore, ‘Revenue authorities and public authorities in sub-Saharan Africa’, Journal of Modern African Studies, Vol 47, No. 1, 2009; M Kidd & W Crandall, Revenue authorities: an evaluation of their impact on revenue administration reform, IMF Working Paper No. 06/240, 2006. 55. M Ross, ‘Does taxation lead to representation?’, British Journal of Political Science, Vol 34, 2004.
56. G Cornia, ‘Adjustment Policies 1980-1985: Effects on Child Welfare’, in G Cornia, R Jolly & F Stewart, Adjustment with a Human Face Volume 1, Oxford University Press, 1987; I Nooruddin & J Simmons, ‘The Politics of Hard Choices: IMF Programs and Government Spending’, International Organization, Vol 60, 2006; M Torrance & E Lochery, An analysis of the IFIs' fiscal policy recommendations, Oxford Council on Good Governance, 2006.
57. R Gordon & W Li, Tax Structure in Developing Countries: Many Puzzles and a Possible Explanation, NBER Working Paper No. 11267, 2005; C Heady, ‘Taxation policy in low-income countries’, in T Addison & A Roe, Fiscal Policy for Development, Palgrave Macmillan/UNU WIDER, 2004.
58. C Heady, ‘Taxation policy in low-income countries’, in T Addison & A Roe, Fiscal Policy for Development, Palgrave Macmillan/UNU WIDER, 2004.
59. V Tanzi & H Zee, Tax Policy for Emerging Markets: Developing Countries, IMF Working Paper No. 00/35, 2000, p4.
60. M Torrance & E Lochery, An analysis of the IFIs' fiscal policy recommendations, Oxford Council on Good Governance, 2006.
28
61. J Vreeland, ‘IMF program compliance: Aggregate index versus policy specific research strategies’, Review of International Organization, Vol 1, 2006. 62. The year attached to each document refers to the year of writing, not that of publication.
63. M Edwards, ‘Investor Responses to IMF Program Suspensions: Is Noncompliance Costly?’, Social Science Quarterly, Vol 84, No. 4, 2005; P Dhonte, Conditionality as an Instrument of Borrower Credibility, IMF Paper on Policy Analysis and Assessment PPAA 97/2, 1997; L Martin & B Simmons, ‘Theoretical and Empirical Studies of International Institutions’, International Organization, Vol 52, No. 4, 1998; B Simmons, ‘International Law and State Behavior: Commitment and Compliance in International Monetary Affairs’, American Political Science Review, Vol 94, No. 4, 2000.
64. M Keen & M Mansour, Revenue Mobilization in Sub-Saharan Africa: Key Challenges from Globalization, IMF, 2008.
65. S Gupta & S Tareq, ‘Mobilizing Revenue: Strengthening domestic revenue bases is key to creating fiscal space for Africa's developmental needs’, Finance and Development, Vol 45, No. 3, 2008.
66. S Gupta & S Tareq, ‘Mobilizing Revenue: Strengthening domestic revenue bases is key to creating fiscal space for Africa's developmental needs’, Finance and Development, Vol 45, No. 3, 2008; M Keen & M Mansour, Revenue Mobilization in Sub-Saharan Africa: Key Challenges from Globalization, IMF, 2008; M Keen & A Simone, ‘Tax Policy in Developing Countries: Some Lessons for the 1990s and Some Challenges Ahead’, in S Gupta, G Inchauste & B Clements, Helping Countries Develop: The Role of Fiscal Policy, IMF, 2004.
67. Mauritius has recently led reductions to the unprecedented level of 20 per cent on its statutory rate: M Keen & M Mansour, Revenue Mobilization in Sub-Saharan Africa: Key Challenges from Globalization, IMF, 2008.
68. M Keen & M Mansour, Revenue Mobilization in Sub-Saharan Africa: Key Challenges from Globalization, IMF, 2008. 69. Sudan ASSESS, 2004.
70. M Keen & M Mansour, Revenue Mobilization in Sub-Saharan Africa: Key Challenges from Globalization, IMF, 2008; V Tanzi & H Zee, Tax Policy for Emerging Markets: Developing Countries, IMF Working Paper No. 00/35, 2000.
71. C Heady, ‘Taxation policy in low-income countries’, in T Addison & A Roe, Fiscal Policy for Development, Palgrave Macmillan/UNU WIDER, 2004.
72. Angola Public Information Notice, 2001 and 2005; Equatorial Guinea AIV, 2003; Nigeria SI, 2005; Sudan Public Information Notice, 1998.
73. Kenya, Malawi, Nigeria, Tanzania, Uganda and Zambia already had a VAT by the point of the first registered IMF country document in the sample.
74. Independent Evaluation Office, International Monetary Fund, Evaluation Report: Fiscal Adjustment in IMF-Supported Programs, IEO, 2003. 75. Ethiopia PFP, 1998.
76. As suggested in the theoretical overview above, excises are generally the most progressive form of indirect taxation in developing countries due to their focus upon alcohol, cars and other luxury goods. 77. Ethiopia AIV, 2004. 78. Eg Botswana AIV, 2007. 79. Equatorial Guinea AIV, 2006. 80. Equatorial Guinea AIV, 2005 and 2006; Nigeria AIV, 2002. 81. Sudan ASSESS, 2002.
82. M Keen & M Mansour, Revenue Mobilization in Sub-Saharan Africa: Key Challenges from Globalization, IMF, 2008, p4. 83. Ghana PRSP, 2000. 84. DRC PRSP, 2006. 85. Transparency International, Corruption Perceptions Index 2008, TI, 2008; D Kaufmann, A Kraay & M Mastruzzi, Governance Matters VII: Governance Indicators for 1996-2007, World Bank, 2008. 86. DRC AIV, 2003. 87. Botswana AIV, 2006.
29
88. Independent Evaluation Office, International Monetary Fund, Evaluation Report: Fiscal Adjustment in IMF-Supported Programs, IEO, 2003.
89. A likelihood ratio test is employed in STATA 10.0SE, which tests the null hypothesis of independence between two distributions. To perform this test it must be assumed that the dependent variable, the policy recommendation, has equal distances between the different categories. Although this is slightly unrealistic, it is not unreasonable to assume that recommendations are distributed in an approximately uniform fashion.
90. Specifically, the maximum likelihood Generalized Linear Latent and Mixed Models (GLLAMM) process with up to 12 adaptive quadrature iterations was employed, following S Rabe-Hesketh, A Skrondal & A Pickles, ‘Maximum likelihood estimation of limited and discrete dependent variable models with nested random effects’, Journal of Econometrics, Vol 128, No. 2, 2005. A number of independent variables were employed, and include all those listed in Table 5, in addition to controls for the time since the last recommendation, PRSP papers, trading blocs and specific tax and collection rates where necessary. While the results are broadly consistent with those reported here, we do not include them for reasons of space and because of concern over the limited size of the sample. These results are available on request.
91. Regression analysis shows that VAT base recommendations may be more responsive to country characteristics. More worrying, however, is the finding that aid-dependence appears to play no role in influencing recommendations on VAT or CIT. This is a question for further research.
92. In the case of Nigeria, for example, the distinction between federal and total national revenues is very significant given that Nigeria’s 36 states have significant revenue mobilisation powers.
93. Indirect taxes thus include sales, VAT, excises etc imposed on imports. In the cases of Nigeria, Sierra Leone 2005 and Zambia, such taxes cannot be separated from trade revenues, and thus remain a part of trade taxes.
94. For example, Senegal in 1992 has been removed from my subsequent analysis because of suspect measurement.
95. In the six cases where the fiscal year does not coincide with the calendar year, tax data has been coded as the calendar year for which the fiscal year has more months in common. In the four cases where the fiscal year begins 1 July, these have been coded forward to reflect the forward-looking nature of policy (eg in Kenya the fiscal year 2001/2 beginning 1 July is coded as 2002).
96. Correlating the top-level tax data shows extremely high correlation coefficients: using the 83 shared observations we find r=0.9924 for total revenues (including grants) and r=0.9916 for tax revenues.