Embed Size (px)
Citation preview
Electronic Supporting Information
One-pot, large-scale synthesis of magnetic activated carbon nanotubes and their
applications for arsenic removal
Jie Maa, Zhiliang Zhu
a, Bo Chen
a, Mingxuan Yang
a, Huiming Zhou
a, Chen Li
a, Fei
Yua,b
*, Junhong Chena,c
*
a State Key Laboratory of Pollution Control and Resource Reuse, School of Environmental
Science and Engineering, Tongji University, 1239 Siping Road, Shanghai 200092, China
b School of Environmental Science and Engineering, Shanghai Jiao Tong University, 800 Dong
Chuan Road, Shanghai 200240, China
c Department of Mechanical Engineering, University of Wisconsin–Milwaukee, Milwaukee, WI
53211, USA
Materials and methods
Preparation of MI/CNTs composites.
The MI/CNTs composites were prepared by a alkali-activated method using
APCNTs. The APCNTs were prepared by the catalytic chemical vapor deposition
method[1]. In a typical synthesis, APCNTs and KOH powder were mixed in a
stainless steel vessel in an inter-gas atmosphere. The weight ratio of KOH to APCNTs
was 1:4. The APCNTs and KOH powder was mixed for 10 min using a mortar, which
resulted in a uniformly powder mixture. The mixture was then heated to 1023 K for 1
h under flowing argon in a horizontal tube furnace, washed in the deionized water,
and then dried.
Characterization methods
The microstructure and morphology of the APCNTs or MI/CNTs composites was
analyzed by transmission electron microscopy (TEM, JEOL 2100, Japan). X-Ray
diffraction (XRD) experiments were conducted on specimens of the magnetic hybrid
materials; the X-ray diffractometer (Bruker D8 Advance, Bruker AXS, Germany) was
operated at 40 KV and 40 mA. Nickel-filtered Cu Ka radiation was used in the incident
Electronic Supplementary Material (ESI) for Journal of Materials Chemistry AThis journal is © The Royal Society of Chemistry 2013
beam. The specific surface area, pore volume, and pore size distribution of the
MI/CNTs composites were calculated from the adsorption/ desorption isotherms of N2
at 77K by the multi-point BET and DFT method using an Autosorb-iQ-C
(Quantachrome, American, Inc.), and the sample was degassed at 373k for 4h prior to
the measurements. X-Ray photoelectron spectroscopy (XPS) analysis was carried out
in a Kratos Axis Ultra DLD spectrometer, using monochromated Al Ka X-rays at a
base pressure of 1×10⁻⁹
Torr. Survey scans determined between 1100 and 0 eV
revealed the overall elemental compositions of the sample, and regional scans for
specific elements were performed. The peak energies were calibrated by placing the
major C1s peak at 284.6 eV. Samples were prepared identically to those of the batch
experiments. Raman spectroscopy (JOBIN-YVON T64000) was used to further
characterize MI/CNTs. A TA Instruments® Q600 SDT thermal analyzer was used for
high-resolution thermogravimetric analysis (TG) and differential thermal analysis
(DTA). TG and DTA curves were obtained by heating approximately 10 mg of
MI/CNTs from 50 to 900°C at a heating rate of 10 °C/min in air. The magnetization
was measured using a superconducting quantum interference device magnetometer
(MPMS XL7, Quantum Design). The residual As(V) and As(III) concentrations in
solution were determined by an Inductively Coupled Plasma Optical Emission
Spectrometry (ICP-OES, Optima 2000, Perkin Elmer, U.K.).
Batch sorption experiments
Batch experiments were conducted to evaluate the adsorption performance of
As(V) or As(III) on the adsorbents. Two typical materials, APCNTs and MI/CNTs,
were selected as adsorbents for As(V) or As(III) adsorption in an aqueous solution.
1000 mg·L-1
Stock solution of As (V) and As(III) was prepared by dissolving 4.1653
g Na2HAsO4·7H2O and 1.732 g NaAsO2, respectively, in 1L deionized water. And
working solutions of required concentrations were obtained by diluting the As(V) and
As(III) stock solution with deionized water. All the sorption tests were conducted in
well-capped 250 mL flasks containing 50 mL As(V) or As(III) solution with required
concentration. After 10 mg of adsorbent was added, the flasks were shaken in a
thermostatic shaker at 150 rpm at 298K for 24 h. All the adsorption experiments were
Electronic Supplementary Material (ESI) for Journal of Materials Chemistry AThis journal is © The Royal Society of Chemistry 2013
conducted in duplicate, and only the mean values were reported. The maximum
deviation for the duplicates was usually less than 5%. The blank experiments without
the addition of APCNTs or MI/CNTs were conducted to ensure that the decrease in
the concentration was actually due to the adsorption of APCNTs or MI/CNTs, rather
than by the adsorption on the glass bottle wall. After adsorption, the adsorbent was
separated by a 0.45μm membrane. The residual arsenic concentrations in solution
were determined by an Inductively Coupled Plasma Optical Emission Spectrometry
(ICP-OES, Agilent 720ES, USA). The adsorption isotherm was studied at pH 5.5,the
initial concentration of As(V) or As(III) solution was set from 0.5 mg/L to 11 mg/L,
and the adsorption isotherms were then modeled using the Langmuir, Freundlich, and
Dubinin-Radushkevich (D-R) isothermal adsorption model.
The amount of adsorbed As(V) or As(III) on adsorbents ( tq , mg/g) was calculated
as follows:
m
VCCq tt )( 0
(1),
Where 0c and tc are the As(V) or As(III) concentrations at the beginning and after
a period of time (mg/L); V is the initial solution volume (L); and m is the
adsorbent weight (g).
UV-Visible Spectroscopy
Measurements were made on the CNTs solution in quartz cuvettes using a
double-beam UV-visible spectrophotometer(UV759UV-VIS, Shanghai Precision &
Scientific Instrument Co. Ltd.) in the 200-800 nm range. Since the Beer-Lambert law
is not obeyed at strong absorbance[2], the CNTs solution were diluted appropriately to
keep the measured values of absorbance in the range of 0.1-2 in the entire wavelength
range[3]. A UV-visible absorption-based approach is used for a direct measurement of
the concentration of CNTs[4, 5]. A calibration plot is then made by monitoring the
intensity of the peak as a function of the true concentration of the CNTs. Earlier
reference stated that the adsorption peak at ~265 nm is a signature of the surface
π-plasmon exciation of the CNTs. Thus, we build a calibration curve by monitoring
Electronic Supplementary Material (ESI) for Journal of Materials Chemistry AThis journal is © The Royal Society of Chemistry 2013
the adsorbance value for this peak at 265 nm as a funciton of CNT concentration, and
then we are able to estimate the unknown concentration of CNTs in the solution by
measuring its optical absorbance.
Data analysis
Langmuir model
The form of the Langmuir isotherm can be represented by the following
equation:
CK
CKqq
L
Lme
1 (2)
where qe is the amount of dye adsorbed per gram of adsorbent (mg/g), C denotes the
equilibrium concentration of dye in solution (mg/L); KL represents the Langmuir
constant (L/mg) that relates to the affinity of binding sites; and qm is a theoretical
limiting adsorption capacity when the monolayer surface is fully covered with dye
molecules and assists in the comparison of adsorption performance (mg/g). Another
important parameter, RL (the separation factor or equilibrium parameter, which can be
used to determine the feasibility of adsorption in a given concentration range over
adsorbent), also evaluated in this study, was determined from the relation[6]:
01
1
CKR
L
L
(3)
where KL is the Langmuir adsorption constant (l/mg) and C0 is the initial dye
concentration (20mg/l). Ho and McKay[7] established that (1) 0<RL<1 for favorable
adsorption, (2) RL>1 for unfavorable adsorption, (3) RL=1 for linear adsorption and (4)
RL=0 for irreversible adsorption.
Freundlich model
The Freundlich isotherm model has the following form:
n
Fe CKq /1 (4)
where qe is the amount of dye adsorbed per gram of adsorbent (mg/g); C is the
equilibrium dye concentration in solution (mg/L); KF and n are the Freundlich
Electronic Supplementary Material (ESI) for Journal of Materials Chemistry AThis journal is © The Royal Society of Chemistry 2013
constants, which represent the adsorption capacity and the adsorption strength,
respectively. The magnitude of 1/n quantifies the favorability of adsorption and the
degree of heterogeneity of the adsorbent surface.
Dubinin-Radushkevich (D-R) model
The D-R isotherm model has the following form:
2lnln Bqq me (5)
B, a constant related to the mean free energy of adsorption (mol2/kJ
2); qm, the
theoretical saturation capacity; and ε, the Polanyi potential, which is equal to
)1
1ln(C
RT (6)
where R (J·mol-1·K-1
) is the gas constant and T (K) is the absolute temperature. For the
D-R isotherm model, from B values the mean energy of adsorption, E, can be
calculated using the relation[8]
B
E2
1
(7)
Based on equations (5), (6), and (7), the isotherm constants, E and determination
coefficients were calculated. The mean energy of adsorption (E) is the free energy
change when one mole of ions is transferred from infinity in the solution to the
surface of the solid. When one mole of ions is transferred, its value is in the range of
1-8 kJ·mol-1
for physical adsorption[9]. The value of E is between 8 and 16 kJ·mol-1
for an adsorption process by ion-exchange. A value of E in the range of 20-40 kJ·mol-1
is indicative of chemisorption[10].
Electronic Supplementary Material (ESI) for Journal of Materials Chemistry AThis journal is © The Royal Society of Chemistry 2013
1 2 3 4 5 6 7 8 9 10
Cu
Cu
Fe
Fe
Cu
Fe
O
C
Inte
ns
ity
(a.u
)
Energy(KeV)
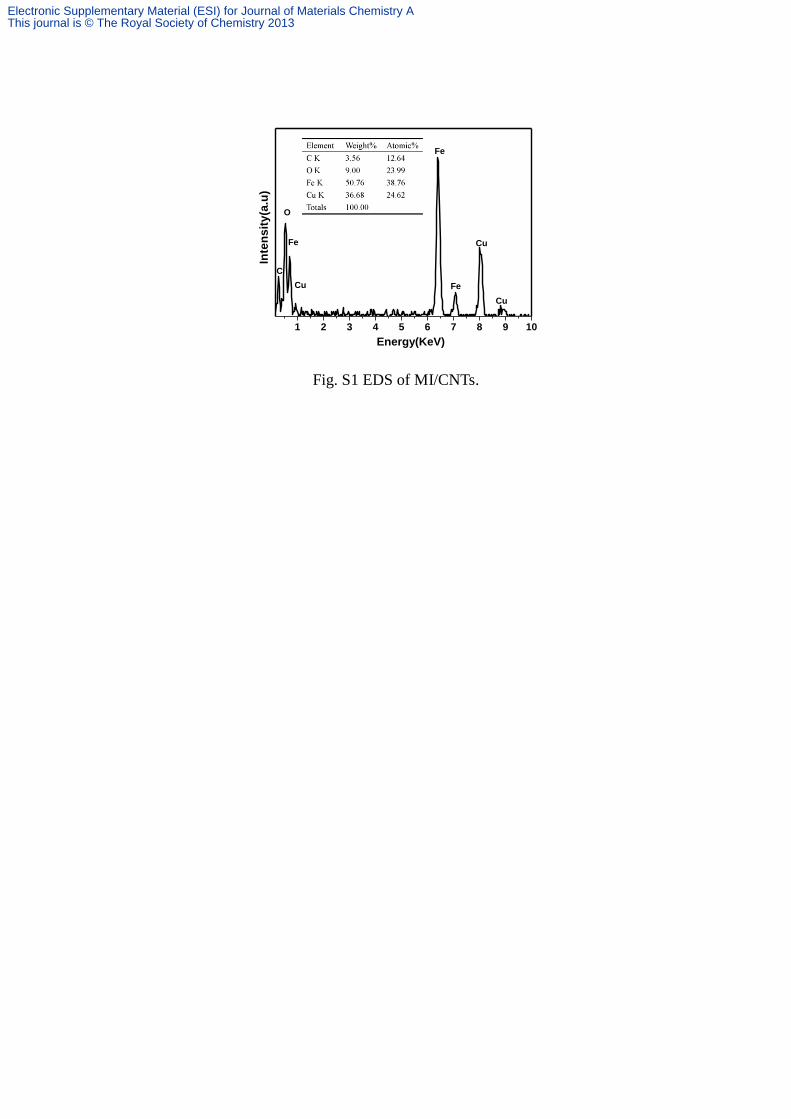
Fig. S1 EDS of MI/CNTs.
Electronic Supplementary Material (ESI) for Journal of Materials Chemistry AThis journal is © The Royal Society of Chemistry 2013
200 300 400 500 600 700 800
0.0
0.2
0.4
0.6
0.8
1.0
1.2
0.00625g/L 0.0125g/L
0.025g/L
0.05g/L
0.1g/L
Ab
so
rba
nc
e
Wavelength (nm)
0.2g/L
Residual CNTs
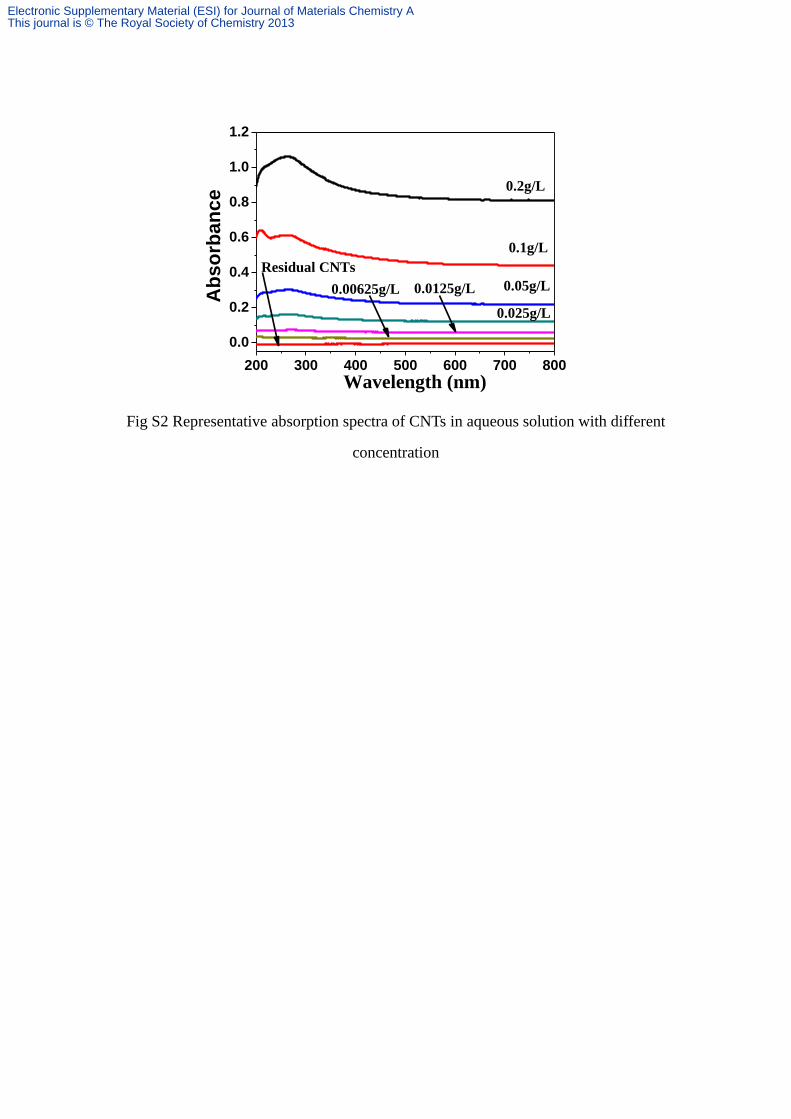
Fig S2 Representative absorption spectra of CNTs in aqueous solution with different
concentration
Electronic Supplementary Material (ESI) for Journal of Materials Chemistry AThis journal is © The Royal Society of Chemistry 2013
0.0 0.2 0.4 0.6 0.8 1.0 1.2
0.00
0.05
0.10
0.15
0.20 Y=0.1862X-0.0046(R2=0.9931)
Ab
so
rba
nc
e
Concentration of CNTs(g/L)
Absorbance at 265 nm
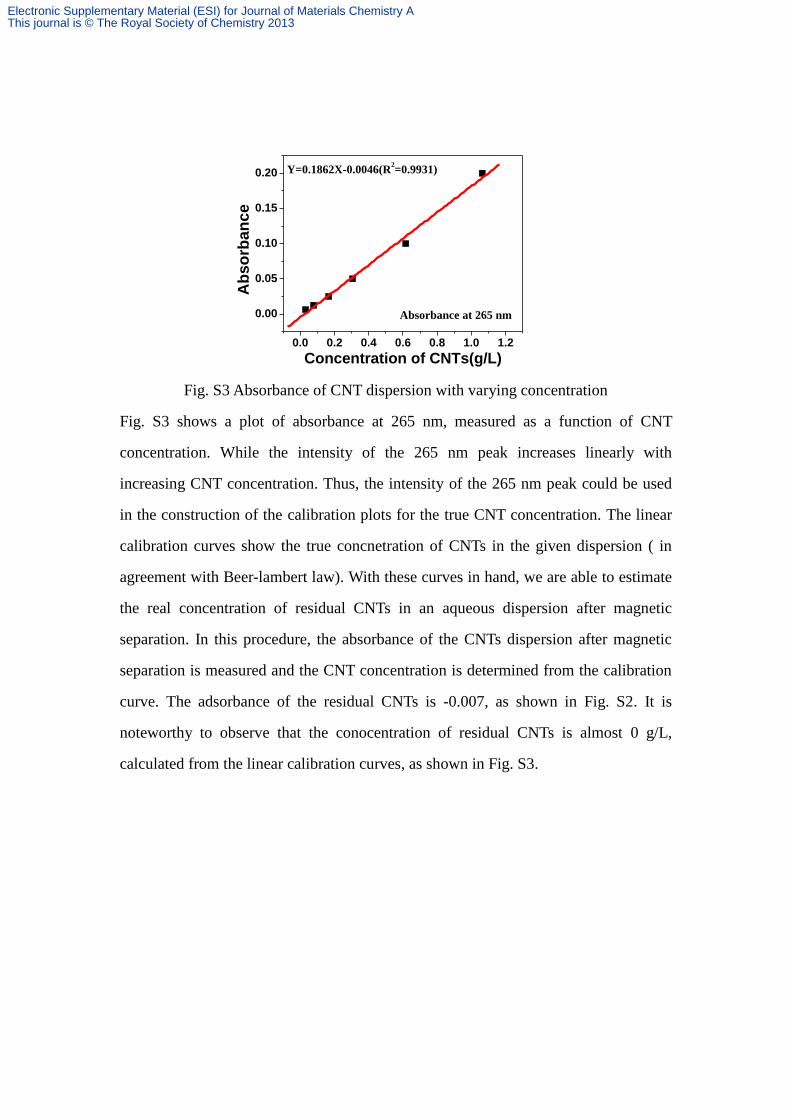
Fig. S3 Absorbance of CNT dispersion with varying concentration
Fig. S3 shows a plot of absorbance at 265 nm, measured as a function of CNT
concentration. While the intensity of the 265 nm peak increases linearly with
increasing CNT concentration. Thus, the intensity of the 265 nm peak could be used
in the construction of the calibration plots for the true CNT concentration. The linear
calibration curves show the true concnetration of CNTs in the given dispersion ( in
agreement with Beer-lambert law). With these curves in hand, we are able to estimate
the real concentration of residual CNTs in an aqueous dispersion after magnetic
separation. In this procedure, the absorbance of the CNTs dispersion after magnetic
separation is measured and the CNT concentration is determined from the calibration
curve. The adsorbance of the residual CNTs is -0.007, as shown in Fig. S2. It is
noteworthy to observe that the conocentration of residual CNTs is almost 0 g/L,
calculated from the linear calibration curves, as shown in Fig. S3.
Electronic Supplementary Material (ESI) for Journal of Materials Chemistry AThis journal is © The Royal Society of Chemistry 2013
0 100 200 300 400 500 6000
1
2
3
4
5
Ab
so
rpti
on
ca
pa
cit
y(m
g/g
)
Time(s)
As(V)
As(III)
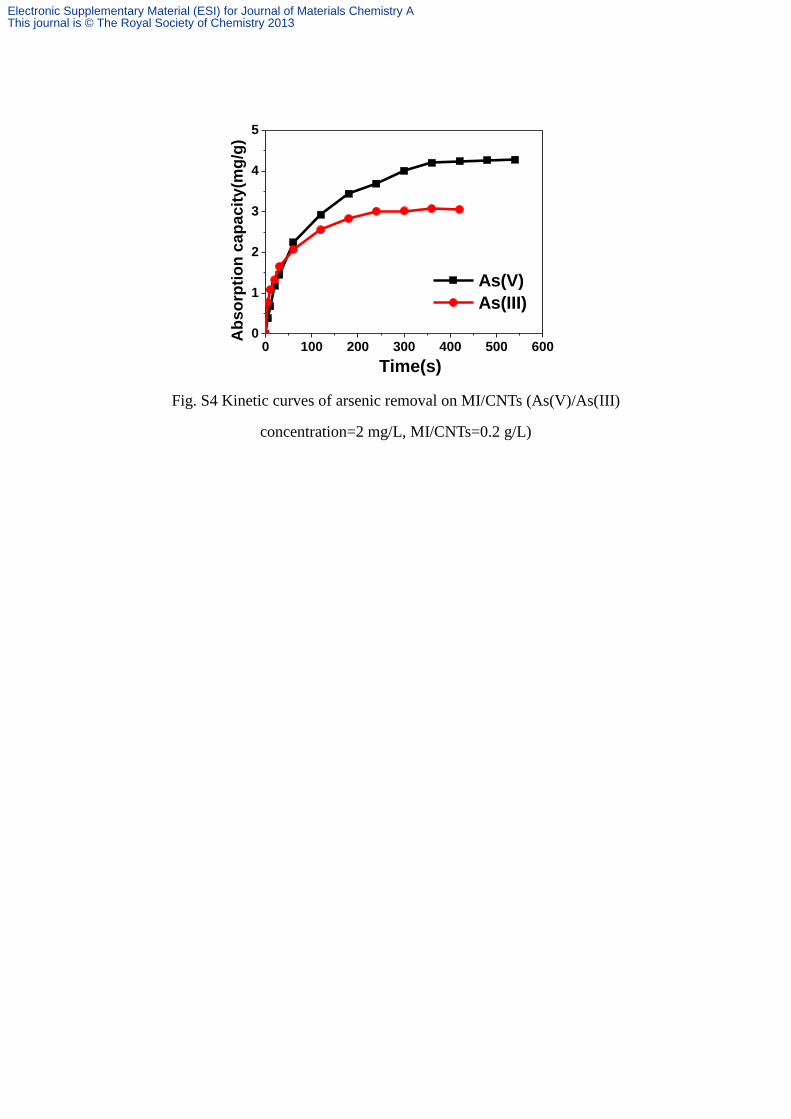
Fig. S4 Kinetic curves of arsenic removal on MI/CNTs (As(V)/As(III)
concentration=2 mg/L, MI/CNTs=0.2 g/L)
Electronic Supplementary Material (ESI) for Journal of Materials Chemistry AThis journal is © The Royal Society of Chemistry 2013
0 2 4 6 8 10
0.2
0.4
0.6
0.8
1.0
1.2
1.4 As(V)
As(III)
Ce
Ce/q
e
(a)
-1.5 -1.0 -0.5 0.0 0.5 1.0 1.5 2.0 2.5
0.0
0.5
1.0
1.5
2.0
2.5
(b)
As(V)
As(III)
lnq
e
lnCe
-1x10⁶ 0 1x10
62x10
63x10
64x10
65x10
66x10
6
-4.5
-4.0
-3.5
-3.0
-2.5
-2.0
(c)
As(V)
As(III)
lnq
e
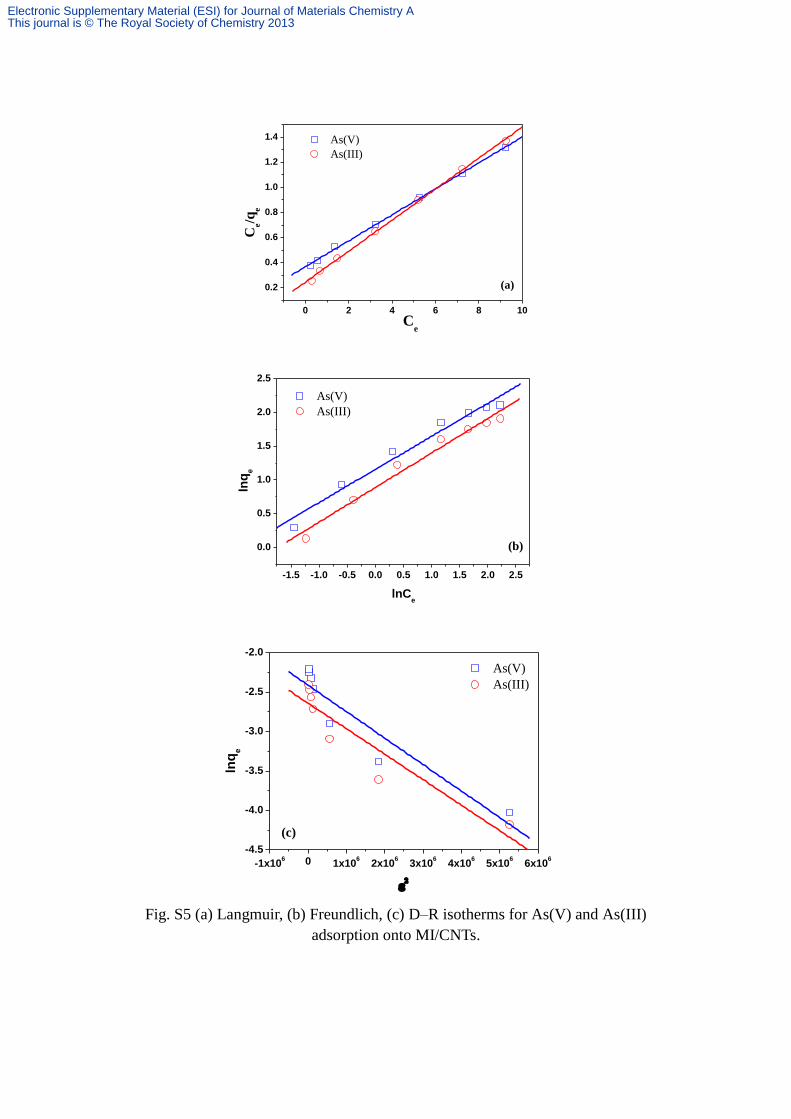
Fig. S5 (a) Langmuir, (b) Freundlich, (c) D–R isotherms for As(V) and As(III)
adsorption onto MI/CNTs.
Electronic Supplementary Material (ESI) for Journal of Materials Chemistry AThis journal is © The Royal Society of Chemistry 2013
50 48 46 44 42 40
Inte
ns
ity
(a.u
)
Binding Energy(eV)
(a)
As(V)
As(III)
50 48 46 44 42 40
(b)
Binding Energy(eV)
Inte
ns
ity
(a.u
)
As(V)
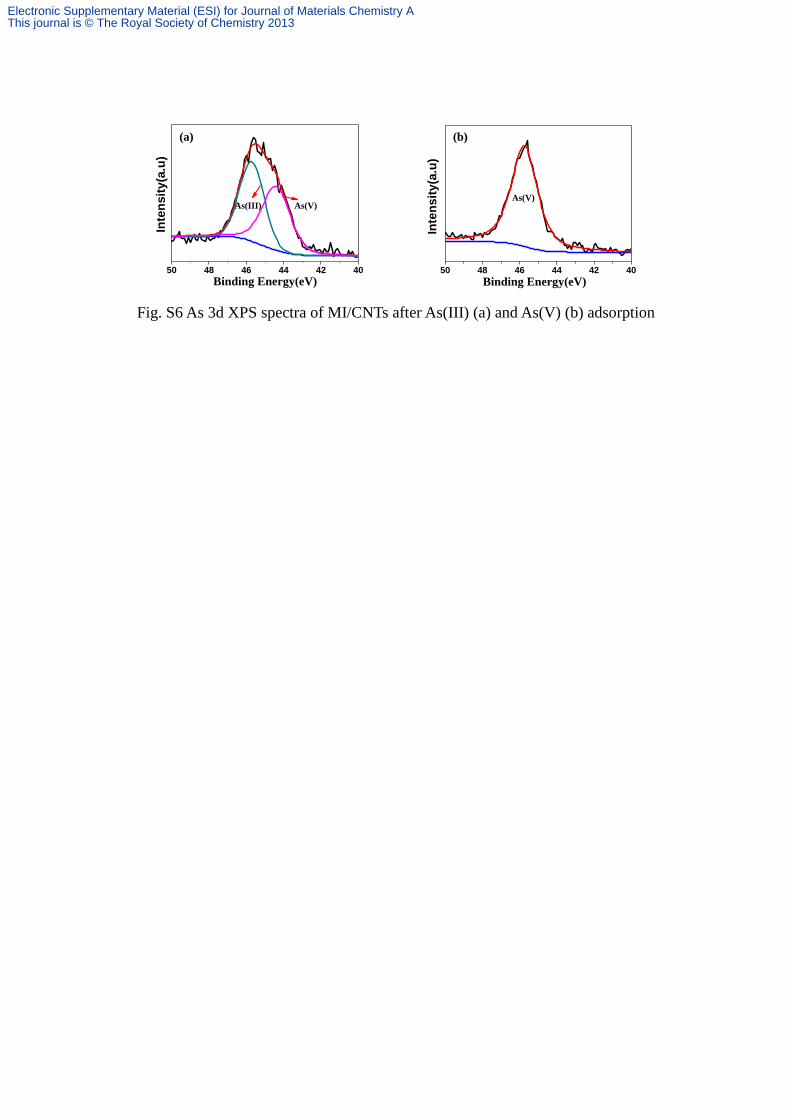
Fig. S6 As 3d XPS spectra of MI/CNTs after As(III) (a) and As(V) (b) adsorption
Electronic Supplementary Material (ESI) for Journal of Materials Chemistry AThis journal is © The Royal Society of Chemistry 2013
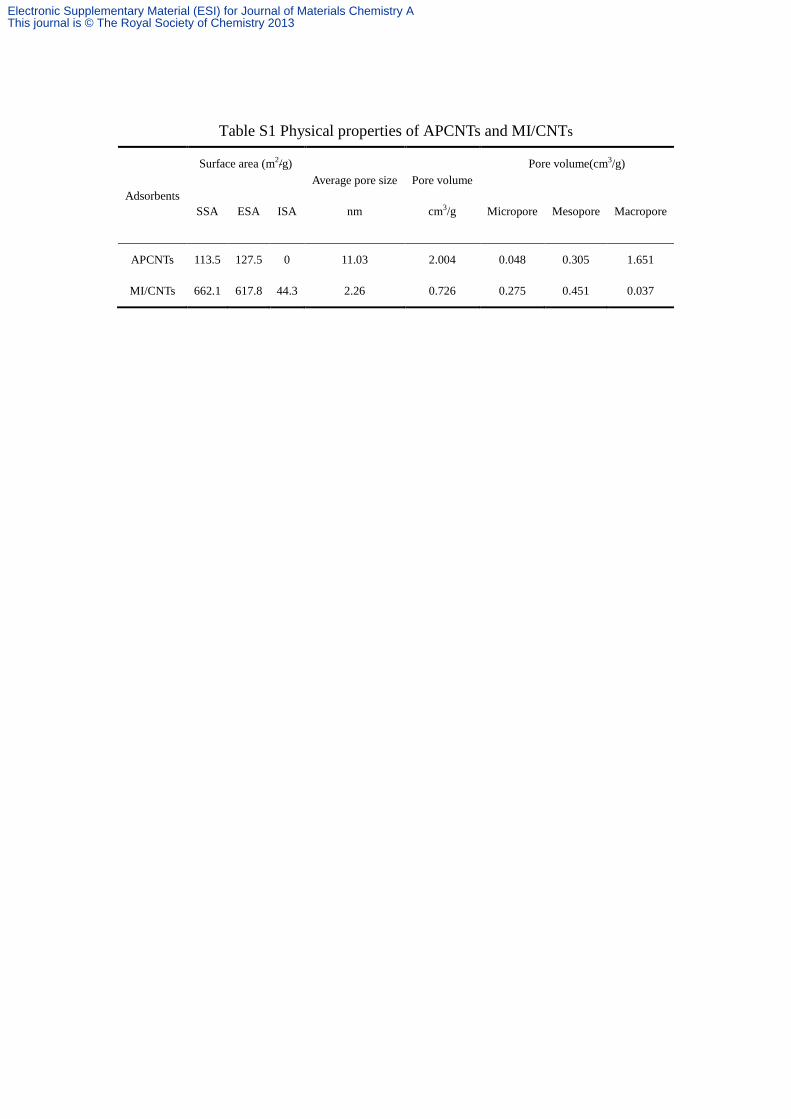
Table S1 Physical properties of APCNTs and MI/CNTs
Adsorbents
Surface area (m2/g)
Average pore size
nm
Pore volume
cm3/g
Pore volume(cm3/g)
SSA ESA ISA Micropore Mesopore Macropore
APCNTs 113.5 127.5 0 11.03 2.004 0.048 0.305 1.651
MI/CNTs 662.1 617.8 44.3 2.26 0.726 0.275 0.451 0.037
Electronic Supplementary Material (ESI) for Journal of Materials Chemistry AThis journal is © The Royal Society of Chemistry 2013
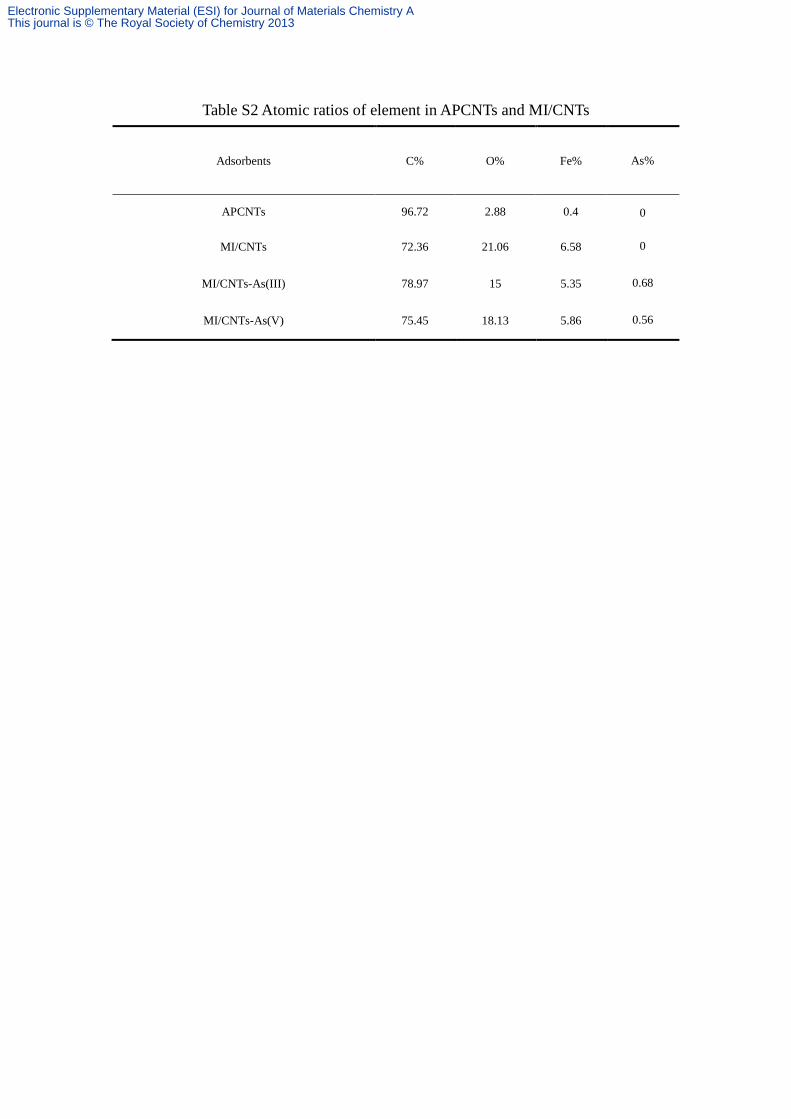
Table S2 Atomic ratios of element in APCNTs and MI/CNTs
Adsorbents C% O% Fe% As%
APCNTs 96.72 2.88 0.4 0
MI/CNTs 72.36 21.06 6.58 0
MI/CNTs-As(III) 78.97 15 5.35 0.68
MI/CNTs-As(V) 75.45 18.13 5.86 0.56
Electronic Supplementary Material (ESI) for Journal of Materials Chemistry AThis journal is © The Royal Society of Chemistry 2013
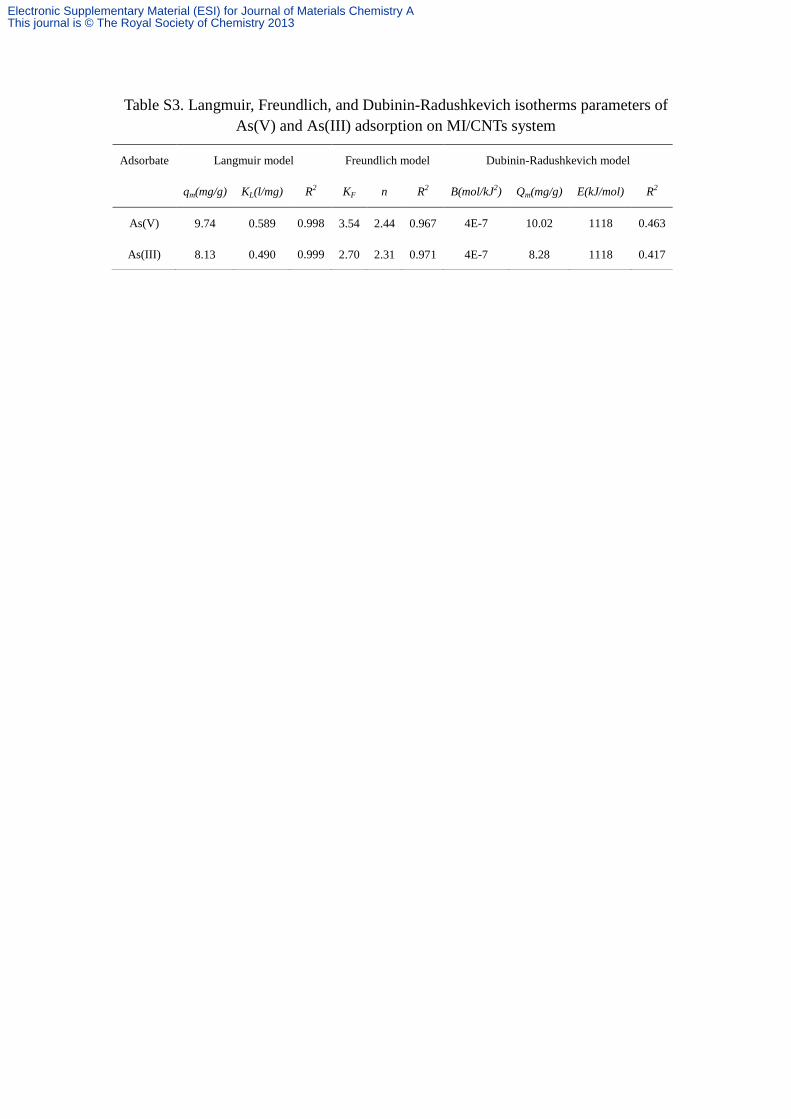
Table S3. Langmuir, Freundlich, and Dubinin-Radushkevich isotherms parameters of
As(V) and As(III) adsorption on MI/CNTs system
Adsorbate Langmuir model Freundlich model Dubinin-Radushkevich model
qm(mg/g) KL(l/mg) R2 KF n R2 B(mol/kJ2) Qm(mg/g) E(kJ/mol) R2
As(V) 9.74 0.589 0.998 3.54 2.44 0.967 4E-7 10.02 1118 0.463
As(III) 8.13 0.490 0.999 2.70 2.31 0.971 4E-7 8.28 1118 0.417
Electronic Supplementary Material (ESI) for Journal of Materials Chemistry AThis journal is © The Royal Society of Chemistry 2013
Reference
[1] J. Ma, J.N. Wang, X.X. Wang, J Mater Chem 19 (2009) 3033.
[2] J.F. Offersgaard, H. Ojelund, Appl Spectrosc 56 (2002) 469.
[3] J.L. Bahr, E.T. Mickelson, M.J. Bronikowski, R.E. Smalley, J.M. Tour, Chem Commun (2001)
193.
[4] S. Attal, R. Thiruvengadathan, O. Regev, Anal Chem 78 (2006) 8098.
[5] S.H. Jeong, K.K. Kim, S.J. Jeong, K.H. An, S.H. Lee, Y.H. Lee, Synthetic Met 157 (2007) 570.
[6] G.H. Sonawane, V.S. Shrivastava, Desalin Water Treat 29 (2011) 29.
[7] Y.S. Ho, G. McKay, Chem Eng J 70 (1998) 115.
[8] J.P. Hobson, J. Phys. Chem. 73 (1969) 2720.
[9] M.S. Onyango, Y. Kojima, O. Aoyi, E.C. Bernardo, H. Matsuda, J Colloid Interf Sci 279 (2004)
341.
[10] S.S. Tahir, N. Rauf, Chemosphere 63 (2006) 1842.
Electronic Supplementary Material (ESI) for Journal of Materials Chemistry AThis journal is © The Royal Society of Chemistry 2013


![Synthesis and characterization of magnetic activated ...Synthesis and characterization of magnetic activated carbon ... soluble organic compounds and heavy metals [22]. Despite performing](https://img.pdfslide.us/doc/110x75/5fe81d3f1c4f680a505d4f65/synthesis-and-characterization-of-magnetic-activated-synthesis-and-characterization.jpg)