Embed Size (px)
Citation preview
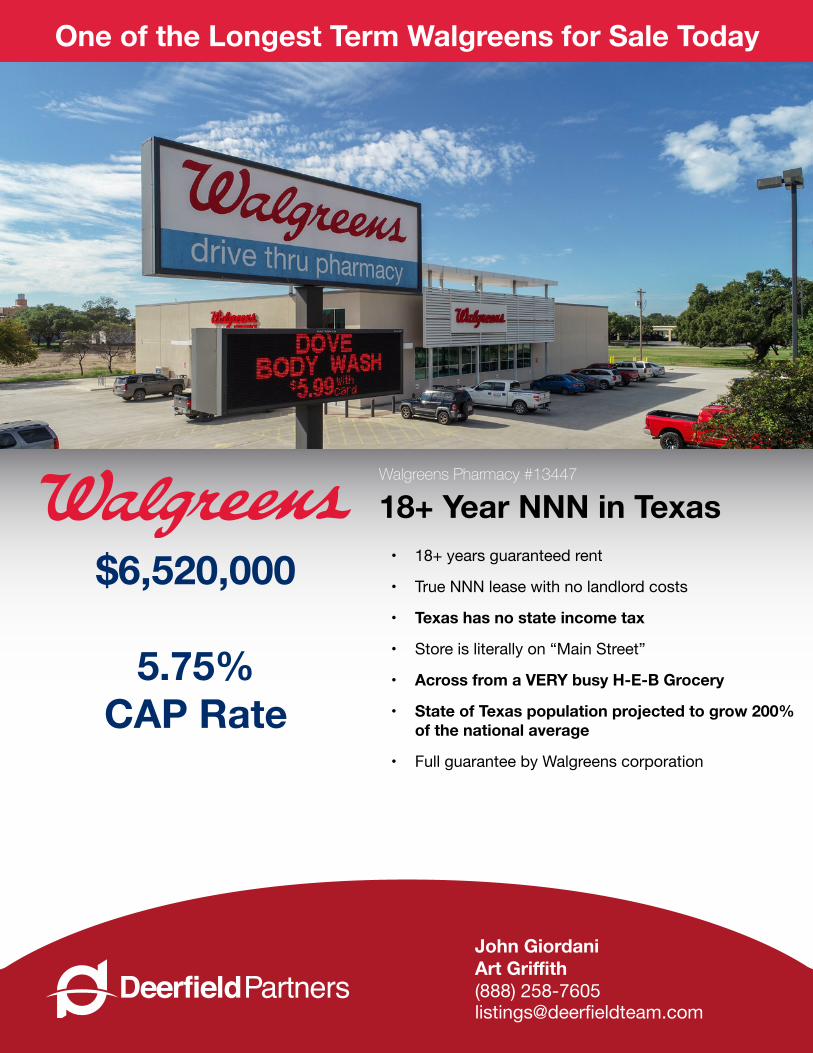
Walgreens Pharmacy #13447 18+ Year NNN in Texas
• 18+ years guaranteed rent
• True NNN lease with no landlord costs
• Texas has no state income tax
• Store is literally on “Main Street”
• Across from a VERY busy H-E-B Grocery
• State of Texas population projected to grow 200% of the national average
• Full guarantee by Walgreens corporation
$6,520,000
5.75%CAP Rate
DeerfieldPartnersJohn GiordaniArtGriffith(888) [email protected]
One of the Longest Term Walgreens for Sale Today

Walgreens Pharmacy #13447 Uvalde, Texas
DeerfieldPartnersJohn GiordaniArt GriffithCall: (888) 258-7605Email: [email protected]
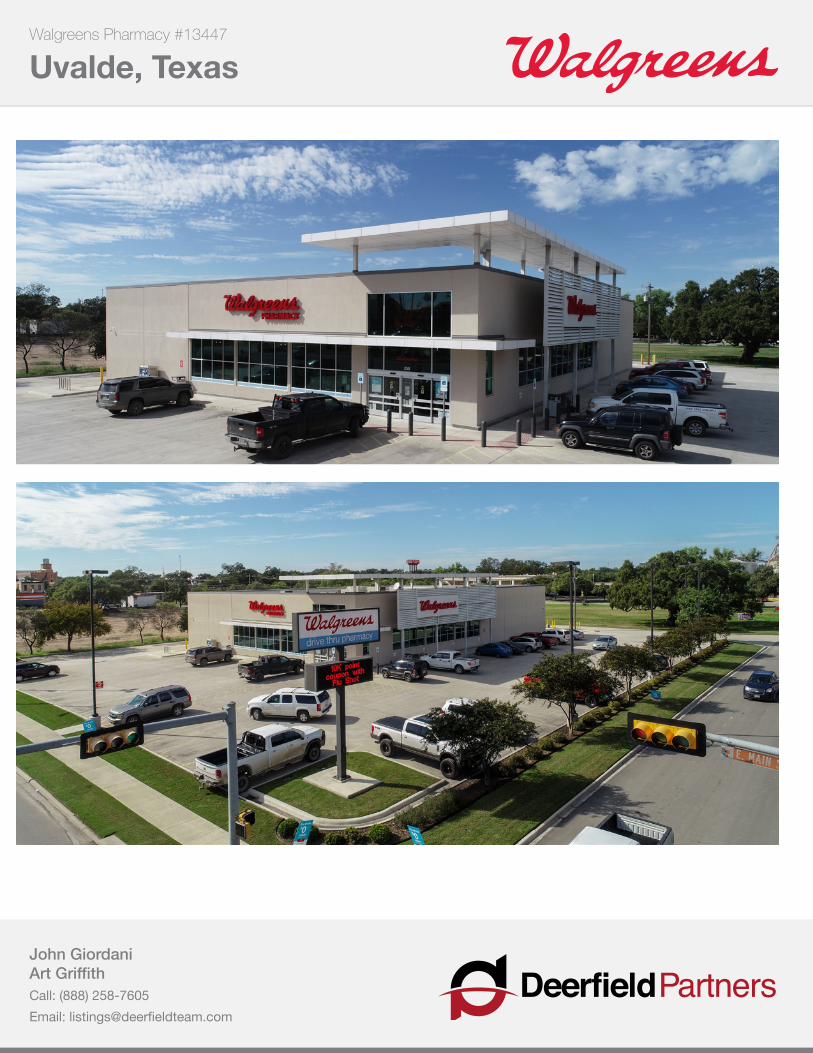
ThisWalgreensisoneofthe longestremainingleasetermsavailableforsale inthemarkettoday. (NewWalgreensleasesareonly15yearsguaranteed.)Thestoreisliterallyon“MainStreet,”acrossfromaVERYbusyH-E-BGrocery.Othernationalretailersinthetradecorridorinclude:TractorSupplyCo.,McDonald’s,SonicDrive-In,AutoZone,O’ReillyAutoParts,FamilyDollar,Aaron’sFurnitureStore,andChurch’sChicken.TheUvaldeConventionandVisitorsBureauisacrossthestreetfromthesite,andjustablockawayareUvaldeCountyandMunicipalCourtHouses,aswellastheUSPostOffice.
InvestmentSummary
1 Mile 3 Mile 5 Mile
Population 7,818 18,809 21,150Avg. HH Income $55,037 $56,391 $58,039
Price $6,520,000CAP Rate 5.75%
Annual Income $375,000Years Guaranteed 18+ years NNN

Walgreens Pharmacy #13447 Uvalde, Texas
DeerfieldPartnersJohn GiordaniArt GriffithCall: (888) 258-7605Email: [email protected]
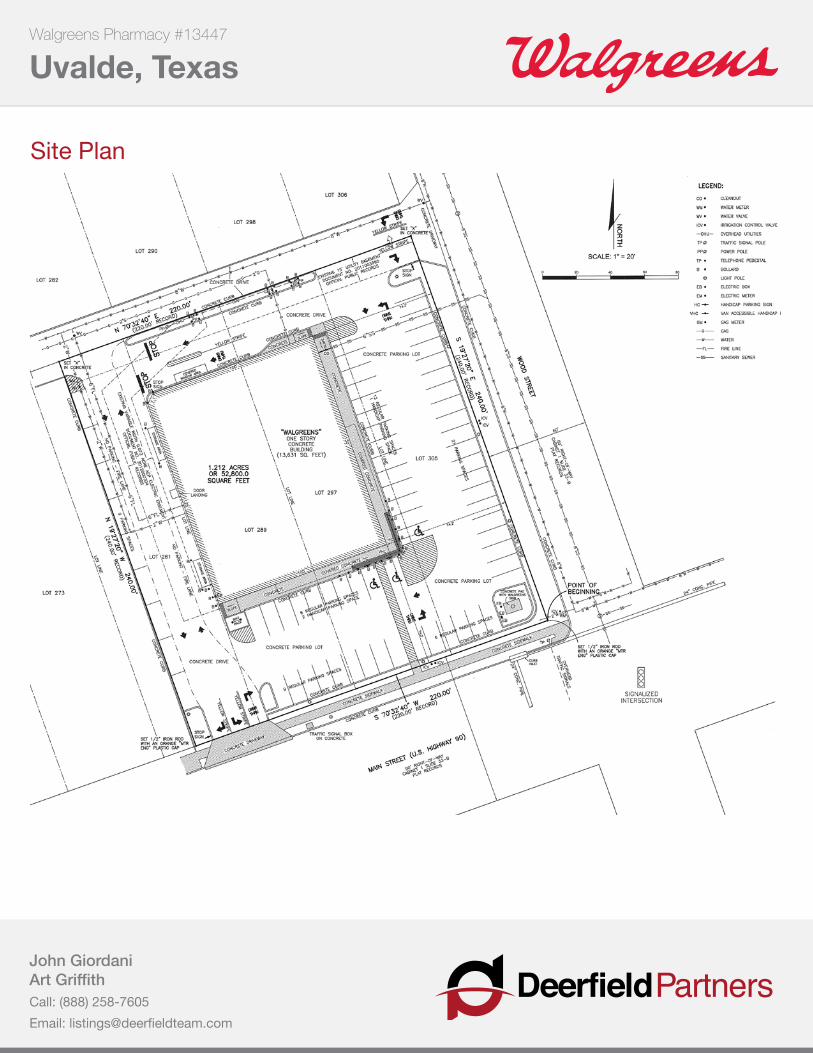
PropertyDetailsandLeaseSummaryAddress 250EastMainSt.,Uvalde,TX78801
Year Built 2012Building Size 13,650SquareFeet
Lot Size 1.21acresTenant Walgreens(NASDAQ:WBA)
Lease Start Date July9,2012Lease End Date July31,2087
Termination Options Tenantmayterminateasof7/31/2037,withtwelve(12)monthswrittennotice.
RecentPrototypeFreestandingWalgreensonTrueHardCorner

Walgreens Pharmacy #13447 Uvalde, Texas
DeerfieldPartnersJohn GiordaniArt GriffithCall: (888) 258-7605Email: [email protected]
RegionalMap
Walgreens Pharmacy #13447 Uvalde, Texas
DeerfieldPartnersJohn GiordaniArt GriffithCall: (888) 258-7605Email: [email protected]
Walgreens Pharmacy #13447 Uvalde, Texas
DeerfieldPartnersJohn GiordaniArt GriffithCall: (888) 258-7605Email: [email protected]
SitePlan

Walgreens Pharmacy #13447 Uvalde, Texas
DeerfieldPartnersJohn GiordaniArt GriffithCall: (888) 258-7605Email: [email protected]
AboutWalgreensBootsAllianceWalgreens Boots Alliance (Nasdaq: WBA) is the first global pharmacy-led, health and wellbeing enterprise. The Company’s heritage of trusted healthcare services through community pharmacy care and pharmaceutical wholesaling dates back more than 100 years.
Walgreens Boots Alliance is the largest retail pharmacy, health and daily living destination across the U.S. and Europe. Walgreens Boots Alliance and the companies in which it has equity method investments together have a presence in more than 25* countries and employ more than 385,000* people. The Company is a global leader in pharmacy-led, health and wellbeing retail and, together with the companies in which it has equity method investments, has more than 13,200* stores in 11* countries as well as one of the largest global pharmaceutical wholesale and distribution networks, with more than 390* distribution centers delivering to more than 230,000** pharmacies, doctors, health centers and hospitals each year in more than 20* countries. In addition, Walgreens Boots Alliance is one of the world’s largest purchasers of prescription drugs and many other health and wellbeing products. The Company’s size, scale, and expertise will help us to expand the supply of, and address the rising cost of, prescription drugs in the U.S. and worldwide.
Walgreens Boots Alliance is included in Fortune magazine’s 2018 list of the World’s Most Admired Companies. This is the 25th consecutive year that Walgreens Boots Alliance or its predecessor company, Walgreen Co., has been named to the list.
* As of 31 August 2017, using publicly available information for AmerisourceBergen.**For 12 months ending 31 August 2017, using publicly available information for AmerisourceBergen.

Walgreens Pharmacy #13447 Uvalde, Texas
DeerfieldPartnersJohn GiordaniArt GriffithCall: (888) 258-7605Email: [email protected]
WalgreensIncomeStatementsTrailing5Years

Walgreens Pharmacy #13447 Uvalde, Texas
DeerfieldPartnersJohn GiordaniArt GriffithCall: (888) 258-7605Email: [email protected]
WalgreensBootsAlliance--SegmentStructure
8
Walgreens Boots Alliance – Segment Structure
The largest retail pharmacy chain in Europe
A leading global pharmaceutical wholesaler
and distributor
A leading drugstore chain in the USA
The first global pharmacy-led, health and wellbeing enterprise in the world

Walgreens Pharmacy #13447 Uvalde, Texas
DeerfieldPartnersJohn GiordaniArt GriffithCall: (888) 258-7605Email: [email protected]
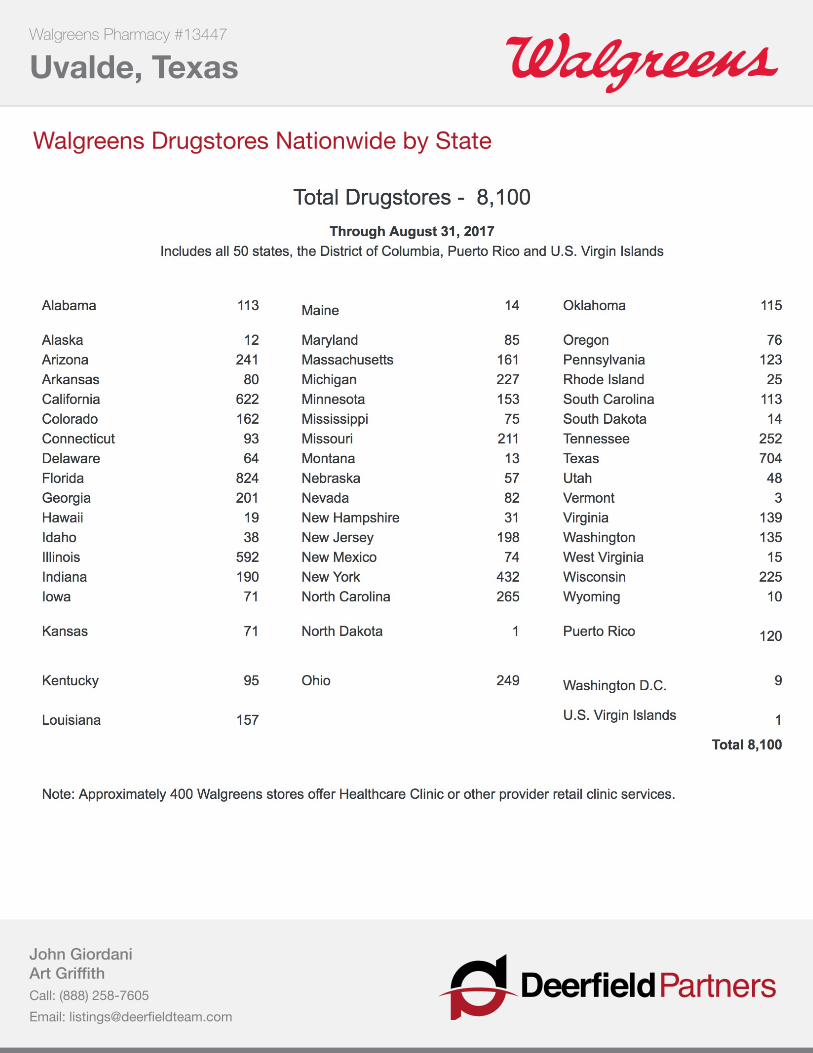
WalgreensBootsAlliance--RetailPharmacyUSADivisionOur Retail Pharmacy USA Division’s principal retail pharmacy brands are Walgreens and Duane Reade. Together, they form one of the largest drugstore chains in the U.S., operating 8,100* drugstores in 50* states, the District of Columbia, Puerto Rico and the U.S. Virgin Islands. As of August 2017, approximately 76 percent of the population of the U.S. lives within five miles of a Walgreens or Duane Reade.
We sell prescription and non-prescription drugs, as well as general merchandise, including household items, convenience and fresh foods, personal care, beauty care, photofinishing and candy. We offer our products and services through drugstores, as well as through mail, telephone and online. We also provide specialty pharmacy and respiratory services, and operate retail clinics.
Our services help improve health outcomes for patients and manage costs for payers including employers, managed care organizations, health systems, pharmacy benefit managers and the public sector. Our stores sell branded and own brand general merchandise. In addition, Walgreens has approximately 400 in-store clinic locations throughout the U.S., some of which are operated by the Company and some of which are operated by health system partners.
Prescription drugs account for 69 percent† of sales, while retail products are 31 percent.
Overall, we filled approximately 764 million† prescriptions in fiscal 2017. Adjusted to 30-day equivalents, we filled approximately 990 million† prescriptions in fiscal 2017. Third party sales, where reimbursement is received from managed care organizations, government and private insurance, were approximately 98 percent† of prescription sales.
We utilize our extensive retail network as a channel to provide affordable quality health and wellness services to our customers and patients, as illustrated by our ability to play a significant role in providing flu vaccines and other immunizations.
We have more than 78,000* healthcare service providers, including pharmacists, pharmacy technicians, nurse practitioners and other health related professionals. Through them we expect to continue to play a growing role in government and employer efforts to control escalating healthcare costs.
Our loyalty program, Balance® Rewards, is designed to reward our most valuable customers and encourage shopping in stores and online and allows customers the opportunity to earn points for purchasing select merchandise in addition to receiving special pricing on select products when shopping with a rewards card. Customers have the ability to instantly redeem rewards at our stores or through Walgreens.com. We had 88 million Balance® Rewards active members as of August 2017.
The Division’s strategy is designed to further transform our traditional drugstore by offering ultimate convenience, driving the best customer loyalty and delivering extraordinary customer and patient care. We seek to expand our product and service offerings across new channels and markets where, in addition to our stores, customers and patients can utilize our health system pharmacies, Walgreens.com, mobile applications and social media sites.
Walgreens Pharmacy #13447 Uvalde, Texas
DeerfieldPartnersJohn GiordaniArt GriffithCall: (888) 258-7605Email: [email protected]
WalgreensDrugstoresNationwidebyState

Walgreens Pharmacy #13447 Uvalde, Texas
DeerfieldPartnersJohn GiordaniArt GriffithCall: (888) 258-7605Email: [email protected]
Demographics-1MileRadius
Demographic and Income Profile250 E Main St, Uvalde, Texas, 78801 3 Prepared by Esri250 E Main St, Uvalde, Texas, 78801 Latitude: 29.21080Ring: 1 mile radius Longitude: -99.78243
AreaStateUSA
Trends 2018-2023Trends 2018-2023
Ann
ual R
ate
(in
perc
ent)
2.42.2
21.81.61.41.2
10.80.60.40.2
0Population Households Families Owner HHs Median HH Income
20182023
Population by AgePopulation by Age
Perc
ent
1211109876543210
0-4 5-9 10-14 15-19 20-24 25-34 35-44 45-54 55-64 65-74 75-84 85+
2018 Household Income 2018 Household Income
<$15K15.9%
$15K - $24K15.5%
$25K - $34K13.5%
$35K - $49K15.8%
$50K - $74K15.0%
$75K - $99K9.5%
$100K - $149K10.4%
$150K - $199K2.7%
$200K+1.8%
2018 Population by Race2018 Population by Race
Perc
ent
70
60
50
40
30
20
10
0White Black Am. Ind. Asian Pacific Other Two+
2018 Percent Hispanic Origin: 79.1%
Source: U.S. Census Bureau, Census 2010 Summary File 1. Esri forecasts for 2018 and 2023.
October 19, 2018
©2018 Esri Page 2 of 6

Walgreens Pharmacy #13447 Uvalde, Texas
DeerfieldPartnersJohn GiordaniArt GriffithCall: (888) 258-7605Email: [email protected]
Demographics-1MileRadius
Demographic and Income Profile250 E Main St, Uvalde, Texas, 78801 3 Prepared by Esri250 E Main St, Uvalde, Texas, 78801 Latitude: 29.21080Ring: 1 mile radius Longitude: -99.78243
Summary Census 2010 2018 2023Population 7,602 7,818 8,035Households 2,491 2,559 2,625Families 1,858 1,899 1,943Average Household Size 2.98 3.00 3.00Owner Occupied Housing Units 1,663 1,596 1,652Renter Occupied Housing Units 828 963 973Median Age 33.9 35.0 35.8
Trends: 2018 - 2023 Annual Rate Area State NationalPopulation 0.55% 1.65% 0.83%Households 0.51% 1.62% 0.79%Families 0.46% 1.58% 0.71%Owner HHs 0.69% 2.09% 1.16%Median Household Income 1.78% 2.23% 2.50%
2018 2023 Households by Income Number Percent Number Percent
<$15,000 408 15.9% 372 14.2%$15,000 - $24,999 396 15.5% 369 14.1%$25,000 - $34,999 346 13.5% 337 12.8%$35,000 - $49,999 405 15.8% 411 15.7%$50,000 - $74,999 383 15.0% 421 16.0%$75,000 - $99,999 242 9.5% 282 10.7%$100,000 - $149,999 265 10.4% 318 12.1%$150,000 - $199,999 69 2.7% 71 2.7%$200,000+ 45 1.8% 44 1.7%
Median Household Income $38,738 $42,318Average Household Income $55,037 $60,257Per Capita Income $18,637 $20,346
Census 2010 2018 2023 Population by Age Number Percent Number Percent Number Percent
0 - 4 648 8.5% 639 8.2% 654 8.1%5 - 9 633 8.3% 619 7.9% 631 7.9%10 - 14 651 8.6% 594 7.6% 606 7.5%15 - 19 605 8.0% 566 7.2% 561 7.0%20 - 24 492 6.5% 536 6.9% 520 6.5%25 - 34 871 11.5% 955 12.2% 974 12.1%35 - 44 902 11.9% 876 11.2% 917 11.4%45 - 54 902 11.9% 848 10.8% 843 10.5%55 - 64 792 10.4% 850 10.9% 853 10.6%65 - 74 518 6.8% 729 9.3% 792 9.9%75 - 84 376 4.9% 390 5.0% 470 5.9%
85+ 213 2.8% 216 2.8% 213 2.7%Census 2010 2018 2023
Race and Ethnicity Number Percent Number Percent Number PercentWhite Alone 5,901 77.6% 5,937 75.9% 6,044 75.2%Black Alone 55 0.7% 83 1.1% 111 1.4%American Indian Alone 42 0.6% 49 0.6% 53 0.7%Asian Alone 44 0.6% 75 1.0% 101 1.3%Pacific Islander Alone 0 0.0% 0 0.0% 0 0.0%Some Other Race Alone 1,385 18.2% 1,476 18.9% 1,516 18.9%Two or More Races 176 2.3% 198 2.5% 211 2.6%
Hispanic Origin (Any Race) 5,863 77.1% 6,186 79.1% 6,441 80.2%Data Note: Income is expressed in current dollars.
Source: U.S. Census Bureau, Census 2010 Summary File 1. Esri forecasts for 2018 and 2023.
October 19, 2018
©2018 Esri Page 1 of 6

Walgreens Pharmacy #13447 Uvalde, Texas
DeerfieldPartnersJohn GiordaniArt GriffithCall: (888) 258-7605Email: [email protected]
Demographics-3MileRadius
Demographic and Income Profile250 E Main St, Uvalde, Texas, 78801 3 Prepared by Esri250 E Main St, Uvalde, Texas, 78801 Latitude: 29.21080Ring: 3 mile radius Longitude: -99.78243
AreaStateUSA
Trends 2018-2023Trends 2018-2023
Ann
ual R
ate
(in
perc
ent)
2.42.2
21.81.61.41.2
10.80.60.40.2
0Population Households Families Owner HHs Median HH Income
20182023
Population by AgePopulation by Age
Perc
ent
12
10
8
6
4
2
00-4 5-9 10-14 15-19 20-24 25-34 35-44 45-54 55-64 65-74 75-84 85+
2018 Household Income 2018 Household Income
<$15K17.5%
$15K - $24K14.4%
$25K - $34K12.3%
$35K - $49K14.9%
$50K - $74K15.9% $75K - $99K
10.5%
$100K - $149K9.6%
$150K - $199K2.7%
$200K+2.2%
2018 Population by Race2018 Population by Race
Perc
ent
70
60
50
40
30
20
10
0White Black Am. Ind. Asian Pacific Other Two+
2018 Percent Hispanic Origin: 77.8%
Source: U.S. Census Bureau, Census 2010 Summary File 1. Esri forecasts for 2018 and 2023.
October 19, 2018
©2018 Esri Page 4 of 6

Walgreens Pharmacy #13447 Uvalde, Texas
DeerfieldPartnersJohn GiordaniArt GriffithCall: (888) 258-7605Email: [email protected]
Demographics-3MileRadius
Demographic and Income Profile250 E Main St, Uvalde, Texas, 78801 3 Prepared by Esri250 E Main St, Uvalde, Texas, 78801 Latitude: 29.21080Ring: 3 mile radius Longitude: -99.78243
Summary Census 2010 2018 2023Population 17,616 18,809 19,507Households 5,846 6,271 6,508Families 4,336 4,618 4,780Average Household Size 2.94 2.94 2.94Owner Occupied Housing Units 3,830 3,821 4,042Renter Occupied Housing Units 2,016 2,450 2,466Median Age 33.3 34.4 35.5
Trends: 2018 - 2023 Annual Rate Area State NationalPopulation 0.73% 1.65% 0.83%Households 0.74% 1.62% 0.79%Families 0.69% 1.58% 0.71%Owner HHs 1.13% 2.09% 1.16%Median Household Income 1.88% 2.23% 2.50%
2018 2023 Households by Income Number Percent Number Percent
<$15,000 1,097 17.5% 1,011 15.5%$15,000 - $24,999 905 14.4% 859 13.2%$25,000 - $34,999 770 12.3% 766 11.8%$35,000 - $49,999 935 14.9% 955 14.7%$50,000 - $74,999 997 15.9% 1,107 17.0%$75,000 - $99,999 656 10.5% 773 11.9%$100,000 - $149,999 602 9.6% 721 11.1%$150,000 - $199,999 171 2.7% 179 2.8%$200,000+ 137 2.2% 137 2.1%
Median Household Income $39,686 $43,569Average Household Income $56,391 $61,465Per Capita Income $19,344 $21,044
Census 2010 2018 2023 Population by Age Number Percent Number Percent Number Percent
0 - 4 1,491 8.5% 1,505 8.0% 1,535 7.9%5 - 9 1,460 8.3% 1,470 7.8% 1,485 7.6%10 - 14 1,471 8.4% 1,392 7.4% 1,423 7.3%15 - 19 1,487 8.4% 1,389 7.4% 1,395 7.2%20 - 24 1,202 6.8% 1,379 7.3% 1,321 6.8%25 - 34 2,050 11.6% 2,398 12.7% 2,481 12.7%35 - 44 2,063 11.7% 2,048 10.9% 2,182 11.2%45 - 54 2,163 12.3% 2,067 11.0% 2,035 10.4%55 - 64 1,829 10.4% 2,120 11.3% 2,155 11.0%65 - 74 1,175 6.7% 1,693 9.0% 1,918 9.8%75 - 84 822 4.7% 895 4.8% 1,107 5.7%
85+ 401 2.3% 453 2.4% 470 2.4%Census 2010 2018 2023
Race and Ethnicity Number Percent Number Percent Number PercentWhite Alone 13,727 77.9% 14,312 76.1% 14,678 75.2%Black Alone 137 0.8% 214 1.1% 285 1.5%American Indian Alone 93 0.5% 115 0.6% 127 0.7%Asian Alone 105 0.6% 190 1.0% 258 1.3%Pacific Islander Alone 5 0.0% 4 0.0% 4 0.0%Some Other Race Alone 3,076 17.5% 3,428 18.2% 3,568 18.3%Two or More Races 472 2.7% 547 2.9% 588 3.0%
Hispanic Origin (Any Race) 13,425 76.2% 14,641 77.8% 15,383 78.9%Data Note: Income is expressed in current dollars.
Source: U.S. Census Bureau, Census 2010 Summary File 1. Esri forecasts for 2018 and 2023.
October 19, 2018
©2018 Esri Page 3 of 6

Walgreens Pharmacy #13447 Uvalde, Texas
DeerfieldPartnersJohn GiordaniArt GriffithCall: (888) 258-7605Email: [email protected]
Demographics-5MileRadius
Demographic and Income Profile250 E Main St, Uvalde, Texas, 78801 3 Prepared by Esri250 E Main St, Uvalde, Texas, 78801 Latitude: 29.21080Ring: 5 mile radius Longitude: -99.78243
AreaStateUSA
Trends 2018-2023Trends 2018-2023
Ann
ual R
ate
(in
perc
ent)
2.42.2
21.81.61.41.2
10.80.60.40.2
0Population Households Families Owner HHs Median HH Income
20182023
Population by AgePopulation by Age
Perc
ent
12
10
8
6
4
2
00-4 5-9 10-14 15-19 20-24 25-34 35-44 45-54 55-64 65-74 75-84 85+
2018 Household Income 2018 Household Income
<$15K17.1%
$15K - $24K13.8%
$25K - $34K12.2%
$35K - $49K15.1%
$50K - $74K15.9% $75K - $99K
10.3%
$100K - $149K10.1%
$150K - $199K2.9%
$200K+2.5%
2018 Population by Race2018 Population by Race
Perc
ent
70
60
50
40
30
20
10
0White Black Am. Ind. Asian Pacific Other Two+
2018 Percent Hispanic Origin: 78.0%
Source: U.S. Census Bureau, Census 2010 Summary File 1. Esri forecasts for 2018 and 2023.
October 19, 2018
©2018 Esri Page 6 of 6

Walgreens Pharmacy #13447 Uvalde, Texas
DeerfieldPartnersJohn GiordaniArt GriffithCall: (888) 258-7605Email: [email protected]
Demographics-5MileRadius
Demographic and Income Profile250 E Main St, Uvalde, Texas, 78801 3 Prepared by Esri250 E Main St, Uvalde, Texas, 78801 Latitude: 29.21080Ring: 5 mile radius Longitude: -99.78243
Summary Census 2010 2018 2023Population 19,784 21,150 21,936Households 6,531 7,015 7,282Families 4,892 5,220 5,405Average Household Size 2.96 2.95 2.95Owner Occupied Housing Units 4,352 4,366 4,621Renter Occupied Housing Units 2,179 2,649 2,661Median Age 32.9 34.0 35.0
Trends: 2018 - 2023 Annual Rate Area State NationalPopulation 0.73% 1.65% 0.83%Households 0.75% 1.62% 0.79%Families 0.70% 1.58% 0.71%Owner HHs 1.14% 2.09% 1.16%Median Household Income 1.86% 2.23% 2.50%
2018 2023 Households by Income Number Percent Number Percent
<$15,000 1,201 17.1% 1,104 15.2%$15,000 - $24,999 969 13.8% 923 12.7%$25,000 - $34,999 859 12.2% 856 11.8%$35,000 - $49,999 1,061 15.1% 1,081 14.8%$50,000 - $74,999 1,114 15.9% 1,231 16.9%$75,000 - $99,999 726 10.3% 855 11.7%$100,000 - $149,999 710 10.1% 849 11.7%$150,000 - $199,999 203 2.9% 212 2.9%$200,000+ 172 2.5% 172 2.4%
Median Household Income $40,558 $44,465Average Household Income $58,039 $63,129Per Capita Income $19,590 $21,287
Census 2010 2018 2023 Population by Age Number Percent Number Percent Number Percent
0 - 4 1,664 8.4% 1,686 8.0% 1,731 7.9%5 - 9 1,664 8.4% 1,660 7.8% 1,675 7.6%10 - 14 1,682 8.5% 1,608 7.6% 1,620 7.4%15 - 19 1,720 8.7% 1,623 7.7% 1,637 7.5%20 - 24 1,351 6.8% 1,564 7.4% 1,531 7.0%25 - 34 2,298 11.6% 2,682 12.7% 2,781 12.7%35 - 44 2,331 11.8% 2,310 10.9% 2,464 11.2%45 - 54 2,414 12.2% 2,311 10.9% 2,286 10.4%55 - 64 2,048 10.4% 2,367 11.2% 2,379 10.8%65 - 74 1,285 6.5% 1,870 8.8% 2,124 9.7%75 - 84 905 4.6% 983 4.6% 1,205 5.5%
85+ 423 2.1% 484 2.3% 504 2.3%Census 2010 2018 2023
Race and Ethnicity Number Percent Number Percent Number PercentWhite Alone 15,133 76.5% 15,788 74.6% 16,192 73.8%Black Alone 150 0.8% 234 1.1% 313 1.4%American Indian Alone 113 0.6% 139 0.7% 153 0.7%Asian Alone 117 0.6% 212 1.0% 289 1.3%Pacific Islander Alone 5 0.0% 5 0.0% 5 0.0%Some Other Race Alone 3,666 18.5% 4,078 19.3% 4,239 19.3%Two or More Races 601 3.0% 694 3.3% 745 3.4%
Hispanic Origin (Any Race) 15,113 76.4% 16,497 78.0% 17,329 79.0%Data Note: Income is expressed in current dollars.
Source: U.S. Census Bureau, Census 2010 Summary File 1. Esri forecasts for 2018 and 2023.
October 19, 2018
©2018 Esri Page 5 of 6