Embed Size (px)
Citation preview

One hundred percent renewable energy generation in 2030 with the
lowest cost commercially available power plants
Manfred G. Kratzenberg1, Hans Helmut Zürn2, Ricardo Rüther1
1 Fotovoltaica UFSC – Solar Energy Research Laboratory, Federal University of Santa Catarina,
Florianópolis 88056-000, SC Brazil
2 Power System laboratory UFSC, Federal University of Santa Catarina, Campus Universitário
Campus Universitário João David Ferreira Lima – Trindade 88040-900, Florianópolis, SC, Brasil.
We hypothesize that the present expansion of energy generation by variable
renewable energy (VRE) power plants, such as wind and photovoltaic power plants,
leads to a 100% renewable energy supply in 2030 because of its inherent
exponential growth function. This behavior is related to the exponential cost
reduction of its generated energy and the nearly unconstrained available potential of
its natural resources. The cost reduction results from the continuous improvements
in development, research, manufacturing, and installation, also showing a growth of
its installation power per power plant or aero generator. We prove that if the historic
exponential growth is followed in the future, it is possible to decarbonize the world's
electric energy systems' power supply in 2026. Furthermore, the global demand on
primary energy can be supplied in 2030, which leads to the total suppression of CO2
emissions related to the energy need of humanity. Because of the related cost
reduction, energy costs are not anymore relevant. Our extrapolation is based on the
continuation of the historic growth functions of the globally installed PV and the wind
power plants, and we also discuss the conditions necessary to enable a transition to
such a 100% renewable energy production. Considering a non-constrained growth
of VRE power plants' installation power, decarbonization related to energy
generation and use can be accomplished in a much shorter time frame as previously
scheduled. As a result, climate change mitigation, energy cost reduction, and high
employment are attained much earlier than previously planned.
1. Introduction
As a result of technological developments in semiconductor manufacturing, related
technologies underlay exponential growth principles more than ever. Such a
manufacturing results in the exponential increase of the computation capacity based
on Moore's law. The related technologies are, e.g., the exponential proliferation of
smartphones; the exponential growth of internet users and the exponential growth
of the scanning ability of the human genome, in-between others, and they are all
based on on the principle the exponential growth of the computational performance

(Diamandis and Kotler, 2012). We think that this behavior of exponential growth is
also true for the non-constricted growth of photovoltaic and wind power plants' global
installation power, and therefore, its energy generation. As a result, net-zero CO2
emissions can be attained much earlier than expected and scheduled.
Consequently, uncertainties concerning climate change mitigation are reduced,
employment is created, and energy is produced at extra low cost as these renewable
power plants do have no fuel consumption. Such objectives are essential to hold
disaster losses related to climate change at low levels, as discussed in Appendix 1.
Furthermore, the expected employment losses because of the impending
developments in automatization and artificial intelligence (AI) are compensated. Our
proposal results in a rapid transition of the world's electric energy systems based on
the growth of the three most important commercially available renewable energy
power plants, saying photovoltaic, wind, and hydropower plants. We show that it is
possible to generate the world's total demand for electric energy in 2025, solely by
these three renewable sources, considering its non-constrained future growth. We
also show that the world's primary energy consumption can be generated in 2030,
at exceptionally low costs, far below US$10/MWh, by the expansion of such power
plants.
Global warming and climate change mitigation are the present most challenging task
of humanity. The known relationship to the industrial CO2 emissions, and the
unknown outcomes of future climate change, results in potentially existential
damage for society (Abdallah et al., 2013). As known, the natural radiative forcing of
the Earth's atmosphere provides the Earth's necessary heat energy, which increases
its surface temperature for being a habitable planet. However, presently, the Earth's
climate system is changing rapidly as a function of extra energy input. The additional
energy is a function of radiative forcing, which results in global warming and is a
function of the increased CO2 level in the atmosphere. First in-depth research related
to this radiative forcing was accomplished by (Hansen et al., 1997), with global
simulations of the Earth's thermodynamic system.
The generation of only one MWh of energy emits up to 1000 kg of transparent CO2
into the atmosphere. Even with the current exponential expansion of renewable
energy systems, global CO2 emissions are still growing exponentially (Lindsey,
2018). This growth leads to a nearly exponential increase of the CO2 in the
atmosphere (NOAA, 2021), resulting in additional radiative forcing, heat
accumulation, further temperature increases, which trigger even more significant
related climate changes. The resulting radiative forcing increase is currently the most
challenging existential threat (Shakoor et al., 2020). Models of related economic
losses show in (Stern, 2008) exponential losses of the global domestic product
(GDP), which appear as a function of the Earth's surface average temperature
increase (Appendix 2). Frist tendencies to the rise of such losses are already
verifiable (Smith et al., 2019). Such losses are principally related to climate disasters,
and therefore, the emission of CO2 should be reduced as swiftly as possible.

Climate change is one of the most discussed items in the last decades in global
scientific and political communities. However, it is still not adequately addressed, as
the net-zero CO2 emissions are scheduled only for 2040 or 2055 (Masson-Delmotte
et al., 2018). However, it is essential to actualize schedules based on VRE plants'
technical and economic state-of-the-art feasibility to mitigate climate change earlier.
This feasibility changes rapidly because of the swift development of the related
technologies. E.g., the cost of wind and photovoltaic power plants decreased much
stronger in the last decades than previously expected (*). Therefore, energy policies
should also be actualized for swifter mitigation of climate change, based on the state-
of-the-art feasibly for this mitigation.
The concept of providing all energy with hydropower, wind, photovoltaic, solar
thermal, and geothermal power plants was first proposed by (Jacobson and
Delucchi, 2011) and (Delucchi and Jacobson, 2011), citing further references. The
authors' proposal is based on energy storage simulations in a 30 s interval, and they
discuss apart from the CO2 benefit also the health benefit because of the reduced
city pollution. Their work was followed by the results of (Jacobson, 2017; Jacobson
et al., 2015), in which simulations were expanded to several countries, and (Kroposki
et al., 2017), which discuss the details as related to the electrical power grid for a
100 % supply of the power grid with renewable and VRE power plants. In their
simulations (Jacobson, 2017; Jacobson et al., 2015) use: (i) seasonal heat storage
units which provide district heat at costs less than 1 US dollar per kWh; (ii) insulated
ice storage units for air condition systems of buildings; (iii) thermally insulated
reservoirs of cold and warm water, for air conditioning systems of building complexes
such as, e.g., universities; (vi) heat pumps for heating and cooling of rooms, and the
production of warm water in residents; (v) demand response to control the heating
and cooling of these systems, as well as further non-priority consumer equipment;
(vi) hydrogen storage units; (viii) concentrated thermal solar power plants with low-
cost rock heat storages, which enable the generation of electrical energy for nearly
24 hours per day; (ix) the storage capacities of pumped hydropower plants; and
finally (x) the storage of conventional hydropower plants, where the lower, and the
upper limits of its storage lake, as well as, its minimal dispatch to maintain the related
river bed, have to be respected. A 100 % renewable power grid should rely, for the
most part, on these types of lower-cost storage units, the increase of the consumer's
energy price. Each storage type has a range of costs per stored kWh, rather than a
fixed cost ((Koohi-Fayegh and Rosen, 2020) – Table 4), depending on the
application. Because the lower value of this range is much smaller compared to the
cost of lithium ion batteries, we think a large scale use of Litium-ion batteries to
provide the necessary storage for a 100% renewable power grid is unrealistic
because of the much higher costs this solution presents. This holds true even
considering a future exponential cost decrease of lithium ion batteries, which leads
to an extrapolated cost of $ 10/kWh in 2030 (Appendix Figure 6). Furthermore, the

large use of Lithium-ion batteries for power grid applications would increase EV costs
because of its limited availability.
2. Materials and Methods
As principally based on the growth of wind and photovoltaic power plants, in this
work, we estimate the time needed for a transition to energy production without the
emissions of CO2. We consider (i) power grids supplied by 100% of renewable power
plants and (ii) the generation of the world's total energy principally based on VRE
power plants considering that its non-constrained present growth patterns can be
maintained in the future. Our unconstraint extrapolations are based on the historic
exponential growth of the VRE power plants' installation power. We use extrapolated
growth figures of the current photovoltaic and wind power installations. We argue
that if restraining conditions, such as, e.g., the necessary power lines and the
increased generation variability, are accounted for by adequate planning, the future
exponential growth of the generated energy by these plants can be maintained. In a
visualization with a logarithmic scale, such exponential growth functions lead to a
straight line, which we used to extrapolate future installation potential in this graphic.
We predict the future generation by these VRE plants by multiplicating the installed
power with the average generation capacity factor for each of these technologies.
We also propose low-cost proposals for the necessary energy storage to mitigate
VRE plants' variability in the power grid based on further references. As a result, this
proposal's exponential expansions do not considerably increase the power grid's
infrastructure cost. The expansion scenario results in substantial cost reductions for
the generated electric energy and the generated primary energy. These low costs
permit a present and future exponential expansion of photovoltaic and wind power
plants without subsidies.
We believe in the exponential growth rate of VRE power plants, rather than a linear
expansion, principally because of the already low cost and de decreasing cost
gradients, as inherent to the VRE energy generation. In the next sections, we discuss
the factors limiting the exponential growth of VRE power plants and suggest
measures to address these limiting factors. We think that these limiting factors do
not reduce exponential growth if addressed adequately and corrected.
3. Limiting factors that can avoid or reduce exponential growth
As the most assumed limiting factor for high VRE fractions in a power grid are
thought the necessary storage systems to operate the electrical power grid, without
interruption, because of the variability of its generated power flow. However, low-
cost solutions based on state-of-the-art technologies enable VRE support in the
power grid showing emulated storage costs as low as only US$ 1/kWh, as discussed

in (Kratzenberg, 2021) section 2.6. Furthermore, high fractions of VRE power plants
in the power grid might lead to grid instabilities or generate high costs related to
super-peak power plants to compensate for this variability (Hirth et al., 2015).
However, as discussed in (Kratzenberg, 2021), several methods keep these
instabilities under control. The emulations for a high necessary high short circuit and
energy storage capability are most important. The short-circuit capacity can be
emulated by exploiting obsolete synchronous generators or the so-called virtual
synchronous machines connected to a small battery. The emulation of the
synchronous generator's inertia to provide the high necessary short-circuit current
as essential for triggering the power grid's protective overcurrent devices enables
power grids with high VRE fractions (section 2.7 in (Kratzenberg, 2021)). The
availability of resources to expand wind power and photovoltaic power generation is
the least problematic because of the many installation locations available, as
discussed in (section 2.3 in (Kratzenberg, 2021)). The electric power transmission
lines, necessary to be installed to access resource-rich regions for the generation
based on wind and solar power plants, are also not limiting if planned adequately
with anticipation (section 2.4 in (Kratzenberg, 2021)). The providence of a sufficient
workforce for installing and maintaining the VRE plants is also not a growth-limiting
factor if educational measures are taken in advance based on the exponential growth
(section 2.5 in (Kratzenberg, 2021)). Manufacturing cost is also not a problem as
manufacturing does not need to be based on rare-earth elements (section 2.1 in
(Kratzenberg, 2021)). Life expectancy is not a problem because of the equipment's
typical long lifetime of up to 25 years at the state-of-the-art. Financial constraints to
sustain exponential growth are also not a limiting factor because of the secure long-
term investments and the already low and falling costs of VRE systems (section 2.8
in (Kratzenberg, 2021)). Political issues are also not a limiting factor for exponential
growth because any rational country likes to provide low-cost energy and plenty of
workplaces for its citizens (sections 2.9 and 2.10 in (Kratzenberg, 2021)). In a similar
form, we think that any reasonable and rational company that is engaged in the
energy sector likes to be in business with the VRE technologies because of its
substantial price decline, which leads to advantages in the bidding process and the
business of power plants (section 2.10 in (Kratzenberg, 2021)).
4. Results
In the next sections, we first evaluate the possible energy generation potential of
wind and photovoltaic power plants. Then we address the expansion of the
cumulative installed power of the essential VRE power plants, which are wind and
photovoltaic power plants. Then we compare its present and future energy
generation ability based on average capacity factors of the global installation of these
power plants. We extrapolate wind and photovoltaic generation individually based
on its present exponential growth and combine the extrapolated generation with the

extrapolated hydropower generation to access possible future energy generation
scenarios obtained based on the extrapolation of its historical expansion curve.
4.1 Photovoltaic power plants and systems
The renewable energy generated by photovoltaic power plants is expandable with
virtually no limits, which would allow supplying the total energy demand of the human
activity's related energy needs in 2030 and many years beyond. E.g., if considered
an energy generation solely by utility-scale grid-connected photovoltaic power
plants. Based on the exponential growth of these plant's installation power, a total
electrical energy that confers to the electrical energy demand in 2032 (Figure 5)
could theoretically be generated with installations on a desert surface of 357,667
km2 (Annex 2). Furthermore, the primary energy needed in 2032 could be generated
by PV plants on a surface of 2.015 million km2 in occupying less than 6.83% of the
world's deserts. Considering, however, the reduction of the primary energy by 42.5%
as based on higher energy efficiency (Jacobson et al., 2017), then the occupied
desert area would be much lower with 3.93%. Another interesting effect of
photovoltaic plants is that its energy generation cost shows a much larger cost
reduction gradient in the logarithmic scale as in comparison to wind power plants
(Fig. 7b), resulting in a present cost which is similar in comparison to wind power
plants (Webb et al., 2020). The much higher decreasing gradient as in comparison
to wind power plants (Fig. 8) indicates a much higher expansion rate of this
technology. Furthermore, PV plants do not need specific installation locations, as
needed in the case of wind power plants, and can virtually added to the power grid
in virtually any location. In Figure 1a and 1b we present the historical cumulatively
installed power of worldwide installed PV power plants, as based on the same data.
While Figure 1a looks as an exponential growing function, Figure 1b shows by the
straight line in the logarithmic function space that the installed PV power grows in a
truly exponential function over the time axis.
In order to provide a swift decarbonization it is interesting to validate if the historic
expansion figures of photovoltaic plants could theoretically supply the world's
electricity and primary energy demand, if growing at a similar rate in the future as in
the past. The so known Swanson's law predicts that each doubling of the
manufactured photovoltaic module capacity leads to a price decline of 20 %
(Reichelstein and Sahoo, 2015). As the capacity-price representation in the
Swanson's law follow a bi-dimensional exponential function, its presentation in a
graph with bi-dimensional logarithmic normalization results also in a straight line,
which seems to be a linear function.
However, an exponential PV expansion pattern can also be shown solely as a
function of the installation power, where solely the installed power is presented in
the logarithmic scale while the time axis is shown in a normal scale (Figure 1a and
1b). If a PV expansion happens at an exponential scale this also results in a straight

line (Fig. 1b), which can be easily extrapolated to evaluate the cumulatively installed
power of future PV plants.
Figure 1: Historic expansion of the installed power of photovoltaic plants in units of Terawatt peak
[TWpeak] as a function of time, as presented in the normal (a), and the logarithmic scale (b). The low
deviations to the strait line in the logarithmic presentation proves that an exponential growth is actually
happen for the PV power expansion. Data obtained from (Wikipedia, 2021b), citing (Dudley, 2015),
(Hashemi and Østergaard, 2016), and (BP, 2020).
To evaluate such an exponential expansion it is, however, necessary to validate if
there are any restrictions present that can bend it to lower growth ratios. E.g. for
photovoltaic systems such a restriction was present in the past because of the limited
available silicon wafers that deaccelerated the PV growth feebly up to 2008 (Fig. 1b).
However, this is not anymore the case at the sate-of-the-art as dedicated
manufacturing units were implemented to manufacture PV-cell grade specific silicon
wafers. Further possible limitations for exponential growth we already discussed in
sections 2.1 to 2.10 in (Kratzenberg, 2021) and the discussion shows that in principle
no technical, economical, or political restriction can in principle limit an exponential
growth of photovoltaic plants, if adequately addressed to.
4.2 Wind power plants
In the evaluation of available onshore or offshore potential for the wind power
generation, the potential of energy generation ability of each of these potentials is
much higher than the expected primary energy consumption in 2030, (Appendix 1).
Only onshore wind power plants alone can supply the primary energy demand 3.7
times over in 2030, while the demand on electric energy can be supplied 19.9 times
over, which is very promising. Besides the onshore generation, there is a large
potential for offshore generation available, which can supply the annual production
0.0001
0.001
0.01
0.1
1
1990 1995 2000 2005 2010 2015 2020
Cu
mu
lati
ve in
stal
led
PV
Po
wer
[T
Wpe
ak]
year
0
0.1
0.2
0.3
0.4
0.5
0.6
0.7
1990 1995 2000 2005 2010 2015 2020
WT[re
woP
VP
dellatsni
evitalu
mu
Cpeak]
year
a b

of 41,200 and 92,500 TWh/year for 20 and 50 m water depths (Arent et al., 2012).
The second value can supply the demand on electric energy 2.64 times over in 2030.
Using also floating offshore wind power plants, a new modality (Kausche et al.,
2018), the offshore potential increases to 192,0000 and 301,085 TWh/year
(Appendix 1), while the latter potential is suitable to provide the worlds primary
energy 1.6 times over in 2030. In Figures 2 and 3 we show the historic expansion
pattern of onshore and offshore wind power plants in normal and exponential scale
as a function of time.
Figure 2: Globally installed wind turbine nominal power in the normal (a) and the logarithmic scale
(b), showing an exponential growth up to 2009 (b), which is then followed by a nearly linear growth
as to see from (a). As shown by the comparison of the red line in (b), which indicates the exponential
growth pattern, in most of the growth history, from 1996 to 2009, an exponential growth was
maintained, but starting from 2010 this was not anymore possible to be maintained as probably a
result of non-adequate support for exponential growth. Data (black points) obtained from (Wikipedia,
2021e), citing several reports of the Global Wind Energy Council (GWEC).
Wind power plants and photovoltaic power plants present each a cumulative
installed power something below 1 TW (Figs. 1 and 2). While the globally installed
wind power plants present presently a something higher power as in comparison to
the PV power plants, the total of wind power plants installed offshore power is still in
its initial growth pattern, showing a much lower installed power. Rather than the total
wind power it shows a typical exponential growth function (Fig. 3). By its exponential
extrapolation, offshore wind power plants only attain 1 TW of cumulative installed
power in 2032. Therefore, they probably do not contribute significantly in a 100%
renewably power grid scenario. The low growth function of general Wind power
plants installation since 2009 (Figure 2) might be a temporarily slower growth as also
happened in the history of photovoltaic plants. If not corrected is can present a
limiting factor for exponential growth of VRE plants, principally in this initial stage.
0.001
0.01
0.1
1
1995 2000 2005 2010 2015 2020
Cu
mu
lati
ve in
stal
led
Win
d P
ow
er
[TW
]
year
0
0.1
0.2
0.3
0.4
0.5
0.6
0.7
1995 2000 2005 2010 2015 2020
Cu
mu
lati
ve in
stal
led
Win
d P
ow
er [
TW
]
year
a b

Therefore, the origin of this limited expansion should be identified and corrected as
swiftly as possible to return for an exponential growth pattern. One restriction could
be the failing skilled labor force (Jagger et al., 2013), but one or more further growth-
limiting factors (sections 2.1 to 2.10 in (Kratzenberg, 2021)), e.g., the non-availability
of transmission lines, overzealous expansion planning of the power grid, or
investment restrains, principally in development countries, could also play an
important role. This behavior calls for action for the identification and correction of
theses limiting factors.
Figure 3: Globally installed offshore wind turbine nominal power in the normal (a) and the logarithmic
scale (b), showing an exponential growth pattern. Data (black points) obtained from (Statista, 2021).
4.3 Future expansions with VRE power plants
Here we evaluate, if the exponential growth of the commercial available VRE power
plants, can much earlier as presently scheduled (i) decarbonize the world's energy
generation by the complete substitution of generators and further use of fossil fuel.
First we investigate if the exponential growth of photovoltaic or wind power plants
alone can supply the world's demand on electrical and primary energy considering
its growth based on its historic exponential growth patterns. In Fig. 4a we compare
the historic expansion of the installed power of wind, and photovoltaic power plants.
Then by use of the plant's global average capacity factors, we calculated the
generation capability of each power plant type and compare these capabilities in Fig.
4b. In Fig. 5 we plot these annual generation capacities in a logarithmic scale, and
by exponential extrapolation functions we also show the VRE plant's future annual
generation capability in this figure. As hydropower plants grow at a slower pace
because of its reduced potential, we used a polynomial expansion for these power
plants. The three upper horizontal lines in Fig. 5 indicate the future predicted energy
consumption.
a b

Figure 4: Historic values of the wind (blue), and photovoltaic (yellow) power plants' installed
cumulative generation capabilities. The generated energies were calculated with the samples of (a)
and the use of average capacity factors of 25.6%, and 35.4%, for the PV, Wind power plants (EIA,
2020).
0
1
10
100
1,000
10,000
100,000
1990 1995 2000 2005 2010 2015 2020 2025 2030 2035
Ge
ne
rati
on
Ca
pa
bili
ty [
TW
h/y
ear]
year
Primary Energy Demand 2032
Reduced Primary Energy D. 2030
Electric Energy Demand 2025
Hydropower E.
Extrapolated Hydrop. E.
Wind Power Energy
Extrapol. Wind Power E.
Photovoltaic Energy
Extrapol. PV Energy
Figure 5: Energy generation capability of the historically installed wind and solar and hydropower
power plants, in units of TWh/year, as estimated by using measured average capacity factors, of
these technologies. The lower horizontal line indicates the word's estimated consumption of electric
energy in 2026 (33,000 TWh/year) and its primary energy consumption in 2032 (198,000 TWh/year).
Same generation data as in Fig. 3. Predicted demand on electric and primary energy as presented in
(Schalk, 2019). Annual generation of electric energy, estimated by use of the average capacity factors
of these technologies and the installed power of these power plants. Same data as in Figs. 1 and 2.
Hydropower plant data were obtained from (IHA, 2020), considering a capacity factor of and 43%.
a b
0
500
1,000
1,500
2,000
2,500
1990 1995 2000 2005 2010 2015 2020
Ge
ne
rati
on
Ca
pa
bili
ty [
TW
h/y
ea
r]
year
Wind Power Energy
Photovoltaic Energy
0.00
0.10
0.20
0.30
0.40
0.50
0.60
0.70
0.80
1990 1995 2000 2005 2010 2015 2020
Cu
mu
lati
ve in
sta
lled
po
we
r [T
W]
year
Wind Power
Photovoltaic Power

The lower threshold shows the expected world's consumption of electric energy in
2025, and the upper threshold shows the expected total energy consumption, also
called primary energy consumption, for the year 2032. The line in-between these two
horizontal lines shows a 42.5% reduced primary energy consumption, because of
the higher energy efficiency related principally to the fully renewable generation as
shown in (Jacobson et al., 2017). When considering a more realistic combined
expansion of these most important renewable power plants, electric energy can be
already supplied in 2025 solely be the expansion of these power plants (Fig. 6),
providing therefore a complete decarbonization of the word's electric energy
generation. Furthermore, the combined generation can supply the world's primary
energy in 2030 because of the higher efficiency when the primary energy
consumption is also based on electric energy.
1
10
100
1,000
10,000
100,000
1990 1995 2000 2005 2010 2015 2020 2025 2030 2035
Ge
ne
rati
on
Cap
ab
ility
[T
Wh
/ye
ar]
year
Primary Energy Demand 2032
Reduced Primary Energy D. 2030
Electric Energy Demand 2025
Wind + Solar + Hydro
Extrapolation Wind + Solar + Hydro
Wind + PV
Extrapolation Wind + PV
Figure 6: Energy generation capability of the historically installed wind and solar power plants
combined, in units of TWh/year, as estimated by using measured average capacity factors, of these
technologies. The lower horizontal line indicates the word's estimated consumption of electric energy
in 2026 (33,000 TWh/year) and its primary energy consumption in 2032 (198,000 TWh/year). Same
generation data as in Fig. 4. Predicted demand on electric and primary energy as in Fig. 5.

1
10
100
2005 2010 2015 2020 2025 2030
LCO
E U
S$
/MW
h
year
Wind costs
PV costs
Extrapolated costs PV
Extrapolated costs Wind
0
50
100
150
200
250
300
350
400
2005 2010 2015 2020 2025 2030
LCO
E U
S$
/MW
h
year
Wind costs
PV costs
Extrapolated costs PV
Extrapolated costs Wind
Figure 7. Comparison of the decrease of the Levelized cost of electrical energy (LCOE) of wind power
and photovoltaic plants, in the normal (a), and logarithmic scale (b), as a function of time. The dashed
exponential fitting lines indicate the exponential cost declines as a function of time for both generators.
PV power plants present a higher exponential cost decline than wind power plants. Average LCOE
cost samples obtained from (Ray, 2019), citing (LAZARD, 2019).
Fig. 5 also shows that the generation of photovoltaic was insignificant in the past, if
compared to wind power systems, presenting more than an order of magnitude lower
energy generation at the beginning of its expansion. However, because of the higher
growth of its energy generation, in the future the generation by photovoltaic power
plants will be most dominant showing quasi an order of magnitude higher energy
generation than by wind power plants. Such a dominance can be explained by the
higher cost decrease of the photovoltaic power plants if compared to wind power
plants, as shown in Fig. 7. The interpolation lines show that wind and solar power
plants show a decrease of its LCOE at an exponential scale. However, PV power
plants show a much higher gradient of this exponential decrease. Additionally, the
strong curve behavior principally the PV plants show a more than exponential
decrease of the energy generated by PV power plants (Fig. 5b). A similar cost
behavior can be read from Fig. 8 in a combination with the PV plant expansion. The
so called Swanson's learning curve, shows the PV module costs as a function of the
PV module shipping in a bi-logarithmic curve representation (Diamandis and Kotler,
2012). Fig. 8 is similar but instead of the PV module cost it presents the unsubsidized
Levelized cost of electric energy (LCOE), for Photovoltaic systems, which also
includes the further system costs such as inverter, mounting rack, land, installation,
and maintenance cost.
a b

1
10
100
1,000
10 100 1,000 10,000 100,000
LCO
E [
US
$/M
Wh
]
Cumulative installed generation capacity [TWh/year]
PV costs
Wind costs
Electric Energy Demand 2025
Reduced Primary Energy Demand 2030
Primary Energy Demand 2032
Figure 8: Swanson's learning curve, here expressing the Levelized of electric energy (LCOE) as a
function of the generation capacity of the cumulative installed capacity of (i) photovoltaic plants
(orange), and (ii) wind power plants (blue), in 2009 to 2019, and its extrapolation curve in the bi-
logarithmic scale. The vertical lines on the left side indicate threshold values of the total electric energy
consumption as predicted for 2026 and the word's primary energy consumption predicted for 2035.
Furthermore, on the abscissa we present generation capacity of the cumulative
installed PV systems in units of [TWh/year], instead of the cumulative shipped PV
module power. Such a presentation gives a clearer view of the end product saying
the generated energy and it also allows a comparison of development of further
technologies such as the wind power also shown in Fig. 8. The figure shows that as
a function of the installed generation capacity, PV systems present in the whole
diagram a lower cost as in comparison to wind power plants. This means the
historically higher costs of PV modules (Fig.7a), where only present because of its
lower generation capacity, if comparted to wind power plants at that time. However,
based on the crossing of the two lines in Fig. 8 we expect that wind power plants
generate energy at lower cost than PV power plants in the future. Therefore, it is
important that efforts are taken in the near future to grow the presently nearly linear
wind power expansion back to the typical exponential growth, enjoying the benefits
of a non-restricted exponential growth and its related exponential cost reduction.

5. Discussion
We like to remark that the here presented results are based on the extrapolation of
the historical installation capacities of wind and photovoltaic power plants. We draw
possible expansion scenarios for the near future as based on these historical
exponential expansion schemes for a rapid expansion in the near future that are in
the range of technical and economical possibilities. However, extrapolations bear
uncertainties and, therefore, the future installed cumulative capacities of VRE power
plants is function of the worldwide efforts taken to provide its unlimited exponential
growth.
5.1: Photovoltaic generation versus combined wind and PV generation
We showed that the non-constraint growth of wind, PV, and hydropower plants leads
to net-zero of the electric energy and primary energy generation by 2025 and 2030.
From Fig. 5 can be seen that the generation capability of PV plants initiated its growth
at a much lower capacity if compared to hydropower and wind power plants.
However, as the PV capacity grows at a much higher rate in comparison to wind and
hydropower plants (Fig. 5), it will play the most important role in the future. The
second largest VRE energy will be generated by wind power plants. Actually
comparing PV and wind plants within the same time interval from 2009 to 2019, it
can be seen that the wind power plants generation capacity has grown
approximately one order of magnitude, while the PV capacity has grown up to two
order of magnitude (Fig. 8).
In our energy estimation of the generation capacity of the different power generator
technologies, we used the cumulative installed power of a technology and multiplied
this with the global average capacity factor. However, exact capacity factors depend
on the installation location, the used system, and its appropriate maintenance.
Therefore using a global average capacity factor leads to some small uncertainties.
However, the use of the global average capacity factors is a good estimation as
based on the total of the presently installed wind, photovoltaic, or hydropower plants,
as the global average capacity factors are estimated on the base of a plant type
global energy generation. Mainly negative bias uncertainties also exist in the
predicted exponential growth character as based on the discussed limiting
conditions. E. g., if the discussed growth constraining conditions of sections 2.8 to
2.10 in (Kratzenberg, 2021) are not adequately validated and addressed to, for its
elimination in different countries, then the expansion of the renewable energy
generation can appear at a much lower growth rate as here predicted. Limiting
conditions for less than exponential growth already appeared for wind power plants
within the last 4 years (Fig. 5), and it is presently unclear if this is solely a temporarily
setback, as already appeared for PV plants between 2004 and 2009 (Fig. 5), or is a
new tendency. However, the historic growth of PV plants is still very promising,
showing even higher than exponential growth in 2008 to 2012 (Fig.5). Therefore, we

think that this technology will play the most important role in the decarbonization of
power grids and in the generation of the world's primary energy. However, because
of the typical knee curve as characteristic for exponential growth we expect in the
near future also setbacks as based on eventual constraining conditions for PV power
plants. This setback behavior demand for activities in energy policies, regulations,
and in the further development of the VRE power plants and its integration in the
power grid.
5.2 Cost and growth of PV and wind power plants
As to see from Fig. 4, the initial growth of the wind power generation capacity is
much higher in comparison to PV generation, but it slowed down since 2017 (Fig.
5), which should be a temporarily growth limitation, because of some presently acting
restraining conditions. E.g., the lower generation of PV plants can be explained as
in the 1990'er the energy generated by PV plants had a much higher cost in
comparison to wind power plants (Fig. 7), being still be present in 2009 (Fig. 8). Only
currently the LCOE of PV plants is very similar to that of wind plants (Figs. 7 and 8).
We have to note that the exponential reduction of the LCOE of wind and PV plants
is a clear function of its installed generation capacity. This is shown by the strong
point correlation to the regression lines in (Fig. 8). This means that if a non-
constrained growth of these VRE technologies can be guaranteed by international
efforts, then a very large cost decline will be the result, providing in 2030 energy by
these technologies at something above of 1 US$ / MWh, saying at nearly zero costs
(Figs. 7 and 8).
The historical higher generation cost of PV plants in comparison to wind power plants
is a result of the much lower installed generation capacity of PV power plants in
comparison to wind power plants (Figs. 5 and 8). However the generation capacity
of PV plants has grown at a much higher gradient than wind power plants, which
also lead to a much higher decline of its generation costs. We think that the higher
growth and therefore cost decline of PV plants comes available as PV plants can
virtually be installed everywhere and at any size, which is not the case for wind power
plants. Furthermore, PV plants are easier to be installed and maintained because of
its lower high and as most PV plants have no or little moving components.
Comparing the plant costs independently of time but as a function of the installed
generation capacity, the energy generated by PV power plants presented historically
always a lower cost as in comparison to wind power plants, which is a new insight
that can only be discovered by the proposed comparison of Fig. 8. The figure shows
also that the PV technology already arrived at the cost of wind power plants even
with a lower installed generation capacity. This means the PV technology is actually
the lower cost technology on a global scale and the cost of PV plants was only
higher, starting from the 1990er, because of the much lower installed generation
capacity. The today's similar energy generation cost of PV plants in comparison to

wind power plants is principally a function of the higher cost decline of PV in
comparison to wind power plants (Figs. 7 and 8). However, if wind power plants grow
exponentially then in the future very similar generation costs are expected, and wind
power plants can probably generate energy at a something lower cost (Figs. 7 and
8).
5.3 Exponential growth and lags in exponential growth
Presently wind power plants show a large time lag in its exponential growth of
approximately 3 years (Fig. 5). We think that this time lag appeared because of a
constraint growth behavior, as function of one or more of our listed restraining
conditions discussed in (Kratzenberg, 2021). E.g., the failing of sufficient energy
auctions that allow wind power projects to be installed. If these conditions are
adequately accounted to and corrected, we think that this grow function can be
corrected and its grow function be bend back to exponential growth, similarly as the
PV capacity was bend back after solving the restricting material supply. Differently,
photovoltaic systems can be installed without auctions in many residences, which
might be one of the reasons than there are no time lags presently in the growth of
the cumulatively installed PV power.
5.4 Single and combined expansions of VRE plants
Theoretically the world's demand on electrical and primary energy could be
generated solely by PV power plants in 2027 and the midst of 2036 (Fig. 5).
However, the most probable and useful scenario is a combined growth of wind,
photovoltaic and hydropower plants, as well as the growth of further renewable
power generators. Its complementary energy generation profile is especially useful
to reduce the demand on storage capacities because of the plants seasonal and
spatial generation complementary. Such an expansion figure considers, however,
that the tendency of linear growth within the last four years of the wind power
installations (Fig. 5) can be bend back to exponential growth by adequate research,
coordination and management efforts of the global, and country-wise, VRE
expansion.
5.5 Outcome of non-constrained growth of renewable power plants
A higher than exponential growth of offshore wind power plants could be a solution
to correct the present setback of the growth curve of the wind power generation. This
would need, however, government incentives for very large scale manufacturing of
the infrastructure necessary to install offshore wind power plants. Therefore, much
easier to accomplish is a non-constrained onshore generation capacity growth,
because the necessary infrastructure for the wind power installation is also used for
a series of further construction activities. However, the offshore wind turbines have
typically a larger size, which results to higher capacity factors, which facilitates the

offshore growth. We think that onshore size constraints can be overcome in
exponential growth scenario by near-power-plant manufacturing-units combined
with short distance air-transport of rotor blades.
Meanwhile, we expect that PV power plants will generate more energy than wind
power plants starting from 2024 as to see by the crossing of the straight lines of the
extrapolation curves of wind and PV plants in Fig. 5. Therefore, a lower than
exponential growth of the wind power plants would only present a minor setback.
Meanwhile, a combined exponential growth of wind and PV plants alone could
theoretically supply the electric energy demand in 2026 (Figure 6). Accounting also
the expected hydropower plants growth, these three plant types are able to supply
the word's electric energy need in 2025 as to see from this figure. Considering a
further unconstrained growth of these renewable power plants, such an expansion
leads to a fully renewable primary energy matrix in 2030. In such a scenario the
inherent nearly zero cost of electrical energy (Figs 7 and 8) is used for industrial,
commercial, and residential heating and cooling; for any type of transport and for
any further energy use globally. If further renewable power sources are also
accounted to such a feat is accomplishable in some months earlier because of their
much lower historical expansion.
The continuous growth of the rotor blade lengths of wind turbines, not only to
increase its installation power per unit, but also to explore lower wind velocities for
offshore wind power plants. However, the power per unit of onshore wind power
plants is presently stagnant because as very long blades cannot be transported,
because of traffic infrastructure limitations. As the power of the wind turbine
installations grows exponentially, very large wind turbines should ideally also be
installed onshore. Therefore, in exponential growth scenarios we think that it will be
helpful to manufacturer not only the wind turbine towers (REVE, 2020), but also rotor
blades in locations close to the areas of high wind energy potential. In such a case
we think that short distance air transport of rotor blades can become economically
available. The air transport's higher costs will be less significant because of the short
distance and the strong cost decline of the generated energy in the mass production
scenario. Furthermore, the cost of the air transport with helicopters will be
outweighed by the higher efficiency and capacity factors of wind turbines with longer
blades that allows the exploitation of lower wind speeds. Such transport issues are
no present for large and very large photovoltaic power plants, as pre-assembled
mounting racks do not imply any space limitation for its transport, because of its
smaller size and its modularity.
6. Conclusions
We have shown that the extrapolation of the present exponential growth pattern, of
wind and photovoltaic power plant's power and generation capacity can supply the
global demand on electric energy in 2025, and primary energy in 2030. As a result

we have shown a net-zero CO2 emission scheme, as being an important part of the
mitigation of climate change, in a much shorter time frame as presently considered
in 2050, e.g. in (Huang and Erb), (Kusch-Brandt, 2019). This scheme is on the main
part based on the energy generated by VRE power plants, combined with extra low-
cost storage units. Because of the already low and the exponentially falling cost per
MWh, we think that the cumulative installation of PV and wind power plants may
even grow higher that on exponential behavior if, however, the constraint's limiting
factors as discussed in (Kratzenberg, 2021) are adequately addressed to. We show
the effectiveness of wind and photovoltaic power plant installation, in visualizing that
solely the wind or the PV plant's growth alone is able to supply the world's electric
and primary energy demand. Such a configuration would demand however at least
3 years more for a 100% renewable supply mainly by PV and to a lower extent by
hydro and wind power plants (Fig. 5). However, such a case would result in higher
costs for a 100% renewable energy supply because of the higher demand on storage
capacities to store energy at night and the presence of solely the spatially
complementary generation of PV plants, while the generator complementary is not
explored in this case. Furthermore, for very large shipping of wind power plants its
cost per generated MWh is expected to decrease below that of PV plants (Fig. 8).
Therefore, the exponential growth of wind power is important and the present time
lag in its exponential growth must be evaluated more thoroughly and corrected,
based on the discussed limiting criteria.
We think that if the constraints related to this criteria are eliminated adequately, its
present linear expansion is only of temporal character and exponential growth curve
of the cumulative installed power and generation capacity. The most probable case
for the future is the exponential growth by photovoltaic and wind power plants, which
are able to provide a complete reduction of the CO2 emissions as related to the
energy generation. We estimate that if the world's primary energy can be supplied
by the presented scheme in 2030, the global CO2 emissions would be reduced by
approximately 73 %, as the present energy generation is responsible for 73.2%
(Ghosh, 2020) of the carbon dioxide emissions. Therefore, a primary energy
generation without CO2 emission can significantly accelerate the mitigation of
climate change. Combined with adequate reforestation measures for CO2 capture
(Fawzy et al., 2020), CO2 emission could eventually be reduced to preindustrial
scale. This results to (i) the mitigation of climate change and its related risks, (ii)
generate additional income, from the generated low cost energy and wood, and (iii)
provide additional workplaces.
Principally because of (i) the present exponential growth of VRE plants, (ii) the
present and especially future economic figures, and (iii) the available resources,
saying generation potential, we think that its exponential growth is very attractive
and, therefore, not stoppable in the future. Such a behavior will be of large benefits
for a sustainable economic growth and the upscaling of employment. In the recent
past such an exponential growth is especially shown for PV and offshore wind power

plants. However, non-adequate energy policies, non-tuned regulations, and non-
adapted power grids could limit such an expansion, principally for high VRE
generation fractions. Therefore, we think that it is important that the international
society envisions favorable and normalized energy policies, technical standards, and
regulations that enable power grids to integrate large generation fractions of VRE
power plants. Furthermore, international technological and research cooperation's
should be established for the exchange of experiences and technology, especially
for the power grid adaption. As a result of these measures we think that exponential
growth restrictions for the expansion of wind and photovoltaic power plants can be
avoided. Adequately high carbon taxes that are appropriate for the compensation of
the present and future economic and environmental damage should also be
considered. As discussed in (Hansen et al., 2015), an internationally homologized
carbon tax should be established, and carbon taxed should also added to the import
of products in a proportion as weighed by the product price, the country's emitted
CO2 and its gross national product. Additionally, subsidies of thermal power plants,
and principally coal fueled thermal power plants, which produce the largest CO2 per
MWh generated, should be internationally abolished. The long term generation
commitments related these power plants should also be avoided, inclusively to avoid
economic losses.
Our exponential grow curves and the discussed growth constraints of the analyzed
VRE technologies (Kratzenberg, 2021) can be used as a guideline to validate if there
are limiting factors that reduce the exponential growth of VRE technologies in the
different countries. Furthermore, we expect that the nearly linear growth of the wind
power expansion in the past three years, can be bound back to its exponential
growth pattern if the essential requirement of adequate energy policies are
established. Such polices should act on the control and elimination of the discussed
limiting factors for exponential growth. The possible reasons of the bow from
originally exponential growth, back to linear growth in the last three years, should be
investigated in different countries and positive experiences should be communicated
and applied in an effective way allowing exponential growth in most of the countries.
We consider these measures as being effective for a rebound to the original
exponential growth pattern of the cumulative installation of the global wind generator
power. Together with the exponential growth of PV this results in the significant
reduction of future CO2 emissions, and its related radiative forcing effect in the
atmosphere, which enables the mitigation of severe outcomes of future climate
change (Appendix 2).
The generation cost (LCOE) of wind and photovoltaic systems will decrease at an
exponential scale furthermore, which is shown best by the clear cost decrease
tendency as a function of its manufacturing scale in Fig. 8. It is also shown by the
Swanson law, e.g., in (Diamandis and Kotler, 2012), showing an exponential price
decrease of the PV module cost as a function of the cumulative installed capacity.
However, Fig. 8 presents apparently a higher point correlation if comparted to the

Swanson's curve. The figure also shows that for exceptionally large generation
capacities the generation cost of wind and photovoltaic energy have with the
expected ~ 1 US$/MWh virtually near zero costs. In such scenarios the storage cost,
as well as the maintenance and control of the power grid will represent the main part
of the future electric energy costs. However, in the case of the adoption of a large
quantity of heat storages controlled by DR (section 2.6 in (Kratzenberg, 2021)),
which emulates an electrical storage, the cost of the electric energy for the final
consumers will decrease significantly, because of the ultra-low cost of storage and
generation of energy. This low cost structure also enables the economic generation
of hydrogen and methane not only to store excess electrical energy, but also for its
use in long distance transport, and for further industrial processes. Additionally, such
low costs allows the use of the excess energy in large desalinization plants, providing
additional drinking water and water for irrigation in the agriculture (Diamandis and
Kotler, 2012), and allows a further cost decrease because of the even higher mass
production of PV and wind power plants. From the extrapolation of the recent growth
pattern it can be seen that the expansion of photovoltaic power plants, will be able
to provide the main part of the world's primary energy in 2030 (Fig. 5). Therefore,
even if wind power plants do not grow on an exponential rate, a 100% primary energy
generation can be attained in-between 2030 (Fig. 6) and 2032 (Fig. 5). However, the
growth of wind power plants is important because of its complementary generation
in different time scales, which lowers the necessary storage capacity and its cost.
Such a relationship is easy to see, as without wind generation a large part of PV
generation would be necessary to be stored for its supply over-night and in periods
with low solar irradiance.
The storage of conventional and pumped hydropower plants will also play an
important role in a 100% renewable power supply. However, because of the limited
expansion potential of the global hydropower plants (Appendix 1) off-river
hydropower plants will be especially important in countries, which current energy
generation is mainly based on non-renewable power plants. Meanwhile, to minimize
the costs of the necessary storage, the much lower-cost thermal storages units, as
emulated by DR, should be implemented by market forces on the base of subsidies,
as this configuration will finally result in a much lower cost of the electric energy for
the energy consumers. Additionally, power girds should be enlarged and
interconnected to make use of different consumption profiles and generation profiles
of the VRE plants that also reduce the storage demand.
The most important use of lithium ion batteries is in Electric Vehicles and to attend
the demand on electric energy at charging stations in parking lots, at locations where
the power grid is not already actualized to accomplish this job, or in locations still
without power grid, where the battery is charged with a renewable power plant. Such
a concept not only enables the rapid implementation of an EV infrastructure, but also
results in the real demand on the necessary power grid infrastructure, allowing the
use of battery containers in several different parking lots within its lifetime, which

results in higher ROI (ROI). Batteries can also be important to provide auxiliary
functions to improve the power grid's quality via specific control functions (do
Nascimento and Rüther, 2020) or virtual synchronous machines.
Energy security was an argument in 2020 (Pinto, 2020) to mitigate possible problem
of a brownout in the Brazilian electricity grid by the installation of thermal power plant.
A brownout is a blackout by reason of insufficient generation capacity rather than by
reason of technical problem, such as a transmission supply breakage. However, in
the present case the energy generation cost of PV power plants is already below the
cost of thermal power plants. Furthermore, a correctly tuned power grid generates
more energy in dry periods, by the installed PV and wind power plants, as in periods
with average hydropower generation. This excess generation leads to lower use of
the hydropower generation capacity conserving therefore high water levels in the
hydropower lakes. In countries with low generation capacity dry periods are also not
a problem, because the used off-river-hydropower plants are only used for the
circulation of water between two lakes of different heights, and its evaporation can
be reduced by a floating covers in extreme cases, or even by floating PV power
plants.
Finally we like to remark than it is important that governments, industry and the area
of power grid research take actions to allow a non-restricted exponential growth of
the energy generation with VRE power plants. Otherwise, the combined benefit of a
future with ultra-low-cost-energy generation, the providence of labor places, and the
mitigation of climate change cannot be exploited in its full magnitude.

References
Abdallah, N.B., Mouhous-Voyneau, N., Denoeux, T., 2013. Using Dempster-Shafer Theory to model uncertainty in climate change and environmental impact assessments, Proceedings of the 16th International Conference on Information Fusion. IEEE, pp. 2117-2124.
Airbus, 2021. Airbus reveals new zero-emission concept aircraf. https://www.airbus.com/newsroom/press-releases/en/2020/09/airbus-reveals-new-zeroemission-concept-aircraft.html. (Accessed 30.01.2021.
Arent, D., Sullivan, P., Heimiller, D., Lopez, A., Eurek, K., Badger, J., Jorgensen, H.E., Kelly, M., Clarke, L., Luckow, P., 2012. Improved offshore wind resource assessment in global climate stabilization scenarios. National Renewable Energy Lab.(NREL), Golden, CO (United States).
BloombergNEF, A., 2019. Behind the Scenes Take on Lithium-ion Battery Prices. BP, 2020. BP-Statistical Review of World Energy June 2020. CLARK, P.U., DELWORTH, T.L., WEAVER, A.J., Posts Tagged 'Al Gore'. Delucchi, M.A., Jacobson, M.Z., 2011. Providing all global energy with wind, water, and solar
power, Part II: Reliability, system and transmission costs, and policies. Energy policy 39(3), 1170-1190. http://dx.doi.org/10.1016/j.enpol.2010.11.040.
Diamandis, P.H., Kotler, S., 2012. Abundance: The future is better than you think. Simon and Schuster.
do Nascimento, Á.D.J., Rüther, R., 2020. Evaluating distributed photovoltaic (PV) generation to foster the adoption of energy storage systems (ESS) in time-of-use frameworks. Solar Energy 208, 917-929.
Dudley, B., 2015. BP statistical review of world energy 2016. London, UK. EIA, 2020. Electric Power Monthly - Table 6.07.B. Capacity Factors for Utility Scale Generators
Primarily Using Non-Fossil Fuels. https://www.eia.gov/electricity/monthly/epm_table_grapher.php?t=epmt_6_07_b. (Accessed 18.03.2021 2021).
Fawzy, S., Osman, A.I., Doran, J., Rooney, D.W., 2020. Strategies for mitigation of climate change: a review. Environmental Chemistry Letters, 1-26.
Ghosh, I., 2020. Global greenhouse gas emissions by sector. https://www.visualcapitalist.com/a-global-breakdown-of-greenhouse-gas-emissions-by-sector/.
Glassman, J.A., 2009. The acquittal of carbon dioxide. Online: http://www. rocketscientistsjournal. com/2006/10/co2_acquittal. html.
Guilera, J., Morante, J.R., Andreu, T., 2018. Economic viability of SNG production from power and CO2. Energy Conversion and Management 162, 218-224.
Hansen, J., Sato, M., Hearty, P., Ruedy, R., Kelley, M., Masson-Delmotte, V., Russell, G., Tselioudis, G., Cao, J., Rignot, E., 2015. Ice melt, sea level rise and superstorms: evidence from paleoclimate data, climate modeling, and modern observations that 2° C global warming is highly dangerous. Atmospheric Chemistry & Physics Discussions 15(14).
Hansen, J., Sato, M., Ruedy, R., 1997. Radiative forcing and climate response. Journal of Geophysical Research: Atmospheres 102(D6), 6831-6864. http://dx.doi.org/10.1029/96JD03436.
Hashemi, S., Østergaard, J., 2016. Methods and strategies for overvoltage prevention in low voltage distribution systems with PV. IET Renewable power generation 11(2), 205-214.
Hirth, L., Ueckerdt, F., Edenhofer, O., 2015. Integration costs revisited–An economic framework for wind and solar variability. Renewable Energy 74, 925-939. http://dx.doi.org/10.1016/j.renene.2014.08.065.
Huang, J., Erb, T., THE 'SIGNALING'EFFECT OF THE PARIS AGREEMENT.

IHA, 2020. A brief history of hydropower - From its earliest beginnings to the modern era. https://www.hydropower.org/discover/history-of-hydropower. (Accessed 06.03.2021 2021).
Jacobson, M.Z., 2017. Roadmaps to transition countries to 100% clean, renewable energy for all purposes to curtail global warming, Air Pollution, and Energy Risk. Earth's Future 5(10), 948-952.
Jacobson, M.Z., Delucchi, M.A., 2011. Providing all global energy with wind, water, and solar power, Part I: Technologies, energy resources, quantities and areas of infrastructure, and materials. Energy policy 39(3), 1154-1169. http://dx.doi.org/10.1016/j.enpol.2010.11.040.
Jacobson, M.Z., Delucchi, M.A., Bauer, Z.A., Goodman, S.C., Chapman, W.E., Cameron, M.A., Bozonnat, C., Chobadi, L., Clonts, H.A., Enevoldsen, P., 2017. 100% clean and renewable wind, water, and sunlight all-sector energy roadmaps for 139 countries of the world. Joule 1(1), 108-121.
Jacobson, M.Z., Delucchi, M.A., Cameron, M.A., Frew, B.A., 2015. Low-cost solution to the grid reliability problem with 100% penetration of intermittent wind, water, and solar for all purposes. Proceedings of the National Academy of Sciences 112(49), 15060-15065. http://dx.doi.org/10.1073/pnas.1510028112.
Jagger, N., Foxon, T., Gouldson, A., 2013. Skills constraints and the low carbon transition. Climate policy 13(1), 43-57.
Kausche, M., Adam, F., Dahlhaus, F., Großmann, J., 2018. Floating offshore wind-Economic and ecological challenges of a TLP solution. Renewable Energy 126, 270-280.
Klose, A.K., Karle, V., Winkelmann, R., Donges, J.F., 2020. Emergence of cascading dynamics in interacting tipping elements of ecology and climate. Royal Society open science 7(6), 200599.
Koohi-Fayegh, S., Rosen, M., 2020. A review of energy storage types, applications and recent developments. Journal of Energy Storage 27, 101047.
Kovač, A., Paranos, M., Marciuš, D., 2021. Hydrogen in energy transition: A review. International Journal of Hydrogen Energy.
Kratzenberg, M., Georg; Rüther, Ricardo, 2021. A short review about the limiting factors which can hold back wind and photovoltaic power plants from its presently exponential growth. Solar Energy.
Kroposki, B., Johnson, B., Zhang, Y., Gevorgian, V., Denholm, P., Hodge, B.-M., Hannegan, B., 2017. Achieving a 100% renewable grid: Operating electric power systems with extremely high levels of variable renewable energy. IEEE Power and Energy Magazine 15(2), 61-73.
Kusch-Brandt, S., 2019. Urban Renewable Energy on the Upswing: A Spotlight on Renewable Energy in Cities in REN21's "Renewables 2019 Global Status Report". Multidisciplinary Digital Publishing Institute.
LAZARD, 2019. Levelized Cost of Energy and Levelized Cost of Storage 2019. https://www.lazard.com/perspective/lcoe2019. (Accessed 06.03.2021 2021).
Le Cozannet, G., Duvat, V., Salvat, B., Etienne, S., Terorotua, H., Garcin, M., Lecacheux, S., Montaggioni, L., 2018. Modelling the response of atoll reef islands to multi-millennial sea level rise from the last glacial maximum to the coming 10kyr: the case of mururoa atoll (tuamotu, french polynesia). Journal of Coastal Research(85), 511-515.
Lindsey, R., 2018. Climate change: atmospheric carbon dioxide. National Oceanographic and Atmospheric Administration, News & Features. August.
Lu, X., McElroy, M.B., Kiviluoma, J., 2009. Global potential for wind-generated electricity. Proceedings of the National Academy of Sciences 106(27), 10933-10938.

Lutsko, N.J., Seeley, J.T., Keith, D.W., 2020. Estimating Impacts and Trade‐offs in Solar Geoengineering Scenarios With a Moist Energy Balance Model. Geophysical Research Letters 47(9), e2020GL087290.
Mariusson, J., Thorsteinsson, L., 1997. Study on the importance of harnessing the hydropower resources of the world, Hydropower and Other Renewable Energies Study Committee "Hydren". XXIV Congress, Unipede.
Martínez, P.H., 2020. Lithium-ion battery energy storage systems: global market assessment and business model development in Spain.
Masson-Delmotte, T., Zhai, P., Pörtner, H., Roberts, D., Skea, J., Shukla, P., Pirani, A., Moufouma-Okia, W., Péan, C., Pidcock, R., 2018. IPCC, 2018: Summary for Policymakers. In: Global warming of 1.5 C. An IPCC Special Report on the impacts of global warming of 1.5 C above pre-industrial levels and related global greenhouse gas emission pathways, in the context of strengthening the global. World Meteorological Organization, Geneva, Tech. Rep.
MenkorAviation, 2021. Otto Aviation unveils the Celera 500L, an Aircraft that can Change Everything. https://www.menkoraviation.com/en/news/otto-aviation-unveils-the-celera-500l-an-aircraft-that-can-change-everything/. (Accessed 30.01.2018.
NOAA, 2019. Billion Dollar Disasters - Costly weather and climate disasters have increased. https://www.globalchange.gov/browse/indicators/billion-dollar-disasters.
NOAA, N.O.a.A.A., Global Monitoring Laboratory, 2021. Trends in Atmospheric Carbon Dioxide - Monthly Average Mauna Loa CO2. https://www.esrl.noaa.gov/gmd/ccgg/trends/weekly.html. (Accessed 23.01. 2021.
Paur, J., 2012. Boeing Freezes Design With Liquid Natural Gas-Powered Airliner. https://www.wired.com/2012/03/boeing-freezes-design-with-liquid-natural-gas-powerd-airliner/. (Accessed 30.01.2021.
Petit, J.-R., Jouzel, J., Raynaud, D., Barkov, N.I., Barnola, J.-M., Basile, I., Bender, M., Chappellaz, J., Davis, M., Delaygue, G., 1999. Climate and atmospheric history of the past 420,000 years from the Vostok ice core, Antarctica. Nature 399(6735), 429.
Pinto, T., 2020. O apagão energético de 2001. https://brasilescola.uol.com.br/historiab/apagao.htm. (Accessed 26.03. 2021).
Ray, D., 2019. Lazard's Levelized Cost of Energy Analysis—Version 13.0. Lazard: New York, NY, USA, 20.
Reichelstein, S.J., Sahoo, A., 2015. Cost-and price dynamics of solar PV modules. REVE, 2020. Nordex to build concrete tower factory for wind turbines for wind energy in Spain.
https://www.evwind.es/2020/06/26/nordex-to-build-concrete-tower-factory-for-wind-turbines-for-wind-energy-in-spain/75349. (Accessed 17.3. 2021).
Schalk, C., 2019. An independent Global Energy Forecast to 2050, to compare with the IEA's WEO 2019. EnergyPost.eu.
Shakoor, A., Ashraf, F., Shakoor, S., Mustafa, A., Rehman, A., Altaf, M.M., 2020. Biogeochemical transformation of greenhouse gas emissions from terrestrial to atmospheric environment and potential feedback to climate forcing. Environmental Science and Pollution Research, 1-24.
Smith, A., Lott, N., Houston, T., Shein, K., Crouch, J., Enloe, J., 2019. US Billion-Dollar Weather & Climate Disasters 1980-2019. NOAA National Centers for Environmental Information,[Online], Available: https://www. ncdc. noaa. gov/billions/events. pdf.[Accessed April 18, 2018].
Statista, 2021. Global offshore wind energy capacity from 2009 to 2019 https://www.statista.com/statistics/476327/global-capacity-of-offshore-wind-energy/.
Statistics, O.E., 2008. Fuel and Energy Source Codes and Emission Coefficients. Energy Information Administration, Department of Energy, retrieved July 7, 2009.
Stern, N., 2008. The economics of climate change. American Economic Review 98(2), 1-37. Turner, M.G., Calder, W.J., Cumming, G.S., Hughes, T.P., Jentsch, A., LaDeau, S.L., Lenton, T.M.,
Shuman, B.N., Turetsky, M.R., Ratajczak, Z., 2020. Climate change, ecosystems and abrupt change: science priorities. Philosophical Transactions of the Royal Society B 375(1794), 20190105.
Webb, J., de Silva, H.N., Wilson, C., 2020. The future of coal and renewable power generation in Australia: A review of market trends. Economic Analysis and Policy.
Wheeling, K., 2020. How Long Was Venus Habitable? , Eos Science News by AGU. Journal of Geophysical Research: Planets.
Wikipedia, 2020. Solar Power - Table: Largest PV power stations as of February 2020 https://en.wikipedia.org/wiki/Solar_power. (Accessed 29.01.2021.
Wikipedia, 2021a. Carbon tax. https://en.wikipedia.org/wiki/Carbon_tax. (Accessed 27.03. 2021). Wikipedia, 2021b. Growth of photovoltaics.
https://en.wikipedia.org/wiki/Growth_of_photovoltaics#cite_note-BP-review-world-energy-2020-96.
Wikipedia, 2021c. List of deserts by area. https://en.wikipedia.org/wiki/List_of_deserts_by_area. (Accessed 29.01.2021.
Wikipedia, 2021d. SpaceX Raptor. Wikipedia, 2021e. Wind power by country.
https://en.wikipedia.org/wiki/Wind_power_by_country.

Appendix 1 - Basic data for the potential estimation
Energy demand by 2030:
Electric energy demand in 2030: 35,000 TWh/year (Schalk, 2019),
Primary energy demand in 2030: 186,000 TWh/year (Schalk, 2019).
Reduced primary energy demand in 2030 because of a 42.5% reduced energy
consumption by the 100% renewable energy generation (Jacobson et al., 2017):
106,950 TWh/year.
Example 1: 2030 Energy demand solely covered by PV power plants:
Global desert area, excluding Antarctica, as calculated from (Wikipedia, 2021c),
citing several further references: 34.93 million km2,
42.8 MWpeak/km2 installed power on average, as calculated from data of several utility
PV plants presented in (Wikipedia), citing several further references,
Average capacity factor of PV plants in the US is 25.6%, as based on 2017 data
(EIA, 2020),
PV plant area 357,667 km2 to cover electric energy demand in 2030,
PV plant area 2.015 million km2 to cover primary energy demand in 2030,
Occupied global desert area 1.21% to cover electric energy demand in 2030,
Occupied global desert area 6.83% to cover primary energy demand in 2032,
Occupied global desert area 3.93% to cover reduced primary energy demand.
Example 2: 2030 Energy demand solely covered by wind power plants:
Onshore wind power potential: 690,000 TWh/year (Lu et al., 2009),
Offshore wind power potential < 200 m: 192,000 TWh/year (floating wind turbines);
(Arent et al., 2012),
Offshore wind power potential < 1000 m (Kausche et al., 2018): 301,085 TWh/year
(as extrapolated for floating wind turbines at this depth, Appendix Figure 1),
Onshore and offshore total potential 301,775 TWh/year,
Global wind potential necessary to cover electric energy demand in 2030:11.59 %,
Global wind potential necessary to cover primary energy demand in 2030: 61.63 %,
Global wind potential to cover reduced primary energy demand: 35.44%.
Presently hydropower as a renewable energy source, has already developed generation
potential of 6.5 TWh/year, which is more than half of the exploitable generation potential of
10.5 TWh/year (Mariusson and Thorsteinsson, 1997).

Appendix Figure 1: Total offshore potential considering fixed installation and floating wind
turbines. Potential was correlated to the available space for different depths and the value
for 1000 m depth were extrapolated with the available sea space for this depth. Data
obtained from (Arent et al., 2012) and (Kausche et al., 2018). Floating turbines are
considered for the water deepths between 90 and 1000 m, presenting approximately half of
the available potential or resource.
Appendix 2 - Worst case outcomes of climate change
The safety of potentially dangerous technological machinery projected by humans, e.g.,
commercial aero plans or nuclear power stations, has to be validated by the evaluation of
worst case scenarios. However, the future of the Earth's climate is not anymore determined
by nature but is rather dependent on the appropriate action of humans. Therefore, worst
case scenarios must also be evaluated for climate change.
Presently two thirds of the global warming is a function of the atmosphere's water vapor.
However there is a tendency to increase the water vapor in the atmosphere, because of the
global warming. The present temperature increase as a function of global warming is still
moderate in comparison to what can be expected it the future, as presently the added heat
energy is absorbed by the melting of the global glaciers. After the melting of these glaciers
heat cannot be anymore absorbed in the same proportion, which leads to a much severe
heating of the global atmosphere and more water vapor. Therefore, a possible worst-case
scenario outcome is the evaporation of the Earth's available seawater, an effect well known

in planetary science, because of the tipping point at which a global warming results in
extremely high concentration of water vapor in the atmosphere. This tipping point is also
based on a positive feedback, which increases progressively radiative forcing as a function
of the increased level of water vapor. It is an outcome to which other planet systems were
already subjected to. E.g., as shown by numerical long-term simulation of its planetary
circulation system, Venus were habitable some billion years ago and presented an ocean
which was, however, evaporated because of the radiative forcing (Wheeling, 2020).
Therefore, a conservative evaluation of the long-term outcome of climate change should
consider this worst case hypothesis.
Such a worst-case outcome accompanies a sea-level rise up to 70 m, as related to the
melting of all the available glaciers on the Earth's surface, meaning the north- south- and
mountain glaciers. Without the decarbonization of human activities the CO2 level will exceed
the levels of the Ecocene epoch, 56 to 34 million years ago, which can by theory result in a
see level rise from 20 to 70 m, probably within the next 2000 years, depending on the
quantity of the human-induced greenhouse gas emissions (Le Cozannet et al., 2018).
Another worst case scenario is that of severe economic losses as a function of the average
temperature increase of the atmosphere's surface temperature. As based on the indirect
measurements of the climate's history by the extraction of the south-pole ice core, (Appendix
Figures 2 and 3), the global warming of the Earth's atmosphere at its surface will be nearly
T 16 oC under thermal equilibrium conditions (Appendix Figure 3). This equilibrium is
solely expected for the extrapolated CO2 level of 2025, and as the present exponential
increase of CO2 emission continues, more heating can be expected. For the CO2 level of
425 ppm in 2025 such losses present an estimated value of 70 % of the global gross
domestic product GDP as based on climatic events, considering the thermal equilibrium
condition of the atmospheres and hydrosphere in any time after 2025 (Appendix Figure 4).
First signs of such an exponential increase of these losses are already present (Appendix
Figure 5), and its expected exponential increase leads to the almost complete deterioration
of the global economic system, surly related to intense suffering of humanity.
Presently the cost of severe storms sums up to a total of US$ 1.875 trillion within the last 40
years, solely the US (Smith et al., 2019). Starting from 2007 this cost is continuously on high
values (Appendix Figure 5), which are approximately an order of magnitude larger compared
to the interval between 1980 and 2007 (Appendix Figure 5), indicating a dangerous
exponential increase of the cost related to future climate events.

Appendix Figure 2: Superposition in the behavior of the atmosphere's CO2 level and its
global average temperature, showing that these variables are highly correlated in the Earth's
warm an ice-age cycles. The arrows indicate that the warm cycles present short-term high
temperatures with higher amplitudes than the atmosphere's CO2 content. However, because
of the present high CO2 level, as grown exponentially since the industrial revolution, there is
a large expected temperature response of the surface temperature for the present CO2 level.
Solely in 2025, where the expected CO2 level is 425 ppm, the correlated temperature
increase is in the order of roughly T = 10 oC, considering the historical pattern of three
warm cycles is followed. The measurements are based on the analyses of the conserved
layers of the Antarctic ice core, presenting air samples and the heavy water isotope, which
increases in global warming periods (Petit et al., 1999).
Source: https://stevengoddard.files.wordpress.com/2011/05/last_400000_years.png

Appendix Figure 3: Correlation of the atmospheres CO2 level and its temperature using the
same data set as presented in Appendix Figure 1, showing here also the extrapolation of
these two variables. Because of the emission of CO2 as related to human activities the
present CO2 levels, as shown for 2020 and 2025, are very high. Because of the known
relationship between the increase of the global surface temperature of the atmosphere and
the (Vostok Delat Temperature) and the atmosphere's CO2 level, the extrapolated CO2 level
in ~ 2025 (~ 425 ppm), results in a estimated temperature response of approximately T =
16 oC. Figure adapted from (Glassman, 2009), using the same VOSTOK CO2 and
temperature data as presented in (Petit et al., 1999). The extrapolated thermal equilibrium
points are drawn from the CO2 levels of 2020 and 2025. The thermal equilibrium points
consider the historic relationship between the CO2 level and the global warming. The data
was obtained from the analysis of Earth's climate history obtained by hollow drillings of the
Antarctic's ice sheet.

Appendix Figure 4: Estimated economic losses of the global gross domestic product (GDP)
as a function of the average temperature increase of the Earth's surface, as related to the
CO2 emissions and global warming, with extrapolated data for the thermal equilibrium
temperature increase of T = 16 oC, as related to the extrapolated CO2 level of 2025
(Appendix Figure 3). Figure adapted by extrapolation from (Stern, 2008).
Appendix Figure 5: Tendency of the exponential increase of the frequency of billion disaster
events, principally severe storms, as a function of time, all related to the change of the global
climate because of the increased heat energy level in the atmosphere, because of the
radiative forcing effect as principally related to the CO2 level in the atmosphere.
Figure obtained from (NOAA, 2019).
Global warming expressed in average surface temperature increase (T)
GDP losses [%]

Appendix 4 - Explanation of related concepts and effects
Thermal insulation effect of CO2: The known effect of the thermal insulation of
CO2 can be shown by a simple physics experiment using an infrared camera for the
registration of thermal radiation of a human body. Filling a birthday air balloon with
CO2 and holding it between the camera and a person shows the balloon as a black
spot, which is not the case if the balloon is filled with air.
Radiative forcing and its energy: Natural radiative forcing provides the Earth's
necessary energy for being a habitable planet. While the radiative forcing of
anthropogenic origin, as principally related to the CO2 emissions, is only a small part
of the natural radiative forcing, it adds large quantities of energy to the Earth's
atmosphere and oceans. E.g. for 0.5 W/m2 additive radiative forcing, the extra
energy retained by the atmosphere corresponds to an equivalent heating with the
energy of 400,000 Hiroshima nuclear bomb explosions per day (CLARK et al.),
because of the Earth's large surface. This energy has to be comported by the Earth's
atmosphere and hydrosphere. The present radiative forcing is with the value of circa
1 W/m2 twice as high.
Global warming: The effect of the increase of the global average temperature of
the atmosphere measured at sea level, is observed by temperature measurements,
but is also simulated by a mathematical model which simulate the thermodynamic
and behavior of the Earth's atmosphere at different heights and also includes the
simulation of the Earth's hydrosphere. This modelling presents such a high
sensitivity that temporal diming effects because of gases emitted from Vulcan
eruptions can be visualized. The present global warming cannot be explained by
other effects if in these simulations the warming effect as a function of the increased
CO2 level is taken out.
Milankovich solar irradiation effect: Milankovich discovered that the earth orbit
and its declination is subjected to small modifications in a cycles of several thousand
years. These changes resulted in the feeble increase or decrease of the absorbed
solar irradiations by the atmosphere as a function of time, which resulted by
hypothesis in the Earth's ice ages and warm periods as to see from Appendix Figure
2. Because of the preset declination earth is advancing to the next ice age.
Meanwhile, the global warming related to the increased CO2 level, compensates this
cooling effect by a warming which is, however, approximately five order of
magnitudes higher as the present Milankovich cooling.
Climate history by south-pole ice core extraction: Similar as the age and growth
cycles of a three can be identified by the aging rings at a cut of its trunk, the climate
history of the Earth can be accessed by the analysis of the ice layers of the south-
pole, as built up by snow fall within several thousand years. In these layers air and
water molecules are conserved as samples of the climate's history. As calibrated
with present measurement of the heavy water isotope, warmer years lead to an

increased evaporation rate of this heavy water isotope, and colder years lead to a
decreased evaporation rate. By calibration an indirect measurement of the Earth's
average temperature can be determined for a long term history of several thousand
years (Appendix Figure 2). A measurement of the CO2 level in the conserved air is
also be calibrated with data from the present snow layers and CO2 in the atmosphere
resulting, therefore, in the indirect measurement of the CO2 level.
Difficulty to predict future extreme climate events: Even so that the models
which simulate climate change improved considerably over the past; they only can
simulate the complex processes as related to the Earth's atmospheric and ocean
circulations to a limited extend, because of the many interaction effects between the
atmosphere, hydrosphere and biosphere. Therefore, many correlation effects were
only discovered recently, and it is probable that many other effects will only be
discovered in the future. As a result it is difficult to predict exactly the time when the
severe outcomes of climate change will follow.
Examples of such effects are several positive feedback effects (Turner et al., 2020),
tipping point effects, and domino effects (Klose et al., 2020), where a critical
threshold of a first tipping element triggers several other tipping elements. A tipping
point defines the transition of two stable states, which no point of regression.
Because of the interactions between these elements a modelling which integrate all
these elements and its nonlinear relationships is highly challenging, which makes
the outcome of extreme events related to the future climate change highly
unpredictable. While a modeling can lead to a most probable outcome, e.g., that of
seawater rise, large model uncertainties lead to the increase of the uncertainty range
especially as related to the time when such events will happen.
Difficulty to mitigate climate change: The problem of climate change is that the
generated heat is produced as a function of two cumulative effects. The first is the
cumulative accretion of CO2 in the atmosphere, which generates the radiative forcing
effect that results in the cumulative generation of heat absorbed by the Earth's
hydrosphere and atmosphere as the incoming energy of short wave radiation is
higher than the outgoing irradiation of long wave radiation (Shakoor et al., 2020).
Assuming humankind would be very capable and stop the present CO2 emission
completely now, then the cumulative heat creation is still not solved, because of the
invariant high value of the CO2 in the atmosphere, which must be reduced, e.g., by
reforestation measures. This means that the Earth's remaining ecosystem must be
capable to convert the already emitted CO2 in oxygen and carbon in order to avoid
the further radiative forcing. Such a conversion is necessary as the already
accumulated CO2 in the atmosphere, as emitted since the industrial revolution, must
first be converted by the Earth's vegetation to enable the reduction of the radiative
forcing effect. This means, we must address not only the reduction of the CO2
emissions by a 100% renewable energy generation, but we also must consider
reforestation actions to reduce the present high level of CO2 in the atmosphere to
attain most swiftly pre-industrial levels. However, because of the two cumulative

functions, these two actions do still not address the accumulated heat in the
atmosphere.
Climate change mitigation with the lowest risk: Geoengineering could be a
solution to solve this problem temporarily until the time when adequate measures
can reduce the atmosphere's CO2 content (Lutsko et al., 2020). However, the related
unknown side effects, such as over- or undercooling present another threat.
Therefore, and in order to avoid costs and risks related to (i) geoengineering and (ii)
further climate change outcomes, we should as quick as possible transform the
present energy generation and use, for a complete support with renewable power
plants.
Reforestation actions in an adequate scale, and interspersed distancing, to avoid the
proliferation of fire, also present low cost of US $ (5…50) / ton CO2 capture and can
provide additional income from the produced wood (Fawzy et al., 2020). As
discussed by the Fawzy and Coworkers, the coverage of only 1% of the Earth's
surface (500 million hectares), result in an additional CO2 capture between 0.5 and
3.6 billion metrics tons CO2 per year. The upper value corresponds to 9.5 % of the
present annual emissions of CO2. As a result large scale reforestation can reduce
the present reduction of CO2 and radiative forcing to preindustrial level. Presently, a
small part of the reforestation action, saying the part which costs less than US $ 12
per captured ton of CO2, can be financed by carbon taxes at an equivalent value, as
this value refers to the present carbon taxes, as calculated from the table in
(Wikipedia, 2021a), citing (Statistics, 2008), for different types of thermal power
plants. Therefore, carbon taxes should be increased, and rigorously should also
cover the present and expected damages from climate change.
Understand exponential growth: Exponential growth has the typical appearance
of an inverted knee curve, at which growth starts at very low rates, and because of
the continuous exponential increase growth rates become extremely large seaming
to provide an almost vertical growth of the related effect after some time. In such a
configuration it is obvious that time lags in the exponential growth, as eventually
might happen for the cumulative installation of wind power, can limit the total growth
as a function of time considerably. Therefore, adequate planning measures have to
be implemented during the whole growth period, and the scale of these planning
measures should be oriented on the exponential growth ability as here specified for
the two presented VRE technologies. Additionally, the power grid must adapt
adequately, especially for the high future VRE fractions, providing the necessary (i)
storage, (ii) emulated storage, and (iii) grid stability measures as discussed in
sections 2.1 to 2.10 in (Kratzenberg, 2021).
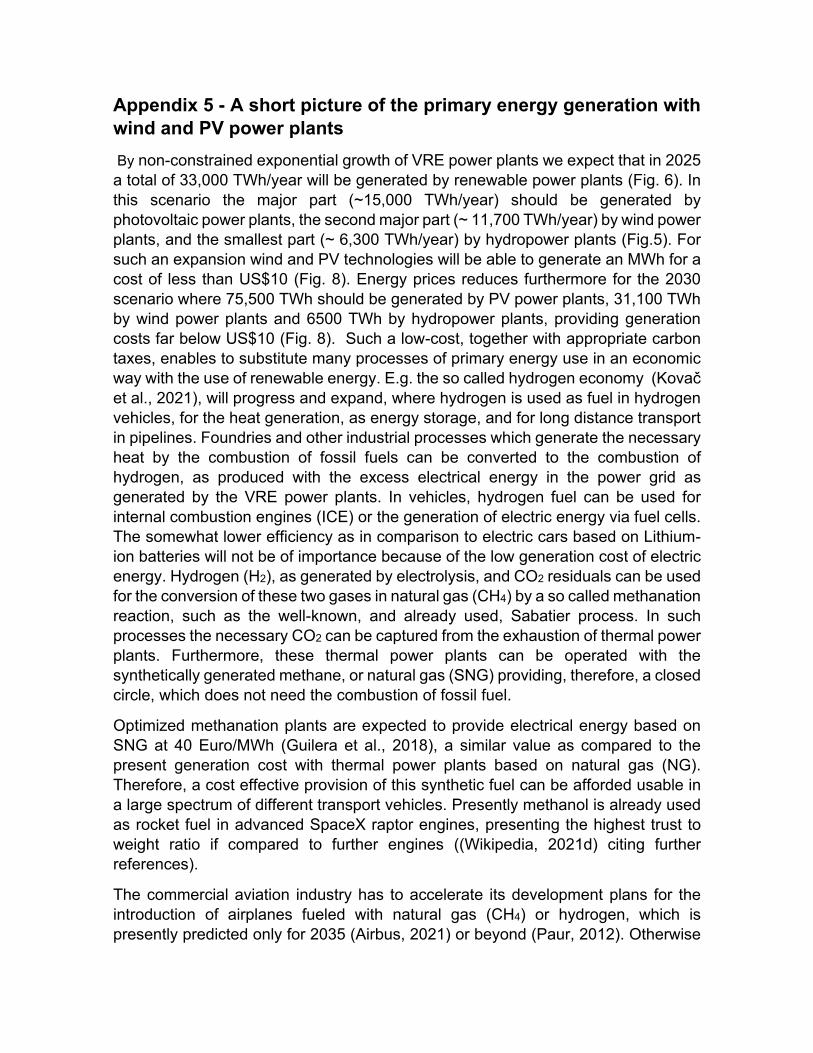
Appendix 5 - A short picture of the primary energy generation with
wind and PV power plants
By non-constrained exponential growth of VRE power plants we expect that in 2025
a total of 33,000 TWh/year will be generated by renewable power plants (Fig. 6). In
this scenario the major part (~15,000 TWh/year) should be generated by
photovoltaic power plants, the second major part (~ 11,700 TWh/year) by wind power
plants, and the smallest part (~ 6,300 TWh/year) by hydropower plants (Fig.5). For
such an expansion wind and PV technologies will be able to generate an MWh for a
cost of less than US$10 (Fig. 8). Energy prices reduces furthermore for the 2030
scenario where 75,500 TWh should be generated by PV power plants, 31,100 TWh
by wind power plants and 6500 TWh by hydropower plants, providing generation
costs far below US$10 (Fig. 8). Such a low-cost, together with appropriate carbon
taxes, enables to substitute many processes of primary energy use in an economic
way with the use of renewable energy. E.g. the so called hydrogen economy (Kovač
et al., 2021), will progress and expand, where hydrogen is used as fuel in hydrogen
vehicles, for the heat generation, as energy storage, and for long distance transport
in pipelines. Foundries and other industrial processes which generate the necessary
heat by the combustion of fossil fuels can be converted to the combustion of
hydrogen, as produced with the excess electrical energy in the power grid as
generated by the VRE power plants. In vehicles, hydrogen fuel can be used for
internal combustion engines (ICE) or the generation of electric energy via fuel cells.
The somewhat lower efficiency as in comparison to electric cars based on Lithium-
ion batteries will not be of importance because of the low generation cost of electric
energy. Hydrogen (H2), as generated by electrolysis, and CO2 residuals can be used
for the conversion of these two gases in natural gas (CH4) by a so called methanation
reaction, such as the well-known, and already used, Sabatier process. In such
processes the necessary CO2 can be captured from the exhaustion of thermal power
plants. Furthermore, these thermal power plants can be operated with the
synthetically generated methane, or natural gas (SNG) providing, therefore, a closed
circle, which does not need the combustion of fossil fuel.
Optimized methanation plants are expected to provide electrical energy based on
SNG at 40 Euro/MWh (Guilera et al., 2018), a similar value as compared to the
present generation cost with thermal power plants based on natural gas (NG).
Therefore, a cost effective provision of this synthetic fuel can be afforded usable in
a large spectrum of different transport vehicles. Presently methanol is already used
as rocket fuel in advanced SpaceX raptor engines, presenting the highest trust to
weight ratio if compared to further engines ((Wikipedia, 2021d) citing further
references).
The commercial aviation industry has to accelerate its development plans for the
introduction of airplanes fueled with natural gas (CH4) or hydrogen, which is
presently predicted only for 2035 (Airbus, 2021) or beyond (Paur, 2012). Otherwise

1
10
100
1000
10000
2005 2010 2015 2020 2025 2030 2035
Co
st o
f Li
thiu
m io
n b
atte
ries
[$
/kW
h]
Year
they may lose passenger shares to new flight concepts, presenting extremely
streamlined aviation fuselages being, therefore, highly fuel efficient (MenkorAviation,
2021). As based on ICE this propeller driven aero plane type is able to fly with SNG
in intercontinental flights. For intracontinental flights this vehicle can also operate
with electric motors and propellers, where its energy is stored in lithium-ion batteries.
With its commercial introduction predicted in 2025, this airplane presents an 8.6
times higher fuel economy, a 6.4 times lower operation cost, and a more than two
times larger flight range, compared to a similar light passenger jets. Its flight speed
of 724 km/h, is not losing much in comparison to conventional passenger jets.
Appendix 6 – Further figures
Appendix Figure 6: Historic and future cost estimation of the exponential cost decrease of
Lithium-ion batteries. Figure adapted from (Martínez, 2020), citing (BloombergNEF, 2019).


![Today we will explain why they [decimal and percent equivalents for common fractions] represent the same value. equivalent= alike percent=per hundred Concept](https://img.pdfslide.us/doc/110x75/56649ed15503460f94be0d2d/today-we-will-explain-why-they-decimal-and-percent-equivalents-for-common.jpg)