One Challenge in Creating and Effective Hearing Conservation
Program
OR Using Hearing Protection
What’s Wrong with Noise Reduction Ratings (NRR)
Presenter
Presentation Notes
By way of introduction, I’m Jeffrey Goldberg, President of Custom Protect Ear, Inc., a 36 year old Vancouver based maker of what we believe it the Smartest Hearing Protection in the World. I’m also a member of the Working Group 11 of the ANSI standards development body on Hearing protection, and the chairperson of CSA Z1007 sub committee working on Canada’s first Hearing Conservation Program Management standard. All of that and my drink still costs $4.50 at Starbucks. In the interest of full disclosure, I am NOT an Industrial Hygienist, a Physicist, schooled in Acoustics, or technically adept. What I am is passionate about defeating Noise Induced Hearing Loss. This presentation is designed to shine a bright light on the challenges you face defining a hearing protection program for those you’re hired to protect. I fully acknowledge hearing protection is only one small part of hearing conservation and if OSHA has its way, an even smaller part. It is however a perplexing part of piece and one that’s tough to cover in an hour. OK, rules of the game. Don’t wait until I’m finished if you don’t understand something I’ve said. Ask me. If you take issue with a position I’ve taken that’s a different matter. I’d ask you to make a note of it and wait until we’ve finished so you and I can have a thorough discussion and not bore those less interested in the topic. Throughout this presentation I’m going to refer to NIOSH – NIOSH is the National Institute of Safety and Health. It is a division of the Center for Disease Control in the United States charged with Industrial accident and illness research. We really don’t have anything like it in Canada and we rely on much of what they do in Canada.
• Determine there is a Hazard • Remove the Hazard • Keep people away from the
Hazard • Protect them from the Hazard • Keep them Safe
Presenter
Presentation Notes
Noise measurement Engineer out the noise Use Administrative Controls to manage exposure Give workers hearing protection Monitor the results to ensure success.
• Measure the Hazard • Noise Measure • Exposure measure
We can measure the noise to determine if there’s a potential problem But what we really want to know is what any one person is exposed to during their shift – for that we need to do dosimetry. Once we know that someone is exposed to, the next part of the equation is to pick a permitted exposure level. Then we can calculate how much attenuation you need to provide to achieve that exposure level.
• 85 dBA - 25% of your population will experience some hearing loss
• 82 dBA – No hearing Loss • 80 dBA - EU Standard for HCP • 75 dBA – if you want a stress reduced
workforce – target 75 under the protector.
Presenter
Presentation Notes
A word about targets At 85 dBA 25% of those you’re protecting will suffer some hearing impairment. I’ll bet some of you thought 85 dBa was safe. At 82 dBA, provided everyone gets 82 dBA everyone will be safe The Standard in the EU is 80 dBA but, unfortunately, no ones checking @ 75 dBA = Productivity = Low Stress = Healthier Work Force
Presenter
Presentation Notes
This is actually a WW I invention – early Radar
Device Number of Studies
Number of Tests
Mean RW NRR
(dB)
Labeled NRR (dB)
NRR Labeled NRR (%)
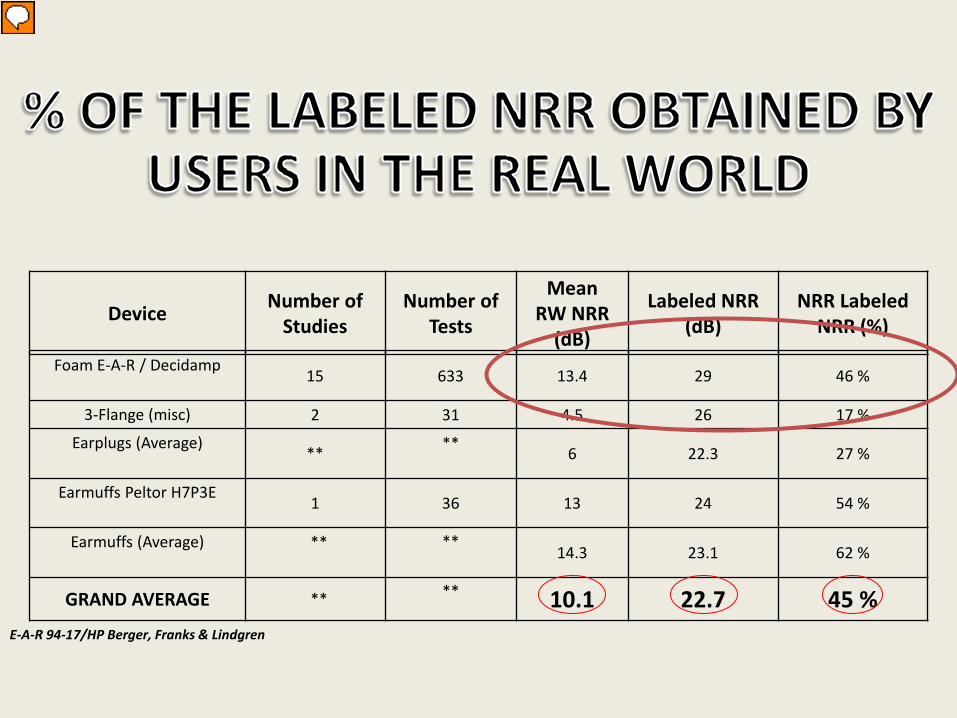
Foam E-A-R / Decidamp 15 633 13.4 29 46 %
3-Flange (misc) 2 31 4.5 26 17 %
Earplugs (Average) ** **
6 22.3 27 %
Earmuffs Peltor H7P3E 1 36 13 24 54 %
Earmuffs (Average) **
** 14.3 23.1 62 %
GRAND AVERAGE ** ** 10.1 22.7 45 % E-A-R 94-17/HP Berger, Franks & Lindgren
Presenter
Presentation Notes
In 1994, Elliott Berger (of E.A.R. now 3M), Dr. John Franks Ph.D. former the head of NIOSH’s hearing conservation section, and Pier Lindgren of Gottenberg University collated the research done the previous 20 years looking at what users really got from hearing protectors. The results were rather startling – like knowing you’re overweight comes home when you step on the scale. They clearly identified there were problems with using hearing protectors - What you see is NOT what you get. All of you have picked up a package of earplugs or grabbed an earmuff. By U.S. law those products have to be labeled as to how much hearing protection they offer (we have no similar Canadian requirement). What the number on the package reflects how much POTENTIAL hearing protection the device has. The trouble is that it’s determined in a laboratory under ideal conditions with experienced hearing protection testers. In the real world, people who use these hearing protectors get much less protection. Here is the problem: if you are in 95 dB of noise, you need a hearing protector which provides you with 15 dB of protection: 95 – 15 = 80 So you need to know how much protection you’re getting from the HPD you are using. The problem is, that’s not a simple question to answer. The chart above shows you the difference between the potential and the performance achieved on the factory floor. Quite a disparity isn’t there. If that wasn’t enough of a problem, there is one further problem…
HPD Wearer 1
HPD Wearer 2
•Both with large ear canals •Both wearing identical foam-type insert HPD’s •Both inserting the plug fully into their ear canal
TWO MALE HPD WEARERS. . .
Over 30 dB difference in attenuation provided!
Study conducted by Dr. K Michael Ph.D. Aud
Presenter
Presentation Notes
The factory floor noise protection level on the previous chart was an average. That means that some people got more, and others got less. Take a look at the chart above. Two people, fit properly with the same protector, with the same size ears, two very different results. You can’t use the numbers on the package. You can’t reduce the numbers by a set percentage … so what do you do ?? The industry practice is to de-rate the protectors to a level that ensures you are safely protected; here is how they do it: There is an organization called NIOSH (National Institute of Occupational Safety And Health). They are the recognized authority in this stuff. They recommend that in order to be safe you take the number on the label, divide that number by 2, and subtract 7 from it. This all starts with you knowing your noise exposure. Your noise exposure is not the noise level at work. Your noise exposure is how much noise you are exposed to over the hours you are at work. It includes your breaks, your lunch and your time out of the noise. If you don’t know your noise exposure, using the MAX noise level at work will keep you safe. But, recognize it’s a very conservative estimate. Once you know your noise level, subtract the de-rated protection value. The number you end up with should be 80 dB or less. If you end up with 80 – 85, you should still be OK because we have used the noise level at work, and not your noise exposure.
Insert chart of attenuation values for NRR tests
S3.19-1974 NRR Test Protocol
125 500 1000 2000 3150 4300 6000 8000rtz HERTZ
40
30
20
10
DEC
IBEL
S
Presenter
Presentation Notes
In order to understand what you can do about this, I think you should know how this problem comes about. I want to take 5 minutes to explain how an NRR is developed. I don’t mean to confuse you but I’m going to discuss the standard measuring attenuation that’s been in place since 1974 not the 3 that have come later. That’s the standard that defines how a hearing protector is labeled. It’s call ANSI S3.19-1974. Catchy huh? 10 subjects are chosen usually professional hearing protection testers. Professional? Yes, they do this over and over again for money. Each of those subjects is tested to determine their hearing threshold at 9 different frequencies; sort of like a hearing test. Yes, the chart is missing the 250 Hz frequency. Sorry. Then the experimenter places a hearing protector in each ear of the test subject. Does this sound like something you do at work? I hope not. And each subject then is tested for hearing threshold with the protector in place 3 times. The protector is removed and replaced between each test. I’ve show the possible results plotted on the graph above. At each frequency there are 30 possible points. Now comes the fun part. Click Let’s look at one of those frequencies
S3.19-1974 NRR Test Protocol
-2δ -1δ 0 +1δ +2δ 125 HERTZ
Presenter
Presentation Notes
For each frequency the experimenter takes the values and plots a curve for the test results. Click Then by taking the value for attenuation that is 2 standard deviations below the mean they arrive at a value for the attenuation for that frequency. The more variable the protector, the greater the Standard Deviation and therefore the lower the attenuation value which is as it should be. Then all eight of these values are combined based on a defined weighted formula. Yes the formula is weighted so some frequencies are given more weight than others.
Normal Bell Curve
Presenter
Presentation Notes
In order to understand the problem, lets look at the underlying methodology again. From the data points, the experimenter determines the mean attenuation level – that level where 50% of the population is above and below – not the average - and then the standard deviation is calculated from these data points such that 95% of the population rest between 2 standard deviations above and below then mean. What does this mean? It means that by design 2.3% of the population will not get the attenuation we are measuring. By design – right out of the gate. Yes there’s 2.3% at the upped end as well but they will be hearing protected, they just might suffer from the cocooning effect.
Device Number of Studies
Number of Tests
Mean RW NRR
(dB)
Labeled NRR (dB)
NRR Labeled NRR (%)
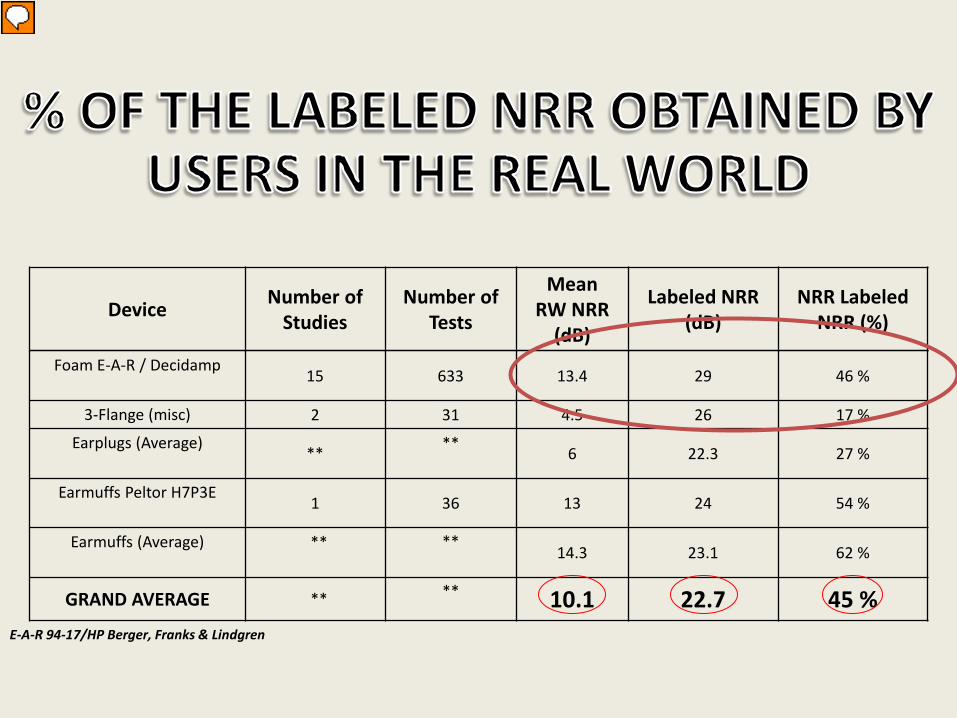
Foam E-A-R / Decidamp 15 633 13.4 29 46 %
3-Flange (misc) 2 31 4.5 26 17 %
Earplugs (Average) ** **
6 22.3 27 %
Earmuffs Peltor H7P3E 1 36 13 24 54 %
Earmuffs (Average) **
** 14.3 23.1 62 %
GRAND AVERAGE ** ** 10.1 22.7 45 % E-A-R 94-17/HP Berger, Franks & Lindgren
Presenter
Presentation Notes
But this does not explain the previous chart showing vast difference between the lab measured NRR and the shop floor measured protection levels. If only this 2.3% was the problem they differential would be much smaller than it is. Something else is going on as well.
Presenter
Presentation Notes
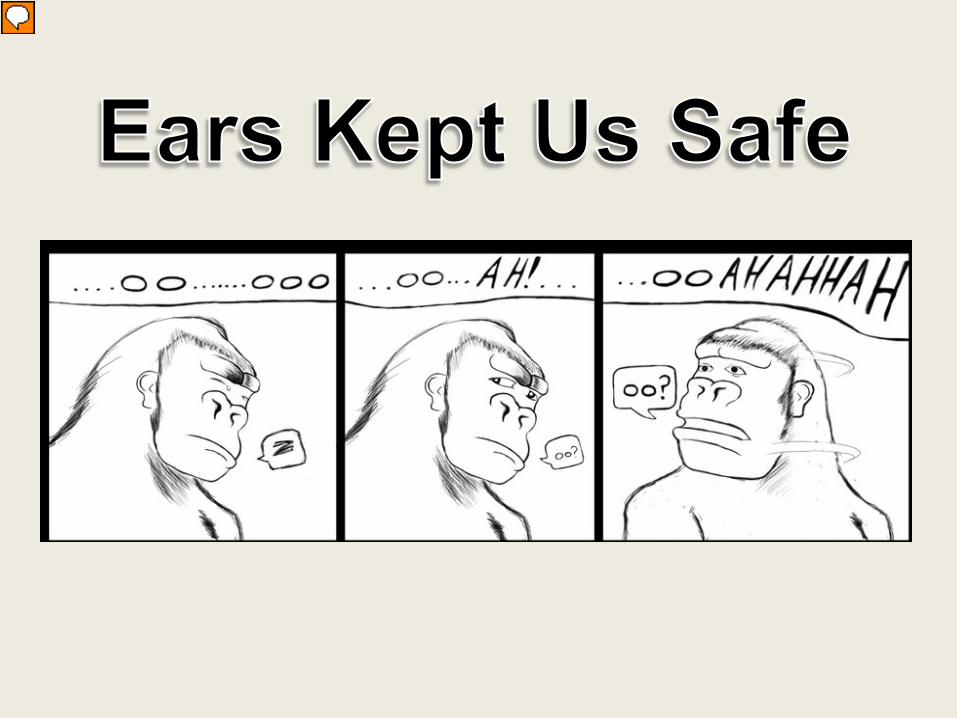
Since we came down out of the trees, we have relied on hearing for protection. Hearing could tell us what was around the corner of behind the bush. Once we heard something, we could then use our eyes to determine exactly what it was and where it was. That is why we cannot shut our hearing off.
Essence of safety Got to hear to feel safe ≠ protection
Presenter
Presentation Notes
We are fundamentally wired to be able to hear. As a sidebar, when we fit folks with our Sleepers to help them sleep, they are awakened by their alarm clock or the phone exactly the same as if they had nothing in their ears. It is the differential in the ambient noise that wakes them. Back to our problem of what is causing the difference between the Laboratory and the Real World. Perhaps one of the issues frustrating our attempt to keep earplugs in our workers ears is their need to feel safe. The second problem is our need to communicate.
Presenter
Presentation Notes
We also like to speak with each other. Not all of us but enough so that protecting a persons hearing in noise is a problem. 15 minutes of Unprotected exposure at 100 dBa will give the exposed person their daily noise dose. 5 – 3 minute conversations. And since talking to someone in noise can be a challenge, the conversation often takes longer.
• We know what level of protection/attenuation we need
• We don’t know what level of protection we’re giving any one person
• Once we give it to them they’re going to frustrate it to feel normal
• We’re measured based on our ability to protect our workers.
Presenter
Presentation Notes
So the challenge is really to know what protection each and every one of those you are trying to protect is getting. What’s really going on? It’s doubly hard because not only do you have to select the correct protector, but you also have to get them to wear it every time they are exposed to noise. It’s a real conundrum. What do you do?
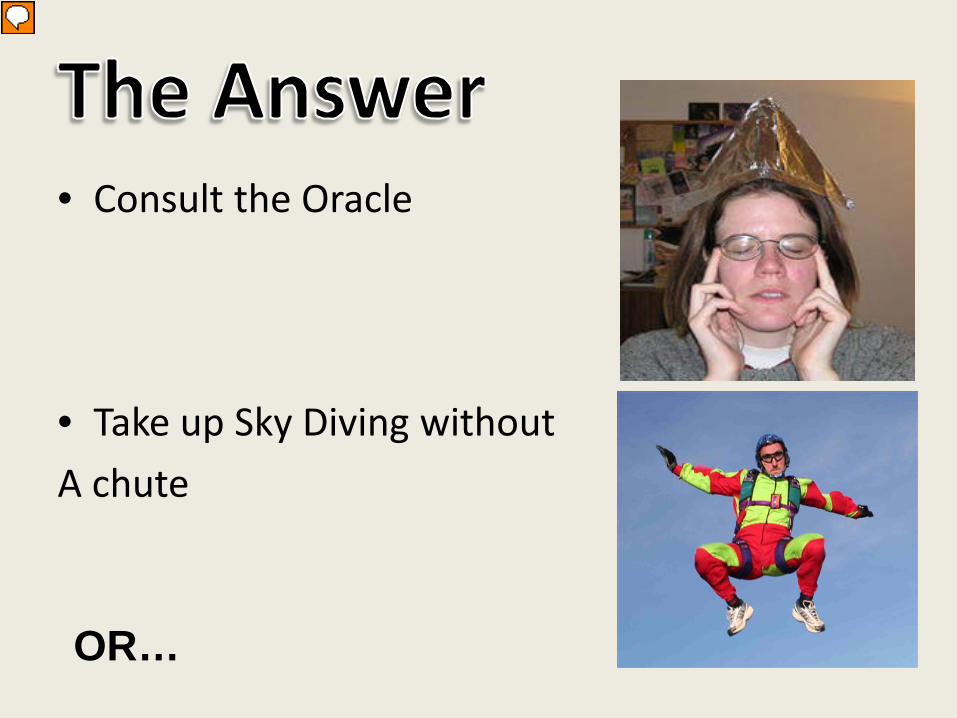
• Consult the Oracle
• Take up Sky Diving without A chute OR…
Presenter
Presentation Notes
I have some suggestions. Some a bit facetious. Others more concrete.
• De-rate the protectors • Use another Method of
Measuring Attenuation • Enable Communication
Presenter
Presentation Notes
We can reduce the expectations of our protectors . If we reduce it enough, and can still gain sufficient protection, we might encompass 99% of the population, perhaps even 100%. Alternatively we could see if there wasn’t another measure of attenuation that was more “Real World” Lastly, about that talking to each other thing, let’s give them something they can hear each other speak through so they don’t need to remove them – if that’s possible.
Presenter
Presentation Notes
OK, first things first. There are actually several test paradigms in use today. I’d like to focus on the one that was developed subsequent to learning what was summarized by Elliot Berger, Dr. John Franks, and Per Lindgren in their 1994 study. Remember I showed you this?
Device Number of Studies
Number of Tests
Mean RW NRR
(dB)
Labeled NRR (dB)
NRR Labeled NRR (%)
Foam E-A-R / Decidamp 15 633 13.4 29 46 %
3-Flange (misc) 2 31 4.5 26 17 %
Earplugs (Average) ** **
6 22.3 27 %
Earmuffs Peltor H7P3E 1 36 13 24 54 %
Earmuffs (Average) **
** 14.3 23.1 62 %
GRAND AVERAGE ** ** 10.1 22.7 45 % E-A-R 94-17/HP Berger, Franks & Lindgren
Presenter
Presentation Notes
Turns out that based on this information a second method, called Method “B”, was developed for measuring hearing protector attenuation designed to more accurately replicate the real world..
Presenter
Presentation Notes
The differences are: The subject fits the protector not the experimenter. This gave rise to the title of the protocol – Subject Fit or Naive subject Secondly the panel is 20 subjects instead of 10 so we are looking at 60 tests rather than 30. The panel for earmuffs stayed the same at 10 persons.
• Method A measures the Potential of a Hearing Protector • Method B measures what a User achieves when wearing the a Hearing Protector
Presenter
Presentation Notes
click Whereas the EPA wanted a measure of the hearing protectors potential click The hearing conservation community wanted a measure of what it would really achieve in the “real world”
Presenter
Presentation Notes
Here is the same data Berger, Franks, and Lindgren compiled with the test results from a Method “A” – standard ANSI 3.19-1974 overlaid AND with the new ANSI 12.6 Method “B” results as well.
Roughly a 15% reduction in attenuation
Presenter
Presentation Notes
To give you any idea of what happens to a standard NRR when you apply the naive subject protocol, hear are the comparisons for our dB Blockers. I hasten to point out that I have only used these protectors because they are easily attainable for me and because very few of the N.A. manufacturers publish their Method B numbers (because they are lower). This is NOT a sales pitch. By the way, Brazil and Australia both use the Method B protocol and most of these same N.A. makers sell there. They have Method B attenuations for those markets but since no one requires them in North America, they keep them private. We can’t even find them on the internet. By the way, you people are partially responsible for this behavior by we manufacturers. You rewarded protectors with higher attenuation rating with your business encouraging us to stay focused on the numbers game. You’re not solely responsible as we taught you the game.
Presenter
Presentation Notes
OK, so now there is one way you can choose a hearing protector for our process and get closer to what is going on in the Real World. Chose a protector who’s Method B rating gives your user the right amount of protection. By the way, in the U.S. NIOSH recommends and OSHA accepts the Method “B” attenuation be used to estimate Real World attenuation. Otherwise you have to reduce your expectations for your hearing protectors as part of your program design. Let me show you what NIOSH recommends.
De-Rating formula for NRR
(NRRA ÷ 2) – 7 dB • NRRA = label on the package • ÷ 2 = the adjustment for the real world effect • - 7 = conversion of NRR (measured on the A
Scale) to the same scale as noise is measured (i.e. the C Scale).
Presenter
Presentation Notes
In order to provide “temporary relief” from the estimates of attenuation garnered from the NRR, NIOSH developed a formula for reducing or de-rating an NRR to make it more “real world”. We should place these development in historical context. First, realization that Lab is not equal to real world. Second the development of De-Rating Third the ANSI Method B attenuation measure protocol. Want a bit of industry “inside information”? In adopting this formula, OSHA made an error and opted for a version of the formula that subtracted the 7 dB from the attenuation and then divided by 2. The problem was that by doing this, OSHA was in fact subtracting 3.5 dB not 7 dB Where does the 7 dB adjustment comes from? There are 2 scales used to measure sound. The A scale is predicated on the way the ear hears normal sounds at moderate listening levels. The C scale is predicated on the way the ear hears louder sounds. Usually noise is measured on the C scale while attenuation is calculated based on the A scale. The difference between the 2 scales is about 7 dB.
Therefore: 1. 3M (E.A.R.) Classic – NRR 29 = 7.5 dB 2. Howard Leight MAX – NRR 33 = 9.5 dB 3. Bilsom Lighting Earmuff – NRR 31 = 17.4 dB 4. Peltor Optime Earmuff – NRR 30 = 22.5 dB
Presenter
Presentation Notes
So let’s see what de-rating does to some commonly used earplugs. De-rating seems a bit harsh. Especially considering that what we are talking about is a relatively small part of the population. That’s true. In fact the industry in general doesn’t like de-rating because it is wrong more times than it is right…it is just safer. Are there other alternatives?
Field Attenuation Estimating Systems
Presenter
Presentation Notes
You could get your associates to fit their hearing protection and then measure the attenuation. Currently there are 7 systems currently available for measuring the attenuation of a hearing protector after the wearer fit it. Regrettably, all of them measure and report attenuation slightly differently. We are currently working on an ANSI standard to bring them in to level of comparability. Here are 3 of them. Upper right is the Howard Leight VeriPRO system. Upper left is the 3M Ear-Fit system. And the lower photo is the grand daddy of them all, the Michael & Associates Fit Check system. So the question is, does measuring the attenuation of a hearing protector after the wearer has fit it aid with the results for the hearing conservation program? To get the answer we turn to the company that has been using Fit Testing as a training tool for hearing protection wearers from over 10 years. ALCOA, a leader in worker safety and illness prevention has been fit testing since the early 90s and in fact aided Dr. Michael in developing Fit Check. The person who has studied ALCOA’s results more than anyone else is Dr. Peter Rabinowitz of the Yale School of Occupational Medicine and a recent recipient of the National Hearing Conservation Associations, Conservationist of the Year Award. The thinking is that by showing wearers how to get more attenuation from their protectors, they will consciously fit them better each time they use them. The Michael system has been around the longest and has by verified by numerous tests by various institutes as replicating a R.E.A.T. result – that’s stands for Real Ear At Threshold which is the method captured in the ANSI standards and thought to be the “gold standard” for hearing protection measurement.
“I have been unable to document any improvement in hearing conservation
program outcomes as a result of Fit Testing.”
Presenter
Presentation Notes
Regrettably, Dr. Peter Rabinowitz cannot find a linkage between fit testing and better hearing conservation program outcomes. And it is not for a lack of trying. Dr. Rabinowitz has conducted 2 studies for Alcoa looking at this very issue and he is the foremost researcher in the field.
• Possibly the lure of communication is too strong
• Or our need to feel safe being able to hear what threatens us overrides intellect
Presenter
Presentation Notes
Even if you measure the attenuation an associate has at the beginning of their shift, that does not mean they will leave the protector in place all shift. It is possible that our need to communicate with each other is so strong that we are willing to “risk it” rather than remain “incommunicado”. As well, we see many individuals who have worn hearing protection for years and never correctly. I’m certain we have all seen
Presenter
Presentation Notes
Wearing hearing protection wrong can’t be a genetic characteristic of humans. Something is causing us to wear them as though we are: Waiting for a message from the mother ship Protecting one ear more than the other This is just wrong I’ve honestly never seen anyone wear hearing protection in the mouth. But it doesn’t have to be that way. There is hearing protection that allows associates to communicate.
Presenter
Presentation Notes
Here are several hearing protection products that allow interpersonal communication to pass through the protector while keeping the protection in place. Two of them are earplugs style and the rest are muffs. These products will allow your workers to communicate with each other and with those on radios because most of these products have models that can integrate radio communication with the protectors.
Take Aways
• Ideally, hearing protection should go in/on when they get to work and come off when they go home.
• The hardest to protect are those in moderate noise – 85 to 93 dB. Education about the Exchange Rate is a must.
• Supervisors MUST set the example. Hearing Conservation is top down.
Presenter
Presentation Notes
OK let’s wrap this up. You can do something to make the hearing protection part of your hearing conservation program work. It is possible. I know because we’ve seen it done. Create a culture of hearing protection from the top of the organization on down. Only then will everyone take it seriously. People respect what gets inspected. Pay special attention to those in moderate noise or intermittent noise. When you don’t create the noise you are exposed to, you have no idea how long it will last. The presumption will always be “that will be over in a minute”. Low to moderate noise is much more of a problem than loud noise. Teach the exchange rate. Workers need to know the effects of unprotected exposures. Many have no idea how little exposure it takes to get your daily noise dose.
Presenter
Presentation Notes
Make certain they clearly know where the noise hazards are. I know it is regulation to sign but get creative. Start to sign as they approach…100 feet to hearing protection zone. Please suit up.
• Use Method “B” attenuations for planning your protection level.
• If you can’t, de-rate your protection to be safe.
Presenter
Presentation Notes
Use method “B” to select protectors that will not over expose you workers. Above all be conservative.
Presenter
Presentation Notes
Now’s the time for those discussions.
• /ANSI 12.68-2008 2 new attenuation ratings
• NRR20 which is the lowest number 80% of your population should achieve
• NRR80 which 20% of your wearers might achieve
• Now there’s a range for a given hearing protector
• Problems????
• Method “A” attenuation measurement modified slightly in the current standard.
• For a given protector the new NRR20 will be higher than the previous NRR.
• What does this tell us about those in the margins?
• There’s no certainty that this rule will be promulgated
Presenter
Presentation Notes
Well we’re still in the laboratory. Do you think this is because most of the people who are on the WG11 working group are scientists and researchers working from labs? We were trying to get away from de-rating but this will not let us. With our previous standard we addressed 95% of the population. Now we’re targeting 80%. The EPA undertook to have this rule out by January 2010 (followed by May 2010, the fall 2010, May 2011, and this fall). There seems to be a problem.
• NRR combines the measurements from 8 frequencies (S3.19-1974) into one number
• Octave band measures the attenuation at each frequency
• Match the Attenuation to the Sound Field
dB Blocker Convertible Venter – Yellow Filter Frequency in Hertz 125 250 500 1000 2000 3150 4300 6000 8000 Attenuation Method A 33.4 34.0 33.4 31.5 35.2 41.1 39.3 44.9 45.0 Attenuation Method B 30.4 31.7 31.5 29.8 33.8 - 39.6 - 41.8
NRRA Method A – 26 dB NRRSF Method B – 26.1 dB
Presenter
Presentation Notes
What do you do if you only have what is on the package? i.e. A Method “A” NRR? One alternative is to use the entire table of tested frequencies and compare it to the sound scape in your facility.