Embed Size (px)
Citation preview
Perspectives on Psychological Science2015, Vol. 10(3) 282 –306© The Author(s) 2015Reprints and permissions: sagepub.com/journalsPermissions.navDOI: 10.1177/1745691615577701pps.sagepub.com
Early in the 20th century, the first widely used standard-ized psychometric intelligence measures were devel-oped (Binet & Simon, 1905, 1908), and the IQ metric as an estimate of cognitive abilities was introduced (Stern, 1912; Terman, 1921). Although IQ tests were originally intended as a means to identify children in need of spe-cial education (Binet & Simon, 1905), further uses for IQ tests were rapidly discovered. Among other uses, IQ tests quickly became common in academic contexts (e.g., as a decision criterion for college acceptance), to identify leadership personalities for the military, or for personnel selection (e.g., Brooks, 1922). Nowadays, even eligibility for subsidized special education place-ments of children (Ceci & Kanaya, 2010; Kanaya & Ceci, 2007) or potential sentencing to capital punishment in court (Flynn, 1999, 2009a) may in some countries depend on IQ test results. Moreover, IQ has been shown to cor-relate not only with various measures of performance and job success, but also with phenomena seemingly unrelated to mental capacity, for example, health and longevity (Deary, 2009).
From early on, researchers were concerned about the meaning of expected and actual changes in test scores within the population (Cattell, 1937). Through the middle of the century, rising scores were noticed but were mainly attributed to statistical artifacts or sampling error instead of being interpreted as genuine changes in population test scores (Merrill, 1938; Tuddenham, 1948). Schaie and Strother (1968) were the first researchers to interpret IQ score changes as cohort effects. However, the first system-atic description of national and international IQ change patterns did not appear until the 1980s (Flynn, 1984, 1987). These studies invariably showed increases over time in test performance on IQ tests and engaged the attention of many researchers. Since then, generational IQ test score changes within the general population have
577701 PPSXXX10.1177/1745691615577701Pietschnig, VoracekMeta-Analysis of the Flynn Effectresearch-article2015
Corresponding Author:Jakob Pietschnig is now at the Department of Applied Psychology: Health, Development, Enhancement and Intervention, University of Vienna, Liebiggasse 5, A-1010 Vienna, AustriaE-mail: [email protected]
One Century of Global IQ Gains: A Formal Meta-Analysis of the Flynn Effect (1909–2013)
Jakob Pietschnig1,2 and Martin Voracek2,3
1School of Science and Technology, Middlesex University Dubai, United Arab Emirates; 2Department of Basic Psychological Research and Research Methods, Faculty of Psychology, University of Vienna, Austria; and 3Georg Elias Müller Department of Psychology, Georg August University of Göttingen, Germany
AbstractThe Flynn effect (rising intelligence test performance in the general population over time and generations) varies enigmatically across countries and intelligence domains; its substantive meaning and causes remain elusive. This first formal meta-analysis on the topic revealed worldwide IQ gains across more than one century (1909–2013), based on 271 independent samples, totaling almost 4 million participants, from 31 countries. Key findings include that IQ gains vary according to domain (estimated 0.41, 0.30, 0.28, and 0.21 IQ points annually for fluid, spatial, full-scale, and crystallized IQ test performance, respectively), are stronger for adults than children, and have decreased in more recent decades. Altogether, these findings narrow down proposed theories and candidate factors presumably accounting for the Flynn effect. Factors associated with life history speed seem mainly responsible for the Flynn effect’s general trajectory, whereas favorable social multiplier effects and effects related to economic prosperity appear to be responsible for observed differences of the Flynn effect across intelligence domains.
KeywordsFlynn effect, meta-analysis, generational IQ gains, intelligence
at University of Minnesota Libraries on June 14, 2015pps.sagepub.comDownloaded from
Meta-Analysis of the Flynn Effect 283
become well known as the Flynn effect, an expression introduced by Herrnstein and Murray in their widely disseminated book The Bell Curve (1996, pp. 307–309). Subsequently, the Flynn effect has been recognized as a phenomenon of considerable importance, having been labeled “one of the most striking phenomena in this field“ and listed under the top research agenda for intel-ligence research by the Task Force for Intelligence of the American Psychological Association (Neisser et al., 1996, p. 96).
Variety of Findings and Explanations
In the present article, we provide the first formal compre-hensive meta-analysis of the Flynn effect, and we use our results to assess the proposed theories of it. Past research on the Flynn effect yielded quite erratic patterns of these intelligence test score changes in different countries. In general, these changes seem to be positive and rather strong in most, but not all, of the investigated countries. The strongest gains were observed in Austria, France, Germany, Israel, Japan, Kenya, the Netherlands, and Spain, whereas gains in Australia, Brazil, Ireland, New Zealand, the United Kingdom, and the United States of America were weaker, and in Norway and Sweden gains seemed to have ceased altogether in recent years (Colom, Flores-Mendoza, & Abad, 2007; Colom, Lluis-Font, & Andres-Pueyo, 2005; Daley, Whaley, Sigman, Espinosa, & Neumann, 2003; Flynn, 1987, 2009b). In addition, more recent data from Denmark and Finland even suggest a reversal of gains in the past couple of years (Dutton & Lynn, 2013; Teasdale & Owen, 2005). Younger ages of top-ranked chess players, better tournament performance of younger bridge players, and increasing numbers of scientific journal articles and patents have been cited as real-world evidence for rising population intelligence (Howard, 1999, 2001, 2005).
Different intelligence domains display gains of differ-ent strengths (for clarity, we provide definitions of these domains and several further central concepts in Table 1). Stronger gains have usually been shown for fluid IQ than for crystallized IQ, especially so for Anglo-American countries ( Jensen, 1998, pp. 319–320; Lynn, 2009a; Nisbett et al., 2012). However, recent evidence from German-speaking countries on measures of crystallized IQ showed gains of about the same size as for fluid IQ in Anglo-American countries (Pietschnig, Voracek, & Formann, 2010). Accordingly, the role of intelligence domain with regard to these gains still remains unclear.
Another open question is whether these gains are expressions of increases in general cognitive ability levels of individuals (commonly referred to as psychometric g) or rather whether these gains reflect increases in specific ability domains. Gains have been reported to be related
to psychometric g (Colom, Juan-Espinosa, & Garcia, 2001), whereas in other cases no such associations were observed (Te Nijenhuis, 2013; Woodley & Meisenberg, 2013). In contrast, negative associations between psycho-metric g and IQ gains have been reported in another two accounts (Must, Must, & Raudik, 2003; Rushton, 1999). Further investigations revealed age as a moderator vari-able, indicating differential strength of gains for either children or adults, depending on specific subtests of intelligence test batteries (Flynn, 2010).
Irrespective of the evidence for influences of modera-tor variables, the strength of gains is usually reported in the literature to amount to 3 IQ points per decade, although this figure has been established on the basis of American data only and despite various indications for country-specific strengths of gains over different periods (Flynn, 2009b; Williams, 2013; see Figure 1 for the trajec-tories of gains in the present study). A number of studies addressed the evidence for differential gains, noting larger gains between the world wars (e.g., Lynn, 2009a, 2009b) and decreasing gains since the 1980s (e.g., Flynn, 2007; Storfer, 1990, p. 89). However, a comprehensive account of time trends in IQ gains is as of now still unavailable.
The suspected causes of generational IQ gains are manifold, and theories aiming to explain the Flynn effect differ considerably. Environmental explanations focus on the effects of education, family size (which may be seen as a function of fertility), technology, and changes in test-taking behaviors. Other proposed explanations relate environmental to biological causes, including effects of social multipliers (i.e., societal IQ increases that may act as IQ-increasing factors in their own right) or health-related effects, such as nutrition and pathogen stress. We will provide a detailed discussion of these theories of causes of IQ gains.
Scope of the Present Meta-Analysis
Here, we provide the first formal meta-analysis of the available literature of generational IQ test score changes. We report IQ test score changes as average change in IQ points per year and assess a set of moderator variables that are necessary to enable an appraisal of the different proposed explanations for the Flynn effect.
Using this approach, we can examine the progress and strength of the Flynn effect since the introduction of psy-chometric intelligence testing in the early 20th century and moderating influences of age, economic growth, sample health status, and sex. In addition, we consider the influence of test type (high, medium, and low g-loaded tests, hereafter referred to as g-ness). We assumed that crystallized IQ measures reflect the highest g-ness, full-scale IQ a medium g-ness, and fluid IQ the lowest g-ness (see Johnson, Bouchard, Krueger, McGue,
at University of Minnesota Libraries on June 14, 2015pps.sagepub.comDownloaded from
284 Pietschnig, Voracek
& Gottesman, 2004), thus allowing the examination of associations between psychometric g and IQ gains. IQ gain trajectories for different continents and the influence of fertility as a proxy for average family size were exam-ined in supplemental analyses.
In the Appendix, we describe our literature search and inclusion criteria. In all, 219 studies met the inclusion cri-teria, yielding 271 independent samples comprising 3,987,892 participants covering a time span of 105 years (1909–2013). The earliest included evidence for test score changes originated from the restandardization of the Stanford-Binet Scales (period 1909–1932; Merrill, 1938). The mean age of samples was 17.5 years (range of mean age = 0.5–74.3 years), comprising 192 children and adoles-cent samples (defined as mean participant age lower than 17 years) and 79 adult samples. Although mean sample age varied widely, 90% of samples were younger than 38 years at the time of the testing. In terms of sample health status, 186 samples comprised healthy participants, 83 comprised patients, and two were mixed samples. Patient samples comprised individuals with various conditions
that are likely to affect cognitive performance (e.g., learn-ing disabilities, psychiatric disorders), thus suggesting that such samples would be expected to score within the lower tail of the intelligence test performance distribution.
Generational IQ test performance changes were reported for 31 distinct countries located on six conti-nents: Africa (Kenya, South Africa, Sudan), Asia (China, Israel, Japan, Saudi Arabia, South Korea), Europe (Austria, Belgium, Bulgaria, Denmark, Estonia, Finland, France, Germany, Ireland, Netherlands, Norway, Spain, Sweden, Switzerland, Turkey, United Kingdom), North America (Canada, Dominica, United States), South America (Argentina, Brazil), and Oceania (Australia, New Zealand). In two studies, changes were reported for participants from more than one country but on the same continent (Pietschnig et al., 2010; Uttl & Van Alstine, 2003). One study provided changes on Raven’s Progressive Matrices for participants from 45 different countries (Brouwers, Van de Vijver, & Van Hemert, 2009). Descriptive charac-teristics of the included samples are provided in Table S1 in the Supplemental Material available online.
Table 1. Central Concepts
Concept Description
IQ A well-known measurement metric of performance in cognitive tests. By consensus, average population IQ test performance has been defined to be 100, with a standard deviation of 15 points. Because IQ points are not directly observable, individual cognitive tests need to be initially standardized to allow a transformation from raw test scores into IQ scores (or another metric if desired). Thus, the average test raw score of a large and (ideally) population-representative standardization sample on any given test is assumed to correspond to 100 IQ points, whereas the standard deviation corresponds to 15 IQ points. This means that the IQ of a single individual or the average IQ of a sample of individuals reflects the test performance in comparison to the standardization sample. Consequently, generational IQ test score changes are a result of changes in population performance compared with the standardization sample.
Full-scale IQ Test/IQ score derived from an IQ test battery consisting of several subtests (e.g., Wechsler Adult Intelligence Scale). Thus, full-scale IQ can be understood as an average test score of a variety of subtests that assess several different intelligence domains. In many well-known IQ test batteries, full-scale IQ scores are calculated as averages of crystallized and fluid IQ scores.
Crystallized IQ Test/IQ score derived from an intelligence test (or several subtests) that consists of knowledge-based questions that cannot be solved by reasoning (e.g., naming the capital of a certain country). Verbal IQ tests typically tap this domain (e.g., vocabulary tests).
Fluid IQ Test/IQ score derived from an intelligence test (or several subtests) that consists of reasoning-based tasks that can be solved with (virtually) no prior knowledge (e.g., providing the next number in a series such as 2, 4, 6, 8, . . . ). Performance IQ tests typically tap this domain (e.g., Raven’s Progressive Matrices).
Spatial IQ Test/IQ score derived from an intelligence test that consists of tasks that require mental rotation of objects in order to solve the items (e.g., deciding whether a rotated view of a cube is identical with a stimulus cube as, for instance, in cube rotation tests).
Psychometric g This term means the general cognitive ability of individuals. The central idea of this concept relies on the well-known observation that in general test takers’ results on different cognitive tests that tap specific abilities are positively intercorrelated. This positive manifold of IQ test performance is commonly seen as a manifestation of psychometric g.
g-ness Different IQ domains have been shown to be more or less related to psychometric g. This means that some subtests are more strongly related to g than others. In the present article, we use the expression g-ness to indicate whether an intelligence domain is more or less related to psychometric g. Presently, we categorized IQ domains according to previous research (Johnson, Bouchard, Krueger, McGue, & Gottesman, 2004) into either possessing high (crystallized IQ), medium (full-scale IQ), or low g-ness (fluid IQ).
at University of Minnesota Libraries on June 14, 2015pps.sagepub.comDownloaded from
Meta-Analysis of the Flynn Effect 285
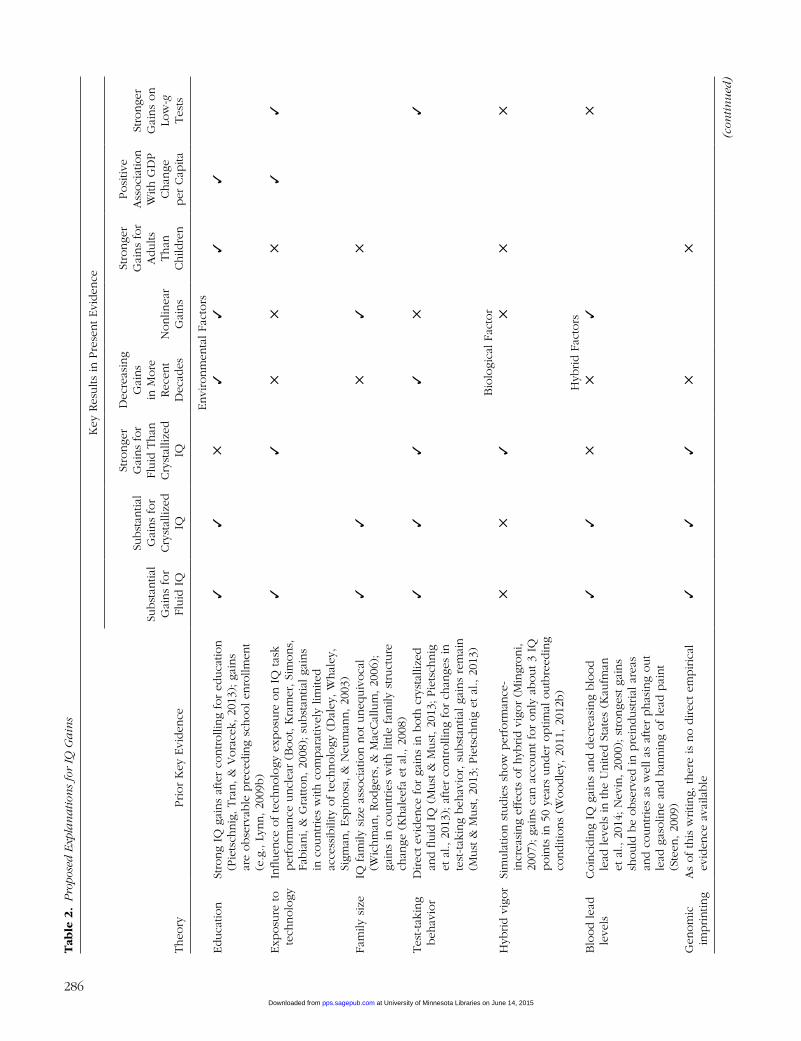
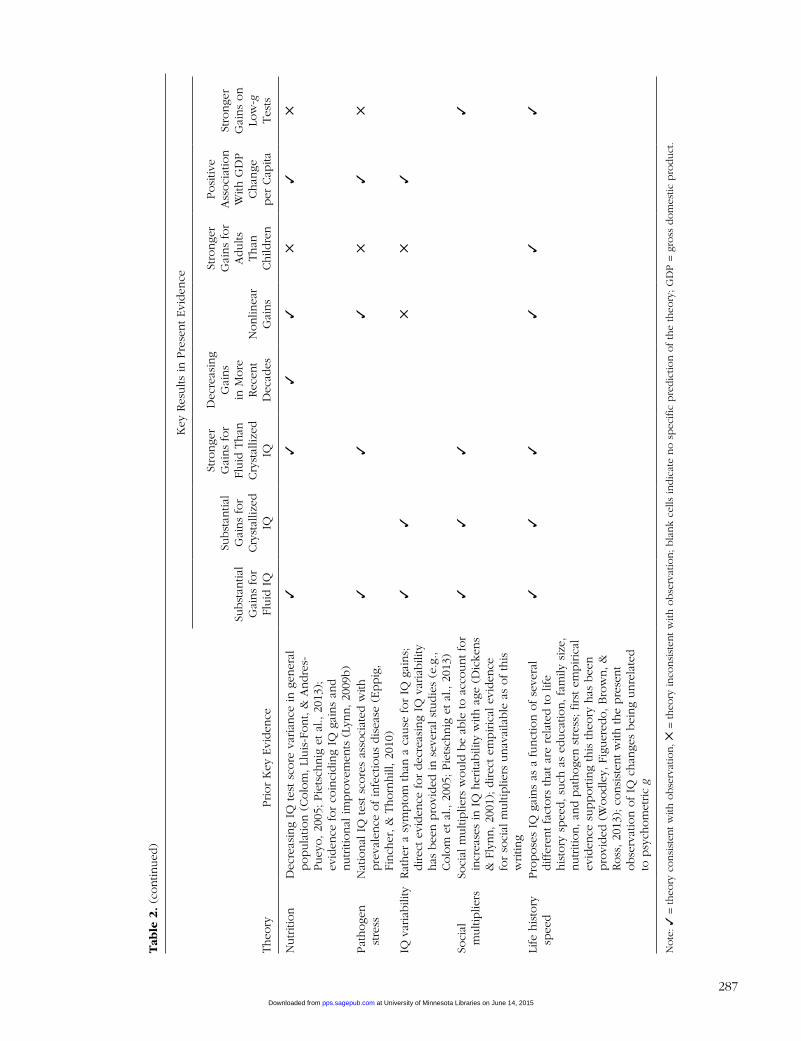
Summary of Key Findings
Our analyses reveal eight key results that we believe are central for an appraisal of the specific proposed explanations for the Flynn effect. These key results are summarized across the top of Table 2 and detailed below.
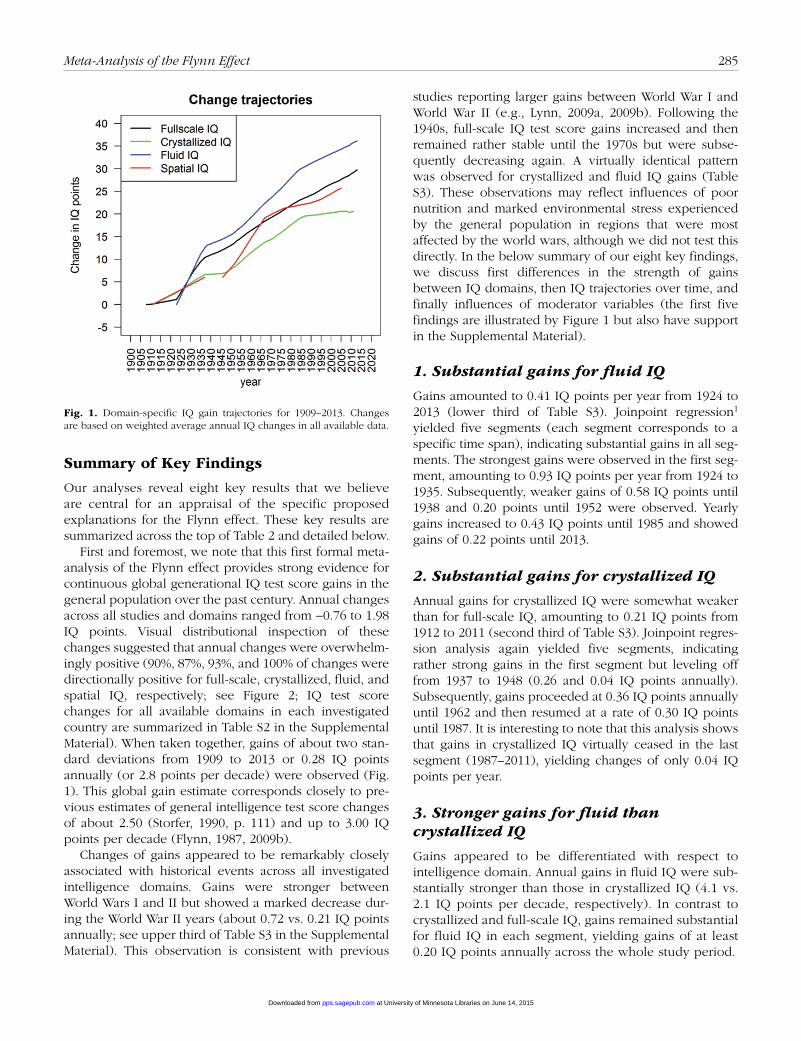
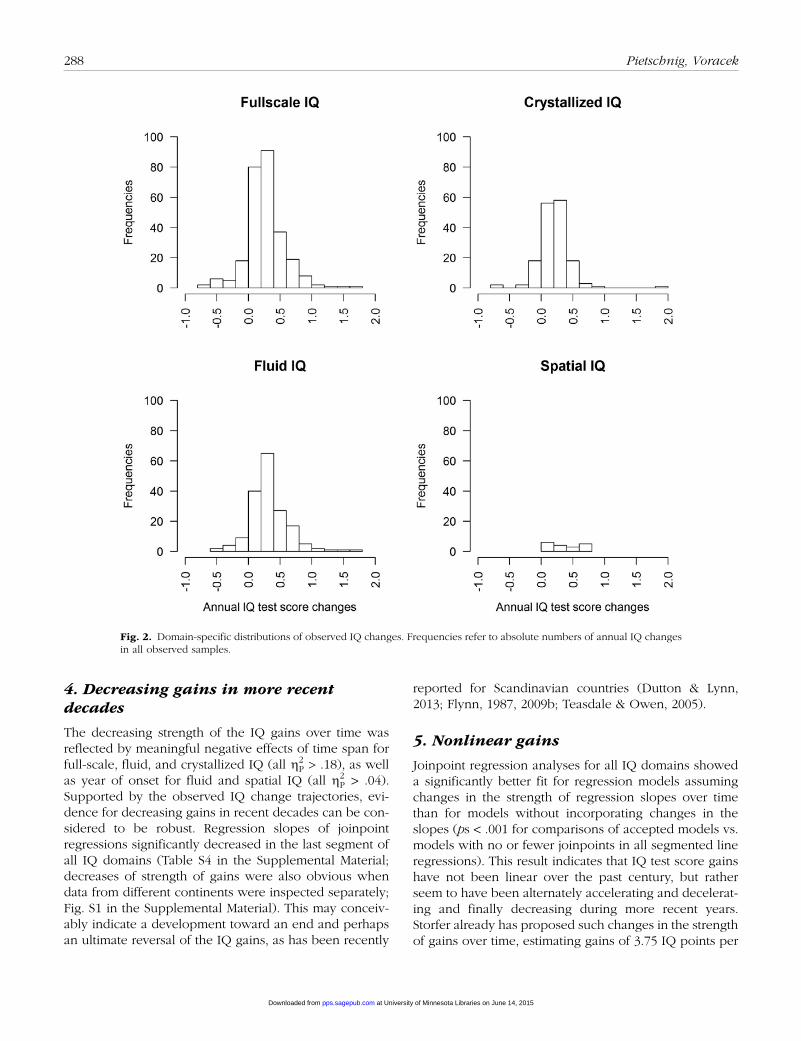
First and foremost, we note that this first formal meta-analysis of the Flynn effect provides strong evidence for continuous global generational IQ test score gains in the general population over the past century. Annual changes across all studies and domains ranged from −0.76 to 1.98 IQ points. Visual distributional inspection of these changes suggested that annual changes were overwhelm-ingly positive (90%, 87%, 93%, and 100% of changes were directionally positive for full-scale, crystallized, fluid, and spatial IQ, respectively; see Figure 2; IQ test score changes for all available domains in each investigated country are summarized in Table S2 in the Supplemental Material). When taken together, gains of about two stan-dard deviations from 1909 to 2013 or 0.28 IQ points annually (or 2.8 points per decade) were observed (Fig. 1). This global gain estimate corresponds closely to pre-vious estimates of general intelligence test score changes of about 2.50 (Storfer, 1990, p. 111) and up to 3.00 IQ points per decade (Flynn, 1987, 2009b).
Changes of gains appeared to be remarkably closely associated with historical events across all investigated intelligence domains. Gains were stronger between World Wars I and II but showed a marked decrease dur-ing the World War II years (about 0.72 vs. 0.21 IQ points annually; see upper third of Table S3 in the Supplemental Material). This observation is consistent with previous
studies reporting larger gains between World War I and World War II (e.g., Lynn, 2009a, 2009b). Following the 1940s, full-scale IQ test score gains increased and then remained rather stable until the 1970s but were subse-quently decreasing again. A virtually identical pattern was observed for crystallized and fluid IQ gains (Table S3). These observations may reflect influences of poor nutrition and marked environmental stress experienced by the general population in regions that were most affected by the world wars, although we did not test this directly. In the below summary of our eight key findings, we discuss first differences in the strength of gains between IQ domains, then IQ trajectories over time, and finally influences of moderator variables (the first five findings are illustrated by Figure 1 but also have support in the Supplemental Material).
1. Substantial gains for fluid IQ
Gains amounted to 0.41 IQ points per year from 1924 to 2013 (lower third of Table S3). Joinpoint regression1 yielded five segments (each segment corresponds to a specific time span), indicating substantial gains in all seg-ments. The strongest gains were observed in the first seg-ment, amounting to 0.93 IQ points per year from 1924 to 1935. Subsequently, weaker gains of 0.58 IQ points until 1938 and 0.20 points until 1952 were observed. Yearly gains increased to 0.43 IQ points until 1985 and showed gains of 0.22 points until 2013.
2. Substantial gains for crystallized IQ
Annual gains for crystallized IQ were somewhat weaker than for full-scale IQ, amounting to 0.21 IQ points from 1912 to 2011 (second third of Table S3). Joinpoint regres-sion analysis again yielded five segments, indicating rather strong gains in the first segment but leveling off from 1937 to 1948 (0.26 and 0.04 IQ points annually). Subsequently, gains proceeded at 0.36 IQ points annually until 1962 and then resumed at a rate of 0.30 IQ points until 1987. It is interesting to note that this analysis shows that gains in crystallized IQ virtually ceased in the last segment (1987–2011), yielding changes of only 0.04 IQ points per year.
3. Stronger gains for fluid than crystallized IQ
Gains appeared to be differentiated with respect to intelligence domain. Annual gains in fluid IQ were sub-stantially stronger than those in crystallized IQ (4.1 vs. 2.1 IQ points per decade, respectively). In contrast to crystallized and full-scale IQ, gains remained substantial for fluid IQ in each segment, yielding gains of at least 0.20 IQ points annually across the whole study period.
Fig. 1. Domain-specific IQ gain trajectories for 1909–2013. Changes are based on weighted average annual IQ changes in all available data.
at University of Minnesota Libraries on June 14, 2015pps.sagepub.comDownloaded from
286
Tab
le 2
. P
ropo
sed
Exp
lan
ati
ons
for
IQ G
ain
s
Key
Res
ults
in P
rese
nt Evi
den
ce
Theo
ryPrior
Key
Evi
den
ce
Subst
antia
l G
ains
for
Fluid
IQ
Subst
antia
l G
ains
for
Cry
stal
lized
IQ
Stro
nge
r G
ains
for
Fluid
Than
Cry
stal
lized
IQ
Dec
reas
ing
Gai
ns
in M
ore
Rec
ent
Dec
ades
Nonlin
ear
Gai
ns
Stro
nge
r G
ains
for
Adults
Than
Child
ren
Posi
tive
Ass
oci
atio
n
With
GD
P
Chan
ge
per
Cap
ita
Stro
nge
r G
ains
on
Low
-g
Tes
ts
Envi
ronm
enta
l Fa
ctors
Educa
tion
Stro
ng
IQ g
ains
afte
r co
ntrolli
ng
for
educa
tion
(Pie
tsch
nig
, Tra
n, &
Vora
cek,
201
3); ga
ins
are
obse
rvab
le p
rece
din
g sc
hool en
rollm
ent
(e.g
., Ly
nn, 20
09b)
✓✓
✕✓
✓✓
✓
Exp
osu
re to
tech
nolo
gyIn
fluen
ce o
f te
chnolo
gy e
xposu
re o
n I
Q tas
k per
form
ance
uncl
ear
(Boot,
Kra
mer
, Si
mons,
Fa
bia
ni,
& G
ratton, 20
08); s
ubst
antia
l ga
ins
in c
ountrie
s w
ith c
om
par
ativ
ely
limite
d
acce
ssib
ility
of te
chnolo
gy (
Dal
ey, W
hal
ey,
Sigm
an, Esp
inosa
, &
Neu
man
n, 20
03)
✓✓
✕✕
✕✓
✓
Fam
ily s
ize
IQ fam
ily s
ize
asso
ciat
ion n
ot uneq
uiv
oca
l (W
ichm
an, Rodge
rs, &
Mac
Cal
lum
, 20
06);
gain
s in
countrie
s w
ith litt
le fam
ily s
truct
ure
ch
ange
(K
hal
eefa
et al
., 20
08)
✓✓
✕✓
✕
Tes
t-ta
king
beh
avio
rD
irec
t ev
iden
ce for
gain
s in
both
cry
stal
lized
an
d flu
id I
Q (
Must
& M
ust
, 20
13; Pie
tsch
nig
et
al.,
201
3); af
ter
controlli
ng
for
chan
ges
in
test
-tak
ing
beh
avio
r, s
ubst
antia
l ga
ins
rem
ain
(Must
& M
ust
, 20
13; Pie
tsch
nig
et al
., 20
13)
✓✓
✓✓
✕✓
B
iolo
gica
l Fa
ctor
Hyb
rid v
igor
Sim
ula
tion s
tudie
s sh
ow
per
form
ance
-in
crea
sing
effe
cts
of hyb
rid v
igor
(Min
groni,
2007
); g
ains
can a
ccount fo
r only
about 3
IQ
poin
ts in 5
0 ye
ars
under
optim
al o
utb
reed
ing
conditi
ons
(Woodle
y, 2
011,
201
2b)
✕✕
✓✕
✕✕
H
ybrid F
acto
rsB
lood lea
d
leve
lsCoin
cidin
g IQ
gai
ns
and d
ecre
asin
g blo
od
lead
lev
els
in the
Unite
d S
tate
s (K
aufm
an
et a
l., 2
014;
Nev
in, 20
00); s
tronge
st g
ains
should
be
obse
rved
in p
rein
dust
rial
are
as
and c
ountrie
s as
wel
l as
after
phas
ing
out
lead
gas
olin
e an
d b
annin
g of le
ad p
aint
(Ste
en, 20
09)
✓✓
✕✕
✓✕
Gen
om
ic
imprintin
gA
s of th
is w
ritin
g, ther
e is
no d
irec
t em
piric
al
evid
ence
ava
ilable
✓✓
✓✕
✕
(con
tin
ued
)
at University of Minnesota Libraries on June 14, 2015pps.sagepub.comDownloaded from
287
Key
Res
ults
in P
rese
nt Evi
den
ce
Theo
ryPrior
Key
Evi
den
ce
Subst
antia
l G
ains
for
Fluid
IQ
Subst
antia
l G
ains
for
Cry
stal
lized
IQ
Stro
nge
r G
ains
for
Fluid
Than
Cry
stal
lized
IQ
Dec
reas
ing
Gai
ns
in M
ore
Rec
ent
Dec
ades
Nonlin
ear
Gai
ns
Stro
nge
r G
ains
for
Adults
Than
Child
ren
Posi
tive
Ass
oci
atio
n
With
GD
P
Chan
ge
per
Cap
ita
Stro
nge
r G
ains
on
Low
-g
Tes
ts
Nutriti
on
Dec
reas
ing
IQ tes
t sc
ore
var
iance
in g
ener
al
popula
tion (
Colo
m, Ll
uis
-Font,
& A
ndre
s-Puey
o, 20
05; Pie
tsch
nig
et al
., 20
13);
evid
ence
for
coin
cidin
g IQ
gai
ns
and
nutriti
onal
im
pro
vem
ents
(Ly
nn, 20
09b)
✓✓
✓✓
✕✓
✕
Pat
hoge
n
stre
ssN
atio
nal
IQ
tes
t sc
ore
s as
soci
ated
with
pre
vale
nce
of in
fect
ious
dis
ease
(Eppig
, Fi
nch
er, &
Thorn
hill
, 20
10)
✓✓
✓✕
✓✕
IQ v
aria
bili
tyRat
her
a s
ympto
m than
a c
ause
for
IQ g
ains;
direc
t ev
iden
ce for
dec
reas
ing
IQ v
aria
bili
ty
has
bee
n p
rovi
ded
in s
ever
al s
tudie
s (e
.g.,
Colo
m e
t al
., 20
05; Pie
tsch
nig
et al
., 20
13)
✓✓
✕✕
✓
Soci
al
multi
plie
rsSo
cial
multi
plie
rs w
ould
be
able
to a
ccount fo
r in
crea
ses
in I
Q h
erita
bili
ty w
ith a
ge (
Dic
kens
& F
lynn, 20
01); d
irec
t em
piric
al e
viden
ce
for
soci
al m
ulti
plie
rs u
nav
aila
ble
as
of th
is
writin
g
✓✓
✓✓
Life
his
tory
sp
eed
Pro
pose
s IQ
gai
ns
as a
funct
ion o
f se
vera
l diffe
rent fa
ctors
that
are
rel
ated
to life
his
tory
spee
d, su
ch a
s ed
uca
tion, fa
mily
siz
e,
nutriti
on, an
d p
athoge
n s
tres
s; first
em
piric
al
evid
ence
supportin
g th
is theo
ry h
as b
een
pro
vided
(W
oodle
y, F
iguer
edo, B
row
n, &
Ross
, 20
13); c
onsi
sten
t w
ith the
pre
sent
obse
rvat
ion o
f IQ
chan
ges
bei
ng
unre
late
d
to p
sych
om
etric
g
✓✓
✓✓
✓✓
Note
: ✓
= theo
ry c
onsi
sten
t w
ith o
bse
rvat
ion, ✕
= theo
ry inco
nsi
sten
t w
ith o
bse
rvat
ion; bla
nk
cells
indic
ate
no s
pec
ific
pre
dic
tion o
f th
e th
eory
; G
DP =
gro
ss d
om
estic
pro
duct
.
Tab
le 2
. (c
ontin
ued
)
at University of Minnesota Libraries on June 14, 2015pps.sagepub.comDownloaded from
288 Pietschnig, Voracek
4. Decreasing gains in more recent decades
The decreasing strength of the IQ gains over time was reflected by meaningful negative effects of time span for full-scale, fluid, and crystallized IQ (all ηP
2 > .18), as well as year of onset for fluid and spatial IQ (all ηP
2 > .04). Supported by the observed IQ change trajectories, evi-dence for decreasing gains in recent decades can be con-sidered to be robust. Regression slopes of joinpoint regressions significantly decreased in the last segment of all IQ domains (Table S4 in the Supplemental Material; decreases of strength of gains were also obvious when data from different continents were inspected separately; Fig. S1 in the Supplemental Material). This may conceiv-ably indicate a development toward an end and perhaps an ultimate reversal of the IQ gains, as has been recently
reported for Scandinavian countries (Dutton & Lynn, 2013; Flynn, 1987, 2009b; Teasdale & Owen, 2005).
5. Nonlinear gains
Joinpoint regression analyses for all IQ domains showed a significantly better fit for regression models assuming changes in the strength of regression slopes over time than for models without incorporating changes in the slopes (ps < .001 for comparisons of accepted models vs. models with no or fewer joinpoints in all segmented line regressions). This result indicates that IQ test score gains have not been linear over the past century, but rather seem to have been alternately accelerating and decelerat-ing and finally decreasing during more recent years. Storfer already has proposed such changes in the strength of gains over time, estimating gains of 3.75 IQ points per
Fig. 2. Domain-specific distributions of observed IQ changes. Frequencies refer to absolute numbers of annual IQ changes in all observed samples.
at University of Minnesota Libraries on June 14, 2015pps.sagepub.comDownloaded from

Meta-Analysis of the Flynn Effect 289
decade from 1900 to 1920, of 2.50 from 1920 to 1960, and slightly smaller gains after the 1960s (Storfer, 1990, p. 439). In contrast, the present evidence indicates that a decrease in the strength of gains emerged only in the mid-1970s, yielding moderate gains of 2.30 IQ points per decade. However, the pattern preceding this period appears to be considerably more differentiated, indicat-ing that gains during the early 20th century have been relatively weak (0.80 IQ points per decade), then showed a sharp increase in the 1920s (7.20 IQ points per decade), decreased again from 1935 to 1947 (2.10 IQ points per decade), but later again recovered until 1976 (3.00 IQ points per decade; Table S3).
6. Stronger gains for adults than children
Stronger gains were observed for adults than for children, showing large effects for fluid and spatial IQ (ηP
2 = .28 and .66, respectively). Past research has attributed increas-ing gains with age mainly to effects of better education. If so, then educational effects would be expected to affect crystallized IQ most (e.g., Flynn, 2010). However, effects of age on crystallized and full-scale IQ were negligible in the present study, although the signs of the change coef-ficients were directionally as expected (Table S4).
7. Positive Associations With Gross Domestic Product Change per Capita
Gross domestic product (GDP) growth per capita was substantially positively associated with full-scale, crystal-lized, and spatial IQ (ηP
2 = .09, .18, and .50, respectively), but it showed negligible effects for fluid IQ. This finding is consistent with previous reports of links of economic prosperity with IQ in several nations (Lynn & Vanhanen, 2002). Associations between IQ gains and GDP have been linked to educational improvements (Rindermann, 2008), thus conceivably reflecting effects of better educa-tional infrastructure.
8. Stronger gains on low-g tests
IQ gains appeared not to be taking place on psychomet-ric g. Findings of meaningful negative effects of medium and high g-ness of tests on IQ gains (ηP
2 = .12 and .02, respectively) are supported by the overall lower gains observed in crystallized IQ (i.e., the domain with highest g-ness). These findings are consistent with previous evi-dence showing negative associations between g-ness and IQ gains (Te Nijenhuis & van der Flier, 2013) and cor-roborate the importance of environmental influences on generational IQ test score changes (Rushton, 1999).
Further moderators
Sample type (patients vs. nonpatients) did not play an important role for the Flynn effect, indicating virtually identical IQ gains for healthy compared with patient-based samples across all IQ domains. When average national fertility rates were added to the regression mod-els as additional predictors, the signs of all significant coefficients remained directionally unchanged (except the sign for year of onset for full-scale IQ, which became positive but did not reach significance). Average national fertility rates were positively related to IQ gains in full-scale and fluid IQ, yielding small to medium effects. These findings are in contrast to reports linking IQ gains to decreasing family size (Zajonc & Mullally, 1997). The positive association should be interpreted with caution, as the available data allowed investigation of this relation on only a portion of the total time span (namely, 1960–2013), and fertility rates may be considered as only a crude proxy for family size. In any case, the positive sign emerging in this analysis does not lend credence to the notion that IQ gains could be due to decreases in family size (Table S5 in the Supplemental Material).
Causes of Gains
The present account of the accumulated evidence for the Flynn effect over the past century allows a closer exami-nation of the proposed causes of this effect. We provide key findings of the present analysis across the top of Table 2 and summarize key evidence from previous stud-ies examining specific proposed theories for the Flynn effect. Along with the more specific results as detailed below, Table 2 therefore allows an evaluation of the potential contributions of the individual theories. In what follows, we address and evaluate each of these theories, proposing environmental, biological, and hybrid (i.e., interacting biological and environmental) causes for IQ gains, in turn.
Environmental factors
The environmental factors include education, technol-ogy, family size, and test-taking behavior.
Education. A number of authors have proposed increased mean educational years (Williams, 1998) and improvements in educational systems in industrialized societies as potential causes for rising IQ scores (Husén & Tuijnman, 1991; Teasdale & Owen, 2005). Although both of these reasons seem intuitively quite plausible, negligible gains or even declining task performance on achievement tests during periods of observed IQ gains repeatedly have been cited as evidence against schooling
at University of Minnesota Libraries on June 14, 2015pps.sagepub.comDownloaded from
290 Pietschnig, Voracek
as a major cause for the Flynn effect (e.g., Flynn, 1984). Subsequently, it has been argued that this finding might be due to the increasing number of individuals taking achievement tests, specifically the Scholastic Aptitude Test, in more recent years. In this regard, changes in edu-cational systems might have allowed individuals from all educational backgrounds (i.e., lower-performing individ-uals) to seek entry into higher education, thus explaining a rise of IQ scores in the presence of a decline of scores on the Scholastic Aptitude Test (Fuggle, Tokar, Grant, & Smith, 1992; Teasdale & Owen, 1987). Accordingly, declining achievement test scores may likely be due to the changed demographics of the individuals taking the test rather than actual student ability.
At least three aspects of the present evidence support the role of education as an important contributing factor to the explanation of IQ gains: First, we observed sub-stantial global increases in crystallized IQ. This may reflect, at least to a certain extent, effects of more and better schooling. Positive associations between crystal-lized IQ task performance and highest educational quali-fication are widely accepted (e.g., McArdle, Ferrer-Caja, Hamagami, & Woodcock, 2002) and have previously been shown to be associated with gains on crystallized IQ measures. Nonetheless, although education has been shown to account for portions of crystallized IQ gains, gains have been reported to remain substantial after con-trolling for education (Pietschnig, Tran, & Voracek, 2013).
Second, larger IQ gains were observed for adults than for adolescents and children in fluid and spatial IQ domains. Surprisingly, no meaningful effect of age on crystallized IQ was found. However, this may be due to the effect of growing GDP, which could mask age effects (indeed, preliminary regression analyses of the present data set without consideration of GDP growth yielded the expected age effect). Increasing numbers of average educational years (see, for instance, Ceci, 1991, for such reports in industrialized countries) may therefore explain stronger gains for adults than for children.
However, although IQ test performance of children and adolescents has been observed to increase to a lesser extent than that of adults, gains for young samples still were substantial in our data. Although increases in formal educational years may not play a crucial role among chil-dren and adolescent IQ gains, increasing exposure to early childhood education programs, as witnessed in more recent years, might do so (e.g., Gorey, 2001). Although most such programs are aimed at more mature children, some of these programs are aimed at infants (e.g., the U.S.-based ABCDerian project, which had aver-age enrollment ages of 4.4 months; for an overview, see Hunt, 2011, pp. 288–291). Thus, even IQ gains in infants (Campbell, Siegel, Parr, & Ramey, 1986; Lynn, 2009b; Thompson, 2012) may be suitably explained by
educational improvements. However, it remains difficult to decide the explanatory potential of early education programs for IQ gains in children and adolescents, because such programs differ considerably in coverage and availability between (and even within) investigated countries and time spans.
Third, IQ gains were predicted by average increases in GDP per capita across all domains, with the exception of fluid IQ. Positive associations of GDP with IQ gains have been observed in several studies and countries (for an overview, see Lynn & Vanhanen, 2002). In particular, the substantial effect of GDP on crystallized IQ may be linked to educational effects. It has been proposed that invest-ments in better education lead to economic growth and vice versa, thus leading to a positive feedback loop of economic prosperity, education, and intelligence (Rindermann, 2008). Of note, it has been shown more recently that increases in GDP may be better described as a function of education rather than the other way round (Rindermann, 2012), which in turn would reverse the causality assumption of the regression model applied by us. Regardless of the causality of the observed associa-tion, the positive sign of the association is consistent with this theory.
These findings show that there is little doubt that edu-cation plays a role in explaining the Flynn effect. Nonetheless, schooling is unlikely to account for the full extent of the IQ gains, and in particular the large gains for fluid IQ cannot be attributed to better education.
Effects of technology. Exposure to technology of the general population, at least in industrial countries, cer-tainly has increased in more recent decades. It has been suggested that the reported gains may reflect effects of increased exposure to modern appliances that inciden-tally train visual analytical abilities (Neisser, 1997). A more stimulating visual environment (e.g., owing to more exposure to computers, television, or video games) would thus act as a facilitating factor for abilities required to successfully master intelligence tasks.
This explanation is consistent with the present obser-vation of the strongest gains having taken place on mea-sures of fluid IQ. Moreover, consistent with the present results, effects of technological advancement have been linked to increases in GDP (Rindermann, 2008). One main argument for this theory is that the IQ rise has been observed mainly in Western industrialized countries where technology has been readily accessible to the major part of the population (Neisser, 1997). However, more recent accounts have reported substantial IQ gains in lesser-developed countries where ubiquitous exposure to modern visual media would not have been expected. For instance, IQ gains of about 1.8 IQ points per year from 1984 to 1998 were demonstrated in rural Kenya
at University of Minnesota Libraries on June 14, 2015pps.sagepub.comDownloaded from
Meta-Analysis of the Flynn Effect 291
(Daley et al., 2003), which indicates that substantial IQ gains may occur without effects of technology playing a major role. In a similar vein, the strongest IQ gains during the earliest decades of the present study are inconsistent with this theory, because during the early 20th century, the general availability of many now common appliances to the general population had been very limited.
Finally, there is no conclusive evidence for increased fluid task performance of individuals that are habitually more frequently exposed to visual media. Investigations of video game experts and nonexperts showed no differ-ences in task performance on the Raven’s Progressive Matrices between these groups (Boot, Kramer, Simons, Fabiani, & Gratton, 2008). However, on the basis of the available evidence, potential effects of incidental expo-sure to modern technology as root causes for IQ gains cannot be completely dismissed.
Family size. Decreasing family size has been associated with increasing cognitive task performance at least in Western countries (Zajonc & Mullally, 1997). On the basis of exemplary calculations for the U.S. state of Iowa, it has been concluded that an increase of about 1.4 IQ points per decade could be explained by decreasing family size. Although such an increase would have been suitable to explain only a portion of the gains found in the same time span in this state, it has been argued that besides the birth-order effect, collective potentiation would be able to contribute further toward explaining the gains (Zajonc & Mullally, 1997). Nonetheless, family size has not unequivocally been found to be related to cognitive task performance (Wichman, Rodgers, & MacCallum, 2006).
In the present study, we were able to directly assess influences of family size on IQ changes beyond the spe-cific regional finding, as described above. To do so, we included average national fertility rates as a predictor of IQ change from 1960 to 2012 in our regression model. In contrast to our expectations, fertility rate was significantly positively related to IQ gains for full-scale and fluid IQ domains, showing stronger gains in the presence of higher average fertility rates. The significant positive association found here should be interpreted with cau-tion, because fertility rate may be viewed only as a proxy for family size, and the findings are limited to data from 1960 onward. However, the present findings render it quite unlikely that effects of decreasing family size are substantially contributing to IQ gains.
Test-taking behavior. As many modern psychometric test instruments are based on multiple-choice response formats, it has been suggested that changed response behavior (principally, guessing) on such formats may have led to changes in test scores (Brand, 1987a, 1987b, 1996; Brand, Freshwater, & Dockrell, 1989), although it
has been asserted early on that guessing effects alone have limited explanatory potential for gains (Flynn, 1990; for a rejoinder, see Brand, 1990). The highest IQ gains have typically been shown for measures of fluid IQ, which are assumed to be largely independent of educa-tional backgrounds of test takers, rather than for mea-sures of crystallized IQ, where education should play a more important role. Because multiple-choice response formats are more common in fluid measures, it has been argued that lowered levels of caution, conscientiousness, and conservatism on social attitudes as well as higher levels of extraversion across Western countries (see Twenge, 2001, for evidence of increasing extraversion) emerging since the advent of such guessing-inviting, speeded group tests, rather than real-world improve-ments of cognitive abilities, may be more suitable to explain IQ test score gains (Brand, 1990). Consequently, increased risk-taking behavior concomitant with increased guessing behavior on psychometric test instruments may be a cause of higher IQ test scores.
Recent direct tests of changes in test-taking behavior showed strong evidence for guessing effects as important contributors for fluid IQ gains (Must & Must, 2013) as well as for crystallized IQ gains (Pietschnig et al., 2013). Of note, it has been shown that guessing effects are in fact related to gains on psychometric g, because guessing is most frequently encountered on difficult rather than easy test items (i.e., items with higher g-ness). However, when guessing was controlled for, the Flynn effect appeared to be independent of g (Woodley, Te Nijenhuis, Must, & Must, 2014). Accordingly, the present data render increased guessing behavior as a potentially contributing but limited source for IQ gains, although, consistent with guessing-related effects, the strongest gains indeed were seen for fluid IQ.
Conversely, the independence of IQ gains from psy-chometric g thus indicates that guessing is not the main cause of observed IQ gains. This should not come as a surprise, as we already observed gains for the initial decades of the 1900s, well preceding the advent and massive use of most of the guessing-inviting, speeded group tests, such as Raven’s Progressive Matrices (Raven, 1938), which would be most likely to be affected by changes in test-taking behavior. Similarly, guessing-related IQ gains cannot be expected to continue indefi-nitely, as eventually a ceiling must be reached. Decreasing IQ gains in more recent years might be an expression of a beginning saturation of guessing-related gains (see also Williams, 2013). Moreover, the considerable crystal-lized IQ gains in our data would be difficult to be explained by guessing behavior alone, as the majority of crystallized IQ measures in the present investigation were knowledge-based tests that leave only little room for guessing.
at University of Minnesota Libraries on June 14, 2015pps.sagepub.comDownloaded from
292 Pietschnig, Voracek
Biological factor: Hybrid vigor
In contrast to the theories discussed above, this theory focuses exclusively on genetic mechanisms as potential causes for IQ gains. Positive associations between aver-age allelic heterozygosity within populations and cogni-tive task performance have been demonstrated in several studies and now appear to be widely accepted ( Jensen, 1998, pp. 189–197). Hybrid vigor refers to the mating of individuals from genetically dissimilar subpopulations, thereby increasing allelic heterozygosity and reducing homozygosity. Consequently, it has been argued that IQ gains might be due to contemporary increases in the mobility of individuals and the ensuing lower numbers of consanguineous (close-relative) and endogamous (in-group) marriages and offspring during the past decades (Mingroni, 2004, 2007).
When simulating effects of hybrid vigor on observed allelic frequencies in isolated tribal villages of native Indian tribes in Brazil (Mingroni, 2004) and in villages in the Italian Parma Valley (Mingroni, 2007), it could be shown that even small trends toward more random (i.e., out-group) mating would considerably reduce allelic homozygosity. However, although this model appears to offer a plausible mechanism for the explanation of the Flynn effect, the relevance of this mechanism is limited when considering the strength and pace of IQ gains. An evaluation of the proposed model indicated that even under optimal conditions (i.e., maximal outbreeding), such a mechanism may be held accountable for only a portion of observed IQ gains, because hybrid vigor effects would neither be fast nor strong enough to explain gains amounting to more than 3 IQ points over 50 years (Woodley, 2011, 2012b). Keeping the magnitude of the actually observed global gains in mind (altogether 30 IQ points over the past century), hybrid vigor appears to play only a minor role in explaining the Flynn effect. In con-trast, it has been recently suggested that dysgenic effects (i.e., disadvantageous genetic effects of higher reproduc-tion rates of low-ability as opposed to high-ability indi-viduals within populations) may well be responsible for the observed reversal of the Flynn effect in Finland (Dutton & Lynn, 2013) as well as for slower reaction times on simple intelligence-related reaction tasks of the gen-eral population in a number of countries over more than one century (Woodley, Te Nijenhuis, Must, & Must, 2014).
Hybrid factors
This class of proposed explanations includes a number of basic background factors, such as blood lead levels, genomic imprinting, nutrition, and reduced pathogen stress. Moreover, more complex, integrative factors that
may be interpreted as a consequence of these various basic causes, such as reduced IQ variability, effects of social multipliers, and decreasing life history speed, have been proposed in the literature.
Blood lead levels. Detrimental effects of environmental exposure to lead on cognitive abilities are well docu-mented. Children have been shown to be particularly sus-ceptible to lead exposure, because even small increases in blood lead levels may impair neural development (e.g., Steen, 2009). With the advent of industrialization, substan-tial increases in blood lead levels of the general popula-tion have been observed (effects of lead paint poisoning in children were recognized initially in the 1980s), indicat-ing 100–1,000 times higher blood lead–level concentra-tions in industrialized compared with preindustrial societies (Koller, Brown, Spurgeon, & Levy, 2004). More-over, IQ gains in the United States have been linked to the banning of lead paint and phasing out of lead gasoline in the 1970s (Kaufman et al., 2014; Nevin, 2000).
Although consistent with strong gains for fluid IQ and decreasing gains in more recent years (as one would expect a beneficial effect of lead reduction to reach a ceiling), stronger gains in adults than in children cannot be reasonably explained by this theory. Indeed, the explanatory potential of this theory appears to be limited to gains following the 1970s, as only subsequent to this period did restrictions pertaining to the use of lead paint and gasoline take effect in most countries (Lovei, 1998). In fact, increasing lead exposure, preceding lead restric-tion efforts in the United States and other countries (Nevin, 2000), might have been responsible for weaker IQ gains than in environments with lower lead exposure. Arguably, gains amounting to 4–5 IQ points since the 1970s that have been attributed to lead restrictions in the United States (Kaufman et al., 2014) may in turn be taken as a sign for potential IQ gains being depressed prior to these bans.
It needs to be acknowledged that population expo-sure to lead is likely to have differed considerably between countries, thus making it difficult to decide whether effects of similar magnitude took place in differ-ent countries. A direct assessment of effects of lead on IQ gains was not possible in our meta-analysis, because blood lead–level reports were unavailable or largely incomplete for several of the included countries. However, the above evidence indicates that reduced lead exposure may well account for a portion of IQ gains in more recent years.
Genomic imprinting. Based on the idea that environ-mental conditions might be able to evoke fast-emerging biological effects, genomic imprinting was proposed in
at University of Minnesota Libraries on June 14, 2015pps.sagepub.comDownloaded from
Meta-Analysis of the Flynn Effect 293
the 1980s as an epigenetic inheritance mechanism that works in addition to the well-known Mendelian mecha-nisms (Surani, Barton, & Norris, 1984). Genomic imprint-ing means that environmental conditions affect reproduction information (i.e., the male sperm) and ulti-mately genetic expressions in children and even in grand-children. Specifically, for IQ gains it has been argued that visually stimulating environments may lead to changes of the father’s sperm, which in turn produces cognitive abil-ity gains of the offspring (Storfer, 1999).
Although genomic imprinting in principle would be suitable to explain IQ gains, this hypothesis remains dif-ficult to test (Mingroni, 2007). Although influences of genomic imprinting cannot be completely ruled out, in the light of the observed fluctuations in the slope of IQ test score gains over time, this mechanism appears to be insufficient to plausibly explain the observed pattern in our data.
Nutrition. It is undisputed that nutrition affects the makeup of the human body. For instance, increases in average body height in developed countries typically have been attributed to better nutrition. Such increases are still ongoing but have been decelerating in the late twentieth century (e.g., Cole, 2003). Also, nutrition has been shown to be associated with other biological characteristics, such as head circumference (Lucas, Morley, & Cole, 1998), which in turn has been shown to be a rough correlate of IQ test performance (Rush-ton, 1997). Although recent meta-analytical findings of correlations between brain volume, as assessed by modern brain imaging techniques, and IQ task perfor-mance suggest that previously calculated effects most probably were inflated, the association with such phys-ical features appears to be robust (Pietschnig, Zeiler, & Voracek, 2011). Moreover, poor nutrition has been shown to be associated with low IQ test performance in numerous countries (e.g., Hunt, 2011, p. 260). Improved nutrition may also plausibly explain stronger fluid than crystallized IQ gains, as fluid task perfor-mance appears to be more strongly affected than crys-tallized task performance in malnourished individuals (Lynn, 2009b).
Consequently, and based on the observation that IQ test score gains and improvements in nutrition of the general population coincided in past decades, better cog-nitive development due to improved prenatal and post-natal nutrition has been suggested as a plausible cause of the Flynn effect (Lynn, 1989, 1990, 2009b; but see Flynn, 2012, pp. 40–52). Trajectories of IQ changes in our data are consistent with this theory. Decreasing gains in more recent decades may well be due to the beneficial effects of nutrition having reached a ceiling (at least in devel-oped nations), although most likely there remains room
for nutritional improvement in parts of the general popu-lation, as discussed below.
As the malnourished portions of a respective country’s population would be expected to benefit more from improved nutrition than their already well-nourished compatriots (Nisbett et al., 2012), a narrowing of the dis-tribution of IQ test performance should be observed. Although we did not directly test IQ variability, recent findings show evidence for a decreasing variability of IQ test scores in the general population of several countries (see IQ Variability section below).
Conversely, it needs to be acknowledged that not all members of a specific country’s population are necessar-ily exposed to the same quality of nutrition. Nutrition quality has previously been linked to socioeconomic sta-tus (SES; e.g., Kant & Graubard, 2006), indicating poorer diets in low-SES individuals and therefore essentially allowing for further nutritional improvements of these population segments. As suboptimal nutrition in devel-oped countries appears to be due to a lack of affordabil-ity of high-quality nutrition among low-SES individuals, a lack of dietary awareness, or both, food assistance pro-grams and dietary guidance may potentially lead to higher-quality diets and, as a consequence, to further improvements of IQ test performance among these pop-ulation segments.
If improved nutrition were the sole cause of IQ gains, we would expect to observe more or less identical IQ gains at any age starting from infancy (Lynn, 2013). Indeed, we observed nontrivial gains for children sam-ples, thus suggesting an important role of nutrition for the Flynn effect. However, in our data, adults showed sub-stantially stronger gains than children and adolescents. Stronger IQ gains of adults suggest meaningful effects of further causes that emerge only later in development.
Pathogen stress. Similar to the nutrition hypothesis, the pathogen stress hypothesis emphasizes the importance of biological makeup for cognitive performance. Brain development in children demands a large percentage of the metabolic turnover (estimated to amount up to 87% in newborns and 34% at age 10; see Holliday, 1986), an energy demand that needs to be met to ensure cerebral development. Unavailability of these resources may impair optimal cerebral development, consequently affecting cognitive abilities. Fending off aversive patho-gens necessitates considerable amounts of energy, thereby removing important resources from brain devel-opment in early childhood. In this vein, it has been shown that average national IQs are negatively related to the prevalence of infectious diseases around the world (Eppig, Fincher, & Thornhill, 2010).
Environmental conditions have undoubtedly improved in the past decades in developed countries, but also in
at University of Minnesota Libraries on June 14, 2015pps.sagepub.comDownloaded from
294 Pietschnig, Voracek
the less-developed ones, thereby creating environments with less pathogen stress to individuals. Increased avail-ability of health services and better hygienic conditions lower the prevalence of infectious diseases and other pathogens, thus providing better conditions for cerebral development. Following this argument, less risk of expo-sure to pathogen stress in contemporary populations may be yet another cause for IQ gains. Thus, modern medical assistance and health care in developed countries allow for an allocation of bodily resources to cognitive develop-ment that in the past would have been needed for the containment of environmental pathogen stress.
Similar to improved nutrition, reduced pathogen stress would be suitable to explain stronger fluid than crystal-lized IQ gains and would be expected to emerge in infancy. Again, the observed stronger gains for adults than for children and adolescents would be difficult to reconcile by this theory, thus suggesting other important factors contributing to the Flynn effect. However, effects of nutrition and pathogen stress remain difficult to disen-tangle in the context of the present research.
IQ variability. In most of the proposed explanations for the Flynn effect, it has been (implicitly) assumed that the IQ increases are due to a shift of the overall ability distribution within the respective populations. However, systematic shifts of single parts of the distribution could also result in a mean change of the ability distribution by either increasing or decreasing the variance (Rodgers, 1999; Rowe & Rodgers, 2002).
There is some evidence for decreasing variability of IQ task performance and a narrowing of IQ distributions in several countries, although decreasing variability has not been found in all accounts (e.g., Dickens & Flynn, 2002; Pietschnig et al., 2010). Indeed, the available evidence indicates that decreases of IQ variability may have played a role in only some, but not all, countries (for an over-view, see Flynn, 2012, pp. 41–42). However, a consider-able number of recent investigations reported direct evidence for decreasing IQ variability over time in Austria, Denmark, Norway, Spain, and the United States (Colom et al., 2005; Pietschnig et al., 2013; Rindermann & Thompson, 2013; Sundet, Barlaug, & Torjussen, 2004; Teasdale & Owen, 2005).
An upward shift of the lower portion of the IQ distribu-tion may be plausibly explained by improved nutrition (Colom et al., 2005; Nisbett et al., 2012). Moreover, improvements of lower-quality environments or educa-tional reforms that have been specifically targeted to disad-vantaged groups may be additional drivers of decreasing variability (Rindermann & Thompson, 2013). In this regard, reduced IQ variability in itself may be seen as a conse-quence of other mechanisms at work rather than an inde-pendent, genuine cause. Although we did not directly test
for decreasing IQ variability, findings suggest that at least nutrition and education may play an important role in this context and thus, consistent with prior research, may well have led to decreases in IQ variability.
Social multipliers. In his seminal initial publication about the now eponymous effect, Flynn (1984) ques-tioned the meaningfulness of the observed IQ gains, arguing that they were too large to reflect genuine intel-ligence test performance increases and suggested that they conceivably might be due to sampling artifacts or test sophistication. He revised and attenuated this argu-ment in subsequent articles, arguing that IQ increases could be due to an actual increase in specific facets of abstract problem-solving ability but not in intelligence as such (Flynn, 1994).
Eventually, Dickens and Flynn (2001) proposed an explanation of their own for an IQ rise that would not be confined only to such a specific ability facet. They intro-duced the concept of social multipliers as a potential mechanism that would be powerful enough to explain test score gains. The basic idea is that even slight envi-ronmental advantages typically improve individual per-formance, which once again will lead to a more advantageous environment, which in turn will lead to improved performance, and so on.
This model stands out from other explanatory attempts because it also leaves room to take genetic factors into account. Slight advantages in specific abilities are typi-cally (although not always) found in beneficial environ-ments (i.e., passive, reactive, and active gene–environment correlations). These beneficial environmental influences would then act as multipliers for those abilities, thus pro-ducing larger increases in performance, which in turn again positively modify the environment. In this way, even small initial environmental advantages may produce large effects over a relatively short time (Dickens & Flynn, 2001). In regard to intelligence task performance, such social multipliers should lead to a general increase of cognitive abilities of the general population because of a more intense societal focus on cognitive task perfor-mance and subsequent individual exposure to cogni-tively stimulating environments. This means that social multipliers should be seen as mechanisms that allow beneficial societal influences to trigger IQ test score gains, regardless of the nature of these societal influ-ences. Whether certain abilities improve in this case would depend on societal emphasis of a specific ability.
Several commentators have doubted that such envi-ronmental interactions and feedback loops could be suit-able to account for IQ gains because of the seemingly contradictory evidence (Rushton & Jensen, 2005); because of competing alternative explanations, such as hybrid vigor (Mingroni, 2007); or because of changes in
at University of Minnesota Libraries on June 14, 2015pps.sagepub.comDownloaded from
Meta-Analysis of the Flynn Effect 295
the IQ population variance (Rowe & Rodgers, 2002). Others have questioned the potential of the model to explain the strength of the IQ gains, suggesting that the environmental interaction was not powerful enough to produce large IQ gains over such a comparatively short time span (Loehlin, 2002). These criticisms have been given careful attention by their proponents, and Dickens and Flynn responded to the raised concerns on a con-ceptual level (Dickens, 2009; Dickens & Flynn, 2002), although as of yet there has been no direct test of this theory (Nisbett et al., 2012).
Most observations from our present analysis fit well to the social multiplier theory. Specifically, IQ gains inde-pendent of psychometric g as well as the strongest gains for fluid IQ are consistent with expected outcomes due to the effect of social multipliers. Similar to previous empirical investigations, the present analysis cannot pro-vide a direct test of social multiplier effects. Accordingly, social multipliers are likely to explain portions, but not all, of the observed gains, and evidence from a direct test of this theory is still needed.
Life history speed. Similar to IQ variability, no novel cause for IQ gains in itself is postulated in the life history speed theory, which is more of an attempt to integrate several proposed factors driving the Flynn effect within a larger theoretical framework. Specifically, several poten-tial causes for IQ changes have been linked to life history speed (Woodley, 2012a). Slow life history individuals are typically characterized to have fewer lifetime sexual part-ners, fewer offspring, and later parenthood, as compared with fast life history individuals. Different environmental conditions may favor either slower or faster life history speed.
It has been argued that in environments with high pathogen stress and adverse conditions, such as insuffi-cient nutrition, fast life histories are advantageous for a population’s survival because they facilitate coping with unpredictable environments. Decreasing life history speed may thus be seen as a consequence of reduced perceived mortality threat and would in turn allow for more energetic investment into cognitive ability matura-tion and differentiation. This mechanism has recently been theoretically linked to epigenetic factors, speculat-ing that cognitive ability increases may be driven by genome optimization due to decreasing life history speed (Greiffenstein, 2011).
In other words, when pathogen stress is reduced and adequate nutrition is ensured, the development of a slower life history speed is encouraged, thus allowing the emergence of differentiated cognitive abilities. Ultimately, these developments of specific abilities may then in turn be facilitated by improved educational quality and num-ber of educational years (Woodley, 2012a; Woodley,
Figueredo, Brown, & Ross, 2013; Woodley & Madison, 2013).
A combination of better education, reduced family size, better nutrition, and lower pathogen stress could explain IQ test score gains. Accordingly, gains would be expected to occur in (developed) countries showing slowing life history speed, whereas no change in IQ test scores or even decreases should occur in countries that show accelerating life history speed (Woodley, 2012a).
This theory is suitable to explain the differential gains on different IQ domains in the present study. Stronger gains in fluid IQ than in crystallized IQ thus may be expressions of more individual investments in the devel-opment of specific abilities in environments that favor slower life histories (i.e., low-pathogen stress and high-nutrition environments).
Slower life history has been observed to be associated with a decline of the strength of g over time and pro-motes ability differentiation (Woodley, 2012a; Woodley & Madison, 2013). Consistent with the life history model, the Flynn effect in the present meta-analysis is apparently not on g. Indeed, the observed effects of test type suggest a negative association between IQ gains and psychomet-ric g.
Predictions of the life history model appear to fit well to the observed patterns of IQ gains in the present meta-analysis. As this model does not warrant uniformity of changes across countries or strength of changes across time, life history speed would be suitable to explain the erratic pattern of IQ changes in our data. Different causes associated with life history speed could thus be either present or absent in single countries, but they still would yield overall IQ gains due to compensatory effects of other factors being present. In other words, not all related causes need to be present in order to decelerate life his-tory speed and consequently lead to gains; rather, causes may be effective one at a time.
A recent first empirical investigation of the life history model provided evidence for the suitability of this model to explain the Flynn effect (Woodley et al., 2013). Furthermore, this model has been shown to be consistent with reported population increases (Figueredo, de Baca, & Woodley, 2013) in the personality dimensions of con-scientiousness, emotional stability, agreeableness (Smits, Dolan, Vorst, & Wicherts, 2011), and extraversion (Twenge, 2001). Nonetheless, a comprehensive assess-ment of life history speed on the country level in combi-nation with the available IQ trend data seems necessary to determine the explanatory capabilities of the life his-tory model for the Flynn effect.
Other causes. A number of further proposed causes that have gained less attention in the literature include a general increase in environmental complexity (Schooler,
at University of Minnesota Libraries on June 14, 2015pps.sagepub.comDownloaded from
296 Pietschnig, Voracek
1998) and allusions to effects of the collective uncon-scious (Mahlberg, 1997). Whereas conclusive statements about the former theory are difficult to make, because a clear definition of environmental complexity is not avail-able, the latter assertion should be dismissed as evidently empirically intractable and thus bearing similarities to fringe science.
Limitations of the Evidence
Although the present meta-analysis provides a compre-hensive account of the available data for the Flynn effect, some considerations when interpreting the current results should be pointed out. First, the differently designed pri-mary studies present a potential source of bias for esti-mating the effect. In two-wave assessments (i.e., tests of two independent samples on two different time points; see Appendix), item content might have been more dif-ficult to comprehend for the latter cohort, particularly so for crystallized IQ tasks, as linguistic expressions became outdated. Conversely, in cross-sectional designs, a substi-tution of outdated items from original tests through newly constructed test items might have rendered the tests not perfectly equivalent. In order to deal with these issues, we took great care during study selection to include only such studies where potentially biasing influences of com-prehensibility and content nonequivalence were deemed to be minimal (see Appendix). However, it is also impor-tant to note that any such remaining confounders would actually have made it more difficult to detect IQ gains, which may be taken as an indicator of the robustness of the observed Flynn effect.
Second, all gains in the primary studies included in the present analysis were assumed to be linear. It cannot be ruled out that the gains, as calculated from the primary studies, may in fact have followed individual nonlinear trajectories, thus resulting in a somewhat coarser assess-ment by the linear models applied here. However, the assumption of linearity was necessary due to the nature of the available primary data. Moreover, by means of lin-ear segmented line regressions on the weighted annual gains, an analysis of nonlinear trends could be provided in the present study.
Third, the analyses for full-scale IQ were not exclu-sively based on studies providing change estimates on full-scale IQ measures but to a certain amount included measures of fluid IQ, crystallized IQ, and IQ estimates from developmental tests. Because we observed substan-tial differences in the strength of IQ changes between different IQ domains, change estimates based on fluid and developmental measures may be expected to show somewhat stronger gains, whereas crystallized measures should show somewhat weaker gains than estimates for full-scale IQ measures. However, we felt it was important
to provide a comprehensive trajectory of intelligence test score changes over time, and the number of non-full-scale IQ studies was comparatively small (see Statistical Analysis in the Appendix).
Of note, we used fixed-effect models for all analyses rather than random-effects analyses. The latter necessi-tate estimates of the dispersion of effect sizes. However, such dispersion measures were unavailable for the major-ity of data points included in the meta-analysis; for this reason, application of random-effects calculations was waived. Moreover, fixed-effect modeling within modera-tor analyses was deemed appropriate, because this approach is based on fewer assumptions.
Finally, the accumulated evidence shows a clear lack of empirical evidence about the Flynn effect in older individuals. This is due to a vast majority of samples (90%) having a mean age of 38 years or below. In light of increasing average population ages, particularly in devel-oped countries (e.g., Staff, Hogan, & Whalley, 2014), future Flynn effect research should focus on investigating older participants.
Conclusion
The present research contributes to the literature in two ways. First, it provides a comprehensive account of intel-ligence test norm changes since the introduction of psy-chometric intelligence tests early in the twentieth century. Second, by assessing trends of intelligence test perfor-mance of general population samples worldwide over more than one century, we were able to evaluate the plausibility and viability of the different theories pro-posed to explain these changes. The meta-analytical evi-dence may be informative for narrowing down the number of theories already proposed as well as the num-ber of candidate factors corresponding to these theories that could account for the Flynn effect.
In summary, the present study clearly demonstrates a Flynn effect of about 3 IQ points per decade. However, this estimate reflects global linear gains by assuming uni-form gains over a period of more than 100 years. The data suggest that this assumption may well not be justi-fied, as the strength of gains could be shown to vary according to country, intelligence domains, and the investigated time span.
Evaluating mechanisms
Below we evaluate potential contributions of the pro-posed mechanisms to the Flynn effect (for an overview, see Table 2). Although the Flynn effect can be demon-strated across all IQ domains, the gains appear to be stronger for fluid than for crystallized (or spatial and full-scale) IQ.
at University of Minnesota Libraries on June 14, 2015pps.sagepub.comDownloaded from
Meta-Analysis of the Flynn Effect 297
Stronger gains for fluid IQ may be due to social multi-pliers, because modern societal demands that constitute the basis for these multipliers may conceivably rely more heavily on abilities related to fluid intelligence (Dickens & Flynn, 2001). Increased guessing behavior may most likely play an additional role in explaining differences in these gains. Because multiple-choice response formats are more common for measures assessing fluid than crys-tallized IQ (e.g., Brand, 1989), stronger guessing effects on fluid rather than crystallized IQ measures are expected.
Another mechanism that seems suited to explain the stronger fluid than crystallized IQ gains is the develop-ment and application of more sophisticated sets of cogni-tive rules for IQ tasks. Because most measures of fluid IQ can be solved by applying a rather limited set of basic mental operations, improvements in cognitive abilities that aid individuals to develop and successfully apply such rules (i.e., working memory and implicit learning) would lead to substantial gains in measures of fluid but not crystallized IQ (Armstrong & Woodley, 2014). Scores on crystallized IQ tests should be largely independent from these effects, because crystallized measures most commonly do not rely on rule application but rather assess knowledge. Over time, more frequent or contin-ued exposure to tasks and tests in modern-day environ-ments warranting the application of such rules may make individuals more sensitive to detect and recognize these rules. Moreover, improvements in specific components of cognitive abilities should be independent from psycho-metric g. All of this conforms to the present findings.
Based on our evidence, it seems highly likely that domain-specific gains are driven by different causes. Whereas crystallized IQ gains appear to be related mainly to GDP growth, fluid IQ was observed to be associated with stronger gains in adults than in children. Although it may seem surprising that age was strongly related to gains in fluid but not crystallized IQ, the lack of an asso-ciation with the latter domain might conceivably be due to masking effects of GDP growth.
Associations of crystallized IQ gains with GDP growth support educational, but also nutritional, factors and decreases in pathogen stress as plausible causes for gains. Conceivably, such mechanisms may lead to decreasing IQ variability, which previously has been related to IQ gains (Colom et al., 2005; Pietschnig et al., 2013; Rodgers, 1999; Rowe & Rodgers, 2002). Thus, decreasing IQ vari-ability may be viewed as a consequence of such environ-mental factors at work, although this was not directly evaluated in the present meta-analysis. Decreases of gains during times of massive environmental stress (most notably, World War II) and stronger gains among adults than among children or adolescents corroborate the hypotheses that nutritional factors, as proposed by Lynn (1989, 2009b), and educational factors, as proposed by
Schooler (1998), may play a crucial role in explaining generational IQ test score changes. Moreover, reduced pathogen stress may be viewed as another important contributor (Eppig et al., 2010).
Together with family size, the above three factors have been integrated into the life history model (Woodley, 2012a), which is consistent with stronger fluid IQ gains as well as the nonlinearity of these gains. However, we did not find fertility to be a negative predictor of IQ gains, nor did we find the expected pattern of decreasing IQ gains after decades with large birth cohorts (e.g., follow-ing the years of the baby boom). Consequently, only three components of decreasing life history speed, namely, better education, improved nutrition, and reduced pathogen stress, but not decreasing family size, appear to be related to the IQ gains. Nonetheless, decreasing life history speed remains a plausible con-tributor to the Flynn effect, particularly when bearing in mind that components within the life history model work in a compensatory manner.
In more recent years, IQ gains could be observed to decrease across all intelligence test domains, indicating that the gains may be coming to an end, as has already been documented for Scandinavian countries (Dutton & Lynn, 2013; Teasdale & Owen, 2005). Recent decreases in IQ gains may be due to a number of different reasons. On the one hand, decreasing gains may simply be expres-sions of ceasing effects of beneficial factors, such as satu-ration or diminishing returns of improved nutrition and reduced pathogen stress. Similarly, improvements in spe-cialized cognitive abilities might have reached a ceiling where further ability differentiation and gains may not be possible, due to limits of a slowing down of life history speed (Woodley, 2012a). Likewise, effects of other likely contributing causes to IQ gains, such as test-taking behavior or reduced blood lead levels, may be expected as well to reach a point of saturation. Consequently, potential further IQ increases due to such factors may be limited as improvements may eventually yield diminish-ing returns or cease altogether.
On the other hand, the deceleration of gains may be due to a picking up of effects that cause IQ decreases and may ultimately reverse the Flynn effect. Such poten-tially detrimental effects have been proposed to work through dysgenic trends in modern populations (Lynn, 2011) or via negative cultural amplifiers (i.e., selective reproduction patterns due to differences in the use of contraception in more or less intelligent population seg-ments; Meisenberg, 2003). Finally, decreases and an ulti-mate reversal of IQ gains may result from the possibility that increases in specific cognitive abilities may not be able to further compensate for decreases in psychomet-ric g. This notion has received support by a previous account showing that declines in psychometric g are
at University of Minnesota Libraries on June 14, 2015pps.sagepub.comDownloaded from
298 Pietschnig, Voracek
associated with IQ decreases (Woodley & Meisenberg, 2013), and it is consistent with our findings of negative associations between IQ gains and g-ness of tests. Although decreasing IQ gains may not be an immediate cause for alarm, stagnation or an ultimate reversal of IQ gains might have substantial real-world implications. As economic prosperity, technological advancement, and scientific innovation rates have been shown to be posi-tively related to average national IQs (Lynn & Vanhanen, 2002; Rindermann, 2008; Woodley, 2012b), future IQ declines may be potentially associated with similar declines in those areas.
However, the extent to which the above mechanisms contribute to the strength of gains remains to be further elucidated. Accordingly, it may be advisable for future research devoted to this important topic to focus on a more fine-grained and rigorous assessment of the plausi-bility and explanatory power of the specific theories pro-posed for the Flynn effect.
Practical implications
It needs to be acknowledged that IQ should not be understood as synonymous with intelligence. There is arguably more to intelligent behavior than IQ scores on a specific test instrument reflect, and this important differ-ence needs to be kept in mind when interpreting the present results. Conceptualizations of intelligence differ, and so do individual test results on different test instru-ments. Nonetheless, typically we would expect that indi-viduals scoring high on psychometric IQ tests also possess higher mental capacity than low scorers.
However, it would be difficult to argue that the present IQ increase of about 30 IQ points over the past century means that the average person born in the early 1900s had in fact an adjusted IQ of 70 and was therefore accord-ing to our present classifications learning disabled. It appears to be equally unlikely that the average person at present boasts an IQ of 130, which would put about half of the present population in the gifted range. Although increases due to guessing behavior are expressions of either personality traits or increased test sophistication and therefore can be safely dismissed from constituting real-world IQ gains, the question remains whether the portion of IQ gains that cannot be explained by guessing in fact reflects meaningful gains. Most other potential explanations that have been put forward are mainly envi-ronmental in nature, such as factors associated with life history speed or social multipliers. If the remaining IQ gains turn out to be driven mainly by such environmental causes, as it appears to be the case judging from the pres-ent research, these gains do not reflect changes of the average mental capacity but rather are expressions of a facilitation of abilities by the (modern-day) environment.
In other words, adjustments of IQ scores obtained a cen-tury apart will most certainly not reflect mere differences in cognitive functioning of two individuals. A person with an IQ of 100 in the early 1900s may have had quite dif-ferent capabilities than a person with an “equivalent” IQ of 70 at the present day (cf. Schooler, 1998).
Final words
In conclusion, in this first formal meta-analysis of the Flynn effect, we could clearly demonstrate that genera-tional IQ test score gains have taken place globally over the past century across all major intelligence domains. There may be several contributing factors to this ubiqui-tous but apparently decelerating effect. The totality of retrievable empirical evidence on this phenomenon, as quantitatively summarized here, points toward compo-nents of life history speed, such as improvements of edu-cation and nutritional factors as well as a reduction of pathogen-related factors, as the prime candidate causes of the Flynn effect, whereas differences in the strength of gains between intelligence domains may be accounted for by social multipliers and economic prosperity. Future research will show whether the now observed global decrease of IQ test score gains will ultimately lead to an end of these gains or even to a reversal.
Appendix
In this Appendix, we provide details of how we selected studies, the design of the studies, and how we analyzed the studies included in our meta-analysis.
Selection
Literature search. Five literature-search strategies were used to identify relevant studies. First, we per-formed a cited-reference search in ISI Web of Knowl-edge for the articles of Flynn (1984), Flynn (1987), and Schaie and Strother (1968). This strategy was used because Flynn (1984) and Flynn (1987) are generally regarded to be the first to systematically describe gen-erational IQ test score gains and therefore are highly likely to be cited in subsequent studies investigating such changes, whereas Schaie and Strother (1968) is important because it was the first to interpret observed IQ changes as genuine cohort effects. Second, we searched the scientific databases PubMed, ISI Web of Knowledge, and Scopus by using the following search strings: “Flynn AND effect”; “intelligence AND genera-tional”; and “IQ AND generational.” Third, we searched Google Scholar using the string “Flynn AND effect.” Fourth, we screened reference lists of all relevant arti-cles obtained through the first three steps of
at University of Minnesota Libraries on June 14, 2015pps.sagepub.comDownloaded from
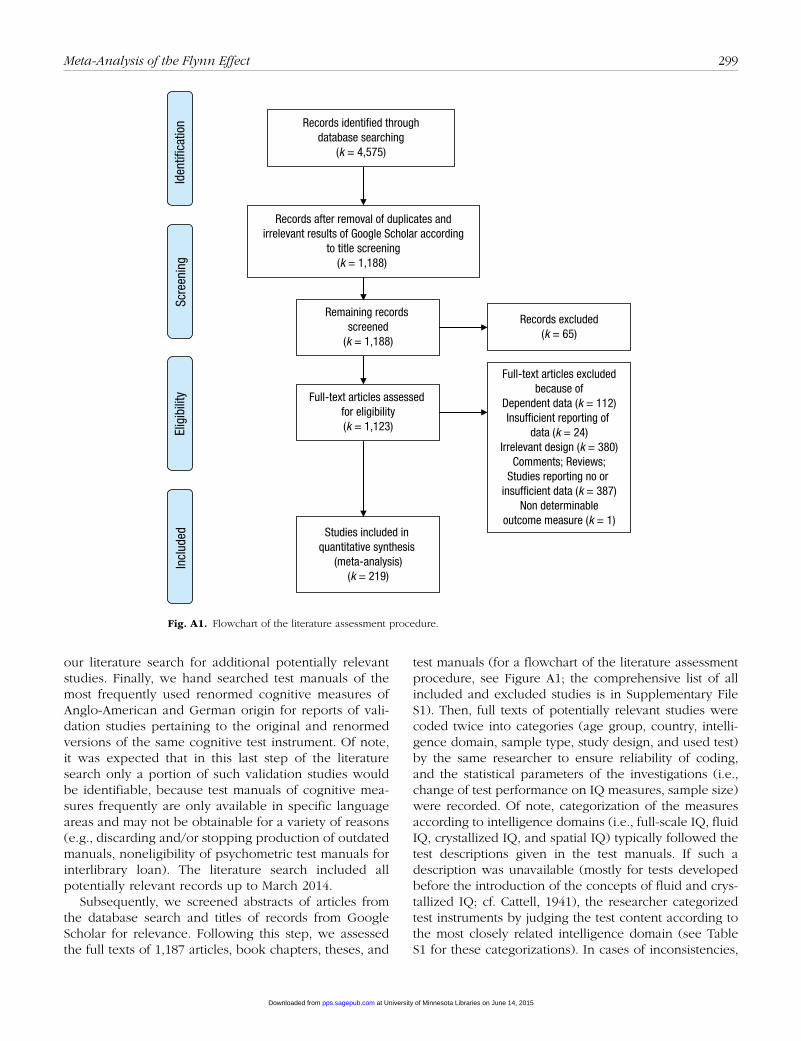
Meta-Analysis of the Flynn Effect 299
our literature search for additional potentially relevant studies. Finally, we hand searched test manuals of the most frequently used renormed cognitive measures of Anglo-American and German origin for reports of vali-dation studies pertaining to the original and renormed versions of the same cognitive test instrument. Of note, it was expected that in this last step of the literature search only a portion of such validation studies would be identifiable, because test manuals of cognitive mea-sures frequently are only available in specific language areas and may not be obtainable for a variety of reasons (e.g., discarding and/or stopping production of outdated manuals, noneligibility of psychometric test manuals for interlibrary loan). The literature search included all potentially relevant records up to March 2014.
Subsequently, we screened abstracts of articles from the database search and titles of records from Google Scholar for relevance. Following this step, we assessed the full texts of 1,187 articles, book chapters, theses, and
test manuals (for a flowchart of the literature assessment procedure, see Figure A1; the comprehensive list of all included and excluded studies is in Supplementary File S1). Then, full texts of potentially relevant studies were coded twice into categories (age group, country, intelli-gence domain, sample type, study design, and used test) by the same researcher to ensure reliability of coding, and the statistical parameters of the investigations (i.e., change of test performance on IQ measures, sample size) were recorded. Of note, categorization of the measures according to intelligence domains (i.e., full-scale IQ, fluid IQ, crystallized IQ, and spatial IQ) typically followed the test descriptions given in the test manuals. If such a description was unavailable (mostly for tests developed before the introduction of the concepts of fluid and crys-tallized IQ; cf. Cattell, 1941), the researcher categorized test instruments by judging the test content according to the most closely related intelligence domain (see Table S1 for these categorizations). In cases of inconsistencies,
Records identified throughdatabase searching
(k = 4,575)
Scre
enin
gIn
clud
edEl
igib
ility
Iden
tifica
tion
Records after removal of duplicates andirrelevant results of Google Scholar according
to title screening(k = 1,188)
Remaining records screened
(k = 1,188)
Records excluded(k = 65)
Full-text articles assessed for eligibility(k = 1,123)
Full-text articles excludedbecause of
Dependent data (k = 112)Insufficient reporting of
data (k = 24)Irrelevant design (k = 380)
Comments; Reviews;Studies reporting no or
insufficient data (k = 387)Non determinable
outcome measure (k = 1)Studies included in
quantitative synthesis (meta-analysis)
(k = 219)
Fig. A1. Flowchart of the literature assessment procedure.
at University of Minnesota Libraries on June 14, 2015pps.sagepub.comDownloaded from
300 Pietschnig, Voracek
a second researcher coded the respective study indepen-dently, and discrepancies were resolved by discussion.
Inclusion criteria. To be eligible for inclusion, studies had to meet four criteria. First, performance was mea-sured using standardized psychometric test instruments and developmental tests (i.e., no scholastic achievement tests, as Flynn effects on such measures would be con-ceivably masked due to recent increases of individuals participating in such assessments in the course of col-lege entrance examinations and the resulting changed demographic characteristics of such samples). Second, no correction for assumed gains had to be applied to arrive at an estimate for the generational IQ test score changes in the primary studies (for an example, see Lynn & Hampson, 1986, pp. 30–31). Third, sufficient data to calculate annual IQ test score changes (i.e., descrip-tive statistics or change in performance and sample size) had to be reported. Finally, reported results had to be independent of results reported in other included stud-ies. In case of data dependencies, the data sets reporting the longest time span and the largest sample sizes were preferred. Our final sample included 219 studies that met the inclusion criteria, yielding 271 independent sam-ples comprising 3,987,892 participants covering a time span of 105 years (1909–2013).
Study designs
Relevant primary studies investigating the Flynn effect used several distinctly different approaches to assess generational IQ test score changes, which basically can be classified into the following five groups: first, assess-ment of test performance using the same test battery on two time points using two independent samples display-ing similar demographic characteristics (two-wave assess-ment). Thus, differences between the test scores of the two samples may be interpreted as changes in test per-formance over the investigated period. Great care was taken to include only such studies in the analyses where sample ages were comparable. This was deemed impor-tant to ensure that differences in test performance between samples were not confounded with age effects. Frequently, such investigations were carried out using samples of military draftees, as this provides in many cases access to the data of almost entire birth cohorts of young men in countries where military service is manda-tory, consequently reducing threats of selection bias in these samples (e.g., Girod & Allaume, 1976). When test scores of more than one follow-up sample on the same test were provided, scores of the most recent of the reported samples were used to calculate the differences in order to obtain changes over the longest available time span in the study (e.g., Flynn, 1998).
Second, in cross-sectional studies, an original and a revised (restandardized) version of the same test are administered to the same respondent pool. The difference between the score on the revised test and the original test reflects changes in test performance between the time points of the original and the restandardized test. Typically, studies using such designs were performed in order to either explicitly assess the Flynn effect (e.g., Pietschnig, Voracek, & Formann, 2011) or to examine the validity of a restandardized measure (e.g., Wechsler, 1981).
In most of these cases, the respective test forms were administered in a counterbalanced design, thus control-ling for retest effects. Of note, in a few studies, such counterbalancing was not performed; rather, for various reasons, the original test was always administered first. Nonetheless, inclusion of such studies was deemed unproblematic, because time intervals between the administration of test batteries in this subset of studies typically were large (weighted mean time interval between two test administrations = 2.9 years), conse-quently minimizing retest effects.
Another important aspect of administering revised measures is the change of the test items themselves. Items that are judged by test authors to be outdated may be removed, and new items may be introduced in their place. Such changes of test content range from substitut-ing single items of a scale up to a subscale’s completely new construction. Therefore, great care was taken to include only such studies where original and revised tests were deemed comparable (i.e., equivalence of test content was satisfactory).
Third, we used cross-temporal meta-regressions to estimate IQ changes per year for studies reporting mean IQ test performance and corresponding sample sizes for a number of years separately. In cross-temporal regres-sions, year of data collection is entered as predictor of a dependent variable (presently, mean IQ of the sample) in a linear regression model, and data points are weighted by sample size to account for study precision (i.e., giving larger weights to studies with larger sample sizes). This approach allows the interpretation of the slope of these meta-regression models as the average IQ change per year over the investigated period (e.g., Pietschnig et al., 2010). Weighted meta-regression was used in two studies (Pilliner, Sutherland, & Taylor, 1960; Teasdale & Owen, 2005), unweighted meta-regression in another three instances (Dutton & Lynn, 2013; Macnamara, 1964; Schubert & Berlach, 1982). This approach allowed for the assessment of changes based on a larger number of indi-viduals than in two-wave assessments and accordingly more precise estimations.
Fourth, a number of studies compared test results of samples with characteristics similar to the standardiza-tion sample of a certain measure with the performance
at University of Minnesota Libraries on June 14, 2015pps.sagepub.comDownloaded from
Meta-Analysis of the Flynn Effect 301
of this standardization sample (e.g., Liu & Lynn, 2013). Consequently, the difference is interpretable as the change in performance between the test standardization and the data collection for the respective study.
Fifth, in two studies, the results of a sample of young participants were compared with the results of a sample of older participants on the same measure administered in the same year (Finkel, Reynolds, McArdle, & Pedersen, 2007; Meisenberg, Lawless, Lambert, & Newton, 2005). Differences between the two cohorts may be interpreted as the mean change in performance between the two cohorts, using the mean birth year of the cohorts as onset and offset points of changes.
Statistical analysis
An approach broadly similar to cross-temporal meta-analysis (e.g., Pietschnig et al., 2010; Twenge, 2000; Twenge & Zhang, 2004; see below for a detailed descrip-tion) and a standard meta-analytical approach (i.e., weighted multiple meta-regression) were used. Similar to the use of standard multiple regressions in primary stud-ies, meta-regressions allow the examination of influences of one or more predictor variables on a dependent vari-able (here, IQ change per year; see below). Different from standard regressions, in meta-regressions predictors and dependent variable scores reflect study-level rather than subject-level observations, and predictors are weighted according to the precision of the data points. The use of these two approaches ensured that, on the one hand, the overall time trend of the generational IQ test score changes (i.e., by meta-regression) and, on the other hand, variables moderating the strength of changes (i.e., by cross-temporal analysis) could be assessed. Wherever necessary, for both approaches the initially observed changes in the primary studies were trans-formed into the IQ metric from other formats reported (effect sizes, raw scores, or standard deviation units). To arrive at the unit of analysis, namely, annual IQ test score changes, absolute changes were divided by the years of the respective investigated time span per study.
In a number of instances, results of more than one intelligence test domain were reported (i.e., full-scale, crystallized, fluid, or spatial IQ test performance). For the main analyses, full-scale IQ was used as the dependent variable. In studies where no results for full-scale IQ were given, changes of other domains were used in the main analysis in the following order: fluid IQ, crystallized IQ, and IQ estimates from developmental tests (19.6%, 4.8%, and 13.3% of a total of 271 independent samples, respectively). In order to provide a comprehensive analy-sis of all domains, we performed additional separate cal-culations using crystallized IQ, fluid IQ, and spatial IQ as the dependent variables.
These domain-specific analyses should make it possi-ble to provide a more detailed picture of changes. Thus, the trajectory for full-scale IQ over time should reflect performance changes on general cognitive ability tasks. Changes in fluid IQ should reflect changes on tasks asso-ciated most closely with on-the-spot reasoning ability, crystallized IQ on tasks requiring knowledge, and spatial IQ on tasks requiring spatial–temporal abilities.
To assess the overall trend of changes over time, we calculated annual changes as the mean change per year, weighted according to the sample size of the respective primary studies. By using the year preceding the first available data point of the IQ test score change as a refer-ence point (i.e., by assuming zero as a reference) and cumulatively adding annual changes, we could obtain the overall trend of intelligence changes. This simple lin-ear transformation was chosen in order to make differ-ences in strength of gains more easily visible and intuitively interpretable. The results of inferential statisti-cal tests are unaffected by this decision.
Subsequently, linear segmented line regression models (joinpoint regression; see Hudson, 1966; Kim, Fay, Feuer, & Midthune, 2000; Kim, Yu, & Feuer, 2008), using the grid search method (Lerman, 1980), were applied on these data to identify changes in the regression slopes over the examined period. This method allows modeling of tem-poral trends by testing significant changes in regression slopes (i.e., significant increases or decreases) when a certain number of joinpoints is assumed. This means that each assumed joinpoint identifies the point on the tempo-ral axis where a significant change in the regression slope occurs, thus identifying the point where two ordinary least squares linear regression segments connect.
To arrive at the best-fitting model, we fit regression models to the data, starting with the most parsimonious model (i.e., in the present case assuming linearity, zero joinpoints). Subsequently, more complex models with increasing numbers of joinpoints were fitted and com-pared with the respective simpler models by ratio tests of permutations of the squared errors of the null and the alternative model (for details, see Kim et al., 2000).
Models with up to four joinpoints were fitted by means of Bonferroni-corrected permutation tests using the Joinpoint Regression Program 4.0.4 (Statistical Research and Applications Branch, 2011). However, when signifi-cant numerical changes between two adjacent slopes were smaller than 0.05 (i.e., absolute difference of half an IQ point over 10 years), a more parsimonious model was selected, as practical considerations would suggest that such small changes in strength would not justify the selection of more complex models, but rather would lead to model overfit. For spatial IQ, no segmented line regres-sions were performed because of the small number of available observations.
at University of Minnesota Libraries on June 14, 2015pps.sagepub.comDownloaded from
302 Pietschnig, Voracek
In our second data-analysis approach, we used a stan-dard meta-analytical method by combining annual changes weighted by sample size to yield the overall observed effect. In a more fine-grained analysis, study characteristics were entered into multiple meta-regression models, weighted by sample size to reflect study preci-sion, in order to identify moderator variables. In addition, country-specific average changes in gross domestic prod-uct (GDP) per capita over the respective time spans cov-ered by individual studies were calculated from the Maddison Project database (Bolt & van Zanden, 2013) and included as a predictor.
When interpreting the results of this approach, it is important to keep in mind that annual IQ test score changes, as calculated for these analyses, depend solely on observed changes and on study weights (i.e., the sam-ple size but not the investigated time span) and therefore do not reflect linear IQ test score changes over the respec-tive time span. Rather, these weighted mean changes make it possible to assess influences of moderator variables by serving as the dependent variables in regression analyses, whereas the results of cross-temporal analyses reflect yearly IQ test score changes. Mean weighted annual changes turned out to be all positive and are provided in Table S6. Upon inspection of these gains, it is striking that most gains were substantially larger when calculated in this fashion than in the cross-temporal approach. This observation supports the results from the segmented line regression models, indicating varying IQ gains for different time spans (i.e., nonlinearity of IQ gains).
Initially, seven predictors (children vs. adult sample, GDP change per capita, investigated time span in years, patient-based vs. healthy sample, proportion of males in the sample, test g-ness, year of onset of IQ test score change) were regressed on mean annual IQ test score changes. As information about participants’ sex frequently was unavailable in the primary data sources, inclusion of this variable would have led to a considerable reduction of samples in the regressions due to missing data (about a third of otherwise includable samples). Because, consis-tent with prior reports (Pietschnig et al., 2011), sex of participants did not emerge as a significant predictor in a preliminary calculation for full-scale IQ using all seven predictors, we decided to drop this variable (i.e., propor-tion of males in the sample) from further analyses. Inclusion of interaction terms of predictors caused vari-ance inflation factors (VIFs) to deteriorate drastically (all VIFs < 4.0 for main effects, but VIFs > 60 when interac-tions were specified); hence, these interaction terms were omitted from analysis.
In secondary analyses, subsets of our present data cov-ering the period from 1960 to 2013 only (i.e., ks = 137 samples for full-scale, 74 for crystallized, 88 for fluid, and 10 for spatial IQ, respectively) were examined to
investigate influences of average fertility rates (i.e., average fertility within the respective country over the examined time span) as a proxy for family size. Average fertility rates per country were obtained from the World Bank databases for study-specific time spans (World Bank, 2014) and entered as an additional predictor. Calculations were per-formed for different intelligence domains separately (full-scale IQ, crystallized IQ, fluid IQ, and spatial IQ), using the statistical software R 3.1.1 (R Development Core Team, 2014). We followed Cohen’s classification of effect sizes into small, medium, and large effects to describe observed effects (Cohen, 1988).
Acknowledgments
The authors would like to thank James Flynn, Earl Hunt, and Michael A. Woodley for their helpful comments on an earlier version of this article.
Declaration of Conflicting Interests
The authors declared that they had no conflicts of interest with respect to their authorship or the publication of this article.
Supplemental Material
Additional supporting information may be found at http://pps .sagepub.com/content/by/supplemental-data
Note
1. Joinpoint regression (segmented line regression) is a form of nonlinear regression that allows the estimation of and compari-son between changes in the strength of regression slopes as numerical values of the predictor increase. For a more detailed description, see the Statistical Analysis section in the Appendix.
References
Armstrong, E. L., & Woodley, M. A. (2014). The rule-depen-dence model explains the commonalities between the Flynn effect and IQ gains via retesting. Learning and Individual Differences, 29, 41–49. doi:10.1016/j.lindif.2013.10.009
Binet, A., & Simon, T. (1905). Méthodes nouvelles pour le diagnostic du niveau intellectuel des anormaux [New methods for the diagnosis of intellectual level of subnor-mals]. L’Année Psychologique, 11, 191–244. doi:10.3406/psy.1904.3675
Binet, A., & Simon, T. (1908). Le developpement de l’intelligence chez les enfants [The development of intelligence in chil-dren]. L’Année Psychologique, 14, 1–90. doi:10.3406/psy.1907.3737
Bolt, J., & van Zanden, J. L. (2013). The first update of the Maddison Project: Re-estimating growth before 1820 (Maddison Project Working Paper 4). Groningen, The Netherlands: University of Groningen.
Boot, W. R., Kramer, A. F., Simons, D. J., Fabiani, M., & Gratton, G. (2008). The effects of video game playing on attention,
at University of Minnesota Libraries on June 14, 2015pps.sagepub.comDownloaded from
Meta-Analysis of the Flynn Effect 303
memory, and executive control. Acta Psychologica, 129, 387–398. doi:10.1016/j.actpsy.2008.09.005
Brand, C. (1987a). British IQ: Keeping up with the times. Nature, 328, 761. doi:10.1038/328761a0
Brand, C. (1987b). Intelligence testing: Bryter still and bryter? Nature, 328, 110. doi:10.1038/328110a0
Brand, C. R. (1989). Has there been a “massive” rise of IQ levels in the West? Evidence from Scottish children. Irish Journal of Psychology, 10, 383–393.
Brand, C. R. (1990). A ‘gross’ underestimate of a ‘massive’ IQ rise? A rejoinder to Flynn. Irish Journal of Psychology, 11, 52–56. doi:10.1080/03033910.1990.1010557788
Brand, C. R. (1996). The g factor: General intelligence and its implications. New York, NY: Wiley.
Brand, C. R., Freshwater, S., & Dockrell, N. (1989). Has there been a ‘massive’ rise in IQ levels in the West? Evidence from Scottish children. Irish Journal of Psychology, 10, 388–393. doi:10.1080/03033910.1989.10557756
Brooks, S. S. (1922). Some uses for intelligence tests. Journal of Educational Research, 5, 217–238.
Brouwers, S. A., Van de Vijver, F. J. R., & Van Hemert, D. A. (2009). Variation in Raven’s Progressive Matrices scores across time and place. Learning and Individual Differences, 19, 330–338. doi:10.1016/j.lindif.2008.10.006
Campbell, S. K., Siegel, E., Parr, C. A., & Ramey, C. T. (1986). Evidence for the need to renorm the Bayley Scales of Infant Development based on the performance of a population-based sample of 12-month-old infants. Topics in Early Childhood Special Education, 6, 83–96. doi:10.1177/027112148600600208
Cattell, R. B. (1937). The fight for our national intelligence. London, England: P. S. King & Son.
Cattell, R. B. (1941). Some theoretical issues in adult intelli-gence testing. Psychological Bulletin, 38, 592.
Ceci, S. J. (1991). How much does schooling influence general intelligence and its cognitive components? A reassessment of the evidence. Developmental Psychology, 27, 703–722. doi:10.1037/0012-1649.27.5.703
Ceci, S. J., & Kanaya, T. (2010). “Apples and oranges are both round”: Furthering the discussion on the Flynn effect. Journal of Psychoeducational Assessment, 28, 441–447. doi:10.1177/0734282910373339
Cohen, J. (1988). Statistical power analysis for the behavioral sciences (2nd ed.). Hillsdale, NJ: Erlbaum.
Cole, T. J. (2003). The secular trend in human physical growth: A biological view. Economics & Human Biology, 1, 161–168. doi:10.1016/S1570-677X(02)00033-3
Colom, R., Flores-Mendoza, C. E., & Abad, F. J. (2007). Generational changes on the Draw-a-Man test: A compari-son of Brazilian urban and rural children tested in 1930, 2002 and 2004. Journal of Biosocial Science, 39, 79–89. doi:10.1017/S0021932005001173
Colom, R., Juan-Espinosa, M., & Garcia, L. F. (2001). The secu-lar increase in test scores is a “Jensen effect.” Personality and Individual Differences, 30, 553–559. doi:10.1016/S0191-8869(00)00054-4
Colom, R., Lluis-Font, J. M., & Andres-Pueyo, A. (2005). The generational intelligence gains are caused by decreasing variance in the lower half of the distribution: Supporting
evidence for the nutrition hypothesis. Intelligence, 33, 83–91. doi:10.1016/j.intell.2004.07.010
Daley, T. C., Whaley, S. E., Sigman, M. D., Espinosa, M. P., & Neumann, C. (2003). IQ on the rise: The Flynn effect in rural Kenyan children. Psychological Science, 14, 215–219. doi:10.1111/1467-9280.02434
Deary, I. J. (Ed.). (2009). Intelligence, health, and death: The emerging field of cognitive epidemiology [Special issue]. Intelligence, 37.
Dickens, W. T. (2009). A response to recent critics of Dickens and Flynn (2001). Retrieved from http://www.brook-ings.edu/~/media/Files/rc/articles/2001/0401IQ_critics_dickens/0401IQ_critics_dickens.pdf
Dickens, W. T., & Flynn, J. R. (2001). Heritability estimates ver-sus large environmental effects: The IQ paradox resolved. Psychological Review, 108, 346–369. doi:10.1037//0033-295X.108.2.346
Dickens, W. T., & Flynn, J. R. (2002). The IQ paradox is still resolved: Reply to Loehlin (2002) and Rowe and Rodgers (2002). Psychological Review, 109, 764–771. doi:10.1037//0033-295X.109.4.764
Dutton, E., & Lynn, R. (2013). A negative Flynn effect in Finland, 1997-2009. Intelligence, 41, 817–820. doi:10.1016/j.intell .2013.05.008
Eppig, C., Fincher, C. L., & Thornhill, R. (2010). Parasite preva-lence and the worldwide distribution of cognitive ability. Proceedings of the Royal Society B: Biological Sciences, 277, 3801–3808. doi:10.1098/rspb.2010.0973
Figueredo, A. J., de Baca, T. C., & Woodley, M. A. (2013). The measurement of human life history strategy. Personality and Individual Differences, 55, 251–255. doi:10.1016/ j.paid.2012.04.033
Finkel, D., Reynolds, C. A., McArdle, J. J., & Pedersen, N. L. (2007). Cohort differences in trajectories of cognitive aging. Journals of Gerontology Series B: Psychological Sciences & Social Sciences, 62, 286–294. doi:10.1093/geronb/62.5.P286
Flynn, J. R. (1984). The mean IQ of Americans: Massive gains 1932 to 1978. Psychological Bulletin, 95, 29–51. doi:10.1037//0033-2909.95.1.29
Flynn, J. R. (1987). Massive IQ gains in 14 nations: What IQ tests really measure. Psychological Bulletin, 101, 171–191. doi:10.1037//0033-2909.101.2.171
Flynn, J. R. (1990). Massive IQ gains on the Scottish WISC: Evidence against Brand et al.’s hypothesis. Irish Journal of Psychology, 11, 41–51. doi:10.1080/03033910.1990.10557787
Flynn, J. R. (1994). IQ gains over time. In R. J. Sternberg (Ed.), The encyclopedia of human intelligence (pp. 617–623). New York, NY: Macmillan.
Flynn, J. R. (1998). Israeli military IQ tests: Gender differences small; IQ gains large. Journal of Biosocial Science, 30, 541–553. doi:10.1017/S0021932098005410
Flynn, J. R. (1999). Searching for justice: The discovery of IQ gains over time. American Psychologist, 54, 5–20. doi:10.1037//0003-066X.54.1.5
Flynn, J. R. (2007). Capital offenders and the death sentence: A scandal that must be addressed. Psychology in Mental Retardation and Developmental Disabilities, 32, 3–7.
Flynn, J. R. (2009a). The WAIS–III and WAIS–IV: Daubert motions favor the certainly false over the
at University of Minnesota Libraries on June 14, 2015pps.sagepub.comDownloaded from
304 Pietschnig, Voracek
approximately true. Applied Neuro psychology, 16, 98–104. doi:10.1080/09084280902864360
Flynn, J. R. (2009b). What is intelligence? Beyond the Flynn effect (Expanded paperback ed.). Cambridge, England: Cambridge University Press.
Flynn, J. R. (2010). Problems with IQ gains: The huge vocabu-lary gap. Journal of Psychoeducational Assessment, 28, 412–433. doi:10.1177/0734282910373342
Flynn, J. R. (2012). Are we getting smarter? Rising IQ in the twenty-first century. New York, NY: Cambridge University Press.
Fuggle, P. W., Tokar, S., Grant, D. B., & Smith, I. (1992). Rising IQ scores in British children: Recent evidence. Journal of Child Psychology and Psychiatry and Allied Disciplines, 33, 1241–1247. doi:10.1111/j.1469-7610.1992.tb00942.x
Girod, M., & Allaume, G. (1976). L’evolution du niveau intel-lectuel de la population francaise pendent le dernier quart de siecle [The evolution of the intellectual level of the French population during the last quarter of the century]. International Review of Applied Psychology, 25, 121–123. doi:10.1111/j.1464-0597.1976.tb00863.x
Gorey, K. M. (2001). Early childhood education: A meta-analytic affirmation of the short- and long-term benefits of educa-tional opportunities. School Psychology Quarterly, 16, 9–30. doi:10.1521/scpq.16.1.9.19163
Greiffenstein, M. F. (2011). Secular IQ increases by epigen-esis? The hypothesis of cognitive genotype optimization. Psychological Reports, 109, 353–366. doi:10.2466/03.04.10.19 .PR0.109.5.353-366
Herrnstein, R. J., & Murray, C. (1996). The bell curve: Intelligence and class structure in American society. New York, NY: Simon & Schuster.
Holliday, M. A. (1986). Body composition and energy needs during growth. In F. Falkner & J. M. Tanner (Eds.), Human growth: A comprehensive treatise (pp. 101–117). New York, NY: Plenum.
Howard, R. W. (1999). Preliminary real-world evidence that average human intelligence really is rising. Intelligence, 27, 235–250. doi:10.1016/S0160-2896(99)00018-5
Howard, R. W. (2001). Searching the real world for signs of rising population intelligence. Personality and Individual Differences, 30, 1039–1058. doi:10.1016/S0191-8869(00)00095-7
Howard, R. W. (2005). Objective evidence of rising popula-tion ability: A detailed examination of longitudinal chess data. Personality and Individual Differences, 38, 347–363. doi:10.1016/j.paid.2004.04.013
Hudson, D. J. (1966). Fitting segmented curves whose join points have to be estimated. Journal of the American Statistical Association, 61, 1097–1129. doi:10.1080/01621459 .1966.10482198
Hunt, E. (2011). Human intelligence. Cambridge, England: Cambridge University Press.
Husén, T., & Tuijnman, A. (1991). The contribution of formal schooling to the increase in intellectual capital. Educational Researcher, 20, 17–25. doi:10.3102/0013189X020007017
Jensen, A. R. (1998). The g factor: The science of mental ability. Westport, CT: Praeger.
Johnson, W., Bouchard, T. J., Jr., Krueger, R. F., McGue, M., & Gottesman, I. I. (2004). Just one g: Consistent results from
three test batteries. Intelligence, 32, 95–107. doi:10.1016/S0160-2896(03)00062-X
Kanaya, T., & Ceci, S. J. (2007). Are all IQ scores created equal? The differential costs of IQ cutoff scores for at-risk children. Child Development Perspectives, 1, 52–56. doi:10.1111/j.1750-8606.2007.00010.x
Kant, A. K., & Graubard, B. I. (2006). Secular trends in the associa-tion of socio-economic position with self-reported dietary attri-butes and biomarkers in the US population: National Health and Nutrition Examination Survey (NHANES) 1971–1975 to NHANES 1999–2002. Public Health Nutrition, 10, 158–167.
Kaufman, A. S., Zhou, X., Reynolds, M. R., Kaufman, N. L., Green, G. P., & Weiss, L. G. (2014). The possible societal impact of the decrease in U.S. blood lead levels on adult IQ. Environmental Research, 132, 413–420. doi:10.1016/ j.envres.2014.04.015
Khaleefa, O., Abdelwahid, S. B., Abdulradi, F., & Lynn, R. (2008). The increase of intelligence in Sudan 1964–2006. Personality and Individual Differences, 45, 412–413.
Kim, H.-J., Fay, M. P., Feuer, E. J., & Midthune, D. N. (2000). Permutation tests for joinpoint regression with applica-tions to cancer rates. Statistics in Medicine, 19, 335–351. doi:10.1002/sim.811
Kim, H.-J., Yu, B., & Feuer, E. J. (2008). Inference in seg-mented line regression: A simulation study. Journal of Statistical Computation and Simulation, 78, 1087–1103. doi:10.1080/00949650701528461
Koller, K., Brown, T., Spurgeon, A., & Levy, L. (2004). Recent developments in low-level lead exposure and intellectual impairment in children. Environmental Health Perspectives, 112, 987–994.
Lerman, P. M. (1980). Fitting segmented regression models by grid search. Applied Statistics, 29, 77–84. doi:10.2307/2346413
Liu, J., & Lynn, R. (2013). An increase of intelligence in China 1986-2012. Intelligence, 41, 479–481. doi:10.1016/ j.intell.2013.06.017
Loehlin, J. C. (2002). The IQ paradox: Resolved? Still an open question. Psychological Review, 109, 754–758. doi:10.1037/0033-295X.109.4.754
Lovei, M. (1998). Phasing out lead from gasoline: Worldwide experiences and policy implications (World Bank Technical Paper No. 397). Washington, DC: World Bank.
Lucas, A., Morley, R., & Cole, T. J. (1998). Randomised trial of early diet in preterm babies and later intelligence quo-tient. British Medical Journal, 317, 1481–1487. doi:10.1136/bmj.317.7171.1481
Lynn, R. (1989). Positive correlation between height, head size and IQ: A nutrition theory of the secular increases in intelligence. British Journal of Educational Psychology, 59, 372–377. doi:10.1111/j.2044-8279.1989.tb03112.x
Lynn, R. (1990). The role of nutrition in secular increases in intelligence. Personality and Individual Differences, 11, 273–285. doi:10.1016/0191-8869(90)90241-I
Lynn, R. (2009a). Fluid intelligence but not vocabulary has increased in Britain, 1979-2008. Intelligence, 37, 249–255. doi:10.1016/j.intell.2008.09.007
Lynn, R. (2009b). What has caused the Flynn effect? Secular increases in the development quotient of infants. Intelligence, 37, 16–24. doi:10.1016/j.intell.2008.07.008
at University of Minnesota Libraries on June 14, 2015pps.sagepub.comDownloaded from
Meta-Analysis of the Flynn Effect 305
Lynn, R. (2011). Dysgenics: Genetic deterioration in modern populations. Westport, CT: Praeger.
Lynn, R. (2013). Who discovered the Flynn effect? A review of early studies of the secular increase of intelligence. Intelligence, 41, 765–769. doi:10.1016/j.intell.2013.03.004
Lynn, R., & Hampson, S. (1986). The rise of national intelligence: Evidence from Britain, Japan and the U.S.A. Personality and Individual Differences, 7, 23–32. doi:10.1016/0191-8869(86)90104-2
Lynn, R., & Vanhanen, T. (2002). IQ and the wealth of nations. Westport, CT: Praeger.
Macnamara, J. (1964). Zero error and practice effects in Moray House English quotients. British Journal of Educational Psychology, 34, 315–320.
Mahlberg, A. (1997). The rise in IQ scores. American Psychologist, 52, 71. doi:10.1037/0003-066X.52.1.71
McArdle, J. J., Ferrer-Caja, E., Hamagami, F., & Woodcock, R. W. (2002). Comparative longitudinal structural analyses of the growth and decline of multiple intellectual abilities over the life span. Developmental Psychology, 38, 115–142. doi:10.1037/0012-1649.38.1.115
Meisenberg, G. (2003). IQ population genetics: It’s not as sim-ple as you think. Mankind Quarterly, 44, 185–210.
Meisenberg, G., Lawless, E., Lambert, E., & Newton, A. (2005). The Flynn effect in the Caribbean: Generational change of cognitive test performance in Dominica. Mankind Quarterly, 46, 29–69.
Merrill, M. A. (1938). The significance of IQ’s on the revised Stanford-Binet scales. Journal of Educational Psychology, 29, 641–651. doi:10.1037/h0057523
Mingroni, M. A. (2004). The secular rise in IQ: Giving heterosis a closer look. Intelligence, 32, 65–83. doi:10.1016/S0160-2896(03)00058-8
Mingroni, M. A. (2007). Resolving the IQ paradox: Heterosis as a cause of the Flynn effects and other trends. Psychological Review, 114, 806–829. doi:10.1037/0033-295X.114.3.806
Must, O., & Must, A. (2013). Changes in test taking pat-terns over time. Intelligence, 41, 780–790. doi:10.1016/j.intell.2013.04.005
Must, O., Must, A., & Raudik, V. (2003). The secular rise in IQs: In Estonia, the Flynn effect is not a Jensen effect. Intelligence, 31, 461–471. doi:10.1016/S0160-2896(03)00013-8
Neisser, U. (1997). Rising scores on intelligence tests. American Scientist, 85, 440–447.
Neisser, U., Boodoo, G., Bouchard, T. J., Boykin, A. W., Brody, N., Ceci, S. J., . . . Urbina, S. (1996). Intelligence: Knowns and unknowns. American Psychologist, 5, 77–101. doi:10.1037//0003-066X.51.2.77
Nevin, R. (2000). How lead exposure relates to temporal changes in IQ, violent crime, and unwed pregnancy. Environmental Research Section A, 83, 1–22. doi:10.1006/enrs.1999.4045
Nisbett, R. E., Aronson, J., Blair, C., Dickens, W., Flynn, J., Halpern, D. F., & Turkheimer, E. (2012). Intelligence: New findings and theoretical developments. American Psychologist, 67, 130–159. doi:10.1037/a0026699
Pietschnig, J., Tran, U. S., & Voracek, M. (2013). Item-response theory modeling of IQ gains (the Flynn effect) on crys-tallized intelligence: Rodger’s hypothesis yes, Brands’ hypothesis perhaps. Intelligence, 41, 791–801. doi:10.1016/ j.intell.2013.06.005
Pietschnig, J., Voracek, M., & Formann, A. K. (2010). Pervasiveness of the IQ rise: A cross-temporal meta-analy-sis. PLoS ONE, 5, e14406. doi:10.1371/journal.pone.0014406
Pietschnig, J., Voracek, M., & Formann, A. K. (2011). Female Flynn effects: No sex differences in generational IQ gains. Personality and Individual Differences, 50, 759–762. doi:10.1016/j.paid.2010.12.019
Pietschnig, J., Zeiler, M., & Voracek, M. (2011, July). The bigger they are, the higher they score: Meta-analyzing associations of in vivo brain volume and IQ. Paper presented at the International Society for the Study of Individual Differences 2011, London, England.
Pilliner, A. E. G., Sutherland, J., & Taylor, E. G. (1960). Zero error in Moray House verbal reasoning tests. British Journal of Educational Psychology, 30, 53–62.
Raven, J. C. (1938). Standardization of progressive matrices, 1938. British Journal of Medical Psychology, 19, 137–150.
R Development Core Team. (2014). R: A language and environ-ment for statistical computing (Version 3.1.1) [Computer soft-ware]. Vienna, Austria: R Foundation for Statistical Computing.
Rindermann, H. (2008). Relevance of education and intelligence at the national level for the economic welfare of people. Intelligence, 36, 127–142. doi:10.1016/j.intell.2007.02.002
Rindermann, H. (2012). Intellectual classes, technological prog-ress and economic development: The rise of cognitive capi-talism. Personality and Individual Differences, 53, 108–113. doi:10.1016/j.paid.2011.07.001
Rindermann, H., & Thompson, J. (2013). Ability rise in NAEP and narrowing ethnics gap? Intelligence, 41, 821–831. doi:10.1016/j.intell.2013.06.016
Rodgers, J. L. (1999). A critique of the Flynn effect: Massive IQ gains, methodological artifacts, or both? Intelligence, 26, 337–356. doi:10.1016/S0160-2896(99)00004-5
Rowe, D. C., & Rodgers, J. L. (2002). Expanding variance and the case of historical changes in IQ means: A critique of Dickens and Flynn (2001). Psychological Review, 109, 759–763. doi:10.1037/0033-295X.109.4.759
Rushton, J. P. (1997). Cranial size and IQ in Asian Americans from birth to age seven. Intelligence, 25, 7–20. doi:10.1016/S0160-2896(97)90004-0
Rushton, J. P. (1999). Secular gains in IQ are not related to the g factor and inbreeding depression—Unlike Black–White differences: A reply to Flynn. Personality and Individual Differences, 26, 381–389. doi:10.1016/S0191-8869(98)00148-2
Rushton, J. P., & Jensen, A. R. (2005). Thirty years of research on race differences in cognitive ability. Psychology, Public Policy, and Law, 11, 235–294. doi:10.1037/1076-8971.11.2.235
Schaie, K. W., & Strother, C. R. (1968). A cross-sequential study of age changes in cognitive behavior. Psychological Bulletin, 70, 671–680. doi:10.1037/h0026811
Schooler, C. (1998). Environmental complexity and the Flynn effect. In U. Neisser (Ed.), The rising curve: Long-term gains in IQ and related measures (pp. 67–79). Washington, DC: American Psychological Association. doi:10.1037/10270-002
Schubert, M. T., & Berlach, G. (1982). Neue Richtlinien zur Interpretation des Hamburg-Wechsler-Intelligenztests für Kinder (HAWIK) [New guidelines for the interpretation
at University of Minnesota Libraries on June 14, 2015pps.sagepub.comDownloaded from

306 Pietschnig, Voracek
of the Hamburg-Wechsler Intelligence Test for Children (HAWIK)]. Zeitschrift für Klinische Psychologie, 11, 253–279.
Smits, I. A. M., Dolan, C. V., Vorst, H. C. M., & Wicherts, J. M. (2011). Cohort differences in Big Five personality factors over a period of 25 years. Journal of Personality and Social Psychology, 100, 1124–1138. doi:10.1037/a0022874
Staff, R. T., Hogan, M. J., & Whalley, L. J. (2014). Aging trajec-tories of fluid intelligence in late life: The influence of age, practice and childhood IQ on Raven’s Progressive Matrices. Intelligence, 47, 194–201. doi:10.1016/j.intell.2014.09.013
Statistical Research and Applications Branch. (2011). Joinpoint Regression Program (Version 3.5.2) [Computer software]. Rockville, MD: National Cancer Institute.
Steen, R. G. (2009). Human intelligence and medical illness: Assessing the Flynn effect. New York, NY: Springer.
Stern, W. (1912). Die psychologischen Methoden der Intelligenzprüfung und deren Anwendung an Schulkindern [The psychological methods of intelligence testing and their applications in students]. Leipzig, Germany: Barth.
Storfer, M. (1999). Myopia, intelligence, and the expanding human neocortex: Behavioral influences and evolutionary implications. International Journal of Neuroscience, 98, 153–276. doi:10.3109/00207459908997465
Storfer, M. D. (1990). Intelligence and giftedness: The contribu-tions of heredity and early environment. San Francisco, CA: Jossey Bass.
Sundet, J. M., Barlaug, D. G., & Torjussen, T. M. (2004). The end of the Flynn effect? A study of secular trends in mean intelli-gence test scores of Norwegian conscripts during half a cen-tury. Intelligence, 38, 38–44. doi:10.1016/j.intell.2004.06.004
Surani, M. A., Barton, S. C., & Norris, M. L. (1984). Development of reconstituted mouse eggs suggests imprinting of the genome during gametogenesis. Nature, 308, 548–550. doi:10.1038/308548a0
Teasdale, T. W., & Owen, D. R. (1987). National secular trends in intelligence and education: A twenty-year cross-sectional study. Nature, 325, 119–121. doi:10.1038/325119a0
Teasdale, T. W., & Owen, D. R. (2005). A long-term rise and recent decline in intelligence test performance: The Flynn effect in reverse. Personality and Individual Differences, 39, 837–843. doi:10.1016/j.paid.2005.01.029
Te Nijenhuis, J. (2013). The Flynn effect, group differences, and g loadings. Personality and Individual Differences, 55, 224–228. doi:10.1016/j.paid.2011.12.023
Te Nijenhuis, J., & van der Flier, H. (2013). Is the Flynn effect on g? A meta-analysis. Intelligence, 41, 802–807. doi:10.1016/j.intell.2013.03.001
Terman, L. M. (1921). Mental growth and the IQ. Journal of Educational Psychology, 12, 325–341.
Thompson, J. (2012). Richard Lynn’s contribution to personal-ity and intelligence. Personality and Individual Differences, 53, 157–161. doi:10.1016/j.paid.2011.03.013
Tuddenham, R. D. (1948). Soldier intelligence in World Wars I and II. American Psychologist, 3, 54–56. doi:10.1037/h0054962
Twenge, J. M. (2000). The age of anxiety? Birth cohort change in anxiety and neuroticism, 1952–1993. Journal of Personality
and Social Psychology, 79, 1007–1021. doi:10.1037/0022-3514.79.6.1007
Twenge, J. M. (2001). Birth cohort changes in extraversion: A cross-temporal meta-analysis, 1966–1993. Personality and Individual Differences, 30, 735–748. doi:10.1016/S0191-8869(00)00066-0
Twenge, J. M., & Zhang, L. Q. (2004). It’s beyond my control: A cross-temporal meta-analysis of increasing externality in locus of control, 1960–2002. Personality and Social Psychology Review, 8, 308–319. doi:10.1207/s15327957pspr0803_5
Uttl, B., & Van Alstine, C. L. (2003). Rising verbal intelligence scores: Implications for research and clinical practice. Psychology and Aging, 18, 616–621. doi:10.1037/0882-7974.18.3.616
Wechsler, D. (1981). Wechsler Adult Intelligence Scale—Revised. New York, NY: The Psychological Corporation.
Wichman, A. L., Rodgers, J. L., & MacCallum, R. C. (2006). A multilevel approach to the relationship between birth order and intelligence. Personality and Social Psychology Bulletin, 32, 117–127. doi:10.1177/0146167205279581
Williams, R. L. (2013). Overview of the Flynn effect. Intelligence, 41, 753–764. doi:10.1016/j.intell.2013.04.010
Williams, W. M. (1998). Are we raising smarter children today? School- and home-related influences on IQ. In U. Neisser (Ed.), The rising curve: Long-term gains in IQ and related measures (pp. 125–154). Washington, DC: American Psychological Association. doi:10.1037/10270-004
Woodley, M. A. (2011). Heterosis doesn’t cause the Flynn effect: A critical examination of Mingroni (2007). Psychological Review, 118, 689–693. doi:10.1037/a0024759
Woodley, M. A. (2012a). A life history model of the Lynn-Flynn effect. Personality and Individual Differences, 53, 152–156. doi:10.1016/j.paid.2011.03.028
Woodley, M. A. (2012b). The social and scientific temporal correlates of genotypic intelligence and the Flynn effect. Intelligence, 40, 189–204. doi:10.1016/j.intell.2011.12.002
Woodley, M. A., Figueredo, A. J., Brown, S. D., & Ross, K. C. (2013). Four successful tests of the cognitive differentia-tion-integration effort hypothesis. Intelligence, 41, 832–842. doi:10.1016/j.intell.2013.02.002
Woodley, M. A., & Madison, G. (2013). Establishing an asso-ciation between the Flynn effect and ability differentia-tion. Personality and Individual Differences, 55, 387–390. doi:10.1016/j.paid.2013.03.016
Woodley, M. A., & Meisenberg, G. (2013). In the Netherlands the anti-Flynn effect is a Jensen effect. Personality and Individual Differences, 54, 871–876. doi:10.1016/j.paid .2012.12.022
Woodley, M. A., Te Nijenhuis, J., Must, O., & Must, A. (2014). Controlling for increased guessing enhances the indepen-dence of the Flynn effect from g: The return of the Brand effect. Intelligence, 43, 27–34. doi:10.1016/j.intell.2013.12.004
World Bank. (2014). Databank: Fertility rate, total (births per woman). Washington, DC: Author. Retrieved from http://data.worldbank.org/indicator/SP.DYN.TFRT.IN
Zajonc, R. B., & Mullally, P. R. (1997). Birth order: Reconciling conflicting effects. American Psychologist, 52, 685–699. doi:10.1037/0003-066X.52.7.685
at University of Minnesota Libraries on June 14, 2015pps.sagepub.comDownloaded from