Embed Size (px)
Citation preview
22nd Annual 22nd Annual Cancer Progress ConferenceCancer Progress Conference
Oncology Market Overview: Barriers, Challenges and Value
• Bill Bagwell, RPh, Senior Vice President, Clinical and Scientific Assessment, Kantar Health
• Rhoda Dunn, Account Director, Market Access, Kantar Health
1
ONCOLOGY MARKET OVERVIEW: BARRIERS, CHALLENGES AND VALUECancer Progress
March 9, 2011
© Copyright 2011 Kantar Health
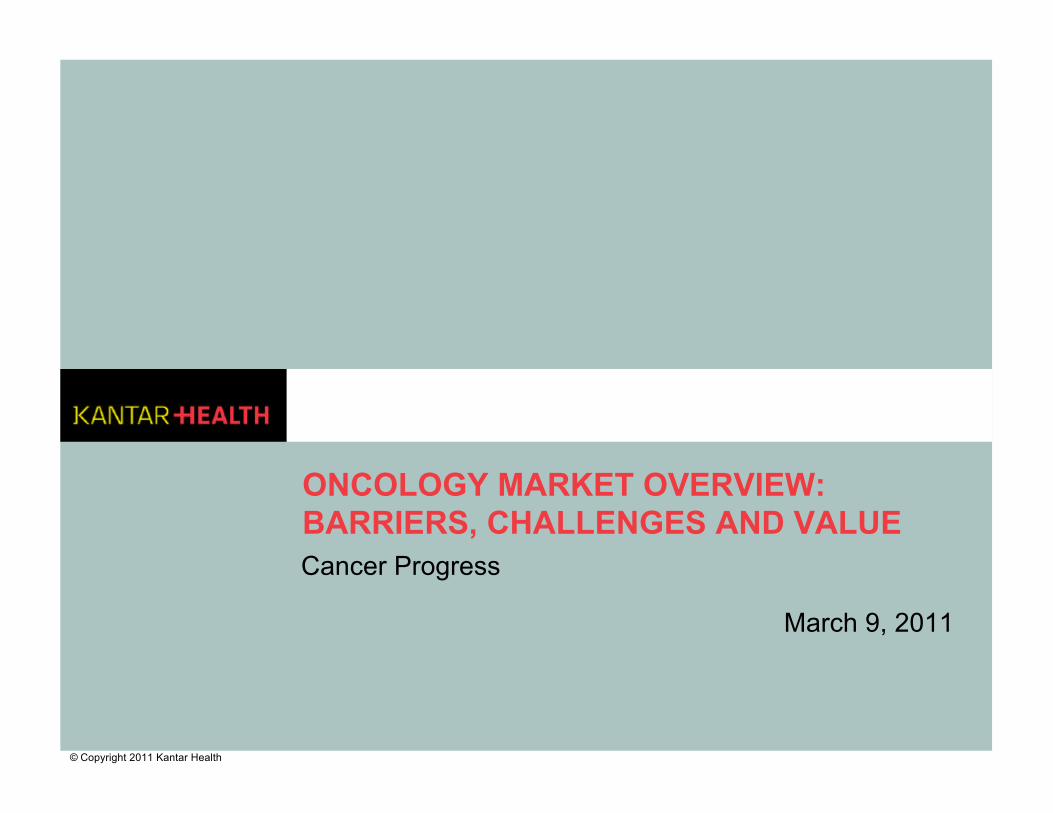
KRAS
3© Copyright 2011 Kantar Health
EML4-ALKMAGE-3A
PARP
PI3
B-RAF
CD20
IGF-1R
ALK / c-Met
CYP17A1

CMS
4© Copyright 2011 Kantar Health
CERNICE
CT
AHRQ
PCORI
ICER
HEOR
HTA
QALY

Agenda
• Increasing prevalence in cancer offset by economic challenges and increasing competition
• R&D’s contribution to commercial success: Safety, efficacy and pharmacoeconomics
• Nothing in life is free… especially not pricing
5
© Copyright 2011 Kantar Health
INCREASING PREVALENCE IN CANCER OFFSET BY ECONOMIC CHALLENGES AND INCREASING COMPETITION
6
© Copyright 2011 Kantar Health
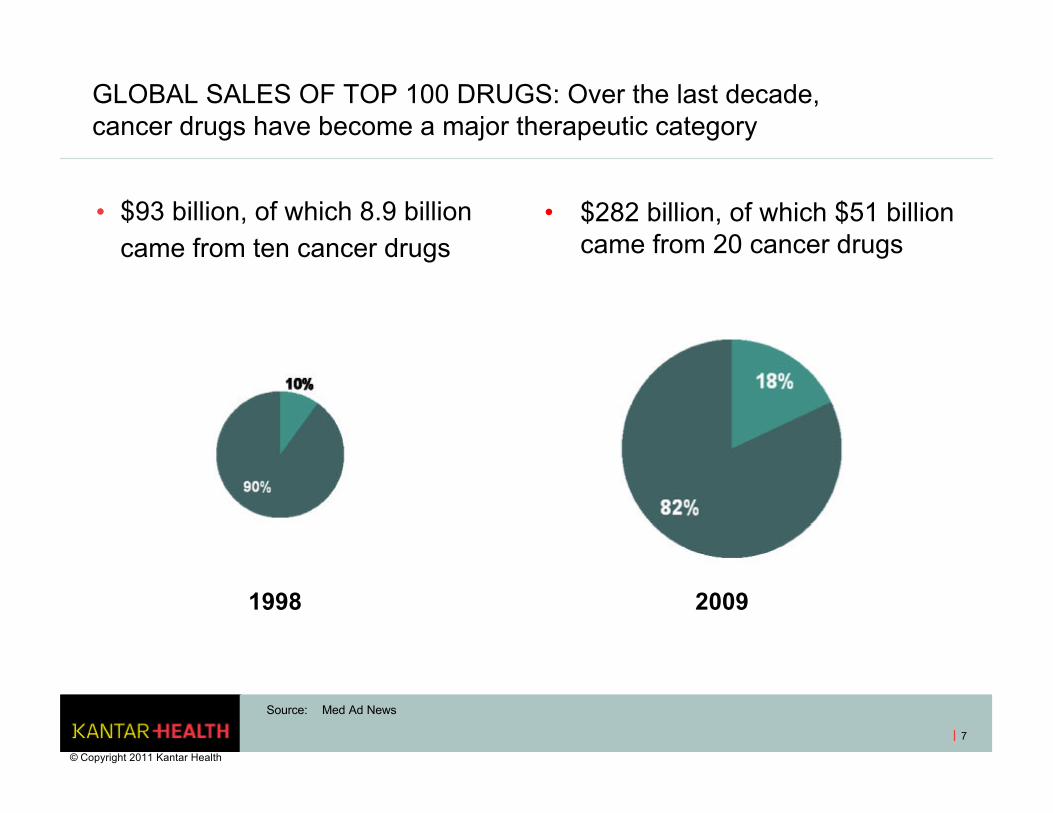
GLOBAL SALES OF TOP 100 DRUGS: Over the last decade, cancer drugs have become a major therapeutic category
7
• $93 billion, of which 8.9 billion came from ten cancer drugs
• $282 billion, of which $51 billion came from 20 cancer drugs
Source: Med Ad News
© Copyright 2011 Kantar Health
1998 2009

REVENUE PER CANCER PATIENT FUELS INNOVATION: But how sustainable is this growth?
8
Tot
al R
xs (
000s
) Ave. R
x Price ($ per R
x)
Note: Total Rx data in $ thousands, average price data $, for Top 10 branded products: Femara, Aromasin, Xeloda, Gleevec, Tarceva, Temodar, Sutent, Sprycel, Tykerb and Avastin
Source: Wolters Kluwer Source® Pharmaceutical Audit, Retail channel, © Copyright 2011 Kantar Health
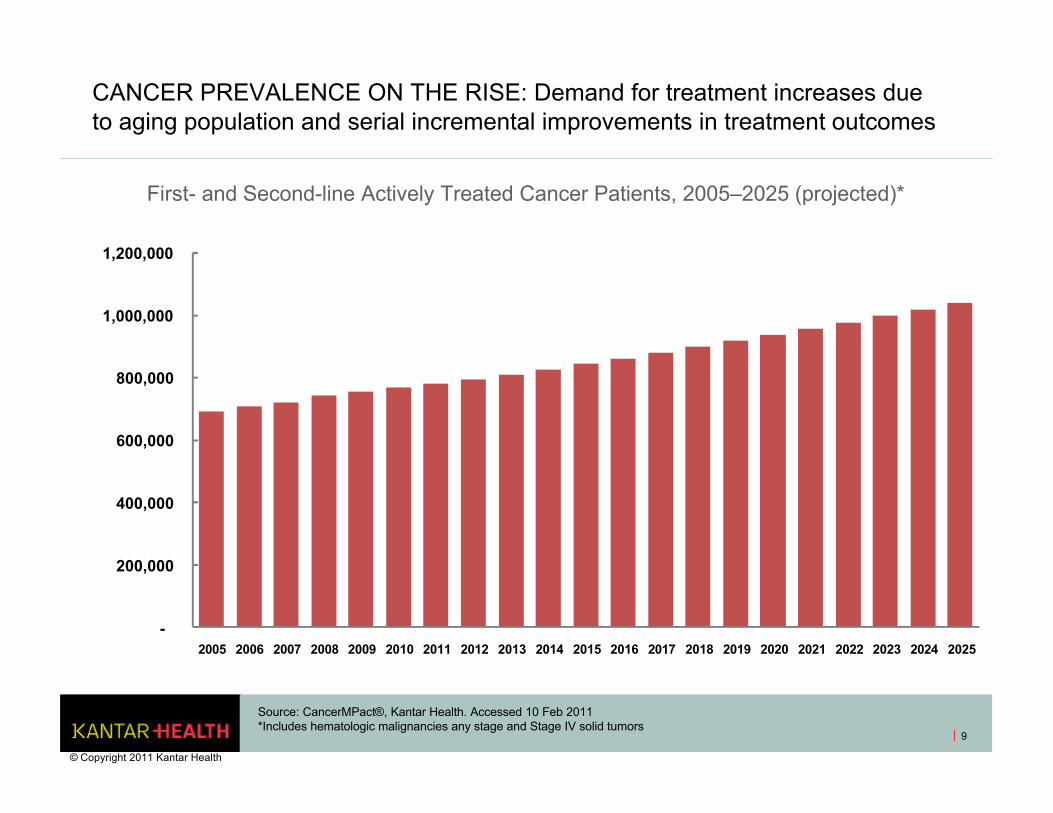
CANCER PREVALENCE ON THE RISE: Demand for treatment increases due to aging population and serial incremental improvements in treatment outcomes
9
-
200,000
400,000
600,000
800,000
1,000,000
1,200,000
2005 2006 2007 2008 2009 2010 2011 2012 2013 2014 2015 2016 2017 2018 2019 2020 2021 2022 2023 2024 2025
Source: CancerMPact®, Kantar Health. Accessed 10 Feb 2011*Includes hematologic malignancies any stage and Stage IV solid tumors
First- and Second-line Actively Treated Cancer Patients, 2005–2025 (projected)*
© Copyright 2011 Kantar Health
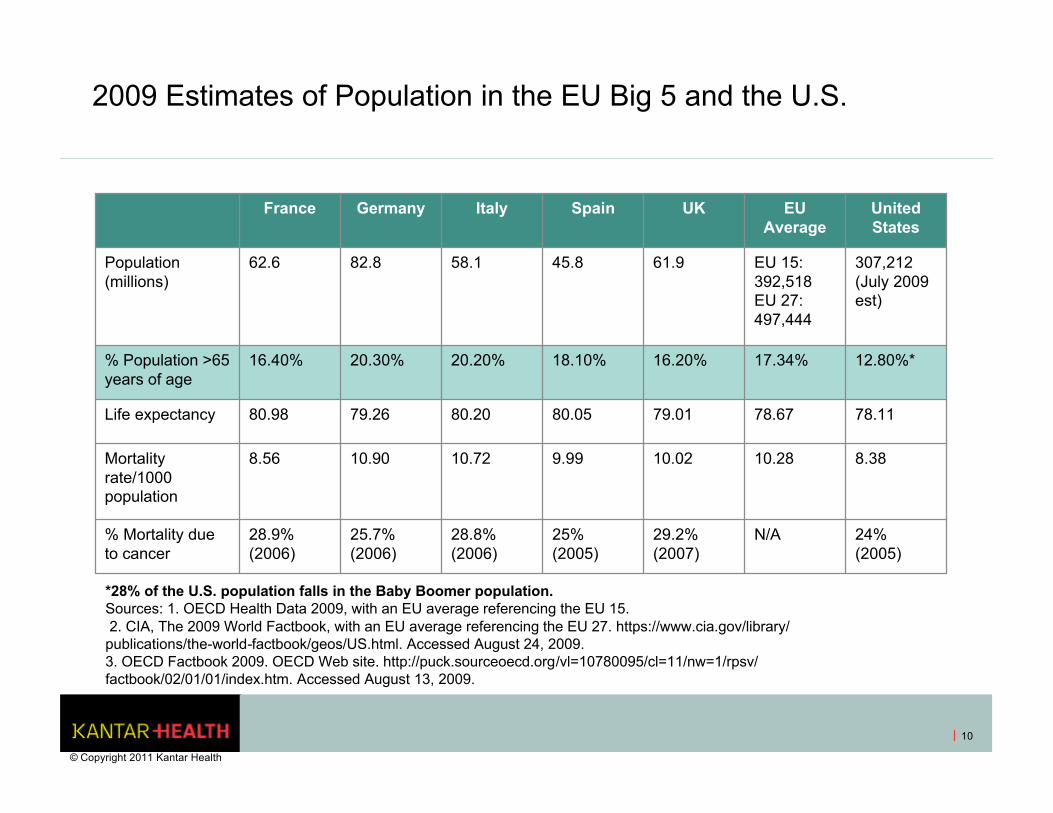
2009 Estimates of Population in the EU Big 5 and the U.S.
France Germany Italy Spain UK EU Average
United States
Population (millions)
62.6 82.8 58.1 45.8 61.9 EU 15: 392,518EU 27: 497,444
307,212 (July 2009 est)
% Population >65 years of age
16.40% 20.30% 20.20% 18.10% 16.20% 17.34% 12.80%*
Life expectancy 80.98 79.26 80.20 80.05 79.01 78.67 78.11
Mortality rate/1000 population
8.56 10.90 10.72 9.99 10.02 10.28 8.38
% Mortality due to cancer
28.9% (2006)
25.7% (2006)
28.8% (2006)
25% (2005)
29.2% (2007)
N/A 24% (2005)
*28% of the U.S. population falls in the Baby Boomer population.Sources: 1. OECD Health Data 2009, with an EU average referencing the EU 15.2. CIA, The 2009 World Factbook, with an EU average referencing the EU 27. https://www.cia.gov/library/
publications/the-world-factbook/geos/US.html. Accessed August 24, 2009. 3. OECD Factbook 2009. OECD Web site. http://puck.sourceoecd.org/vl=10780095/cl=11/nw=1/rpsv/factbook/02/01/01/index.htm. Accessed August 13, 2009.
10
© Copyright 2011 Kantar Health
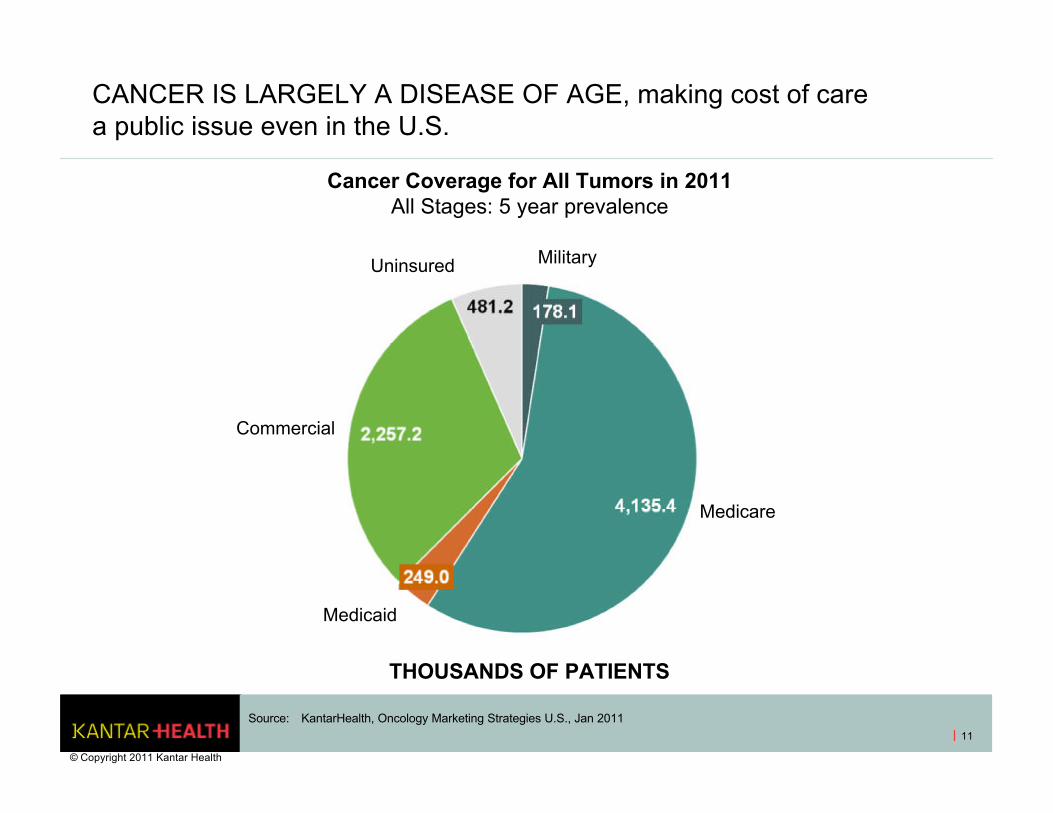
CANCER IS LARGELY A DISEASE OF AGE, making cost of care a public issue even in the U.S.
11
Commercial
Uninsured Military
Medicare
Medicaid
Cancer Coverage for All Tumors in 2011All Stages: 5 year prevalence
Source: KantarHealth, Oncology Marketing Strategies U.S., Jan 2011
© Copyright 2011 Kantar Health
THOUSANDS OF PATIENTS
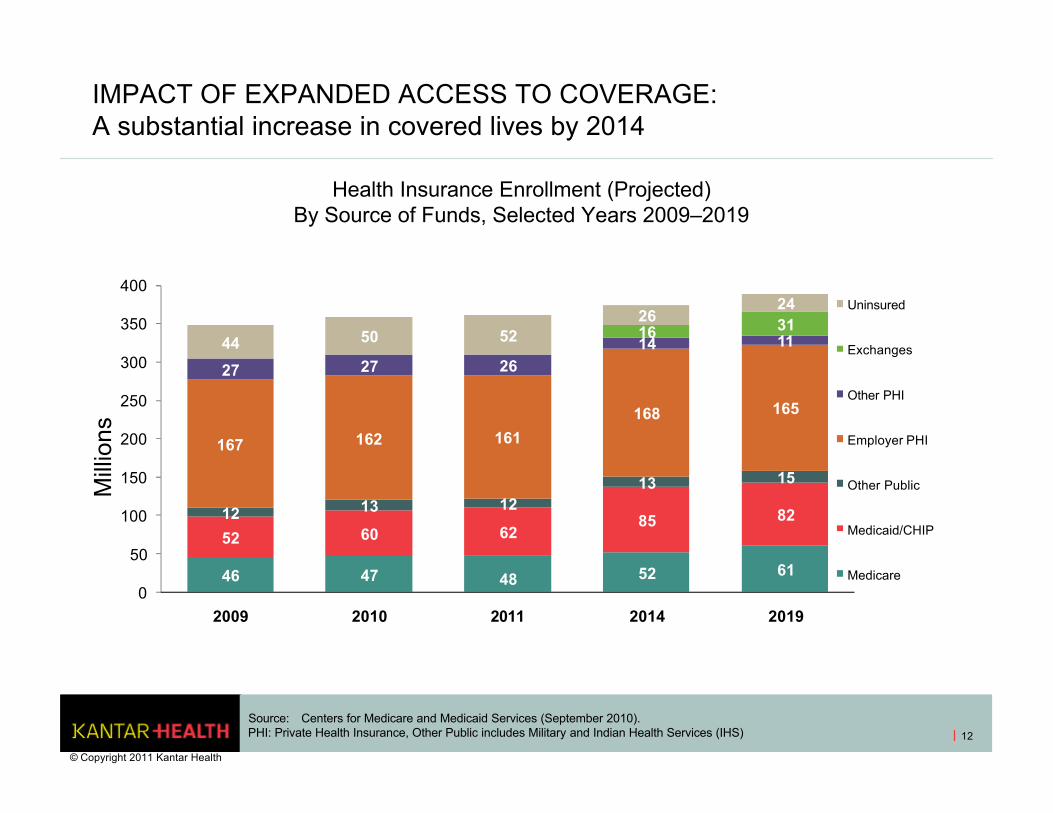
IMPACT OF EXPANDED ACCESS TO COVERAGE: A substantial increase in covered lives by 2014
12
Source: Centers for Medicare and Medicaid Services (September 2010).PHI: Private Health Insurance, Other Public includes Military and Indian Health Services (IHS)
46 47 48 52 61
52 60 6285 8212 13 1213 15
167 162 161
168 165
27 27 2614 1116 31
44 50 5226
24
0
50
100
150
200
250
300
350
400
2009 2010 2011 2014 2019
Uninsured
Exchanges
Other PHI
Employer PHI
Other Public
Medicaid/CHIP
Medicare
Health Insurance Enrollment (Projected)By Source of Funds, Selected Years 2009–2019
Mill
ions
© Copyright 2011 Kantar Health
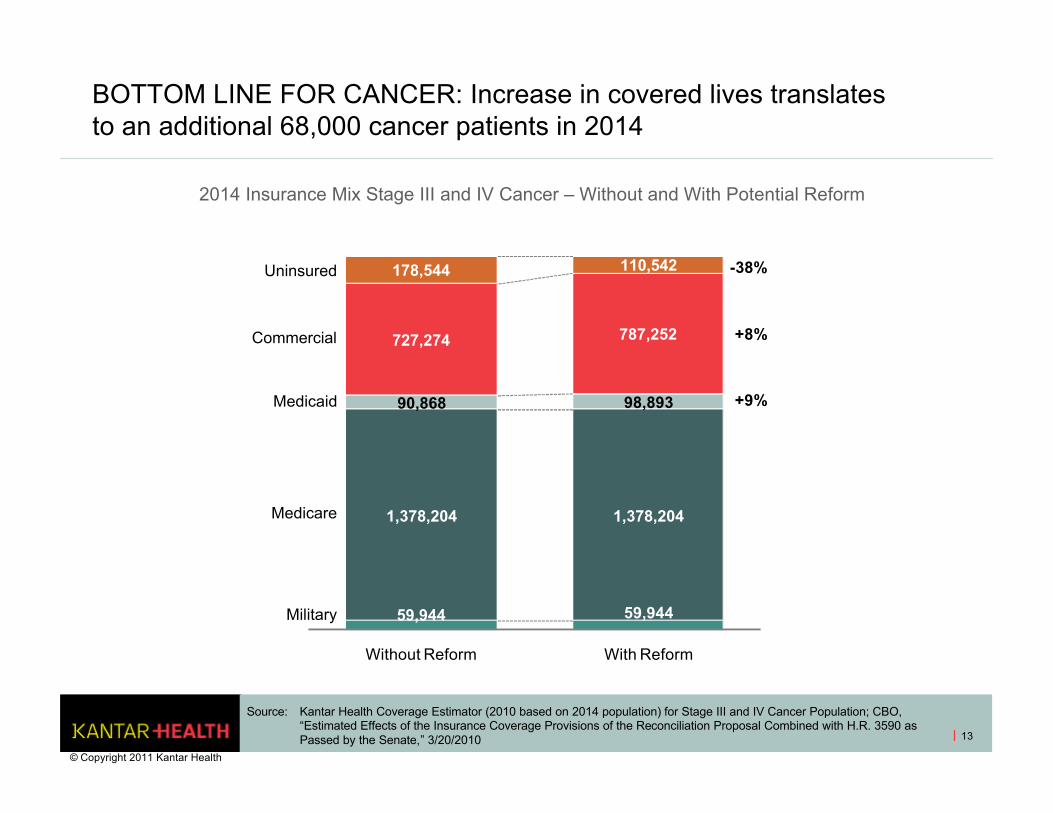
BOTTOM LINE FOR CANCER: Increase in covered lives translates to an additional 68,000 cancer patients in 2014
13
2014 Insurance Mix Stage III and IV Cancer – Without and With Potential Reform
59,944 59,944
1,378,204 1,378,204
90,868 98,893
727,274 787,252
178,544 110,542
Without Reform With Reform
Military
Medicare
Medicaid
Commercial
Uninsured
+9%
-38%
+8%
Source: Kantar Health Coverage Estimator (2010 based on 2014 population) for Stage III and IV Cancer Population; CBO, “Estimated Effects of the Insurance Coverage Provisions of the Reconciliation Proposal Combined with H.R. 3590 as Passed by the Senate,” 3/20/2010
© Copyright 2011 Kantar Health
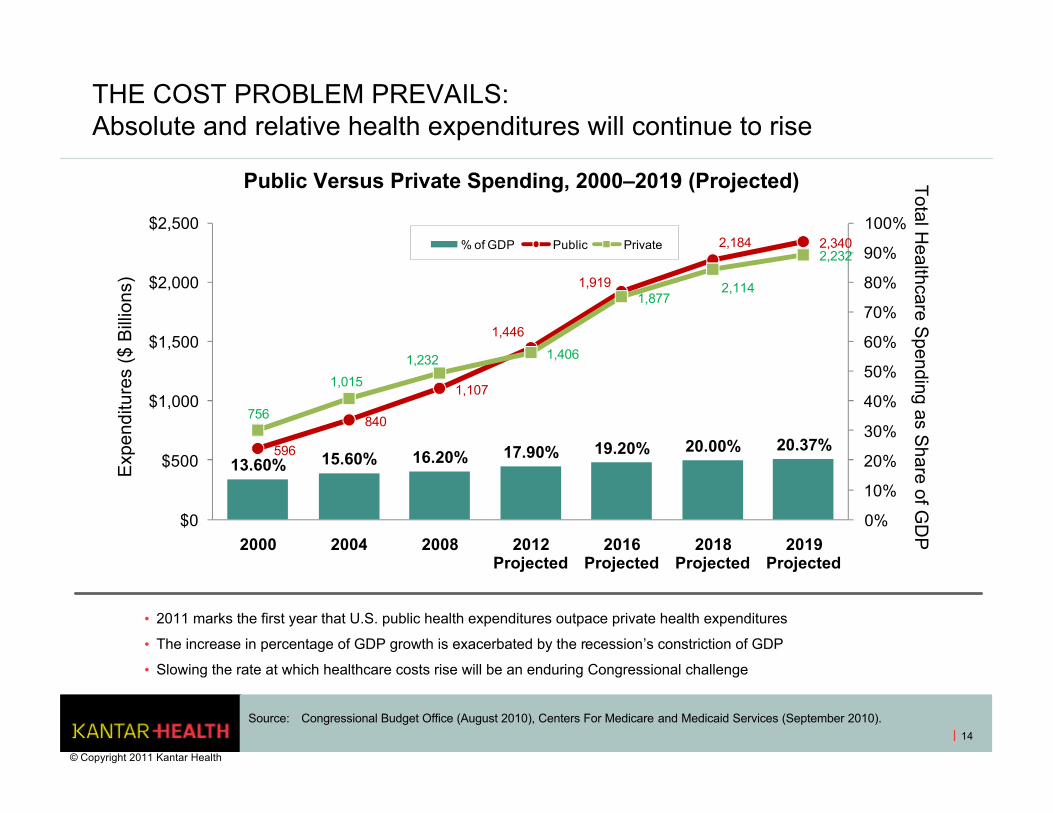
THE COST PROBLEM PREVAILS: Absolute and relative health expenditures will continue to rise
14
• 2011 marks the first year that U.S. public health expenditures outpace private health expenditures
• The increase in percentage of GDP growth is exacerbated by the recession’s constriction of GDP
• Slowing the rate at which healthcare costs rise will be an enduring Congressional challenge
13.60% 15.60% 16.20% 17.90% 19.20% 20.00% 20.37%596
840
1,107
1,446
1,919
2,184 2,340
756
1,015
1,232 1,406
1,8772,114
2,232
0%
10%
20%
30%
40%
50%
60%
70%
80%
90%
100%
$0
$500
$1,000
$1,500
$2,000
$2,500
2000 2004 2008 2012 Projected
2016 Projected
2018 Projected
2019 Projected
% of GDP Public Private
Source: Congressional Budget Office (August 2010), Centers For Medicare and Medicaid Services (September 2010).
Exp
endi
ture
s ($
Bill
ions
)T
otal Healthcare S
pending as Share of G
DP
Public Versus Private Spending, 2000–2019 (Projected)
© Copyright 2011 Kantar Health
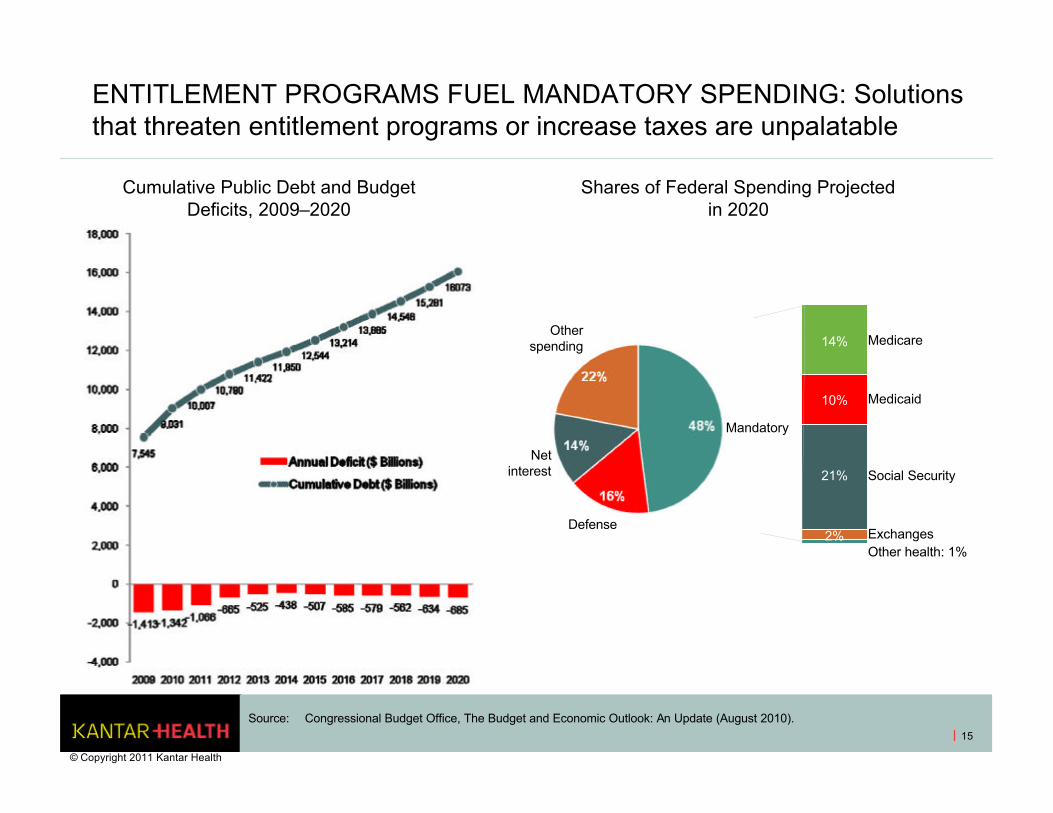
ENTITLEMENT PROGRAMS FUEL MANDATORY SPENDING: Solutions that threaten entitlement programs or increase taxes are unpalatable
15
Source: Congressional Budget Office, The Budget and Economic Outlook: An Update (August 2010).
Cumulative Public Debt and Budget Deficits, 2009–2020
Shares of Federal Spending Projected in 2020
Mandatory
Defense
Net interest
Other spending Medicare
Medicaid
Social Security
ExchangesOther health: 1%
14%
10%
21%
2%
© Copyright 2011 Kantar Health
R&D’S CONTRIBUTION TO COMMERCIAL SUCCESS: SAFETY, EFFICACY AND PHARMACOECONOMICS
© Copyright 2011 Kantar Health
16
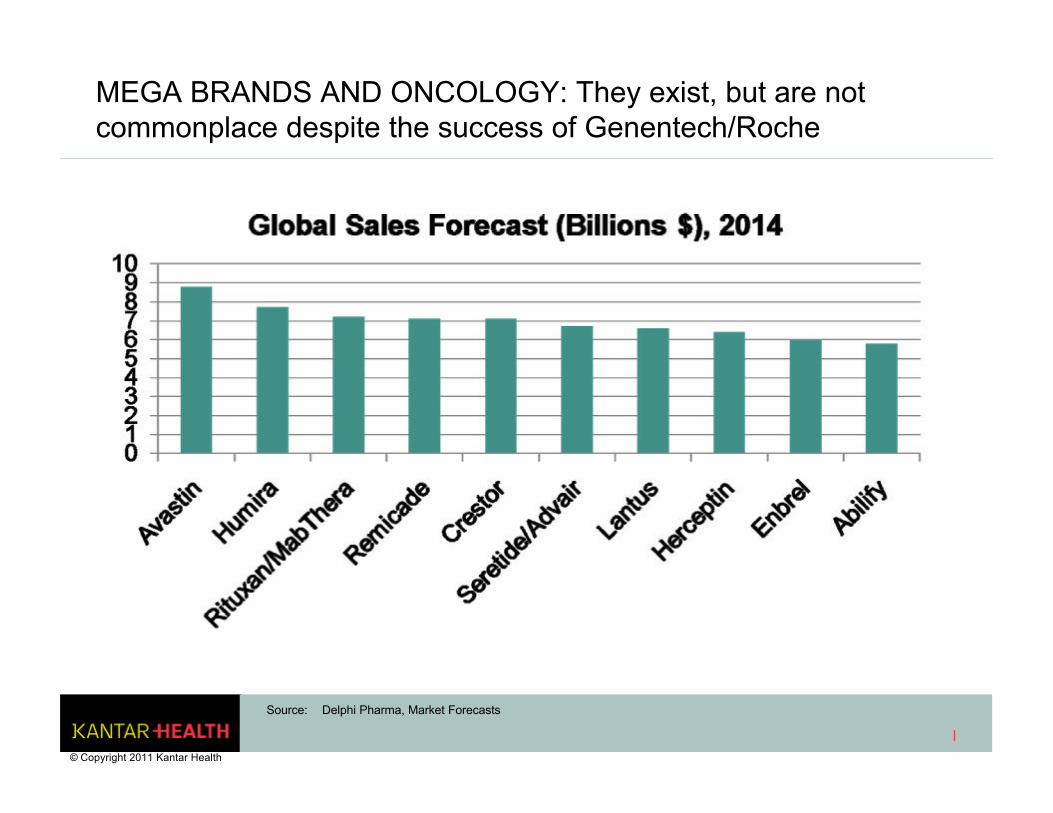
MEGA BRANDS AND ONCOLOGY: They exist, but are not commonplace despite the success of Genentech/Roche
Source: Delphi Pharma, Market Forecasts
© Copyright 2011 Kantar Health
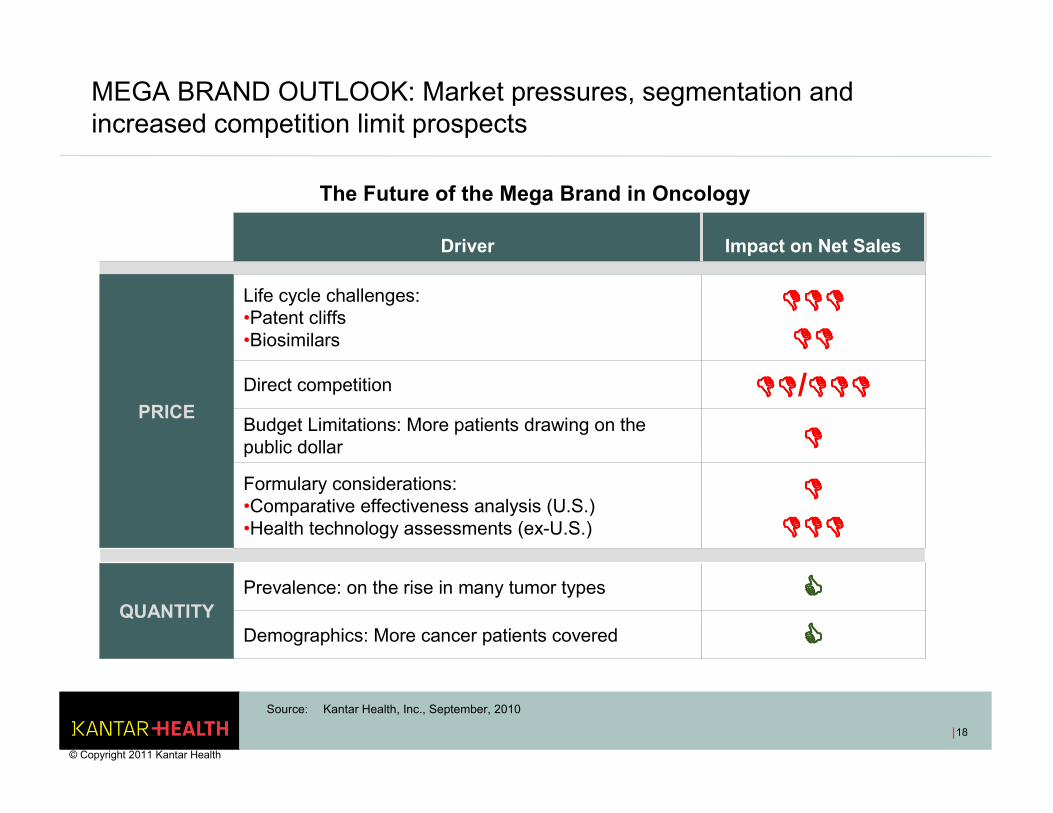
MEGA BRAND OUTLOOK: Market pressures, segmentation and increased competition limit prospects
The Future of the Mega Brand in Oncology
Source: Kantar Health, Inc., September, 2010
Driver Impact on Net Sales
PRICE
Life cycle challenges: •Patent cliffs•Biosimilars
������������
��������
Direct competition ��������/������������
Budget Limitations: More patients drawing on the public dollar ����
Formulary considerations:•Comparative effectiveness analysis (U.S.)•Health technology assessments (ex-U.S.)
����
������������
QUANTITYPrevalence: on the rise in many tumor types ����
Demographics: More cancer patients covered ����
18
© Copyright 2011 Kantar Health
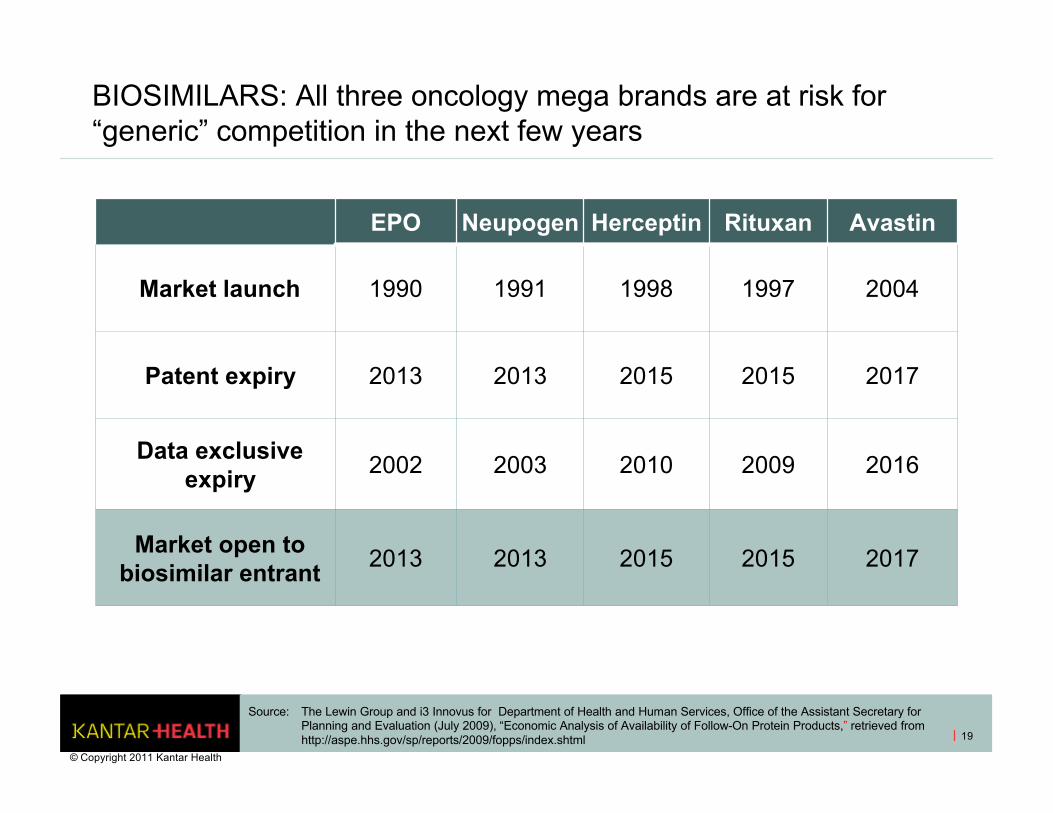
BIOSIMILARS: All three oncology mega brands are at risk for “generic” competition in the next few years
EPO Neupogen Herceptin Rituxan Avastin
Market launch 1990 1991 1998 1997 2004
Patent expiry 2013 2013 2015 2015 2017
Data exclusive expiry 2002 2003 2010 2009 2016
Market open to biosimilar entrant
2013 2013 2015 2015 2017
19
Source: The Lewin Group and i3 Innovus for Department of Health and Human Services, Office of the Assistant Secretary for Planning and Evaluation (July 2009), “Economic Analysis of Availability of Follow-On Protein Products,” retrieved from http://aspe.hhs.gov/sp/reports/2009/fopps/index.shtml
© Copyright 2011 Kantar Health
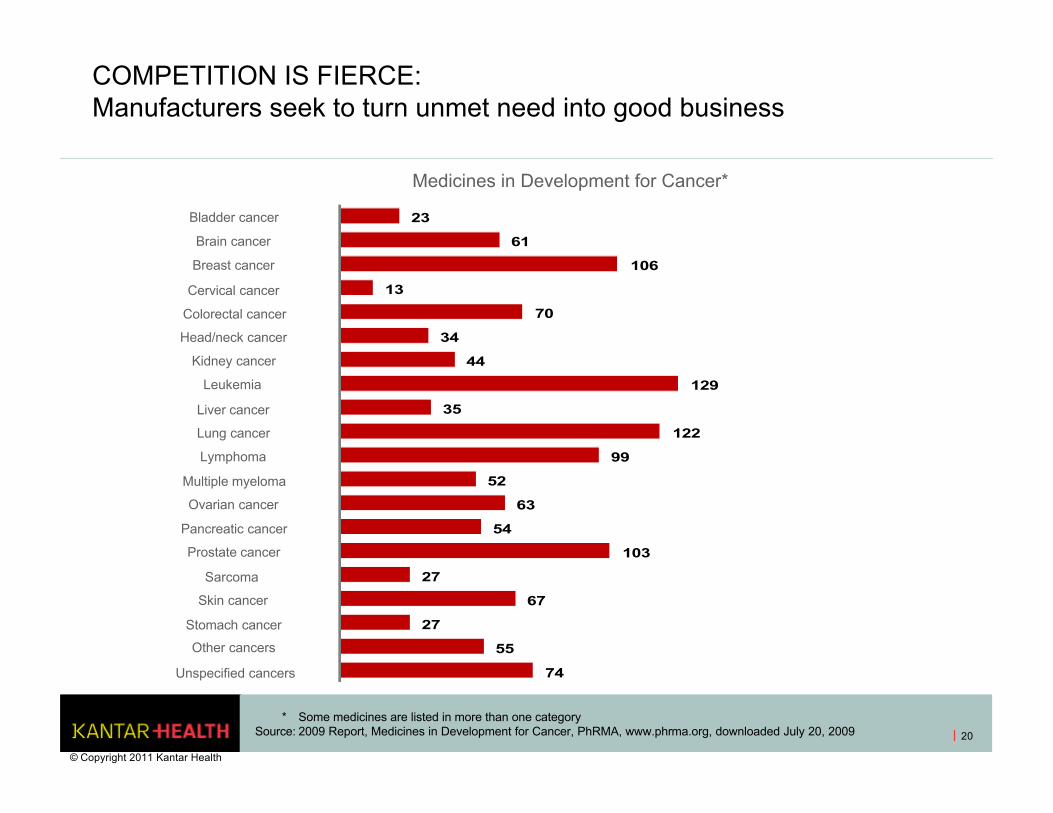
COMPETITION IS FIERCE: Manufacturers seek to turn unmet need into good business
20
* Some medicines are listed in more than one categorySource: 2009 Report, Medicines in Development for Cancer, PhRMA, www.phrma.org, downloaded July 20, 2009
Medicines in Development for Cancer*
74
55
27
67
27
103
54
63
52
99
122
35
129
44
34
70
13
106
61
23
Unspecified cancers
Other cancers
Stomach cancer
Skin cancer
Sarcoma
Prostate cancer
Pancreatic cancer
Ovarian cancer
Multiple myeloma
Lymphoma
Lung cancer
Liver cancer
Leukemia
Kidney cancer
Head/neck cancer
Colorectal cancer
Cervical cancer
Breast cancer
Brain cancer
Bladder cancer
© Copyright 2011 Kantar Health
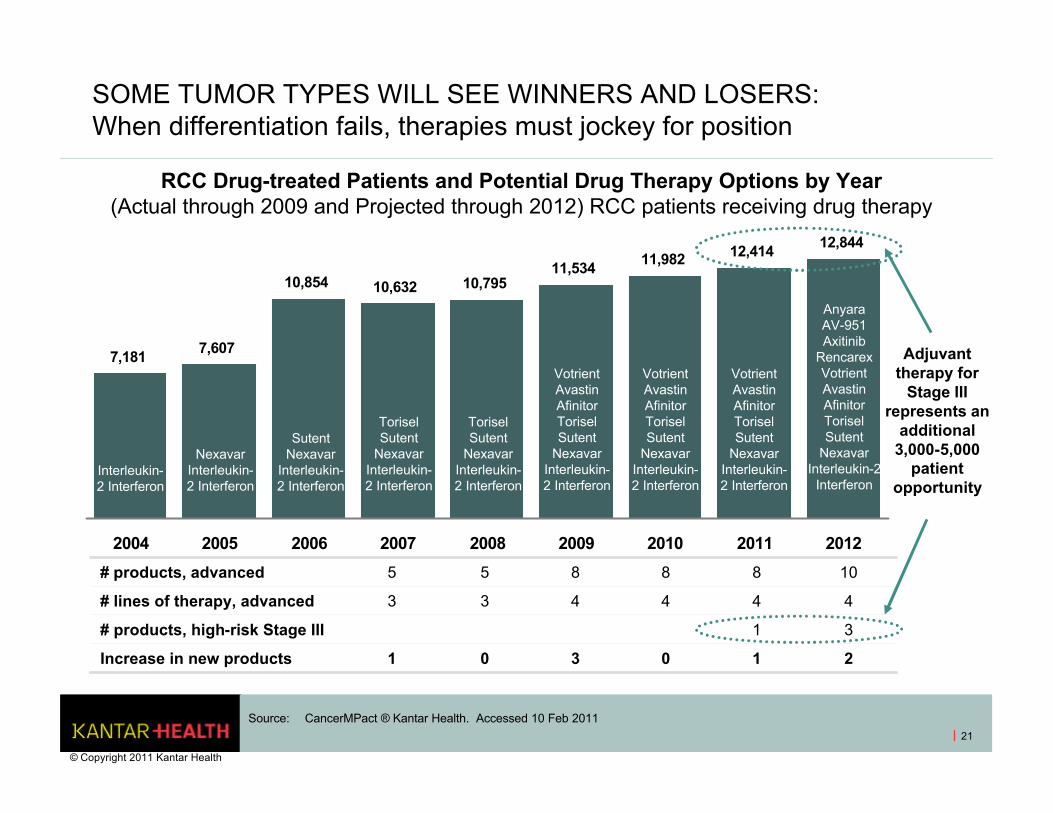
SOME TUMOR TYPES WILL SEE WINNERS AND LOSERS: When differentiation fails, therapies must jockey for position
21
7,181 7,607
10,854 10,632 10,79511,534 11,982 12,414 12,844
2004 2005 2006 2007 2008 2009 2010 2011 2012
Interleukin-2 Interferon
Nexavar Interleukin-2 Interferon
Sutent Nexavar
Interleukin-2 Interferon
Torisel Sutent
Nexavar Interleukin-2 Interferon
Torisel Sutent
Nexavar Interleukin-2 Interferon
VotrientAvastin Afinitor Torisel Sutent
Nexavar Interleukin-2 Interferon
Votrient Avastin Afinitor Torisel Sutent
Nexavar Interleukin-2 Interferon
Votrient Avastin Afinitor Torisel Sutent
Nexavar Interleukin-2 Interferon
AnyaraAV-951Axitinib
Rencarex Votrient Avastin Afinitor Torisel Sutent
Nexavar Interleukin-2
Interferon
# products, advanced 5 5 8 8 8 10
# lines of therapy, advanced 3 3 4 4 4 4
# products, high-risk Stage III 1 3
Increase in new products 1 0 3 0 1 2
Adjuvant therapy for
Stage III represents an
additional 3,000-5,000
patient opportunity
Source: CancerMPact ® Kantar Health. Accessed 10 Feb 2011
RCC Drug-treated Patients and Potential Drug Therapy Options by Year(Actual through 2009 and Projected through 2012) RCC patients receiving drug therapy
© Copyright 2011 Kantar Health
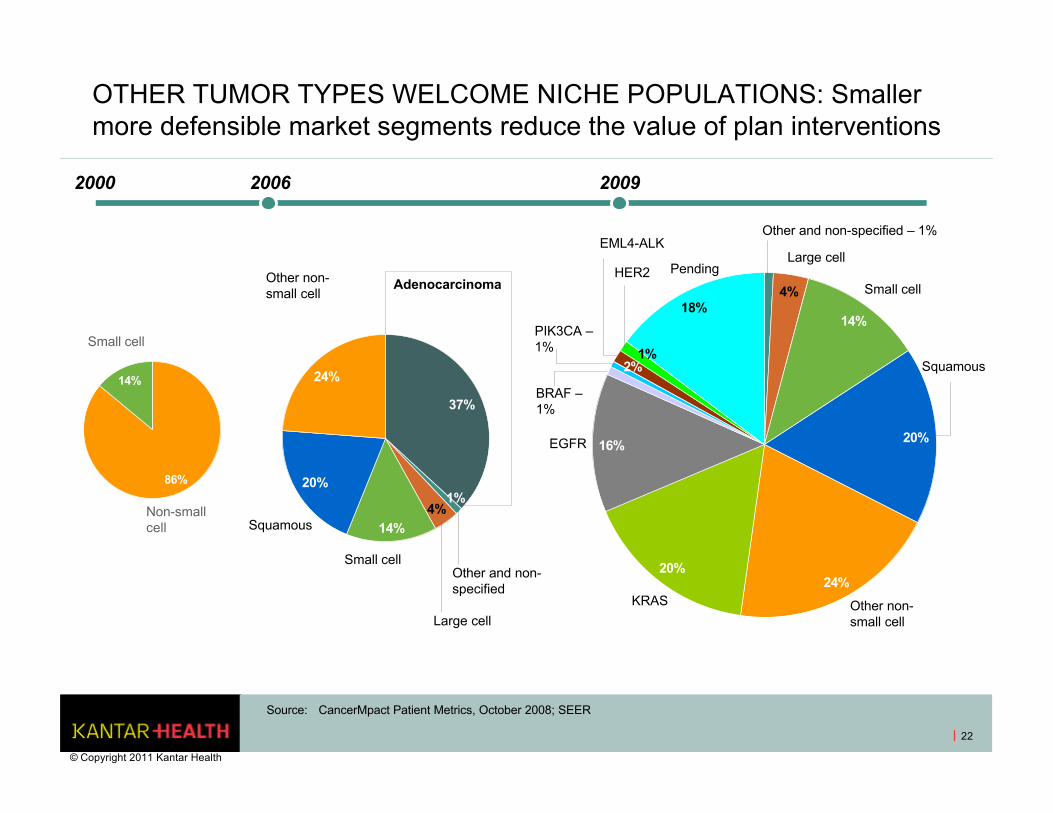
OTHER TUMOR TYPES WELCOME NICHE POPULATIONS: Smaller more defensible market segments reduce the value of plan interventions
22
86%
14%
37%
14%
20%
24%
1%4%
14%
20%
24%20%
16%
2%1%
18%4%
2000 2006 2009
Non-small cell
Small cell
Adenocarcinoma
Other and non-specified
Large cell
Small cell
Squamous
Other non-small cell
Other and non-specified – 1%
Large cell
Small cell
Squamous
Other non-small cell
KRAS
EGFR
BRAF –1%
PIK3CA –1%
EML4-ALK
HER2 Pending
Source: CancerMpact Patient Metrics, October 2008; SEER
© Copyright 2011 Kantar Health
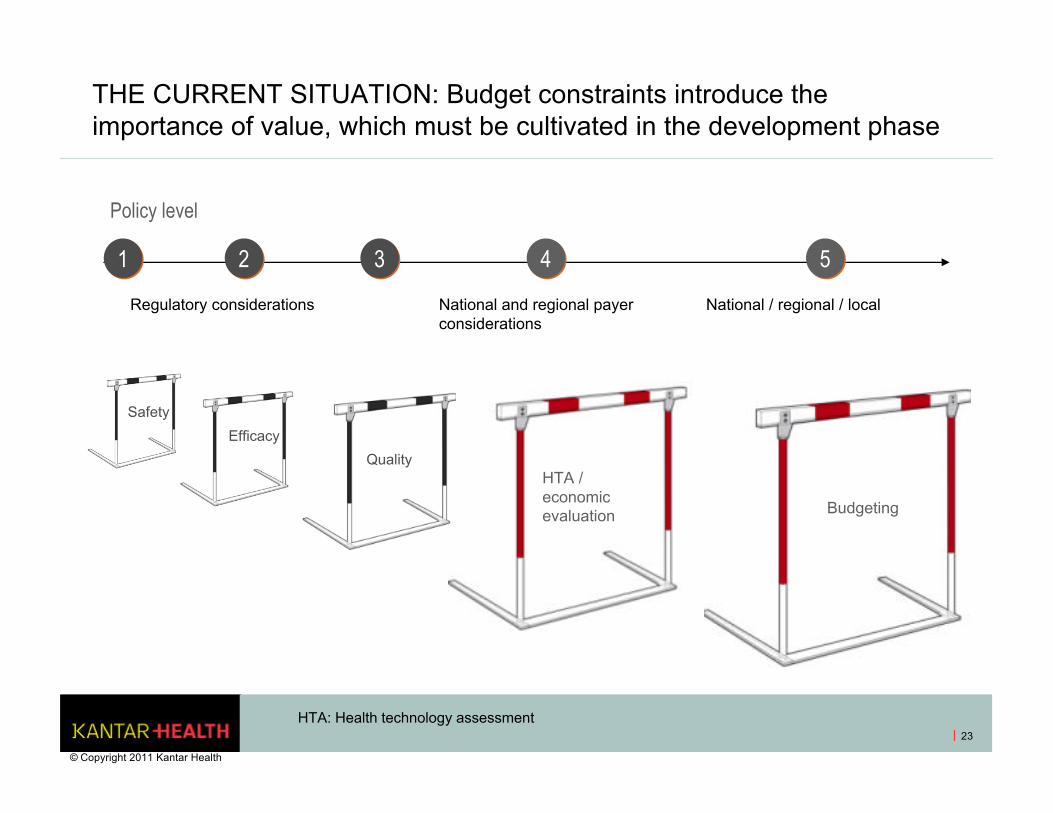
THE CURRENT SITUATION: Budget constraints introduce the importance of value, which must be cultivated in the development phase
23
HTA / economic evaluation Budgeting
Quality
Policy level
Regulatory considerations National and regional payer considerations
National / regional / local
11 33 44 5522
Safety
Efficacy
HTA: Health technology assessment
© Copyright 2011 Kantar Health
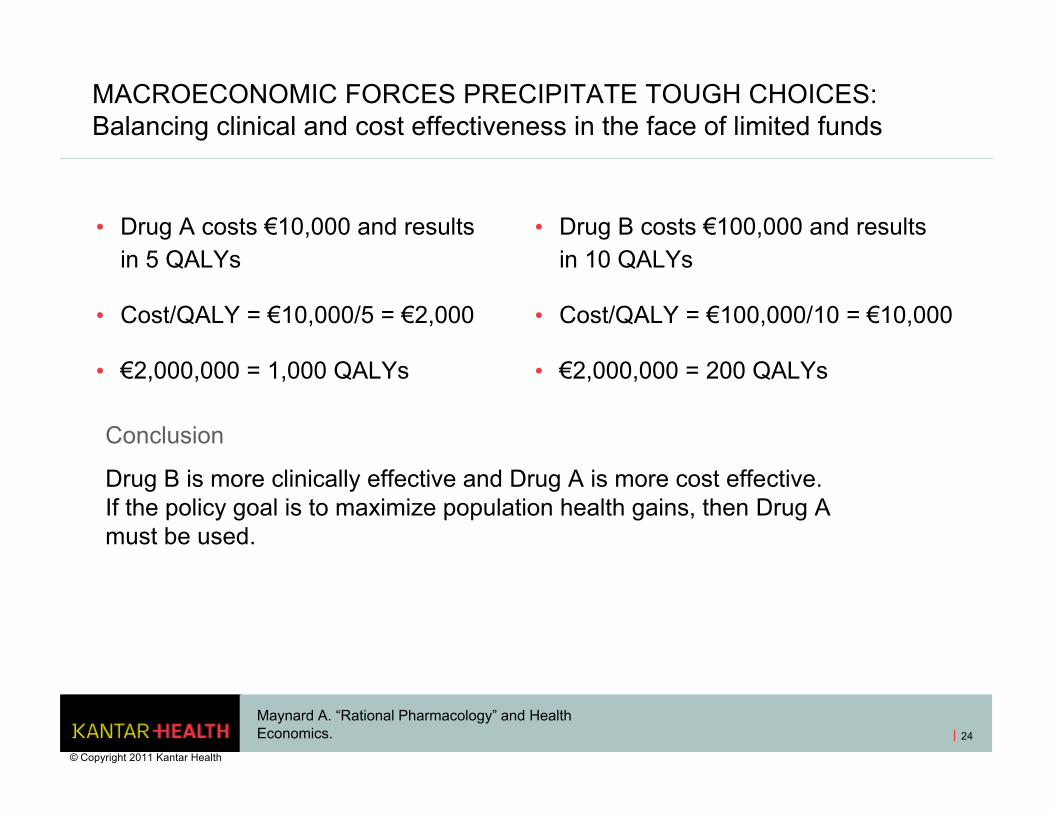
MACROECONOMIC FORCES PRECIPITATE TOUGH CHOICES: Balancing clinical and cost effectiveness in the face of limited funds
• Drug A costs €10,000 and results in 5 QALYs
• Cost/QALY = €10,000/5 = €2,000
• €2,000,000 = 1,000 QALYs
• Drug B costs €100,000 and results in 10 QALYs
• Cost/QALY = €100,000/10 = €10,000
• €2,000,000 = 200 QALYs
Conclusion
Drug B is more clinically effective and Drug A is more cost effective. If the policy goal is to maximize population health gains, then Drug A must be used.
Maynard A. “Rational Pharmacology” and Health Economics.
© Copyright 2011 Kantar Health
24
PILLARS OF VALUE: Consider your audience
• Safety
• Efficacy
• Tolerability
• Quality of life
• Disinvestment (i.e., decreased utilization of healthcare goods and services)
• Practice economics
© Copyright 2011 Kantar Health
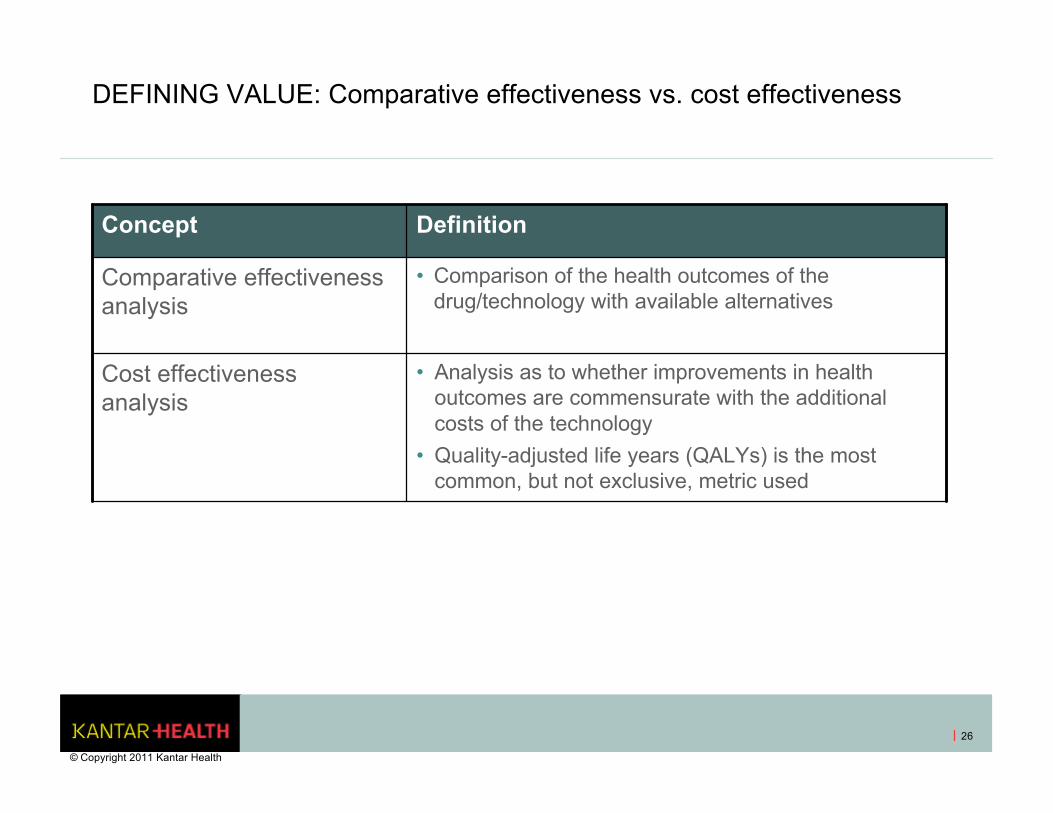
DEFINING VALUE: Comparative effectiveness vs. cost effectiveness
Concept Definition
Comparative effectiveness analysis
• Comparison of the health outcomes of the drug/technology with available alternatives
Cost effectiveness analysis
• Analysis as to whether improvements in health outcomes are commensurate with the additional costs of the technology
• Quality-adjusted life years (QALYs) is the most common, but not exclusive, metric used
© Copyright 2011 Kantar Health
26
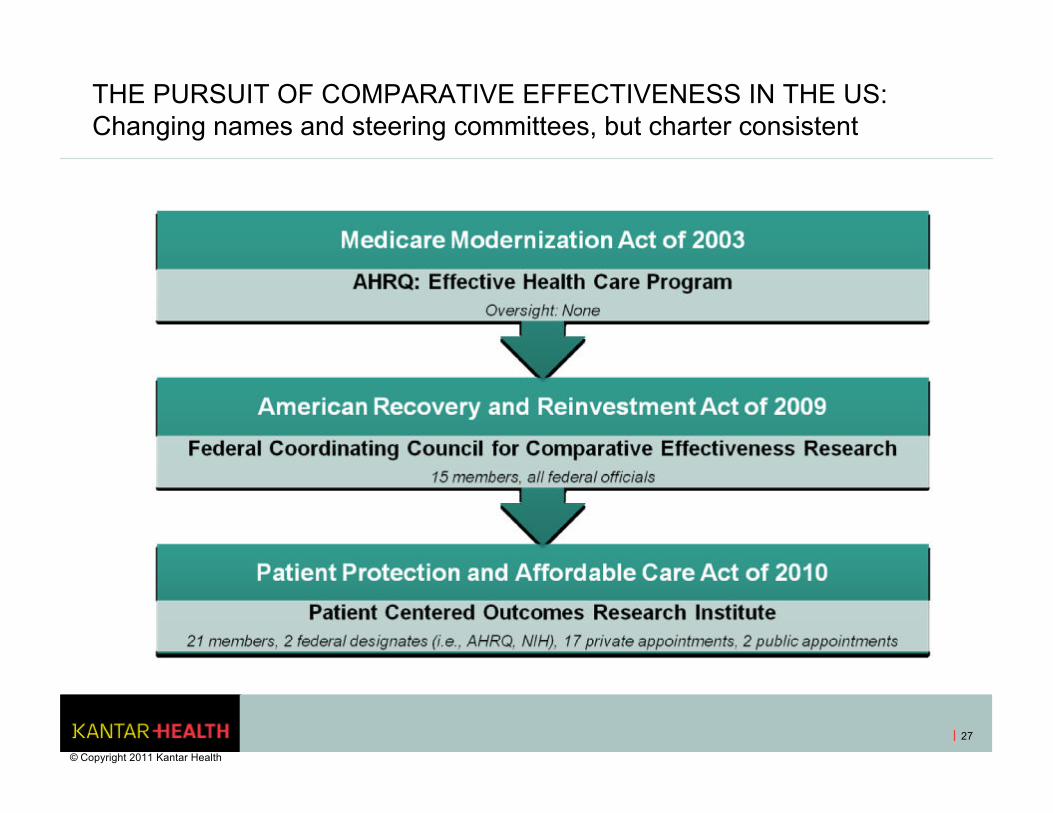
THE PURSUIT OF COMPARATIVE EFFECTIVENESS IN THE US: Changing names and steering committees, but charter consistent
27
© Copyright 2011 Kantar Health
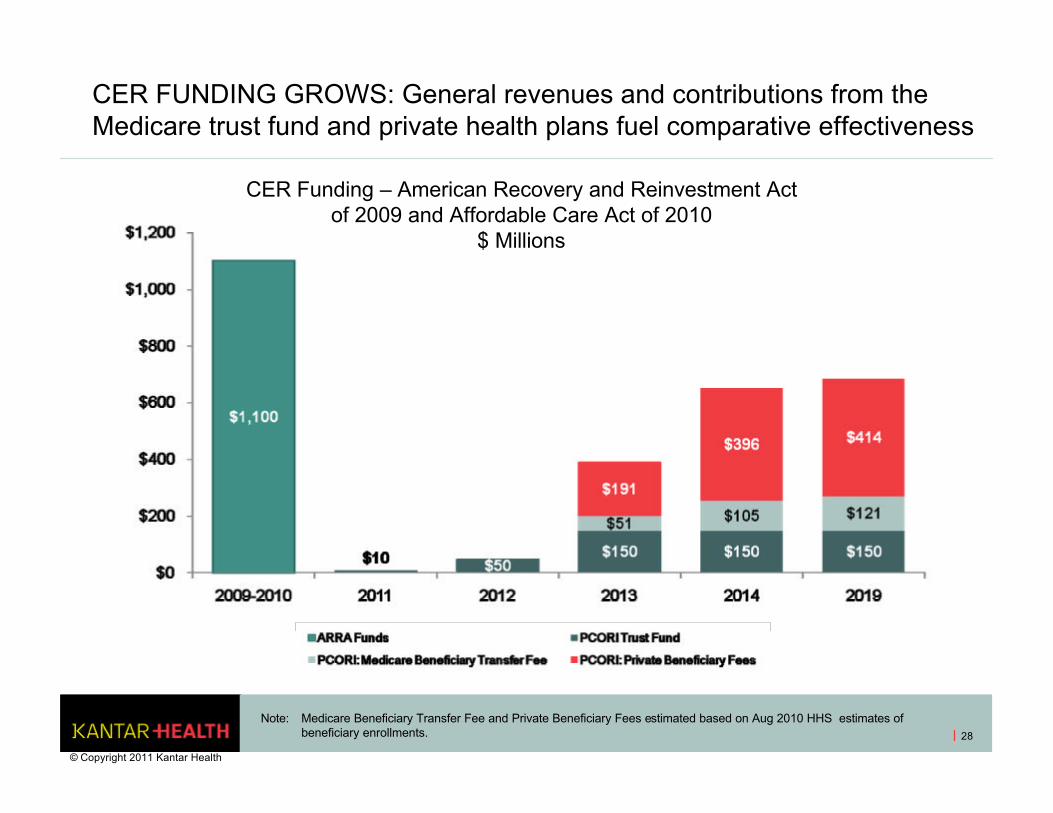
CER FUNDING GROWS: General revenues and contributions from the Medicare trust fund and private health plans fuel comparative effectiveness
28
Note: Medicare Beneficiary Transfer Fee and Private Beneficiary Fees estimated based on Aug 2010 HHS estimates of beneficiary enrollments.
CER Funding – American Recovery and Reinvestment Act of 2009 and Affordable Care Act of 2010
$ Millions
© Copyright 2011 Kantar Health
FRAGMENTATION CHALLENGES CER EFFORTS: But does not stymie them
Confounding factors include:
• Presence of target
• Primacy of target
• Existing and developing genetic mutations
• Relative contribution of multiple lines of therapies
• Size of eventual population and ability to accrue trial patients
29
© Copyright 2011 Kantar Health
THERE IS NO SUCH THING AS FREE…ESPECIALLY NOT PRICING
© Copyright 2011 Kantar Health
30
31
© Copyright 2011 Kantar Health
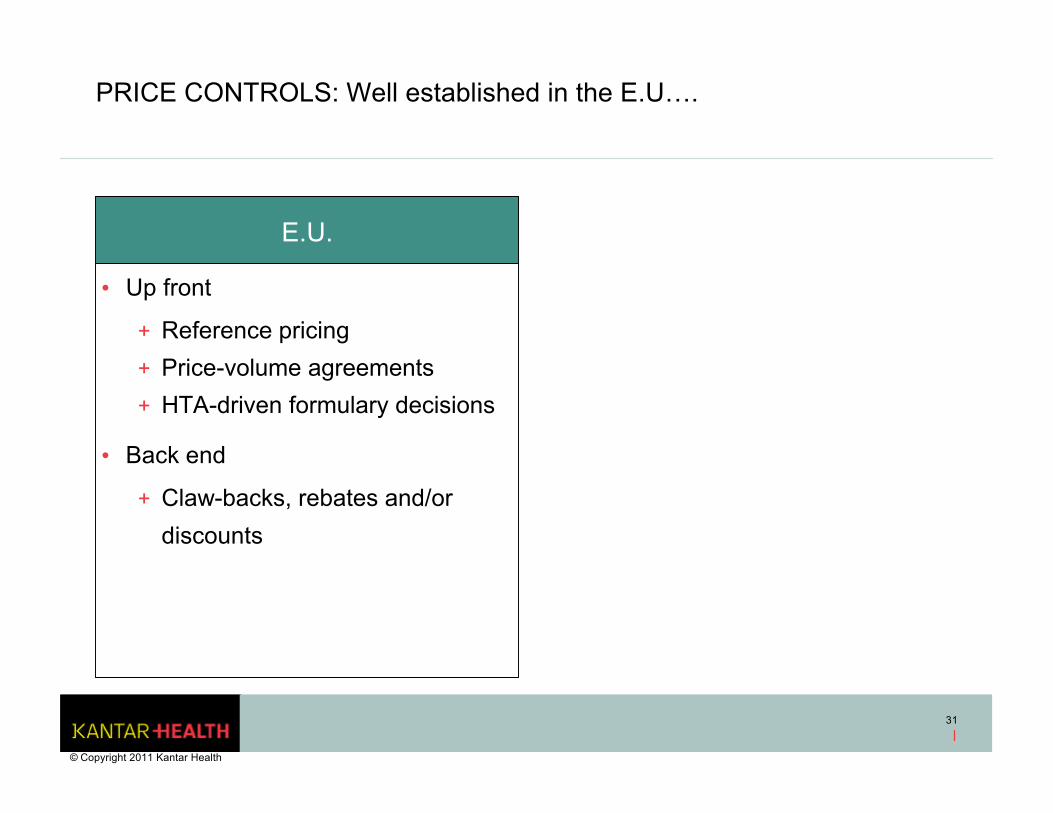
E.U.
• Up front
+ Reference pricing
+ Price-volume agreements
+ HTA-driven formulary decisions
• Back end
+ Claw-backs, rebates and/or
discounts
PRICE CONTROLS: Well established in the E.U….
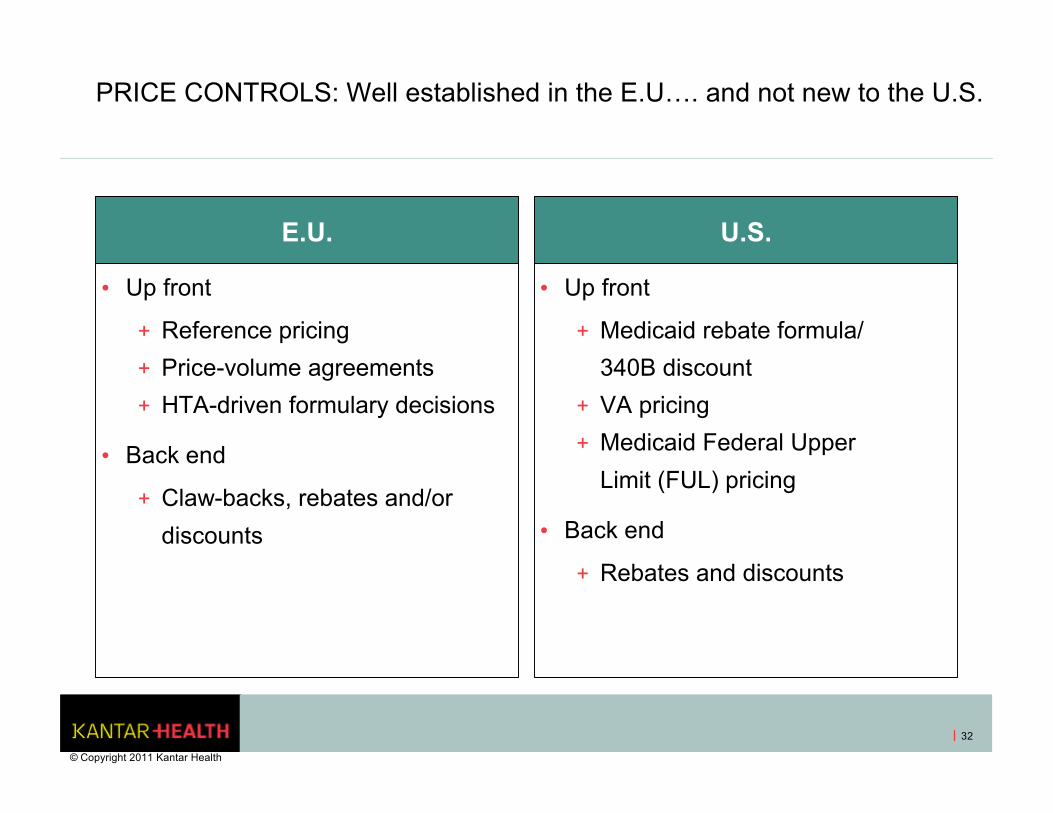
PRICE CONTROLS: Well established in the E.U…. and not new to the U.S.
E.U.
• Up front
+ Reference pricing
+ Price-volume agreements
+ HTA-driven formulary decisions
• Back end
+ Claw-backs, rebates and/or
discounts
U.S.
• Up front
+ Medicaid rebate formula/
340B discount
+ VA pricing
+ Medicaid Federal Upper
Limit (FUL) pricing
• Back end
+ Rebates and discounts
32
© Copyright 2011 Kantar Health
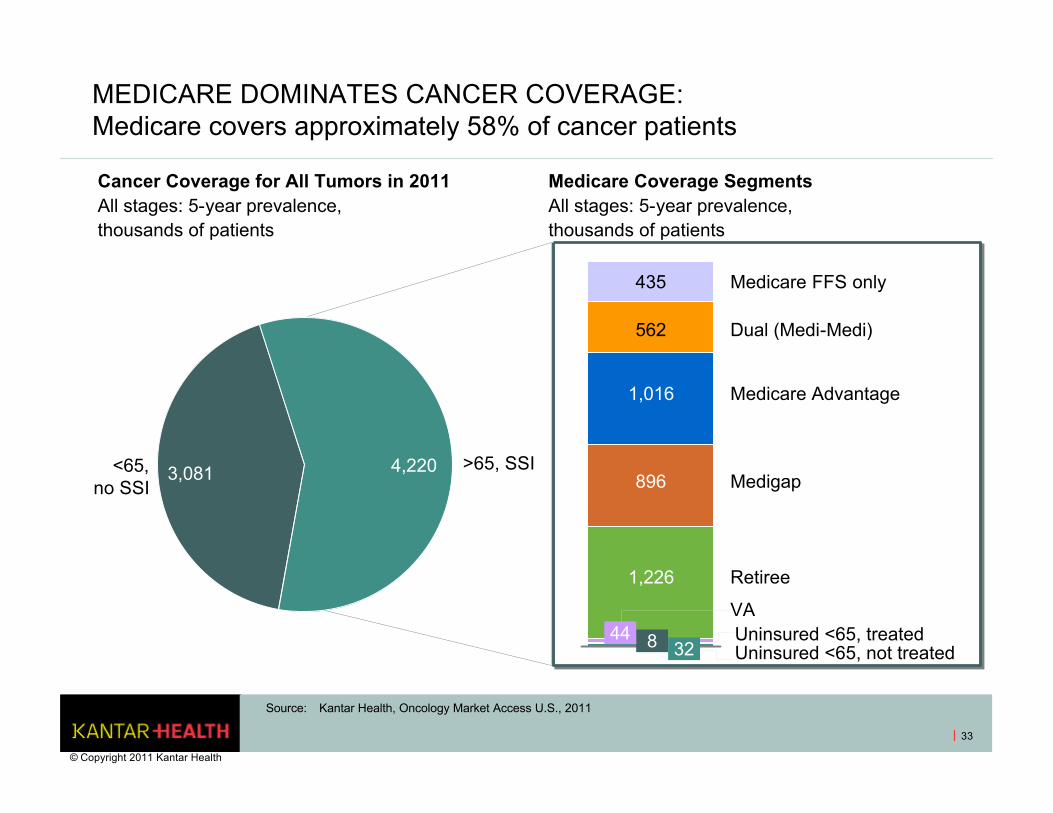
<65, no SSI
>65, SSI3,081 4,220
MEDICARE DOMINATES CANCER COVERAGE: Medicare covers approximately 58% of cancer patients
33
Medicare FFS only
Dual (Medi-Medi)
VA
Medicare Advantage
Medigap
Retiree
Source: Kantar Health, Oncology Market Access U.S., 2011
Cancer Coverage for All Tumors in 2011All stages: 5-year prevalence, thousands of patients
Medicare Coverage SegmentsAll stages: 5-year prevalence, thousands of patients
Uninsured <65, treatedUninsured <65, not treated
8
1,226
896
1,016
562
4432
435
© Copyright 2011 Kantar Health
34
393 Vintage Park Dr., Suite 250Foster City, California 94404, U.S.A.Tel: (650) 403-7012Fax: (650) 403-7062 E-mail: [email protected]: www.kantarhealth.com
Please contact us if you have any questions.
US:
Rhoda [email protected]
Bill [email protected]
© Copyright 2011 Kantar Health
35
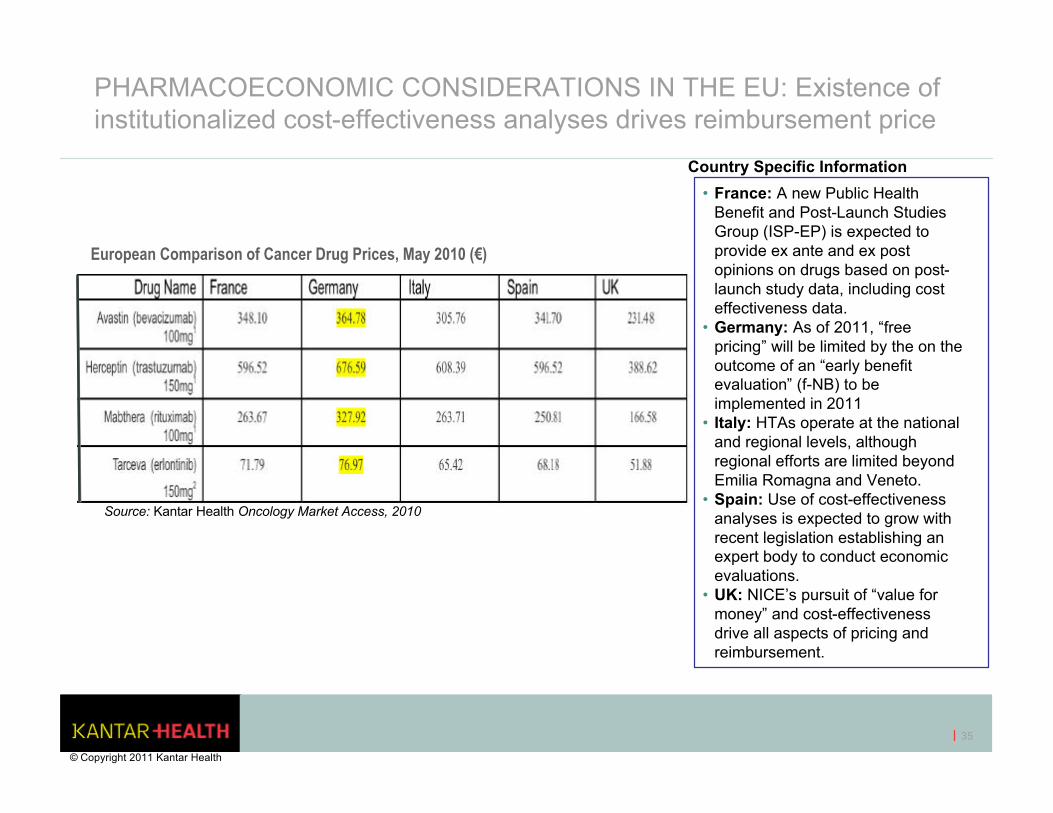
PHARMACOECONOMIC CONSIDERATIONS IN THE EU: Existence of institutionalized cost-effectiveness analyses drives reimbursement price
European Comparison of Cancer Drug Prices, May 2010 (€)
Source: Kantar Health Oncology Market Access, 2010
Country Specific Information
• France: A new Public Health Benefit and Post-Launch Studies Group (ISP-EP) is expected to provide ex ante and ex post opinions on drugs based on post-launch study data, including cost effectiveness data.
• Germany: As of 2011, “free pricing” will be limited by the on the outcome of an “early benefit evaluation” (f-NB) to be implemented in 2011
• Italy: HTAs operate at the national and regional levels, although regional efforts are limited beyond Emilia Romagna and Veneto.
• Spain: Use of cost-effectiveness analyses is expected to grow with recent legislation establishing an expert body to conduct economic evaluations.
• UK: NICE’s pursuit of “value for money” and cost-effectiveness drive all aspects of pricing and reimbursement.
© Copyright 2011 Kantar Health

22nd Annual 22nd Annual Cancer Progress ConferenceCancer Progress Conference
Oncology Market Overview: Barriers, Challenges and Value
• Bill Bagwell, RPh, Senior Vice President, Clinical and Scientific Assessment, Kantar Health
• Rhoda Dunn, Account Director, Market Access, Kantar Health
36