Embed Size (px)
Citation preview

Journal of International Money and Finance20 (2001) 327–347
www.elsevier.nl/locate/econbase
‘Once-in-a-generation’ yen volatility in 1998:fundamentals, intervention, and order flow
Jun Cai a, Yan-Leung Cheung a, Raymond S.K. Lee a,Michael Melvin b,*
a Department of Economics and Finance, City University of Hong Kong, Tat Chee Avenue, Kowloon,Hong Kong, PR China
b Department of Economics, Arizona State University, Tempe, AZ 85287-3806, USA
Abstract
The dramatic yen/dollar volatility of 1998 has been popularly ascribed to order flow drivenby changing tastes for risk and hedge-fund herding on unwinding yen ‘carry trade’ positionsrather than fundamentals. High-frequency evidence of shifting fundamentals is provided by acomprehensive list of macroeconomic announcements. News is found to have significanteffects on volatility, but order flow may play a more important role. Since portfolio shifts arerevealed to the market through trading, the results are consistent with order flow playing asignificant role in the revelation of private information and associated exchange rate shifts. 2001 Elsevier Science Ltd. All rights reserved.
JEL classification: F31; G14; G15; C22
Keywords: Exchange rate volatility; Private information; Order flow; News announcements; Centralbank intervention
1. Introduction
The yen/dollar exchange rate provided market participants with a year to rememberin 1998. Not since the breakdown of the Bretton Woods system in the early 1970shas such volatility been witnessed. After many months of uneven yen depreciation,a surprise joint US–Japanese intervention on June 17 led to a yen appreciation of
* Corresponding author. Tel.: +1-480-965-6860; fax: +1-480-965-0748.E-mail address: [email protected] (M. Melvin).
0261-5606/01/$ - see front matter 2001 Elsevier Science Ltd. All rights reserved.PII: S 02 61 -5606( 00 )0 0056-5

328 J. Cai et al. / Journal of International Money and Finance 20 (2001) 327–347
more than 6 yen per dollar. This first-ever yen intervention by the Clinton Adminis-tration followed the yen hitting an 8-yr low against the dollar earlier that week. Then,after several months of continued yen depreciation, a sudden reversal was experi-enced where, on October 7, the yen price of a dollar fell from about 134 to 120 inone day. On the next day, the yen traded in a remarkably large range between 111and 123. For the remainder of the year, sporadic volatility occurred and investoruncertainty was reflected in the implied volatility in yen options trading between 15and 23%. Near year’s end, the premium for one-month dollar puts reached an all-time high of 3.6%.1
A search of the news reveals three sources being most frequently mentioned asthe cause of yen–dollar volatility: announcements related to macroeconomic funda-mentals; intervention by the Bank of Japan, the US Treasury, and the FederalReserve; and portfolio position switches by large institutions. Most analysts blamedthe wide swings of late 1998 on hedge funds and panic trading. For instance, in areview of recent yen performance a Financial Times article reported that the fluctu-ations in the value of the yen in late 1998 were “driven by temporary market panic,rather than any economic fundamentals.”2 The rapid appreciation of the yen has beenmost commonly associated with investors unwinding positions in the ‘yen-carry’trade where funds had borrowed yen at interest rates near zero and then invested inhigher-yielding securities denominated in dollars and other currencies. During theperiod of yen depreciation in early 1998, such short-yen positions were quite profit-able. The standard belief is that a reassessment of the risk environment was associa-ted with a liquidity crunch and was brought about by a convergence of negativeoutcomes such as hedge fund losses in emerging markets and the near-collapse ofLong Term Capital Management. This changed environment caused funds to unwindtheir short yen positions and resulted in yen appreciation. Once the appreciationbegan, herd behavior is said to have occurred where there was a stampede of inves-tors to cover their short yen positions.3
The notable events of 1998 provide an interesting laboratory to assess the role ofeconomic fundamentals and test if there was an independent role for order-flowinduced exchange rate volatility where investor position switches were revealedthrough their trades. In a broad sense, the sample provides insights into the roleof public information in the form of macroeconomic announcements versus privateinformation revealed through order flow in determining exchange rates. Microstruc-ture theories provide a framework for understanding the learning that occurs whena large fund reveals its position switching through trades with counterparty banks.The world learns about the yen carry-trade unwinding not via public announcements
1 A good overview of the environment in late 1998 is provided in the March 1999 Federal Reserve Bull-etin.
2 See Tett (1999).3 A useful non-technical discussion of the yen carry-trade and its potential effects on exchange rate
volatility is provided in Beranger et al. (1999).

329J. Cai et al. / Journal of International Money and Finance 20 (2001) 327–347
but via trades of the firms holding the short-yen positions.4 Beyond the particularinterest in understanding the causes of yen volatility in 1998, it is also worthwhileto consider the broader issue of exchange rate determination. It has long been knownthat empirical models of exchange rates have not performed well. In the high-fre-quency data setting, researchers have examined the impact of macroeconomic newsand found that intra-daily exchange rate volatility systematically responds to publicinformation announcements (see Andersen and Bollerslev (1998) for a mark/dollarexample). However, researchers have recently suggested that the act of trading, apartfrom any fundamentals—related news, may be an important source of exchangerate dynamics.5
The foreign exchange market is a market with a relative lack of transparency andasymmetrically-informed traders so that order flow should be expected to containindependent information. This is a view that is widely supported by practitionersand documented in several market surveys. For instance, Menkhoff (1998) foundthat the overwhelming majority of 205 German FX professionals he surveyed agreedwith the following statement: “Big market participants can ‘make’ exchange ratesfor a while via own position taking and customer orders.” This is consistent withthe findings of a survey of 142 U.S. market participants by Cheung and Chinn (2000).They find that “large players are perceived to have a better customer and marketnetwork, which, in turn, give them better information on order flow and the activityof other trading banks” (p. 8). Cheung and Wong (1999) surveyed almost 400 tradersin Hong Kong, Tokyo, and Singapore and find that roughly 25% of respondentsidentify their trading style to be determined by customer order flow rather than tech-nical trading, fundamentals, or jobbing (continuously buying and selling smallamounts to earn the spread). Cheung et al. (1999) found that 97% of the 110 UKFX professionals they surveyed disagreed with the statement: “Intraday exchangerate movements accurately reflect changes in the fundamental value.” Based on theirsurvey results and the role that order flow may play in revealing ‘speculative forces’leads Cheung et al. to state that “A model capable of explaining exchange rate move-ments needs to consider another factor, over and above the usual suspects.” Webelieve that this ‘other factor’ is order flow and hope to demonstrate the importanceempirically in a setting incorporating major news releases so that the effect of orderflow, independent of announcement effects, may be identified.
The response of the yen–dollar exchange rate to regularly scheduled news releaseshas been studied by others. Ederington and Lee (1994), DeGennaro and Shrieves(1997), Leng (1996) and Chatrath and Song (1998) are among those who investigate
4 Evans and Lyons (1999) provide a theoretical model of the role of foreign exchange market orderflow in determining exchange rates. Using data on signed order flow (whether a purchase or sale) fromthe Reuters Dealing 2000–1 system, they find evidence that order flow is a significant determinant of themark–dollar and yen–dollar exchange rates over 89 days in 1996. Unfortunately, such data are not avail-able for our sample period as the Bank of England only collected the data for four months in 1996. Inaddition, the EBS system is known to provide better coverage of the yen/dollar market than Reuters soone may wonder how representative the Reuters system would be for yen/dollar trades.
5 See, for example, Ito et al. (1998) and Evans and Lyons (1999).

330 J. Cai et al. / Journal of International Money and Finance 20 (2001) 327–347
high-frequency news effects on the yen. All but DeGennaro and Shrieves focus onmacroeconomic announcements during US trading hours and futures markets, withtheir limited trading hours constraint.6 Earlier studies tend to emphasize one of thefollowing three components-time-of-day patterns (intraday calendar effects), macroe-conomic announcements (public information effects), and intra- and inter-day vola-tility persistence (ARCH effects). Recent findings suggest that all three factors shouldbe accounted for simultaneously in high frequency studies of volatility processes, orelse distorted estimates for the individual components may arise.
Building on the methodology in Andersen and Bollerslev (1997, 1998), this paperoffers a comprehensive study of the intraday patterns in the volatility of the yen–dollar spot exchange rate that explicitly incorporates the different volatility compo-nents in a coherent framework. Our analysis is based on a one-year sample of five-minute returns in 1998. The impact of 32 US and 33 Japanese regularly releasedmacroeconomic announcements is examined. The sample of macroeconomic newsis more comprehensive than that used in any existing study on the yen–dollarexchange rate. From the US side, ten announcements are found to be significant.These include the employment report, the consumer price index (CPI), the GrossDomestic Product (GDP), the producer price index (PPI), the merchandise trade bal-ance, consumer installment credit, real earnings, employment costs, reserve assets,and personal income. The six significant Japanese announcements include the Tankanreport,7 the unemployment rate, vehicle sales, the consumer sentiment index, elec-tricity usage, and vehicle production. Dummy variables for central bank interventionare also found to have a significant effect on volatility. Order flow is proxied byyen positions held by major market participants such as commercial and investmentbanks. We find that yen volatility is positively associated with purchases of yen spot,forward, and futures contracts and negatively associated with sales. The results indi-cate that there is a significant role for order flow in understanding the yen volatility of1998 apart from announcements regarding fundamentals or central-bank intervention.
Despite the extraordinary yen–dollar exchange rate volatility in 1998, we are ableto capture a distinct intraday volatility pattern over different regional segments. Thesignificant calendar effects include holiday, weekend, Tokyo opening, Tokyo andEuropean lunch breaks, Monday morning, late Friday, and Daylight Saving Time.In contrast to previous studies, the day-of-the-week effects remain highly significanteven after accounting for the clustering of regularly scheduled macroeconomic newsreleases on Thursdays and Fridays during the sample period.
The remainder of the paper is organized as follows. Section 2 describes the data,summarizes the intraday volatility patterns, and estimates various intraday calendareffects. Section 3 examines the implications of major macroeconomic announce-ments, intervention, and order flow. Section 4 assesses the overall importance of
6 Hardouvelis (1984), Hakkio and Pearce (1985), Thornton (1989) and Ito and Roley (1987) examineannouncement effects on the yen–dollar exchange rate using lower-frequency data. See Andersen andBollerslev (1998) for a more detailed review of earlier studies on the impact of macroeconomic news onmajor currencies.
7 The BOJ conducts a quarterly short-term economic survey (Tankan) of about 7500 companies.

331J. Cai et al. / Journal of International Money and Finance 20 (2001) 327–347
different volatility components at the intraday and daily level. Finally, Section 5provides a concluding discussion of results and implications.
2. Modeling the intraday patterns
2.1. Data
The Japanese yen–US dollar spot exchange rate quotes for 1998 are provided byOlsen and Associates Limited. Each quote contains a bid and ask price along withthe time to the nearest second. At the end of each five-minute interval, we use theimmediately preceding and following quotes to construct the relevant price. The log-price is first calculated as the midpoint of the logarithmic bid and ask. The log-pricesare then weighted by their inverse relative distance to the endpoint. On weekdays,all 288 intervals during the 24-hour trading cycle are used. On weekends, however,all returns from 21:00 Greenwich Mean Time (GMT) Friday through 21:00 GMTSunday are excluded. To maintain a fixed number of observations over the span ofa week, returns during worldwide or country-specific holidays are not removed,although the holiday effects are explicitly accounted for by dummy variables. Thereare 260 trading days during the sample period so this leaves us with a total of 74,880observations on returns, Rt,n, where n=1,2,…,288, and t=1,2,…,260.
To provide a sense of the range of fluctuations that occurred in 1998, daily dataare plotted in Fig. 1.8 The incredible range of prices is clearly illustrated in the figure
Fig. 1. Japanese yen–US dollar spot exchange rate in 1998.
8 Daily observations on the yen–dollar spot rate are taken from Datastream. These are the midpointsof the bid and ask quotes in London from Barclays Bank International at 16:30 GMT.
332 J. Cai et al. / Journal of International Money and Finance 20 (2001) 327–347
and reflects the wild events of the year, which include spillovers from the Asiancrisis, a Russian bond default, currency market interventions, and the near-collapseof a very large hedge fund, Long Term Capital Management.
2.2. Intradaily patterns
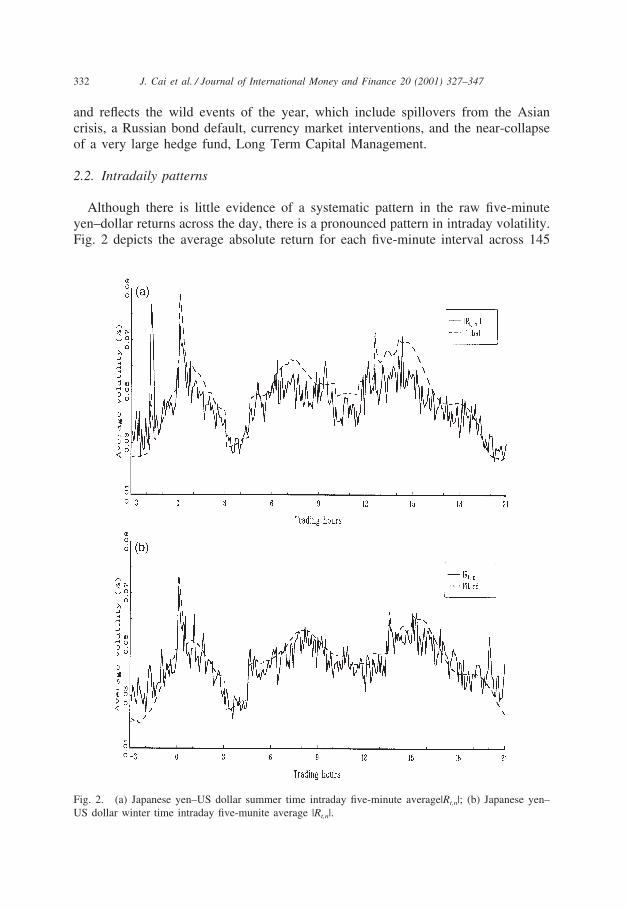
Although there is little evidence of a systematic pattern in the raw five-minuteyen–dollar returns across the day, there is a pronounced pattern in intraday volatility.Fig. 2 depicts the average absolute return for each five-minute interval across 145
Fig. 2. (a) Japanese yen–US dollar summer time intraday five-minute average|Rt,n|; (b) Japanese yen–US dollar winter time intraday five-munite average |Rt,n|.

333J. Cai et al. / Journal of International Money and Finance 20 (2001) 327–347
trading days during the US summer time and 115 trading days during the US wintertime, respectively.9 The initial observation corresponds to the interval beginning at21:00 GMT, and the last observation represents the interval ending at 21:00 GMT.Thus, trading originates every morning in the Pacific segment where banks locatedin Wellington and Sydney dominate the market. Trading volume and return volatilityare rather subdued at this hour. Fig. 2(a) shows a significant spike in volatility inthe early Asian morning in summer. In both seasons, there is a significant jump involatility at 00:00 GMT, or 9 a.m. Tokyo time, corresponding to the opening of theTokyo foreign exchange interbank market, in which yen–dollar dealings comprisethe largest portion of the trading volume.10 The market slows down significantlyduring the Tokyo lunch time, 3:00–4:30 GMT. Volatility then picks up again at 6:00GMT during summer time (7:00 GMT during Winter Time) when the Europeanmarket begins to trade. The overlap of the European and North American marketbetween 12:00 and 15:00 GMT constitutes another notable segment of high volatility.With the observance of daylight saving time in both Europe and North America, thevolatility pattern appears to shift leftward between 6:00 and 21:00 GMT. In parti-cular, the two peaks corresponding to the scheduled US macroeconomic announce-ments at 8:30 and 10:00 Eastern Standard Time (EST), or 13:30 and 15:00 GMT inFig. 2(b) are shifted to the left by exactly one hour in Fig. 2(a). The overall patternis consistent with those found in Baillie and Bollerslev (1991), Harvey and Huang(1991), Dacorogna et al. (1993), Andersen and Bollerslev (1998) and Melvin andYin (2000) for major currencies.
2.3. Flexible Fourier form estimates
In order to explicitly model the periodic volatility component in the high-frequencyreturns, we apply the general framework developed by Andersen and Bollerslev(1997). Specifically, on decomposing the demeaned five-minute returns as,
Rt,n�E(Rt,n)�st,n·st,n·Zt,n (1)
where st,n denotes a daily volatility factor and Zt,n is an i.i.d. mean zero unit varianceinnovation term, the logarithmic seasonal component, ln(s2
t,n), may be convenientlyestimated from the following flexible Fourier form (FFF) regression,
2ln|Rt,n−R|st/N1/2 �c�bOt,n��D
k�1
lk·Ik(t,n)�d0,1
nN1
�d0,2
n2
N2
��Pp�1
�dc,p·cos2ppN
n (2)
�ds,p·sin2ppN
n��et,n,
where R denotes the sample mean of the five-minute returns, st is an a priori estimate
9 Summer time, or daylight saving time, is defined as the period from April 5 to October 25.10 According to the Japan Economic Almanac (Anon, 1999), yen–dollar dealings account for 72% of
the total trading volume in Japan during the first 11 months of 1998.

334 J. Cai et al. / Journal of International Money and Finance 20 (2001) 327–347
of the daily volatility component.11 N1=(N+1)/2 and N2=(N+1)(N+2)/6 are normaliz-ing constants. N refers to the number of return intervals per day, and the tuningparameter P determines the order of the expansion. Ot,n is the order flow of largemarket participants. The Ik(t,n) indicator variable for event k during interval n onday t allows for the inclusion of specific calendar and news announcement effectsthat will be discussed in the following sections.12
2.4. Calendar effects and their estimates
We now briefly outline the treatment of a number of distinct calendar features inthe absolute five-minute yen–dollar spot exchange rate returns. First, we observe asignificant slow down in market activity over worldwide and regional holidays. Theworldwide holidays include January 1, December 24–26, and December 31, duringwhich a dummy variable is assigned to each of the 288 five-minute intervals. Theregional holidays are from the following eight countries: New Zealand, Australia,Japan, Hong Kong, Singapore, Germany, France, Great Britain, and the UnitedStates. Regional holidays affect the corresponding trading segment only.13 The vola-tility burst following the Tokyo opening is captured by a single coefficient that allowsfor a linear decay between 00:00 and 00:30 GMT. Volatility slows down significantlyin the morning on Asian Monday (21:00–22:30 GMT) in winter, and late Fridayafternoon (16:00–21:00 summer time and 17:00–21:00 winter time) in the NorthAmerica segment. We model these periods by constrained second-order polynomialsover the corresponding intervals, resulting in two regression coefficients for eachperiod. During the US summer time, the sinusoid regressors are shifted leftward byone hour, resulting in lower volatility in the late afternoon between 19:00 and 21:00GMT. This is adjusted by a restricted second-order polynomial with one free para-meter. In order to compensate for the one-hour shift, we elongate the intraday patternvia sinusoid regressors between 20:00 and 22:00 GMT. We also add dummy vari-ables to control for the lunch breaks in Tokyo (3:00–4:30 GMT) and Europe (10:00–11:30 GMT summer time and 11:00–12:30 GMT winter time). Finally, we incorpor-ate day-of-the-week dummies for all weekdays except Monday.
After some experimentation we found that P=6 in Eq. (2) was sufficient to capture
11 Following Andersen and Bollerslev (1998), the daily volatility component is calculated in two ways:a time varying st,n=st/N1/2 where st is the estimated daily volatility from a MA(1)-FIGARCH(1,d,1)model fitted over 3652 daily returns from January 2, 1985 to December 31, 1998, and a constantst,n=s/N1/2, where s is the sample mean of st.
12 The actual estimation involves a two-step procedure, see Andersen and Bollerslev (1997) for moredetails.
13 Holidays in the US include Martin Luther King Day (19/1), President’s Day (16/2), Easter (12/4–13/4), Memorial Day (25/5), Independence Day (4/7), Labor Day (7/9), Columbus Day (12/10), Veteran’sDay (11/11), and Thanksgiving Day (26/11). Holidays in Japan include Coming of Age Day (15/1),National Foundation (11/2), Vernal Equinox (21/3), Green Day (29/4), Constitution Memorial andNational Holiday (3/5–4/5), Children’s Day (5/5), Sea Day (20/7), Respect for the Aged Day (15/9),Autumn Equinox (23/9), Health and Sports Day (10/10), National Culture Day (3/11), Labor ThanksgivingDay (23/11), and Emperor’s Birthday (23/12).

335J. Cai et al. / Journal of International Money and Finance 20 (2001) 327–347
the basic shape. It is clear from the corresponding dashed lines plotted in Fig. 2(a,b)that the fitted values provide a close approximation to the general intradaily volatilitypattern in the yen–dollar foreign exchange market.
3. Macroeconomic announcement, intervention, and order flow effects
3.1. Important announcements
In order to formally analyze the actual impact of the news announcements, wecollected data on the dates and release times of 32 US macroeconomic news releasesfrom Reuters and 33 Japanese macroeconomic news announcements from Bloom-berg.14 All US announcements are monthly except for quarterly announcements ofGDP, employment costs and the current account deficit, weekly announcements ofinitial jobless claims and the money supply (M2), and irregular announcements ofFOMC meeting minutes, productivity and costs, the Beige book, and auto sales. ForJapan, except for the quarterly announcements of the Tankan report, consumer senti-ment index, GDP, and Tokyo office vacancy rate, all macroeconomic announcementsare released on a monthly basis. The US announcements are released widely andvirtually instantaneously at a precise scheduled time. For the Japanese announce-ments, we cross-checked the scheduled release time with reports from Reuters. Therelease times are essentially the same. Our sample of macroeconomic news from thetwo countries is the most comprehensive set employed to study yen–dollar exchangerate volatility.
In addition to the regularly scheduled macroeconomic news, we also includedummy variables for two days when large-scale intervention in the yen–dollar marketoccurred. The Bank of Japan intervened in support of the yen on April 10. TheFinancial Times reported that Tokyo currency dealers estimated the magnitude ofthe intervention to be around $5 billion. On June 17, the Clinton Administration’sfirst-ever intervention aimed at supporting a weak yen was carried out in tandemwith the BOJ. The Financial Times estimated the magnitude of the intervention tobe $2 billion. Despite rumors of intervention later in the year, there was no inter-vention in the fourth quarter.
3.2. Order flow
Data on foreign exchange market order flow are not made public. Historically,this was due to the bilateral nature of direct-dealing trades where only the two parti-cipants to the trade knew the quantity traded and price. More recently with the adventof electronic brokerages, it is feasible to provide data representing a large cross-
14 US non-farm payrolls and employment reports are always released at the same time, as are industrialproduction and capacity utilization. Simultaneous releases of news in Japan include the unemploymentreport and job-to-applicant ratio, housing starts and construction orders, and CPI nationwide and in theTokyo area.
336 J. Cai et al. / Journal of International Money and Finance 20 (2001) 327–347
section of the market, but the firms providing the major platforms (EBS and Reuters)do not make such data public in order to preserve the confidentiality of the tradingparties. In the past, the only view of order flow has been through individual traders(Lyons, 1995; Yao, 1998). Recently, Evans (1997) obtained four months of data in1996 from the Reuters direct-dealing 2000–1 system that contains transaction pricesand whether a trade was a purchase or sale (Reuters would not provide the quan-tities traded).
Note that there exists no way to capture the order flow of the entire market at thehigh frequency level across the spectrum of telephone and electronic trading venues.Obtaining the trading records over a short sample period from one trading venue,like the Reuters 2000–1 system, is the best one can hope for. However, at a lowerfrequency level there exist time-series data on quantities in the form of positionsheld by major market participants. For our study of 1998 yen volatility, we employthese data. The data source is the US Treasury. Market participants with positionsgreater than $50 billion in foreign exchange contracts on the last business day ofany quarter must file weekly reports on their purchases and sales. The Treasury doesnot reveal the participants identities and only provides aggregated data. However,the size threshold for required reporting suggests that these major market participantsare essentially the largest commercial and investment banks. We use the weekly dataon purchases and sales of spot, forward, and futures contracts on the yen as ourproxy for order flow.15 It is the order flow that reveals the private information regard-ing position changes as there are no public announcements when a large fundswitches from long to short or vice versa. In the context of the yen in 1998, thefinancial press frequently reported that a liquidity crunch associated with losses inemerging markets like Southeast Asia and Russia and the tightening of credit follow-ing the losses of Long Term Capital Management led to unwinding the yen carry-trade positions. In fact, a search of Reuters news associated with the 25 largest 5-min absolute returns in our sample reveals that many of these intervals are associatedwith the yen carry trade. The increased dollar selling and yen buying associated withunwinding positions was reported to be the force behind the dramatic periods ofyen appreciation.
When a hedge fund initiates a trade aimed at unwinding its short yen position,this trade is not known to anyone other than the counterparty to the trade. As themagnitude of such trading grew and the yen rose in value, rumors regarding thescale of the position switches were common. The important point is that it is theorder flow related to the position switching that results in the exchange rate changingand this order flow may be orthogonal to public information associated with currentfundamentals. In the context of the ‘portfolio shifts’ model presented in Evans andLyons (1999), this result requires that (1) portfolio shifts are not common knowledgeas they occur and (2) they are large enough that clearing the market requires adjust-
15 Wei and Kim (1997) use these data to establish that the major market participants’ positions Granger-cause exchange rate volatility for the UK pound, Swiss franc, yen, mark, and Canadian dollar over the1994–1996 period.

337J. Cai et al. / Journal of International Money and Finance 20 (2001) 327–347
ment of the spot exchange rate.16 In the case under study, the first condition is correctat the time trades are initiated. Furthermore, in the case of the yen in 1998, thesecond condition is fulfilled to such a degree that news services quickly search fora causal factor. This results in news reports of major hedge fund yen purchases witha short lag (within the day) after the trades.
Some additional comments on order flow in the context of our model are needed.First, since the measure of order flow, O, is only available weekly, O will not enterinto the determination of the intradaily volatility patterns. Instead, O may be thoughtof as shifting the intercept term to account for shifts in average weekly volatility.As will be seen below, there are significant shifts in average weekly volatility thatwould be missed in the absence of the O variable. Second, the time aggregationembodied in O creates a potential simultaneity problem. As a result, we utilize aninstrumental variable estimation procedure where the instruments are two lags oforder flow and two lags of the absolute weekly exchange rate returns (a volatilityproxy). It should be kept in mind that our measure of O is the only market-wideproxy for order flow available and our study is the first to incorporate such a measurein an intradaily model of exchange rate dynamics.
3.3. Initial estimation results
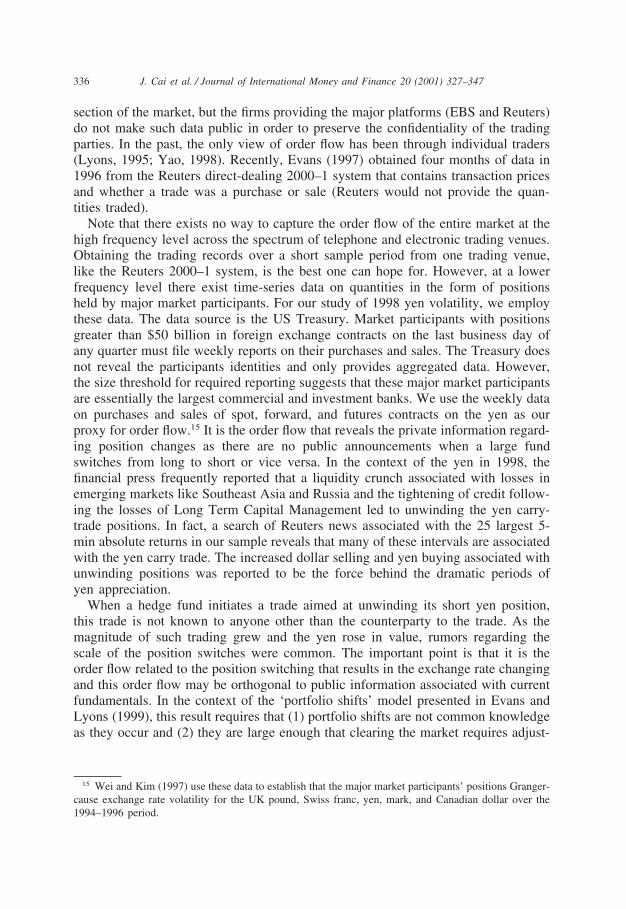
We begin our analysis with the announcement effects. Given the limited numberof occurrences of each type of news announcement and the inherent noise in thereturn process, it is not possible to simultaneously estimate separate coefficients foreach event and time interval following the news releases. Instead, we impose areasonable decay structure on the volatility response pattern and estimate the degreeto which the event ‘loads onto’ this pattern. Following Andersen and Bollerslev(1998), we choose the dynamic response pattern to be of the forml(k,i)=lk·g(i),i=0,1,2,…,12, where the pre-specified g(i) coefficients are determinedby a third-order polynomial, the general shape of which is given in Fig. 3.17 Thisapproach restricts the response horizon to be one hour.
Table 1 summarizes the estimates of the full system in Eq. (2) including the intra-daily calendar effects, time-varying daily volatility factor, intervention effects, hol-iday and day-of-the-week dummies, order flow, and macroeconomic data announce-ments. For the latter, the table just includes those announcements that were foundto have a statistically significant effect on volatility. Significant announcements wereidentified by estimating a version of Eq. (2) for each specific announcement, where
16 Evans and Lyons develop a model of daily exchange rate returns depending upon macroeconomicnews and order flow. They use daily interest differential changes as their proxy for macro news and thenumber of purchases minus sales per day as their measure of order flow. While their model is aimed atestimating returns, one can derive their model in absolute value terms to address volatility.
17 We calibrate this pattern by fitting all three parameters for a set of announcements of about equalsignificance, without the lk coefficient. This uniquely identifies the three parameters. For the rest of theannouncement effects, we fix the response pattern and estimate the lk coefficient that loads onto thepattern. Details are available upon request.

338 J. Cai et al. / Journal of International Money and Finance 20 (2001) 327–347
Fig. 3. Estimated announcement response patterns.
each announcement is, in turn, entered into the equation separately while otherannouncements are entered jointly with a separate ‘all other announcements’ coef-ficient. Appendix A provides details on the individual announcement effects. Of the32 US and 33 Japanese announcements analyzed, the following announcements wereemployed in the estimates reported in Table 1: US employment report, CPI, GDP,PPI, merchandise trade balance, consumer installment credit, real earnings, employ-ment costs, reserve assets, and personal income; Japanese employment report, Tan-kan report, unemployment rate, vehicle sales, consumer sentiment index, electricityusage, and vehicle production. Given the importance of the two employment reports,their coefficients are estimated separately. The remaining announcements are aggre-gated into the ‘major announcement’ variable.
Table 1a reports results using the time-varying daily volatility-scaling factor s.Table 1b contains the results based on the constant daily volatility-scaling factors. Column 2 of Table 1a reports estimates of the complete model. The coefficientsassociated with the intraday patterns are significant except for the US afternoonsummer slowdown and the second-order term on winter Monday morning. Andersenand Bollerslev (1998) found day-of-the-week effects to be insignificant for the dol-lar–mark exchange rate once the other calendar effects and announcements wereincluded. However, the coefficients reported in column 2 indicate that the dailydummies are significant. Column 3 reports estimates for the yen–dollar with the day-of-the-week dummies excluded. A chi-square test of the exclusion restriction indi-cates that the day-of-the-week dummies are highly significant. Whether this differ-ence between the results found by Andersen and Bollerslev and our results reflectsa systematic difference between the mark and yen volatility dynamics or is due tothe special nature of the year we study is open to further analysis.
Focusing on the separate sources of volatility, we see that both intervention

339J. Cai et al. / Journal of International Money and Finance 20 (2001) 327–347
Tab
le1a
Usi
ngtim
e-va
ryin
gda
ilyvo
latil
ityfa
ctor
Para
met
erFu
llsy
stem
Day
-of-
the-
wee
kIn
terv
entio
ndu
mm
ies
Mac
ro-a
nnou
ncem
ents
Ord
erflo
wva
riab
les
dum
mie
sex
clud
edex
clud
edex
clud
edex
clud
ed
Con
stan
tin
terc
ept
�4.
65(�
4.32
)�
4.43
(�4.
11)
�4.
63(�
4.29
)�
4.20
(�3.
90)
�6.
08(�
5.66
)H
olid
ay�
0.91
(�18
.48)
�0.
93(�
18.9
8)�
0.91
(�18
.53)
�0.
91(�
18.3
8)�
0.89
(�18
.05)
Tok
yoop
en1.
52(6
.77)
1.52
(6.7
4)1.
52(6
.77)
1.47
(6.5
4)1.
53(6
.80)
US
afte
rnoo
nsu
mm
ersl
owdo
wn
�0.
01(�
0.25
)�
0.01
(�0.
43)
�0.
01(�
0.24
)�
0.01
(�0.
18)
�0.
03(�
1.69
)W
inte
rA
sian
Mon
day
mor
ning
�2.
01(�
2.98
)�
2.13
(�3.
15)
�2.
01(�
2.98
)�
2.01
(�2.
98)
�1.
95(�
2.88
)0.
12(0
.49)
0.09
(0.3
5)0.
12(0
.49)
0.12
(0.4
9)0.
14(0
.57)
Frid
ayla
te�
0.04
(�5.
06)
�0.
03(�
4.32
)�
0.04
(�5.
12)
�0.
04(�
5.19
)�
0.04
(�4.
96)
0.06
×10�
2(3
.57)
0.05
×10�
2(3
.04)
0.06
×10�
2(3
.60)
0.07
×10�
2(3
.66)
0.06
×10�
2(3
.47)
Tok
yolu
nch
brea
k�
0.81
(�11
.15)
�0.
81(�
11.1
3)�
0.81
(�11
.15)
�0.
81(�
11.2
1)�
0.79
(�10
.88)
Eur
opea
nlu
nch
brea
k�
0.21
(�3.
18)
�0.
21(�
3.17
)�
0.21
(�3.
20)
�0.
19(�
2.86
)�
0.21
(�3.
24)
Sum
mer
high
vola
tility
at22
10–
1.47
(5.4
5)1.
51(5
.62)
1.47
(5.4
5)1.
46(5
.44)
1.36
(5.0
4)22
25G
MT
Tue
sday
0.12
(3.8
4)0.
12(3
.84)
0.13
(4.1
0)0.
12(3
.95)
Wed
nesd
ay0.
17(5
.51)
0.17
(5.6
0)0.
17(5
.57)
0.17
(5.5
9)T
hurs
day
0.26
(8.4
9)0.
26(8
.49)
0.27
(8.8
0)0.
26(8
.58)
Frid
ay0.
23(7
.10)
0.24
(7.2
9)0.
26(7
.99)
0.24
(7.1
3)FE
Dan
dB
OJ
inte
rven
tion
on2.
65(2
.75)
2.67
(2.7
7)2.
58(2
.67)
2.68
(2.7
7)Ju
ne17
BO
Jin
terv
entio
non
Apr
il10
1.09
(2.9
2)1.
16(3
.13)
1.05
(2.8
2)1.
23(3
.30)
US
empl
oym
ent
repo
rts
2.00
(5.6
0)2.
16(6
.06)
1.98
(5.5
4)2.
01(5
.62)
Japa
n’s
empl
oym
ent
repo
rts
1.78
(5.0
6)1.
88(5
.36)
1.77
(5.0
2)1.
80(5
.08)
Maj
oran
noun
cem
ents
inU
S1.
14(8
.13)
1.21
(8.5
8)1.
13(8
.06)
1.15
(8.1
2)M
ajor
anno
unce
men
tsin
Japa
n1.
01(5
.54)
1.03
(5.6
5)1.
00(5
.50)
1.02
(5.6
0)Sp
ot,
forw
ard
purc
hase
d3.
21×1
0�2
(8.1
8)3.
26×1
0�2
(8.2
9)3.
20×1
0�2
(8.1
4)3.
24×1
0�2
(8.2
5)Sp
ot,
forw
ard
sold
�3.
82×1
0�2
(�9.
62)
�3.
86×1
0�2
(�9.
73)
�3.
81×1
0�2
(�9.
60)
�3.
85×1
0�2
(�9.
69)
Log
-lik
elih
ood
�17
9,44
4.33
�17
9,48
8.04
�17
9,45
8.73
�17
9,49
6.30
�17
9,57
7.42

340 J. Cai et al. / Journal of International Money and Finance 20 (2001) 327–347
Tab
le1b
Usi
ngco
nsta
ntda
ilyvo
latil
ityfa
ctor
Para
met
erFu
llsy
stem
Day
-of-
the-
wee
kIn
terv
entio
ndu
mm
ies
Mac
ro-a
nnou
ncem
ents
Ord
erflo
wva
riab
les
dum
mie
sex
clud
edex
clud
edex
clud
edex
clud
ed
Con
stan
tin
terc
ept
�8.
63(�
7.96
)�
8.40
(�7.
75)
�8.
60(�
7.94
)�
8.19
(�7.
57)
�6.
28(�
5.79
)H
olid
ay�
0.91
(�18
.33)
�0.
93(�
18.8
0)�
0.92
(�18
.39)
�0.
91(�
18.2
4)�
0.90
(�17
.97)
Tok
yoop
en1.
51(6
.67)
1.50
(6.6
3)1.
51(6
.67)
1.47
(6.4
5)1.
52(6
.67)
US
afte
rnoo
nsu
mm
ersl
owdo
wn
0.01
(0.3
7)0.
01(0
.19)
0.01
(0.3
8)0.
01(0
.43)
�0.
01(�
0.37
)W
inte
rA
sian
Mon
day
mor
ning
�2.
03(�
2.96
)�
2.15
(�3.
14)
�2.
03(�
2.96
)�
2.03
(�2.
97)
�1.
98(�
2.94
)0.
11(0
.44)
0.07
(0.3
0)0.
11(0
.44)
0.11
(0.4
4)0.
13(0
.52)
Frid
ayla
te�
0.04
(�5.
07)
�0.
03(�
4.31
)�
0.04
(�5.
14)
�0.
04(�
5.20
)�
0.04
(�5.
11)
0.06
×10�
2(3
.62)
0.05
×10�
2(3
.08)
0.07
×10�
2(3
.66)
0.07
×10�
2(3
.71)
0.07
×10�
2(3
.67)
Tok
yolu
nch
brea
k�
0.82
(�11
.17)
�0.
82(�
11.1
4)�
0.82
(�11
.16)
�0.
82(�
11.2
3)�
0.81
(�10
.95)
Eur
opea
nlu
nch
brea
k�
0.21
(�3.
11)
�0.
21(�
3.10
)�
0.21
(�3.
13)
�0.
18(�
2.80
)�
0.21
(�3.
13)
Sum
mer
high
vola
tility
at22
10–
1.50
(5.6
0)1.
55(5
.76)
1.50
(5.6
0)1.
50(5
.59)
1.46
(5.4
6)22
25G
MT
Tue
sday
0.10
(3.2
8)0.
10(3
.27)
0.11
(3.5
2)0.
10(3
.33)
Wed
nesd
ay0.
16(5
.36)
0.17
(5.4
6)0.
17(5
.42)
0.17
(5.4
0)T
hurs
day
0.29
(9.3
2)0.
29(9
.32)
0.30
(9.6
2)0.
30(9
.46)
Frid
ay0.
24(7
.16)
0.25
(7.4
0)0.
27(8
.04)
0.24
(7.2
0)Fe
dan
dB
OJ
inte
rven
tion
on2.
76(2
.86)
2.77
(2.8
8)2.
69(2
.79)
2.57
(2.6
7)Ju
ne17
BO
Jin
terv
entio
non
Apr
il10
1.36
(3.6
6)1.
44(3
.88)
1.33
(3.5
6)1.
05(2
.82)
US
empl
oym
ent
repo
rts
2.02
(5.6
8)2.
18(6
.16)
1.99
(5.6
1)1.
99(5
.61)
Japa
n’s
empl
oym
ent
repo
rts
1.65
(4.5
9)1.
73(4
.88)
1.63
(4.5
4)1.
63(4
.68)
Maj
oran
noun
cem
ents
inU
S1.
12(7
.87)
1.19
(8.3
4)1.
11(7
.80)
1.16
(8.2
2)M
ajor
anno
unce
men
tsin
Japa
n1.
00(5
.41)
1.03
(5.5
4)0.
99(5
.35)
0.98
(5.2
3)Sp
ot,
forw
ard
purc
hase
d5.
28×1
0�2
(13.
40)
5.33
×10�
2(1
3.51
)5.
26×1
0�2
(13.
36)
5.31
×10�
2(1
3.47
)Sp
ot,
forw
ard
sold
�4.
09×1
0�2
(�10
.27)
�4.
14×1
0�2
(�10
.38)
�4.
08×1
0�2
(�10
.25)
�4.
12×1
0�2
(�10
.34)
Log
-lik
elih
ood
�17
9,90
9.25
�17
9,96
1.42
�17
9,92
7.55
�17
9,95
8.42
�18
0,41
4.24

341J. Cai et al. / Journal of International Money and Finance 20 (2001) 327–347
dummy variables are positive and significant, indicating that volatility was higheron the intervention days. Column 4 of Table 1a reports estimates of the model withthe intervention dummies omitted. A likelihood ratio test of the exclusion restrictionindicates that the intervention dummies are jointly significant. Among macroecon-omic announcements, the employment reports have the largest effect on yen–dollarvolatility similar to the mark–dollar findings of Andersen and Bollerslev (1998). Theother major announcements also have positive and significant effects on volatility.Column 5 of Table 1a reports estimates of the model with the macroeconomicannouncements variables excluded. A likelihood ratio test of the exclusion restrictionindicates they are jointly highly significant. Finally, order flow, as proxied by pur-chases and sales of spot, forward, and futures contracts by major market participants,is seen to have a significant effect on volatility. Purchases are associated with highervolatility and sales with lower volatility. The positive and significant effect of pur-chases is consistent with volatility being caused by the unwinding of yen carry-tradepositions. Periods with large yen sales by major participants are associated withlower yen volatility. This suggests that the establishment of short yen positions wasconsistent with a tranquil market. Column 6 of Table 1a reports model estimateswith the order flow variables excluded. A likelihood ratio test of the exclusion restric-tion indicates that the order flow variables are also jointly highly significant.
The estimates reported in Table 1b, using the constant daily volatility-scaling fac-tor are generally quite similar to those reported in Table 1a. The variables that werefound to be insignificant determinants of yen/dollar volatility in Table 1a are alsothe variables with insignificant coefficients in Table 1b. The qualitative results ofTable 1a all carry over to Table 1b. The greatest difference between the two tablesis with regard to the order-flow variables. There appears to be collinearity betweenthe time-varying daily volatility factor used in Table 1a and order flow. When theconstant daily volatility factor is used in Table 1b, we find order flow to have largercoefficients and a greater level of statistical significance. The likelihood-ratio statisticon the joint significance of the order flow variables implied by the results reportedin the last column of each table increases from 266 in Table 1a to 1010 in Table1b. It seems likely that the generated time-varying daily volatility-scaling variables is, at least partially, reflecting shifts in order flow over time.
The results of Tables 1a and 1b indicate that each of the major factors we examinehas a statistically significant role in explaining volatility. Now we would like to havean idea of the relative contributions of each to understanding yen–dollar volatilityin 1998. The next section will provide a measure of the marginal predictive powerof each individual component.
4. The relative importance of different volatility components
In this section we provide a direct assessment of the joint and marginal predictivepower of each of the four volatility components—intraday calendar effects,announcement effects, intervention effects, and order flow. The basic idea is to con-struct a series of five-minute volatility forecasts v(I:t,n) that in turn omits or includes

342 J. Cai et al. / Journal of International Money and Finance 20 (2001) 327–347
only the contribution from each of the four components. The day-of-the-week andholiday effects are always included in the regressions. The joint and marginal contri-bution of the four volatility components at the daily and intraday frequencies arethen measured by the coefficient of explained variation, R2, from the regressions ofthe realized daily cumulative absolute returns, SN
n�1|Rt,n�R|, and the realized five-minute absolute returns, |Rt,n�R|, on the corresponding volatility forecasts,SN
n�1v(I:t,n) and v(I:t,n), respectively.Table 2 summarizes the results for the different model configurations. Columns
2 and 3 contain results for models based upon the time-varying daily volatility-scaling factor while results reported in columns 4 and 5 are for models using theconstant daily volatility-scaling factor. The numbers in the second and fourth col-umns refer to the degree of explained variation in the daily cumulative absolutereturns. The complete model using the time-varying daily volatility-scaling factors accounts for 49.7% of the cumulative daily volatility.18 The complete model withthe constant daily volatility-scaling factor s explains 23.7% of the total variation.The explanatory power is similar when the calendar effects are removed from theforecast. The R2 drops slightly when the announcement variables are deleted. It drops
Table 2Explained variation (R2) from regressions of Japanese yen–US dollar daily cumulative absolute returnsor five-minute absolute returns on absolute return forecastsa
Time-varying daily volatility Constant daily volatilityModel Daily Five-minute Daily Five-minute
cumulative absolute return cumulative absolute returnabsolute return absolute return
Complete model 0.497 0.072 0.237 0.046No intraday calendar effects 0.497 0.053 0.237 0.028No announcements 0.490 0.071 0.228 0.045No intervention dummies 0.482 0.069 0.218 0.043No order flow 0.477 0.073 0.031 0.027Intraday calendar effects only 0.469 0.069 0.024 0.022Announcements only 0.470 0.050 0.029 0.007Intervention dummies only 0.478 0.052 0.034 0.007Order flow only 0.489 0.049 0.228 0.024
a The table reports the explained variation (R2) from regressing SNn�1|Rt,n�R| on
SNn�1v(I:t,n),t=1,2,…T for daily cumulative absolute returns and from regressing |Rt,n�R| on
v(I:t,n),t=1,2,…T,n=1,2,…N, for five-minute absolute returns. v(I:t,n) is the five-minute volatility forecastthat in turn leaves out or includes only the contribution from each of the following components, theintraday calendar effects, the announcement effects, the intervention dummies, and predicted order flowby big market participants. The first two columns report estimates for the complete model using the time-varying daily volatility factor s. The remaining columns report estimates using the constant daily volatilityfactor s. The day-of-the-week dummies and holiday effects are included in all regressions.
18 Explanatory power may be increased for the cumulative absolute returns when some components aredeleted since the forecasts at this horizon involve a nonlinear transformation of the components.

343J. Cai et al. / Journal of International Money and Finance 20 (2001) 327–347
somewhat more without the intervention dummies. The biggest drop in explanatorypower for the daily cumulative absolute returns occurs when order flow is omitted.
As one would expect, the models estimated for five-minute absolute returns revealsignificant explanatory power for the intraday calendar effects. Five-minute absolutereturn models based on s find that the deletion of announcements, interventiondummies, or order flow all have about the same minor effect on explanatory power.The five-minute absolute return models based on s find the same results forannouncements or intervention, but now we see the omission of order flow cuttingexplanatory power roughly in half. This different inference on order flow effectsbetween models based on s or s is due to the collinearity that exists between orderflow and s.
Examining the explanatory power when each source of volatility is used by itselfto forecast, provides the R2 results reported in the last four rows of Table 2. Standingalone, the R2 estimates for daily cumulative absolute returns are listed in ascendingorder as calendar, announcement, intervention, and order flow effects; with time-varying (constant) daily volatility values ranging from 46.9 (2.4) to 48.9 (22.8)%. Forthe five-minute absolute returns, results using time-varying daily volatility indicatecalendar effects have the highest R2 of 6.9% while the other three components haveapproximately the same values of 5%. With constant daily volatility, the five-minuteabsolute returns range from a low of 0.7% for announcements and intervention to2.4% for order flow. The evidence presented in Table 2 suggests that, compared tothe effect of order flow, the announcement and intervention effects are of secondaryimportance in understanding yen–dollar volatility in 1998.
5. Discussion and conclusion
This paper provides a detailed characterization of the Japanese yen–US dollarspot exchange rate return volatility over 1998. The yen–dollar exchange rate wasextraordinarily volatile during the year with periods of both rapid yen depreciationand rapid yen appreciation. A review of the news during the year suggests the follow-ing candidates as sources of the dramatic volatility: foreign exchange market inter-vention by the Bank of Japan, the US Treasury and the Federal Reserve; shiftingfundamentals related to US and Japanese macroeconomic conditions; and spilloverfrom the Asian and Russian financial crises and Long Term Capital Managementlosses resulting in a liquidity crunch that caused large investment funds to unwindshort yen positions. Our analysis is focused on identifying the relative contributionsof these various factors in understanding the yen–dollar volatility of 1998.
In order to obtain meaningful estimates of the effects of intervention, macroecon-omic announcements, and big-trader order flow, a model capturing the typical intra-daily volatility pattern over a 24-h trading day must be employed. The resultingmodel incorporates intradaily calendar effects to account for the regular daily patternof activity in the yen–dollar market. Our analysis also details the impact of a compre-hensive list of 32 US and 33 Japanese regularly released macroeconomic announce-ments. Most of the ten significant US announcements and six significant Japanese
344 J. Cai et al. / Journal of International Money and Finance 20 (2001) 327–347
announcements are associated with the real side of the economies, with employmentreports from both countries on top of the list. In contrast to previous studies, theday-of-the-week effects cannot be attributed to the clustering of scheduled macroe-conomic news releases on Thursdays and Fridays during the morning session of UStrading hours.
Comparing the alternative sources of volatility, we find that order flow is mostimportant. The significance of order flow by itself could simply reflect the effect ofsome underlying true causal factor like macroeconomic announcements or inter-vention. However, even accounting for a lengthy list of announcements and the actualinterventions that occurred during 1998, we find an independent role for order flowin explaining yen–dollar volatility. This finding lends support to the assertion thatportfolio shifts were responsible for much of the volatility. The popular story is thatearly in the year there was a large-scale shift into short yen positions associated withthe yen ‘carry trade’ of borrowing yen at extremely low interest rates and theninvesting in higher-yielding assets denominated in other currencies. Later in the year,following losses in Asian and Russian markets and credit constraints associated withnew perceptions of risk following Long Term Capital Management’s problems, therewas a large-scale unwinding of the short-yen positions. The market learns about suchportfolio shifts through order flow rather than public announcements. Our resultslend support to the effect of order flow being an important determinant of yen–dollarvolatility in 1998.
In a broader context than our particular yen–dollar application, are the implicationsfor understanding the structure of the foreign exchange market. It has long beenknown that empirical exchange rate models based on fundamentals perform poorly.This has led to an ongoing search for better approaches to modeling exchange ratedynamics. Recently, some studies have provided suggestive evidence that the act oftrading, apart from any news regarding fundamentals, may be an important sourceof exchange rate movements. As a market with a relative lack of transparency andasymmetrically informed traders, it should not be surprising to find that order flowcontains independent information. Just as news regarding macro announcements canaffect volatility by providing information to the market, so does large order flowconvey new information. While we might expect order flow to reflect macro news,what else could drive position changes? In general, order flow that is orthogonal tocurrent macro news may reflect expectations of future changes in fundamentals orrevised expectations due to institutional changes. In the most dramatic period of yenvolatility in 1998, it is likely that changing risk perceptions and associated creditconstraints associated with the Russian bond default, losses in Asian markets, andthe LTCM debacle contributed to the order flow associated with unwinding the yencarry trade. Such an effect will not be revealed by macroeconomic announcements.As discussed in the introduction, practitioners have long argued that order flow is amajor source of price movements. However, only now is the evidence accumulatingto support this view. It is in this sense that our findings have implications beyondthe yen–dollar application studied. We provide new evidence in support of the role oforder flow and its associated information as a determinant of exchange rate dynamics.

345J. Cai et al. / Journal of International Money and Finance 20 (2001) 327–347
Acknowledgements
We would like to thank City University of Hong Kong for its support. In addition,financial support from RGC Competitive Earmarked Research Grants 1994–1996and 1996–1998 (Cai) is gratefully acknowledged. Helpful comments on an earlierdraft were provided by Charles Goodhart, Richard Lyons, Bettina Peiers, and theanonymous referees. Finally, we thank Tim Bollerslev for sharing his programs.
Appendix A. Individual macroeconomic news announcement effects
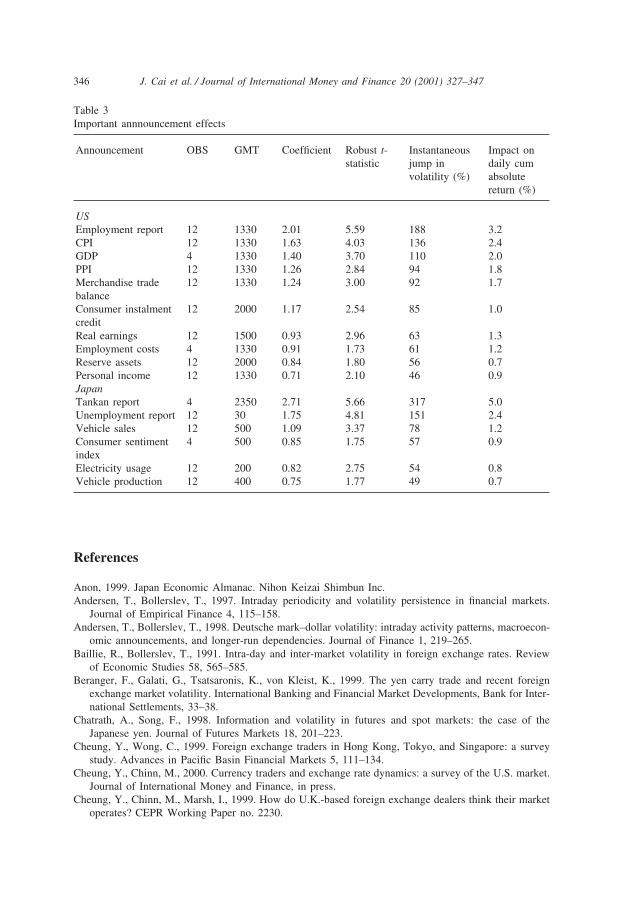
The dependent variables are based on raw five-minute returns on the Japaneseyen–US dollar spot exchange rate. The sample period is from January 1998 toDecember 1998 for a total of 74,880 observations. The regression takes the form asin Table 1. The volatility response pattern following announcements is approximatedby a third-order polynomial restricted to reach zero at the end of the response horizonof one hour, or the 13th five-minute interval. The reported coefficients measure theextent to which the absolute returns load onto this pattern following the announce-ment. The sample of macroeconomic news includes 32 announcements from the USand 33 announcements from Japan. The instantaneous jump in volatility measuresthe estimated increase in the five-minute absolute return for the interval when theannouncement is made. The estimated total cumulative absolute return induced bythe announcement over the assumed horizon is measured relative to the mediancumulative absolute return over the sample period of 11.7% per day.
Table 3 only summarizes the results for the significant announcements from boththe US and Japan. In descending order based on the estimated volatility jump, theinsignificant US announcements include construction spending, FOMC meetingminutes, factory inventories, housing starts, new single-family home sales, housingcompletion, NAPM survey, industrial production, productivity and costs, initial job-less claims, existing home sales, beige book, federal budget, durable goods orders,import prices, leading indicators, money supply (M2), consumer confidence, retailsales, business inventories, current account deficit, and auto sales. The insignificantJapanese announcements in descending order include the current account, vehicleexports, foreign currency reserves, housing starts, GDP, merchandise trade balance,Tokyo new condo sales, vehicle imports, money supply (M2+CD), leading indicators,Tokyo department store sales, large scale retail sales, bank lending, bankruptcies,average lending rate, wholesale price index, nationwide department store sales, cor-porate service price, Tokyo office vacancy rate, steel production, machine tool orders,household spending, industrial production, machinery orders, international securitiesinvestment, crude oil imports, and consumer price index.
346 J. Cai et al. / Journal of International Money and Finance 20 (2001) 327–347
Table 3Important annnouncement effects
Announcement OBS GMT Coefficient Robust t- Instantaneous Impact onstatistic jump in daily cum
volatility (%) absolutereturn (%)
USEmployment report 12 1330 2.01 5.59 188 3.2CPI 12 1330 1.63 4.03 136 2.4GDP 4 1330 1.40 3.70 110 2.0PPI 12 1330 1.26 2.84 94 1.8Merchandise trade 12 1330 1.24 3.00 92 1.7balanceConsumer instalment 12 2000 1.17 2.54 85 1.0creditReal earnings 12 1500 0.93 2.96 63 1.3Employment costs 4 1330 0.91 1.73 61 1.2Reserve assets 12 2000 0.84 1.80 56 0.7Personal income 12 1330 0.71 2.10 46 0.9JapanTankan report 4 2350 2.71 5.66 317 5.0Unemployment report 12 30 1.75 4.81 151 2.4Vehicle sales 12 500 1.09 3.37 78 1.2Consumer sentiment 4 500 0.85 1.75 57 0.9indexElectricity usage 12 200 0.82 2.75 54 0.8Vehicle production 12 400 0.75 1.77 49 0.7
References
Anon, 1999. Japan Economic Almanac. Nihon Keizai Shimbun Inc.Andersen, T., Bollerslev, T., 1997. Intraday periodicity and volatility persistence in financial markets.
Journal of Empirical Finance 4, 115–158.Andersen, T., Bollerslev, T., 1998. Deutsche mark–dollar volatility: intraday activity patterns, macroecon-
omic announcements, and longer-run dependencies. Journal of Finance 1, 219–265.Baillie, R., Bollerslev, T., 1991. Intra-day and inter-market volatility in foreign exchange rates. Review
of Economic Studies 58, 565–585.Beranger, F., Galati, G., Tsatsaronis, K., von Kleist, K., 1999. The yen carry trade and recent foreign
exchange market volatility. International Banking and Financial Market Developments, Bank for Inter-national Settlements, 33–38.
Chatrath, A., Song, F., 1998. Information and volatility in futures and spot markets: the case of theJapanese yen. Journal of Futures Markets 18, 201–223.
Cheung, Y., Wong, C., 1999. Foreign exchange traders in Hong Kong, Tokyo, and Singapore: a surveystudy. Advances in Pacific Basin Financial Markets 5, 111–134.
Cheung, Y., Chinn, M., 2000. Currency traders and exchange rate dynamics: a survey of the U.S. market.Journal of International Money and Finance, in press.
Cheung, Y., Chinn, M., Marsh, I., 1999. How do U.K.-based foreign exchange dealers think their marketoperates? CEPR Working Paper no. 2230.

347J. Cai et al. / Journal of International Money and Finance 20 (2001) 327–347
Dacorogna, M., Muller, U., Nagler, R., Olsen, R., Pictet, O., 1993. A geographical model for the dailyand weekly seasonal volatility in the FX market. Journal of International Money and Finance 12,413–438.
DeGennaro, R., Shrieves, R., 1997. Public information releases, private information arrival, and volatilityin the foreign exchange market. Journal of Empirical Finance 4, 295–315.
Ederington, L., Lee, J., 1994. The response of the dollar–yen exchange rate to economic announcements.Financial Engineering and the Japanese Markets 1, 111–128.
Evans, M., 1997. The microstructure of foreign exchange dynamics, Working Paper, Georgetown Univer-sity.
Evans, M., Lyons, R., 1999. Order flow and exchange rate dynamics, Working Paper, University ofCalifornia at Berkeley.
Hakkio, C., Pearce, D., 1985. The reaction of exchange rates to economic news. Economic Inquiry 23,621–636.
Hardouvelis, G., 1984. Market perceptions of Federal Reserve policy and the weekly monetary announce-ments. Journal of Monetary Economics 14, 225–240.
Harvey, C., Huang, R., 1991. Volatility in the foreign currency futures market. Review of FinancialStudies 4, 543–569.
Ito, T., Lyons, R., Melvin, M., 1998. Is there private information in the FX market? The Tokyo experiment.Journal of Finance 53, 1111–1130.
Ito, T., Roley, V., 1987. News from the U. S. and Japan: which moves the yen/dollar exchange rate?Journal of Monetary Economics 19, 255–277.
Leng, H., 1996. Announcement versus nonannouncement: a study of intraday transaction price paths ofDeutsche mark and Japanese yen futures. Journal of Futures Markets 16, 829–857.
Lyons, R., 1995. Tests of microstructural hypotheses in the foreign exchange market. Journal of FinancialEconomics 39, 321–351.
Melvin, M., Yin, X., 2000. Public information arrival, exchange rate volatility, and quote frequency. TheEconomic Journal 110, 644–661.
Menkhoff, L., 1998. The noise trading approach—questionnaire evidence from foreign exchange. Journalof International Money and Finance 17, 547–564.
Tett, G., 1999. Bruised investors wait for rising yen bubble to burst, Financial Times, June 25, p. V.Thornton, D., 1989. The effect of unanticipated money on the money and foreign exchange markets.
Journal of International Money and Finance 8, 573–587.Yao, J., 1998. Market making in the interbank foreign exchange market. New York University Salomon
Center Working Paper no. 5-98-3.Wei, S.-J., Kim, J. 1997. The big players in the foreign exchange market: do they trade on information
or noise? NBER Working Paper 6256.