Embed Size (px)
Citation preview

On Validity of Extreme Value Theory-BasedParametric Models for Out-of-Distribution
Detection
Tomasz Walkowiak[0000−0002−7749−4251], Kamil Szyc[0000−0001−6723−271X], andHenryk Maciejewski[0000−0002−8405−9987]
Wroclaw University of Science and Technology{tomasz.walkowiak,kamil.szyc,henryk.maciejewski}@pwr.edu.pl
Abstract. Open-set classifiers need to be able to recognize inputs thatare unlike the training or known data. As this problem, known as out-of-distribution (OoD) detection, is non-trivial, a number of methods todo this have been proposed. These methods are mostly heuristic, withno clear consensus in the literature as to which should be used in spe-cific OoD detection tasks. In this work, we focus on a recently proposed,yet popular, Extreme Value Machine (EVM) algorithm. The methodis unique as it uses parametric models of class inclusion, justified bythe Extreme Value Theory, and as such is deemed superior to heuris-tic methods. However, we demonstrated a number of open-set text andimage recognition tasks, in which the EVM was outperformed by sim-ple heuristics. We explain this by showing that the parametric (Weibull)model in EVM is not appropriate in many real datasets, which is due tounsatisfied assumptions of the Extreme Value Theorem. Hence we arguethat the EVM should be considered another heuristic method.
Keywords: Open-set classification · Out-of-distribution detection · Ex-treme Value Machine · Extreme Value Theory.
1 Introduction
Machine learning systems deployed for real-world recognition tasks often haveto deal with data that come from categories unseen during training. This occursespecially in image or text recognition, where it is usually infeasible to collecttraining examples that correspond to all categories which can be encountered atprediction time. Hence it is important that classifiers can detect such examplesas unrecognized and not silently assign them to one of the known classes. How-ever, most state-of-the-art models for image recognition operate as closed-setclassifiers, i.e., they tend to assign any example to some of the known classes.An illustration of such behavior by the well-known ResNet model is shown inFig. 1. Such misclassification errors limit adoption of closed-set models in prob-lems where new categories emerge over time (incremental learning problems) orcan lead to accidents in safety-critical computer vision applications, which is acrucial concern in AI Safety [1].
ICCS Camera Ready Version 2021To cite this paper please use the final published version:
DOI: 10.1007/978-3-030-77967-2_13

2 Walkowiak et al.
Fig. 1: Images of unknown class (Ligature, Highway, not available in trainingdata) recognized by the ResNet-50 model as a known class (Ligature recognizedas Jellyfish, Highway recognized as Dam). Examples from [12]
.
To deal with this problem, several methods have been proposed to recognizewhen inputs to classifiers are unlike the training examples. In different studies,such inputs are referred to as anomalous, outliers, or out-of-distribution (OoD)examples with regard to the training data. Classifiers that incorporate suchdetection methods are known as open-set classifiers. A recent comprehensivesurvey of open-set recognition methods is given in [6]. Closed-set classifiers fail toreject OoD examples, as they approximate posterior probabilities P (ci|x) for aninput sample x, where ci ∈ {c1, c2, . . . , cM} are the categories known in trainingdata and assign any sample to the class maximizing P (ci|x). Open-set classifiersattempt to reject unrecognized inputs that are reasonably far from known data.This is, broadly, done by constructing decision boundaries based on distributionsof training data or by building abating probability models, where the probabilityof class membership decreases as observations move from training/known data.
An example of the former approach is the ’1-vs-set’ model proposed by [23],and examples of the latter are W-SVM [22], or PI-SVM (probability-of-inclusionSVM) by [13] (all these methods are open-set versions of the SVM model). Junioret al. [14] proposed an open-set version of the Nearest-Neighbours classifier, witha threshold on class similarity scores used to realize the rejection option. Bendaleand Bould [2] proposed an open-set version the nearest-class-mean model [17],with rejection based on the thresholded Mahalanobis distance, see also [15].Specific models for open-set recognition with deep CNNs include the Openmax[3] and OoD methods with outlier-exposure [10, 9], which rely on the observationthat OoD differs in terms of the distribution of softmax probabilities as comparedwith known (in-distribution) examples.
In contrast to all these methods, which can be seen as heuristic procedures,with no theoretical justification, Rudd et al. [20] proposed a theoretically soundclassifier - the Extreme Value Machine (EVM). Its parametric model of the
ICCS Camera Ready Version 2021To cite this paper please use the final published version:
DOI: 10.1007/978-3-030-77967-2_13

On Validity of Extreme Value Theory-based Models ... 3
probability of inclusion uses the Weibull distribution, which is justified by theExtreme Value Theory. The authors claim that this leads to the superior per-formance of EVM on some open-set benchmark studies reported as compared toheuristic methods.
The motivation of this research comes from the observation we made thatfor a number of datasets in text or image recognition the EVM is surpassed bysimpler, heuristic models. The main contributions of this work are the following.We analyzed Extreme Value Theory assumptions, which justify the adoption ofthe Weibull distribution by the EVM method. We showed that these assumptionsoften do not hold in real recognition problems and illustrated this in a numberof text and image classification studies. We empirically compared the EVM withsimple OoD detection methods based on the LOF (Local Outlier Factor) andexplained what properties of the training data lead to low performance of theEVM. We conclude that the theoretical soundness of EVM in many real-lifestudies can be questioned, and hence the method should be considered anotherheuristic procedure.
The paper is organized as follows. In section 2, we explain how open-set clas-sifiers perform out of distribution detection using a probability of inclusion-basedand density-based methods. Then we provide details on the EVM (probabilityof inclusion-based) and the LOF (density-based), which we later use in the com-parative study. We also provide OoD evaluation metrics. In section 3 we reportresults of the numerical study comparing EVM with LOF on both text and im-age data and provide results of goodness-of-fit tests, which show that the EVMWeibull model is not appropriate. We discuss this concerning the EVT assump-tions. Finally, we discuss the type of inter-class separation which most likelyleads to the low performance of the EVM.
2 Methods
2.1 Out of Distribution Detection
In order to realize open-set recognition, classifiers must be able to reject as un-recognized the samples which are out-of distribution with regard to the trainingdata of known classes. This allows reducing the open-space risk [23], i.e. misclas-sification of these OoD samples by assigning them to one of the known classes.
The key difference between open-set classifiers is how the rejection option isimplemented.
A commonly used approach to reduce the open-space risk is to implementthe probability of inclusion model. An input sample x is then classified as ci =arg maxc∈C P (c|x) providing P (ci|x) > δ, and labelled as unrecognized other-wise. The models of the probability of class inclusion attempt to model P (ci|x)as a decreasing function of the distance between x and the training data Xi per-taining to class ci. Such models are referred to as compact abating probability(CAP) models [22]. The Extreme Value Machine which is the focus of this workis based on this idea; in section 2.3 we explain how EVM constructs the CAPmodel for P (ci|x).
ICCS Camera Ready Version 2021To cite this paper please use the final published version:
DOI: 10.1007/978-3-030-77967-2_13

4 Walkowiak et al.
Another approach is realized by distance-based methods, where rejection isdone by directly using distance to known data. An input sample x is classified asci = arg maxc∈C P (c|x) providing d(x,Xi) < δ, where d(x,Xi) is some measureof distance between x and the known training data Xi pertaining to class ci. Ford(x,Xi) ≥ δ, x is unrecognized. This idea is implemented e.g. by the open-setversion of the nearest class mean classifier [2, 17], where d(x,Xi) is calculated asMahalanobis distance.
Density-based methods can be seen as conceptually related to the distance-based methods, however the measure d(x,Xi) used to realize rejection of OoDsamples is calculated as some measure of outlierness of x with regard to theknown data Xi. This can be based on the density or the outlierness factor suchas the Local Outlier Factor (LOF) [4]. The latter is used in the empirical studyas an alternative method compared to the Extreme Value Machine.
2.2 Local Outlier Factor
The Local Outlier Factor [4] is based on an analysis of the local density ofpoints. It works by calculating the so-called local reachability distance, definedas an average distance between a given point, its neighbors, and their neighbors.The relative density of a point against its neighbors is used to indicate thedegree of the object being an OoD. The local outlier factor is formally definedas the average of the ratio of the local reachability of an object to its k-nearestneighbors. If the LOF value for a given point is larger than some threshold, thepoint is assumed to be OoD. In the case of the open set classification problem,the LOF threshold could be calculated based on the assumption that the trainingdata include a given portion of outliers (called contamination in code 1).
2.3 Extreme Value Machine
Extreme Value Machine constructs a compact abating probability model ofP (ci|x) that x belongs to ci. This popular model is justified by the ExtremeValue Theory, and as such, deemed superior by the authors as compared withheuristic models.
Technically, to construct the CAP model for a class ci ∈ C = {c1, c2, . . . , cM},we create the radial inclusion function for each point xi ∈ Xi, where Xi repre-sents the training data for class ci. Given a fixed point xi ∈ Xi, τ closest trainingexamples from classes other than ci are selected, denoted here as {t1, . . . , tτ},and the margin distances from xi to these examples are calculated as
mij =‖xi − tj‖
2, j = 1, . . . , τ (1)
Then the parametric model of the margin distance from xi is estimated byfitting the Weibull distribution to the data {mi1,mi2, . . . ,miτ}. This step isjustified by the authors by the Extreme Value Theory, and is later analyzed
1 http://scikit-learn.org/stable/modules/generated/sklearn.neighbors.LocalOutlierFactor.html
ICCS Camera Ready Version 2021To cite this paper please use the final published version:
DOI: 10.1007/978-3-030-77967-2_13

On Validity of Extreme Value Theory-based Models ... 5
in terms of validity of the underlying assumptions in section 3.3. The fittedWeibull model is described by the scale λi and shape κi parameters, and hencethe Weibull survival function (1−CDF ) is postulated as the radial class inclusionfunction:
Ψ(xi, x) = e−(‖xi−x‖λi
)κi(2)
This can be interpreted as the CAP model of the decreasing probability ofinclusion of the sample x in the class represented by training example xi.
Given this model, the open-set classification of an input x is done as follows.The probability that x is associated with the class ci is estimated as P (ci|x) =Ψ(xj , x)), where xj = arg maxxk∈Xi Ψ(xk, x) (ie. xj is the training examplein Xi closest to x). Finally, the open-set classification of x is done as ci =arg maxc∈C P (c|x) if P (ci|x) > δ, and x is considered unknown otherwise.
Remarks on the Extreme Value Machine Implementation
It should be noticed that the ‘official’ implementation of the EVM2 uses thelibMR3 library for the Weibull model fitting (libMR is provided by the authors of[24]). Given the sample {mi1,mi2, . . . ,miτ}, libMR first performs linear trans-formation: ηij = −mij − max {mi1,mi2, . . . ,miτ} + 1, j = 1, . . . , τ , and thenreturns the parameters (λi, κi) of the Weibull model fitted to {ηi1, ηi2, . . . , ηiτ}.The parameters (λi, κi) are used in Eq. 2.
In the empirical study in Section 3, we verify the goodness of this fit andshow that in all the datasets considered the Weibull model is not appropriatefor {mi1,mi2, . . . ,miτ} (the original margin distances) and for {ηi1, ηi2, . . . , ηiτ}(the transformed margin distances).
2.4 OoD Evaluation Metric
In the next section, we want to empirically compare the performance of theEVM and LOF methods in the task of OoD detection. In the evaluation ofOoD detection algorithms, we follow the approach used in [11]. OoD detection istreated as binary classification, with the OoD examples defined as the positiveclass and the in-distribution examples as the negative class. As the OoD detectionquality metric we used the area under the receiver operating characteristic curve(AUROC). It could be used since EVM and LOF (and other OoD methods,Section 2.1) use a rejection threshold value which affects the false positive andtrue negative rates. Technically, the ROC curve shows the False Positive Rate(FPR) on the x-axis and the True Positive Rate (TPR) on the y-axis acrossmultiple thresholds. In the OoD problem, the FPR measures the fraction of in-distribution examples that are misclassified as outliers. The TPR measures thefraction of OoD examples that are correctly labeled as outliers.
2 https://github.com/EMRResearch/ExtremeValueMachine3 https://github.com/Vastlab/libMR
ICCS Camera Ready Version 2021To cite this paper please use the final published version:
DOI: 10.1007/978-3-030-77967-2_13

6 Walkowiak et al.
The performed experiments data were divided into three data sets: training,testing, and outlier one. The first two are classical data sets used in closed-setclassification and represent in-distribution data. The training data set was usedto built OoD models, where test and outlier ones (as a negative and positive class)are used to evaluate OoD algorithms. In performed experiments, the number ofoutliers was set to be equal to the size of the test data. It could be noticed thatin the presented approach, OoD detection algorithms have no knowledge aboutOoD world. They built their models based on in-distribution data only.
3 Computational Experiments
In this section, we empirically compare the EVM and LOF methods in the taskof OoD in image classification and text documents classification. Since resultsof this study (Section 3.2) show that the theoretically-justified EMV can beoutperformed by a heuristic procedure, we verify using goodness-of-fit tests ifthe EVM margin distances (Eq. (1)) in these datasets follow the Weibull distri-bution (Section 3.3). Next in Section 3.4, we show that the EVM model withthe Weibull model replaced by some other distributions (e.g. normal) realizessimilar performance. Finally, we visually illustrate the way how the EVM andLOF form the in-distribution and out-of-distribution areas, using the CIFAR-10dataset projected onto the 2D space of the first two PCA components. This al-lows us to partly explain the difference in the performance of OoD by the EVMand LOF in our experiments.
3.1 Data Sets
To evaluate the OoD detection algorithms, we used two different sources of data:text documents and images.
For the text documents case, we used the corpus of articles extracted fromthe Polish language Wikipedia (Wiki). It consists of 9, 837 documents assignedto 34 subject categories (classes). The corpus is divided into training [19] andtesting [18] set. As the OoD example, we randomly selected articles from thePolish press news[25] dataset (Press).
Several approaches to represent documents by feature vectors were developedduring the past years. For our study, we have the most classical one - TF-IDF[21]and one of the most recent approaches - BERT [5]. The TF-IDF uses a bag ofword model[7] where a feature vector consists of a set of frequencies of words(terms). To limit the size of feature vectors, we focused only on the most fre-quent terms. The term frequency (TF) representation is modified by the InvertedDocument Frequency (IDF)[21], giving the TF − IDF one. In performed exper-iments, we used single words as well as 2-, and 3-grams. The vector space waslimited to 1000 terms. Moreover, the final TF-IDF vectors were L2 normalized.The most frequent terms and corresponding IDFs were set up on the training setand used for TF − IDF feature calculation for all data (i.e., training, testing,and outliers).
ICCS Camera Ready Version 2021To cite this paper please use the final published version:
DOI: 10.1007/978-3-030-77967-2_13

On Validity of Extreme Value Theory-based Models ... 7
The second method, BERT [5], uses state-of-the-art deep-learning algorithms(i.e. Transformers), resulting in a context-aware language modeling approach. Inthis study, we used the Polbert4[16], a pre-trained BERT model for Polish. ThePolbert network with additional classification layers was tuned on the Wiki dataset. Only the embedding layer of the BERT was frozen. Since the Polbert iscapable of analyzing up to 512 subwords, longer texts were cut-off. The closedset accuracy was 94.21% . As a feature vector (768-dimensional), we used thefirst (with index zero) token from the last Transformer layer (i.e., the one beforethe classification layers).
For the case of images, we used the CIFAR-10 database5. It contains 60, 00032x32 color images divided in 10 classes, i.e. airplane, automobile, bird, cat, deer,dog, frog, horse, ship, and truck. There are 5, 000 images per class in the trainingset and 1, 000 in the test set. The ResNet-101 [8] CNN model was trained fromscratch for the classification task, and it achieved 95.15% final accuracy. The2048-dimensional feature vectors were extracted from this model. As features,we used the output of the average global pooling layer (called ”avgpool”).
As out-of-distribution data, the MNIST6 and the CIFAR-1007 benchmarkdata sets were chosen. For each test in this paper, the number of OoD exam-ples was equal to the number of images used in the CIFAR-10 test set. TheMNIST dataset contains 70, 000 28x28 grayscale images of handwritten digits.We transformed them into three RGB channels and added extra padding (tokeep 32x32 size) to make them fit the trained CNN model. The CIFAR-100 sethas 100 classes with 600 images per class. None of the CIFAR-100 classes appearin CIFAR-10.
3.2 Comparison of OoD Detection Methods
We compared the EVM with the LOF algorithm in the context of image andtext data. Since we wanted to observe the effect of input space modificationson the quality of OoD detection, we also used the standardized versions of eachdata set (we used the popular z-score normalization with the mean and standarddeviation for each variable estimated on the train data set).
In Table 1 we compare the AUCROC measure for the EVM and LOF methodover different data sets.
Despite its theoretical justification, the EVM is clearly outperformed by theheuristic LOF algorithm in most test cases, except for the text data with BERTfeature vectors.
To explain this, we verified if the theoretically-grounded Weibull distributionused in EVM is appropriate for data encountered in real OoD studies.
4 https://huggingface.co/dkleczek/bert-base-polish-cased-v15 https://www.cs.toronto.edu/ kriz/cifar.html6 http://yann.lecun.com/exdb/mnist/7 https://www.cs.toronto.edu/ kriz/cifar.html
ICCS Camera Ready Version 2021To cite this paper please use the final published version:
DOI: 10.1007/978-3-030-77967-2_13

8 Walkowiak et al.
Table 1: AUCROC for EVM and LOF over different data sets. Standardiseddata sets are denoted by ’+stand’
Data set EVM LOF
Wiki.vs.Press.TF-IDF 0.792937 0.827835
Wiki.vs.Press.TF-IDF+stand 0.521511 0.793559
Wiki.vs.Press.BERT 0.943888 0.904297
Wiki.vs.Press.BERT+stand 0.942756 0.904234
CIFAR-10.vs.CIFAR-100 0.796409 0.888728
CIFAR10.vs.CIFAR100+stand 0.879586 0.893454
CIFAR10.vs.MNIST 0.897874 0.984625
CIFAR10.vs.MNIST+stand 0.972384 0.982649
3.3 Weibull Distribution Testing
The main theoretical assumption of the EVM is that margin distances (see sec-tion 2.3) follow the Weibull distribution. We empirically verified this by usingthe Kolmogorov-Smirnov goodness of fit test, with the null hypothesis that themargin distances have the Weibull distribution estimated by the EVM imple-mentation. It is important to state that the margin distances were scaled bythe implementation as mentioned in section 2.3. In table 2 we present mean p-values of Kolmogorov-Smirnov tests for all training examples in each data set.Assuming the test significance level of 5%, we conclude that the Weibull distribu-tion is not appropriate (p-value < 5%) or marginally accepted (p-value = 0.087,Wiki.BERT data) in four out of six test cases. Clearly, the datasets with the high-est p-values (ie. Wiki.BERT or CIFAR-10+stand, p-value > 5%, Weibull distri-bution appropriate) correspond to the OoD test cases in which EVM showed thebest performance, as shown in table 1.
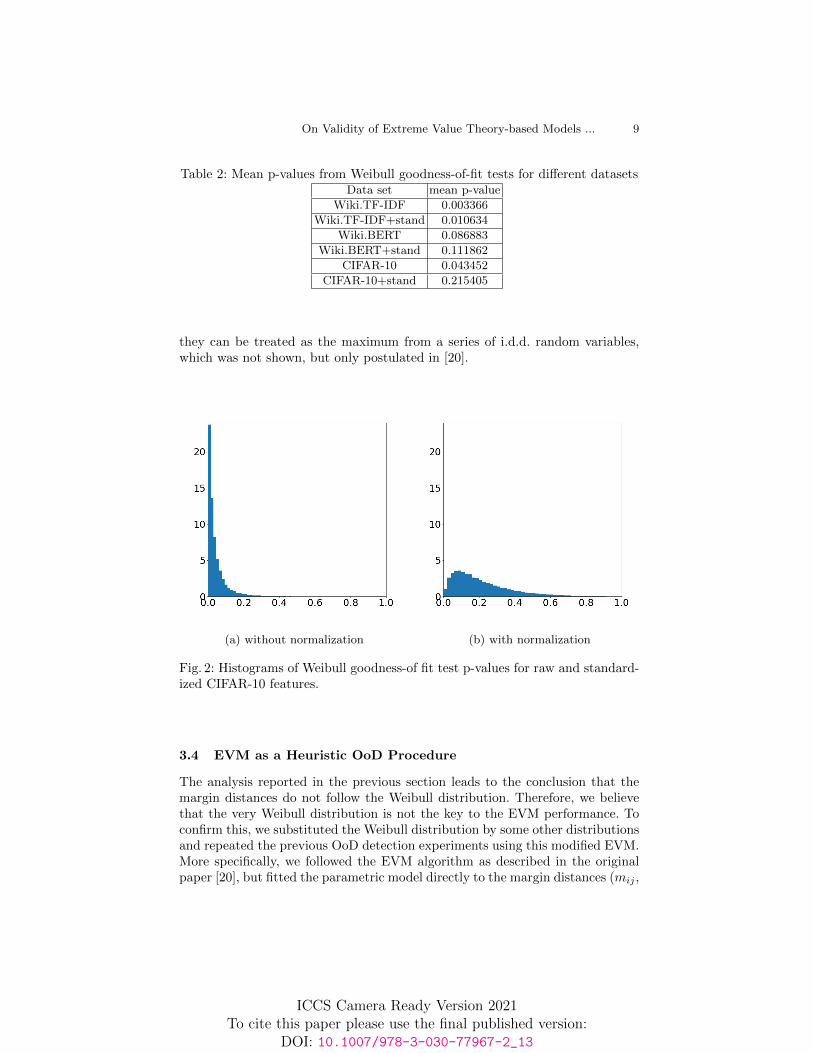
The detailed analysis of p-values for CIFAR-10 data set is shown on his-tograms in Fig. 2a and 2b. We can notice that normalization of CIFAR-10 datachanges the distribution of margin distances: for a majority of training examplesin the raw dataset (fig 2a), the Weibull model does not fit the data (most ofp-values < 5%), whereas for standardized data (fig 2b) the Weibull model is ap-propriate (most of p-values > 5%). This clearly leads to improved performanceof the EVM in OoD detection as shown in table 1 (AUCROC increased from0.897 to 0.972).
This analysis proves that margin distances do not follow the Weibull distribu-tion in many real datasets, contrary to the theoretical justification given in [20](Theorem 2). The justification given in [20] is grounded on the Fisher-Tippett-Gnedenko (or Extreme Value) Theorem, which states that for a series of n i.i.d.random variables, their maximum Mn is asymptotically Weibull-distributed, ie.for some constants an, bn Pr(
Mn−bnan
< z)→ G(z) as n→∞, where G(z) is un-der some assumptions the Weibull distribution. Hence the underlying assumptionneeded for the margin distances (eq. 1) to follow the Weibull distribution is that
ICCS Camera Ready Version 2021To cite this paper please use the final published version:
DOI: 10.1007/978-3-030-77967-2_13
On Validity of Extreme Value Theory-based Models ... 9
Table 2: Mean p-values from Weibull goodness-of-fit tests for different datasetsData set mean p-value
Wiki.TF-IDF 0.003366
Wiki.TF-IDF+stand 0.010634
Wiki.BERT 0.086883
Wiki.BERT+stand 0.111862
CIFAR-10 0.043452
CIFAR-10+stand 0.215405
they can be treated as the maximum from a series of i.d.d. random variables,which was not shown, but only postulated in [20].
(a) without normalization (b) with normalization
Fig. 2: Histograms of Weibull goodness-of fit test p-values for raw and standard-ized CIFAR-10 features.
3.4 EVM as a Heuristic OoD Procedure
The analysis reported in the previous section leads to the conclusion that themargin distances do not follow the Weibull distribution. Therefore, we believethat the very Weibull distribution is not the key to the EVM performance. Toconfirm this, we substituted the Weibull distribution by some other distributionsand repeated the previous OoD detection experiments using this modified EVM.More specifically, we followed the EVM algorithm as described in the originalpaper [20], but fitted the parametric model directly to the margin distances (mij ,
ICCS Camera Ready Version 2021To cite this paper please use the final published version:
DOI: 10.1007/978-3-030-77967-2_13

10 Walkowiak et al.
eq. (1)), and not to the transformed {ηi1, ηi2, . . . , ηiτ}. We tried four alternativeCDFs: the Weibull Minimum Extreme Value (Weib min), Normal, Gamma, andempirical CDF (ECDF). The achieved AUROC values are compared with theoriginal EVM in table 3. These results suggest that the parametric distributiontype, as well as transformation applied by the libMR8 have a minor influence onthe EVM performance. None of the analyzed distributions clearly outperformedother models. This confirms that the assumption of the Weibull distribution isnot essential for the performance of the EVM.
Table 3: AUCROC for the original EVM and its modifications based on otherparametric models
Data set EVM Weib min Normal Gamma ECDF
Wiki.vs.Press.TF-IDF 0.792937 0.559025 0.588428 0.761878 0.523205
Wiki.vs.Press.TF-IDF+stand 0.521511 0.717006 0.551327 0.673260 0.518462
Wiki.vs.Press.BERT 0.943888 0.935413 0.949327 0.940496 0.922417
Wiki.vs.Press.BERT+stand 0.942756 0.930245 0.947738 0.941205 0.920710
CIFAR-10.vs.CIFAR-100 0.796409 0.887941 0.828649 0.772505 0.751740
CIFAR-10.vs.CIFAR-100+stand 0.879586 0.832547 0.878440 0.870419 0.817091
CIFAR-10.vs.MNIST 0.897874 0.957250 0.926712 0.872924 0.859684
CIFAR-10.vs.MNIST+stand 0.972384 0.978867 0.978688 0.972445 0.971501
3.5 Low Dimensional Example
To illustrate the behavior of OoD methods, we performed a set of numericalexperiments on CIFAR-10 images projected by PCA onto two-dimensional space.Projected images were used to built EVM and LOF models. Next, the 2D space,in the area of CIFAR-10 data values, was equally sub-sampled, forming a X-Ygrid. Each of the grid points was assigned to the OoD or in-distribution classby the EVM and LOF algorithm using different values of rejection threshold, aspresented in Fig. 3 and Fig. 4. The training data points are marked in colorscorresponding to the original class. Black dots represent grid data marked by thecorresponding algorithm as in-distributions, whereas white dots represent OoDpoints. Notice, that background is also white, so the area without any black dotsrepresents OoD space.
In Fig. 3a, we can notice that the in-distribution area (black points) coversnot only training data but also the area around them. So, all test examples arelikely to be correctly recognized as in-distribution, but OoD examples layingbetween classes will be incorrectly recognized as in-distribution. Hence, the in-distribution areas (shown by black points in 3a) are apparently too wide. Wecan narrow them by increasing the threshold. However, as we can notice in 3a,
8 https://github.com/Vastlab/libMR
ICCS Camera Ready Version 2021To cite this paper please use the final published version:
DOI: 10.1007/978-3-030-77967-2_13

On Validity of Extreme Value Theory-based Models ... 11
(a) threshold 0.7 (b) threshold 0.99
Fig. 3: OoD detection by the EVM for PCA projected CIFAR-10 data.The color points represent training data (CIFAR-10 images projected on 2D).Black points (forming an X-Y grid) are in-distribution data detected by EVM.White points (visible on colored areas, especially in picture (b)) correspond todata detected by EVM as OoD. Notice, that background is also white, so thearea without any black dots is the OoD space.
(a) contamination 0.005 (b) contamination 0.1
Fig. 4: OoD detection by LOF for PCA projected CIFAR-10 data. The meaningof white and black dots the same as in the previous figure.
ICCS Camera Ready Version 2021To cite this paper please use the final published version:
DOI: 10.1007/978-3-030-77967-2_13

12 Walkowiak et al.
in the case of some classes (like the plane, ship, bird, and frog), this only slightlysqueezes the in-distribution areas, while in other cases (like deer and truck),training data gets marked as OoD (white dots inside gray and blue area) asOoD objects. It is an undesirable behavior of the EVM, resulting in a largenumber of wrong decisions. It could be noticed that such problems occur whenone class is close to another, or when classes partly overlap (as cars and trucksin our example).
A similar analysis done for the LOF method (Fig. 4) does not reveal suchundesirable behavior. Fig. 4a is similar to Fig. 3a. Moreover, after enlarging thecontamination parameter (this results in decreasing the rejection threshold), thein-distribution areas (dark points) fit now closely to training data (Fig. 4b).However, a close look at Fig. 4a shows that LOF in-distribution areas do notextend beyond training points in directions opposite to other classes (see, forexample, top of the plane class - marked by blue), contrary to directions toother classes (observe the bottom area of the ’plane’ class and compare it withthe area above). Such behavior is caused by the fact that LOF has no knowledgeabout individual classes and sees the whole training data as one ’in-distribution’set.
4 Conclusion
In this paper, we showed that the theoretical assumptions underlying the popu-lar Extreme Value Machine are not fulfilled in the context of many real datasets.Inter-class distances (margin distances) in practice often do not follow the Weibulldistribution, as assumed by the EVM. We compared the EVM with anotherpopular OoD detection method - LOF and showed that EVM should not begenerally considered superior to this heuristic method. Both these methods at-tempt to model the local similarities around the training examples as the ’in-distribution’ space. However, the EVM takes into account the distances to othernearest classes, while LOF is focused only on local similarities.
Since the theoretical soundness of EVM in many real-life studies can bequestioned, we argue that the method should be considered another heuristicOoD procedure.
Several data-related factors affect EVM performance. First, for high- dimen-sional data (the curse of dimensionality effect), the inter-class borders are sam-pled very roughly. (In our experiments, data dimensionality was between 768and 2048). Secondly, the EVM builds a border between OoD space and ’in-distribution’ space using the distances to the nearest points from other classes.When classes are well separated (large inter-class gap), this leads to a high prob-ability of inclusion of out-of-distribution examples lying far from the known data.Hence, models of in-distribution areas tend to be over-extended, as comparede.g. with the LOF model.
A modification of the EVM is worth investigating, in which the models of theprobability of inclusion are built using not only distances to other classes but
ICCS Camera Ready Version 2021To cite this paper please use the final published version:
DOI: 10.1007/978-3-030-77967-2_13

On Validity of Extreme Value Theory-based Models ... 13
also in-class distances. We believe this would address some problems observedin the EVM.
Acknowledgements
The research reported in this paper was partly sponsored by National ScienceCentre, Poland (grant 2016/21/B/ST6/02159).
References
1. Amodei, D., Olah, C., Steinhardt, J., Christiano, P., Schulman, J., Mane, D.: Con-crete problems in ai safety. arXiv preprint arXiv:1606.06565 (2016)
2. Bendale, A., Boult, T.: Towards open world recognition. In: Proceedings of theIEEE conference on computer vision and pattern recognition. pp. 1893–1902 (2015)
3. Bendale, A., Boult, T.E.: Towards open set deep networks. In: Proceedings of theIEEE conference on computer vision and pattern recognition. pp. 1563–1572 (2016)
4. Breunig, M.M., Kriegel, H.P., Ng, R.T., Sander, J.: Lof: identifying density-basedlocal outliers. In: ACM sigmod record. vol. 29, pp. 93–104. ACM (2000)
5. Devlin, J., Chang, M.W., Lee, K., Toutanova, K.: Bert: Pre-training of deep bidirec-tional transformers for language understanding. arXiv preprint arXiv:1810.04805(2018)
6. Geng, C., Huang, S.j., Chen, S.: Recent advances in open set recognition: A survey.IEEE Transactions on Pattern Analysis and Machine Intelligence (2020)
7. Harris, Z.S.: Distributional structure. Word 10(2-3), 146–162 (1954)8. He, K., Zhang, X., Ren, S., Sun, J.: Deep residual learning for image recognition. In:
Proceedings of the IEEE conference on computer vision and pattern recognition.pp. 770–778 (2016)
9. Hendrycks, D., Gimpel, K.: A baseline for detecting misclassified and out-of-distribution examples in neural networks. arXiv preprint arXiv:1610.02136 (2016)
10. Hendrycks, D., Mazeika, M., Dietterich, T.: Deep anomaly detection with outlierexposure. arXiv preprint arXiv:1812.04606 (2018)
11. Hendrycks, D., Mazeika, M., Dietterich, T.: Deep anomaly detection with outlierexposure. Proceedings of the International Conference on Learning Representations(2019)
12. Hendrycks, D., Zhao, K., Basart, S., Steinhardt, J., Song, D.: Natural adversarialexamples. arXiv preprint arXiv:1907.07174 (2019)
13. Jain, L.P., Scheirer, W.J., Boult, T.E.: Multi-class open set recognition using prob-ability of inclusion. In: European Conference on Computer Vision. pp. 393–409.Springer (2014)
14. Junior, P.R.M., De Souza, R.M., Werneck, R.d.O., Stein, B.V., Pazinato, D.V.,de Almeida, W.R., Penatti, O.A., Torres, R.d.S., Rocha, A.: Nearest neighborsdistance ratio open-set classifier. Machine Learning 106(3), 359–386 (2017)
15. Kamoi, R., Kobayashi, K.: Why is the mahalanobis distance effective for anomalydetection? arXiv preprint arXiv:2003.00402 (2020)
16. K leczek, D.: Polbert: Attacking polish nlp tasks with transformers. In: Ogrod-niczuk, M., Lukasz Kobylinski (eds.) Proceedings of the PolEval 2020 Workshop.pp. 79–88. Institute of Computer Science, Polish Academy of Sciences (2020)
ICCS Camera Ready Version 2021To cite this paper please use the final published version:
DOI: 10.1007/978-3-030-77967-2_13

14 Walkowiak et al.
17. Mensink, T., Verbeek, J., Perronnin, F., Csurka, G.: Distance-based image classifi-cation: Generalizing to new classes at near-zero cost. IEEE transactions on patternanalysis and machine intelligence 35(11), 2624–2637 (2013)
18. M lynarczyk, K., Piasecki, M.: Wiki test - 34 categories (2015),http://hdl.handle.net/11321/217, CLARIN-PL digital repository
19. M lynarczyk, K., Piasecki, M.: Wiki train - 34 categories (2015),http://hdl.handle.net/11321/222, CLARIN-PL digital repository
20. Rudd, E.M., Jain, L.P., Scheirer, W.J., Boult, T.E.: The extreme value machine.IEEE transactions on pattern analysis and machine intelligence 40(3), 762–768(2017)
21. Salton, G., Buckley, C.: Term-weighting approaches in automatic text re-trieval. Inf. Process. Manag. 24(5), 513–523 (1988). https://doi.org/10.1016/0306-4573(88)90021-0, https://doi.org/10.1016/0306-4573(88)90021-0
22. Scheirer, W.J., Jain, L.P., Boult, T.E.: Probability models for open set recognition.IEEE transactions on pattern analysis and machine intelligence 36(11), 2317–2324(2014)
23. Scheirer, W.J., de Rezende Rocha, A., Sapkota, A., Boult, T.E.: Toward open setrecognition. IEEE transactions on pattern analysis and machine intelligence 35(7),1757–1772 (2012)
24. Scheirer, W.J., Rocha, A., Micheals, R.J., Boult, T.E.: Meta-recognition: The the-ory and practice of recognition score analysis. IEEE transactions on pattern anal-ysis and machine intelligence 33(8), 1689–1695 (2011)
25. Walkowiak, T., Malak, P.: Polish texts topic classification evaluation. In: Pro-ceedings of the 10th International Conference on Agents and Artificial In-telligence - Volume 2: ICAART. pp. 515–522. INSTICC, SciTePress (2018).https://doi.org/10.5220/0006601605150522
ICCS Camera Ready Version 2021To cite this paper please use the final published version:
DOI: 10.1007/978-3-030-77967-2_13