Embed Size (px)
Citation preview
IEEE TRANSACTIONS ON ELECTROMAGNETIC COMPATIBILITY, VOL. 40, NO. 3, AUGUST 1998 201
On the Wide-Band CW Illumination of Large-ScaleSystems—Part II: The Rhombic Illuminator
Clayborne D. Taylor, Stephen L. Langdon, Samuel J. Gutierrez, and William A. Walton, III
Abstract—The Phillips Laboratory has recently designed andconstructed a continuous wave illuminator for studying the re-sponses of large-scale systems subject to vertically or horizontallypolarized electromagnetic stresses incident from the horizontal.The illuminator is developed by a nonuniform two-wire transmis-sion line oriented over the system under test. When the wires aredriven from a common mode voltage with respect to the grounda vertically polarized electric field is generated and when thewires are driven from equal but opposite voltages a horizontallypolarized electric field is developed. The structure is called therhombic illuminator since the wire configuration is very similarto the rhombic antenna. In order to illustrate the use of theilluminator, data are presented for the illumination field and forthe response of an illuminated aircraft recorded at the PhillipsLaboratory.
Index Terms—Continuous wave, fiber optics.
I. INTRODUCTION
T HERE are a number of sources for intense electro-magnetic illumination including lightning, high-power
radars, RF broadcast transmitters, nuclear weapon detonation,wireless power transmission, etc. In some cases, the resultshave been tragic. The Blackhawk helicopter downings and theaccident aboard the U.S. aircraft carrier Forrestal during theVietnam War are examples [1], [2]. Determining the effectson large-scale systems from high-power illumination is not asimple procedure. Nonlinear and irreversible processes mustbe expected. Reproducing these effects and identifying thecoupling mechanisms under threat exposures may be verydifficult and prohibitive in terms of the cost and the timerequired. It has been shown in a companion paper that theseproblems can be overcome through low-level continuous wave(CW) illumination supplemented by high-level direct driveapplications [3].
By exposing a system to low-level CW illumination, itis possible to determine transfer functions relating particularresponses within a system to the illuminating field strength.In addition it is possible to identify electromagnetic couplingpaths and to establish the relative importance of the variouscoupling mechanisms for large-scale systems. Supplementingthese results with high-level direct drive applications willallow the exercise and study of nonlinear effects. Low-levelCW studies can be performed with relatively few personnel,
Manuscript received June 26, 1995; revised April 21, 1998.The authors are with the Phillips Laboratory (AFMC), PL/WSM, Kirtland
AFB, NM 87117 USA.Publisher Item Identifier S 0018-9375(98)06337-6.
relatively little hazard to personnel, and a relatively smallinvestment in equipment and facilities when compared tofull-scale studies using high-level or threat exposures.
The expected effects resulting from illumination with anarrow-band high-power source can be obtained by the ap-propriate scaling of the low-level responses. For responseswhere nonlinear processes are expected, it may be necessaryto implement direct drive excitations at levels determined bythe scaled low-level responses. When the illumination is froma wide-band or ultrawide-band source, the response of thesystem can be determined via Fourier frequency superpositionutilizing Fourier transform applications. Computed responsescan be used to establish the appropriate pulse excitation tobe emulated in the direct-drive applications. These topics areaddressed in detail in a companion paper [3].
Generally, intense electromagnetic stresses, whether delib-erate or inadvertent, may come from a variety of directionsas well as exhibit differing polarizations. Consequently, thelow-level CW illuminator/simulator may have a variety ofpolarization and incident angle requirements. An illuminatordescribed in a companion paper can be used to simulate over-head illumination providing essentially horizontal polarizationfor the incident fields [3]. In this paper, a rhombic nonuniformtransmission line configuration is presented. It is called arhombic illuminator since the configuration resembles therhombic antenna. The rhombic transmission line configurationcan provide horizontal propagation with a vertical electricfield and a horizontal magnetic field or it can provide avertical magnetic field with a horizontal electric field. Thesystem is illuminated by launching a quasi TEM mode andabsorbing it in a resistive termination. By using the freedomof orientation of the system under test a veritable infinityof illumination scenarios are available where the illuminationfield is nearly uniform over the target. The frequency range ofthe illumination extends from dc to a few gigahertz.
In order to illustrate the use of the rhombic illuminator tostudy the electromagnetic response of large scale systems, theinstrumentation and data analysis used at the large electromag-netic system-level illuminator (LESLI) research facility at thePhillips Laboratory are described. Measurement data for anF-16 aircraft testbed are presented and discussed.
II. RHOMBIC ILLUMINATOR
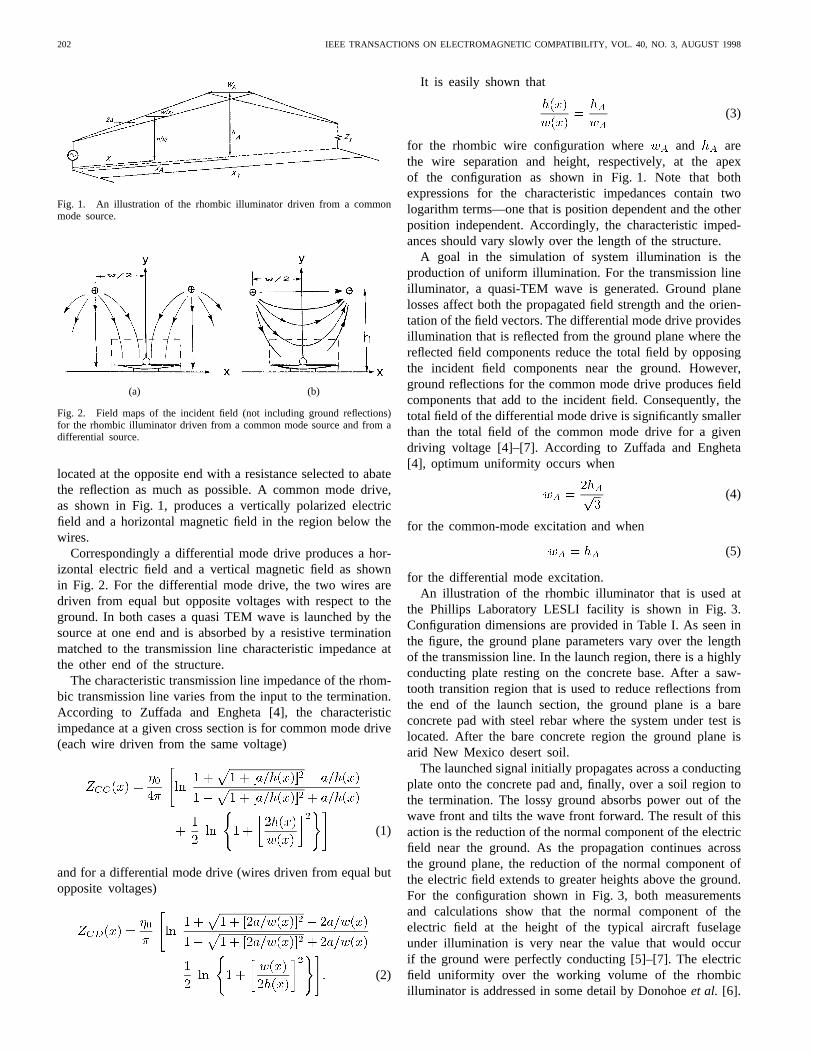
The rhombic illuminator is a two-wire transmission lineconfiguration oriented over the ground, as shown in Fig. 1.The source is located at one end and a resistive termination is
U.S. Government work not protected by U.S. copyright.
202 IEEE TRANSACTIONS ON ELECTROMAGNETIC COMPATIBILITY, VOL. 40, NO. 3, AUGUST 1998
Fig. 1. An illustration of the rhombic illuminator driven from a commonmode source.
(a) (b)
Fig. 2. Field maps of the incident field (not including ground reflections)for the rhombic illuminator driven from a common mode source and from adifferential source.
located at the opposite end with a resistance selected to abatethe reflection as much as possible. A common mode drive,as shown in Fig. 1, produces a vertically polarized electricfield and a horizontal magnetic field in the region below thewires.
Correspondingly a differential mode drive produces a hor-izontal electric field and a vertical magnetic field as shownin Fig. 2. For the differential mode drive, the two wires aredriven from equal but opposite voltages with respect to theground. In both cases a quasi TEM wave is launched by thesource at one end and is absorbed by a resistive terminationmatched to the transmission line characteristic impedance atthe other end of the structure.
The characteristic transmission line impedance of the rhom-bic transmission line varies from the input to the termination.According to Zuffada and Engheta [4], the characteristicimpedance at a given cross section is for common mode drive(each wire driven from the same voltage)
(1)
and for a differential mode drive (wires driven from equal butopposite voltages)
(2)
It is easily shown that
(3)
for the rhombic wire configuration where and arethe wire separation and height, respectively, at the apexof the configuration as shown in Fig. 1. Note that bothexpressions for the characteristic impedances contain twologarithm terms—one that is position dependent and the otherposition independent. Accordingly, the characteristic imped-ances should vary slowly over the length of the structure.
A goal in the simulation of system illumination is theproduction of uniform illumination. For the transmission lineilluminator, a quasi-TEM wave is generated. Ground planelosses affect both the propagated field strength and the orien-tation of the field vectors. The differential mode drive providesillumination that is reflected from the ground plane where thereflected field components reduce the total field by opposingthe incident field components near the ground. However,ground reflections for the common mode drive produces fieldcomponents that add to the incident field. Consequently, thetotal field of the differential mode drive is significantly smallerthan the total field of the common mode drive for a givendriving voltage [4]–[7]. According to Zuffada and Engheta[4], optimum uniformity occurs when
(4)
for the common-mode excitation and when
(5)
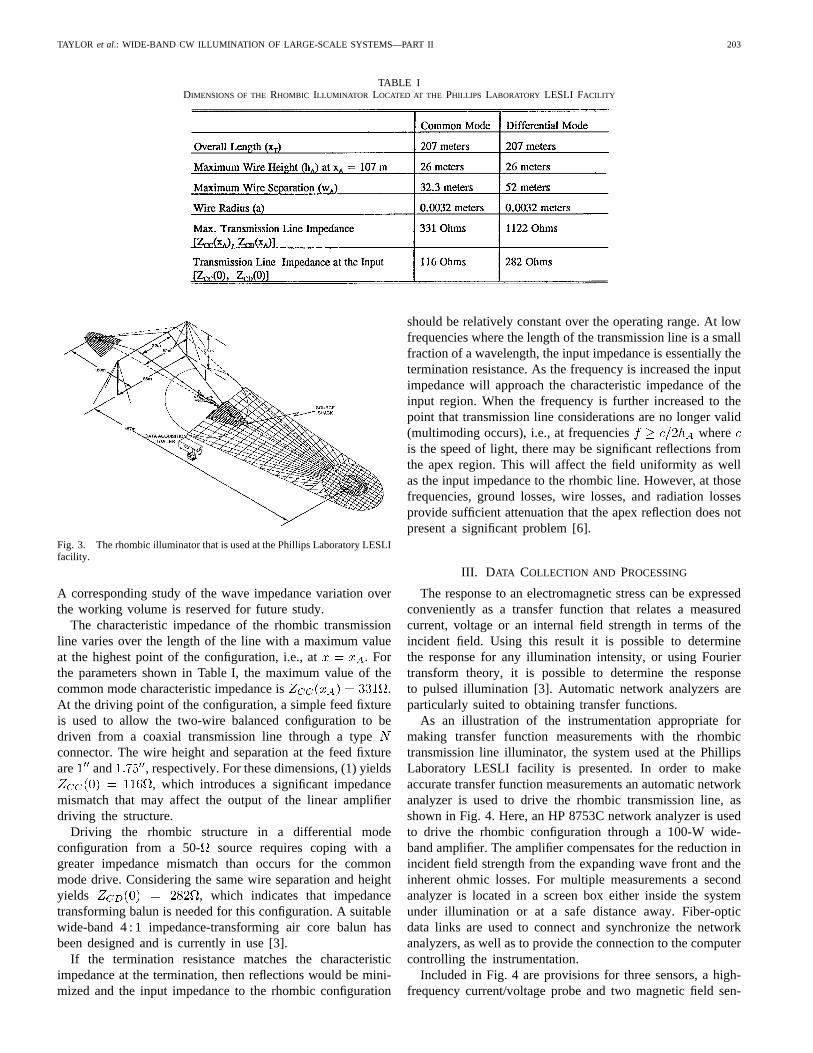
for the differential mode excitation.An illustration of the rhombic illuminator that is used at
the Phillips Laboratory LESLI facility is shown in Fig. 3.Configuration dimensions are provided in Table I. As seen inthe figure, the ground plane parameters vary over the lengthof the transmission line. In the launch region, there is a highlyconducting plate resting on the concrete base. After a saw-tooth transition region that is used to reduce reflections fromthe end of the launch section, the ground plane is a bareconcrete pad with steel rebar where the system under test islocated. After the bare concrete region the ground plane isarid New Mexico desert soil.
The launched signal initially propagates across a conductingplate onto the concrete pad and, finally, over a soil region tothe termination. The lossy ground absorbs power out of thewave front and tilts the wave front forward. The result of thisaction is the reduction of the normal component of the electricfield near the ground. As the propagation continues acrossthe ground plane, the reduction of the normal component ofthe electric field extends to greater heights above the ground.For the configuration shown in Fig. 3, both measurementsand calculations show that the normal component of theelectric field at the height of the typical aircraft fuselageunder illumination is very near the value that would occurif the ground were perfectly conducting [5]–[7]. The electricfield uniformity over the working volume of the rhombicilluminator is addressed in some detail by Donohoeet al. [6].
TAYLOR et al.: WIDE-BAND CW ILLUMINATION OF LARGE-SCALE SYSTEMS—PART II 203
TABLE IDIMENSIONS OF THE RHOMBIC ILLUMINATOR LOCATED AT THE PHILLIPS LABORATORY LESLI FACILITY
Fig. 3. The rhombic illuminator that is used at the Phillips Laboratory LESLIfacility.
A corresponding study of the wave impedance variation overthe working volume is reserved for future study.
The characteristic impedance of the rhombic transmissionline varies over the length of the line with a maximum valueat the highest point of the configuration, i.e., at . Forthe parameters shown in Table I, the maximum value of thecommon mode characteristic impedance is .At the driving point of the configuration, a simple feed fixtureis used to allow the two-wire balanced configuration to bedriven from a coaxial transmission line through a typeconnector. The wire height and separation at the feed fixtureare and , respectively. For these dimensions, (1) yields
, which introduces a significant impedancemismatch that may affect the output of the linear amplifierdriving the structure.
Driving the rhombic structure in a differential modeconfiguration from a 50- source requires coping with agreater impedance mismatch than occurs for the commonmode drive. Considering the same wire separation and heightyields , which indicates that impedancetransforming balun is needed for this configuration. A suitablewide-band 4 : 1 impedance-transforming air core balun hasbeen designed and is currently in use [3].
If the termination resistance matches the characteristicimpedance at the termination, then reflections would be mini-mized and the input impedance to the rhombic configuration
should be relatively constant over the operating range. At lowfrequencies where the length of the transmission line is a smallfraction of a wavelength, the input impedance is essentially thetermination resistance. As the frequency is increased the inputimpedance will approach the characteristic impedance of theinput region. When the frequency is further increased to thepoint that transmission line considerations are no longer valid(multimoding occurs), i.e., at frequencies whereis the speed of light, there may be significant reflections fromthe apex region. This will affect the field uniformity as wellas the input impedance to the rhombic line. However, at thosefrequencies, ground losses, wire losses, and radiation lossesprovide sufficient attenuation that the apex reflection does notpresent a significant problem [6].
III. D ATA COLLECTION AND PROCESSING
The response to an electromagnetic stress can be expressedconveniently as a transfer function that relates a measuredcurrent, voltage or an internal field strength in terms of theincident field. Using this result it is possible to determinethe response for any illumination intensity, or using Fouriertransform theory, it is possible to determine the responseto pulsed illumination [3]. Automatic network analyzers areparticularly suited to obtaining transfer functions.
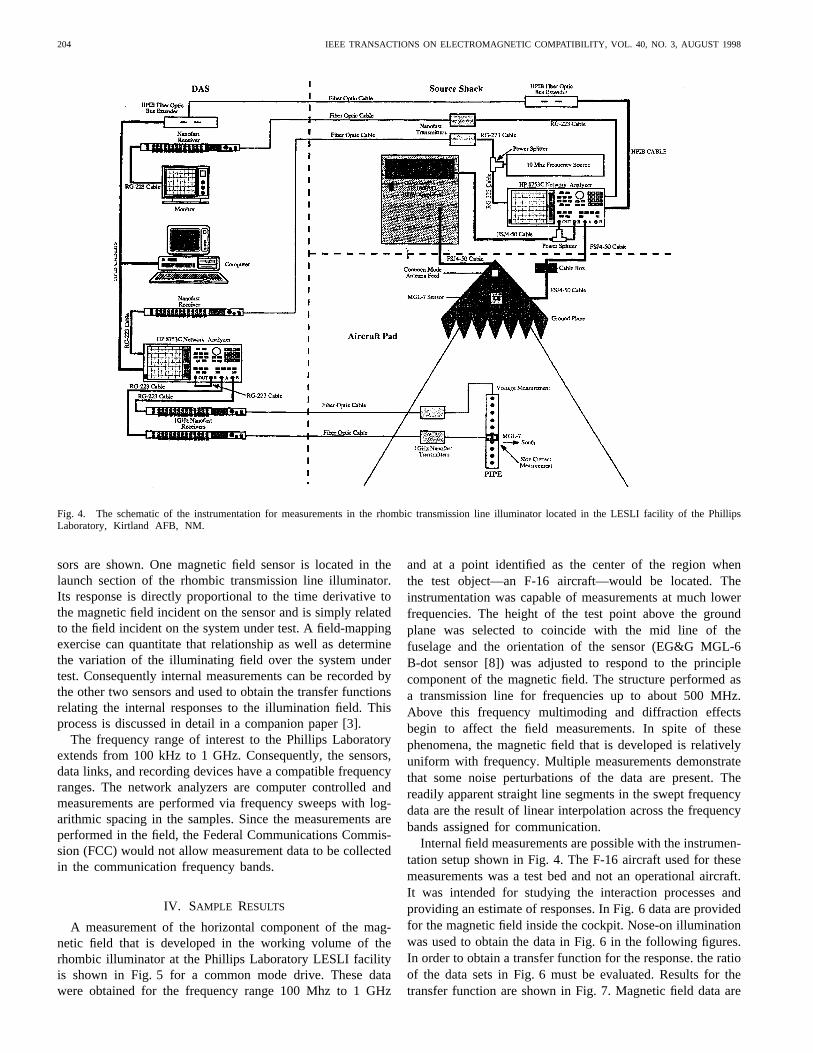
As an illustration of the instrumentation appropriate formaking transfer function measurements with the rhombictransmission line illuminator, the system used at the PhillipsLaboratory LESLI facility is presented. In order to makeaccurate transfer function measurements an automatic networkanalyzer is used to drive the rhombic transmission line, asshown in Fig. 4. Here, an HP 8753C network analyzer is usedto drive the rhombic configuration through a 100-W wide-band amplifier. The amplifier compensates for the reduction inincident field strength from the expanding wave front and theinherent ohmic losses. For multiple measurements a secondanalyzer is located in a screen box either inside the systemunder illumination or at a safe distance away. Fiber-opticdata links are used to connect and synchronize the networkanalyzers, as well as to provide the connection to the computercontrolling the instrumentation.
Included in Fig. 4 are provisions for three sensors, a high-frequency current/voltage probe and two magnetic field sen-
204 IEEE TRANSACTIONS ON ELECTROMAGNETIC COMPATIBILITY, VOL. 40, NO. 3, AUGUST 1998
Fig. 4. The schematic of the instrumentation for measurements in the rhombic transmission line illuminator located in the LESLI facility of the PhillipsLaboratory, Kirtland AFB, NM.
sors are shown. One magnetic field sensor is located in thelaunch section of the rhombic transmission line illuminator.Its response is directly proportional to the time derivative tothe magnetic field incident on the sensor and is simply relatedto the field incident on the system under test. A field-mappingexercise can quantitate that relationship as well as determinethe variation of the illuminating field over the system undertest. Consequently internal measurements can be recorded bythe other two sensors and used to obtain the transfer functionsrelating the internal responses to the illumination field. Thisprocess is discussed in detail in a companion paper [3].
The frequency range of interest to the Phillips Laboratoryextends from 100 kHz to 1 GHz. Consequently, the sensors,data links, and recording devices have a compatible frequencyranges. The network analyzers are computer controlled andmeasurements are performed via frequency sweeps with log-arithmic spacing in the samples. Since the measurements areperformed in the field, the Federal Communications Commis-sion (FCC) would not allow measurement data to be collectedin the communication frequency bands.
IV. SAMPLE RESULTS
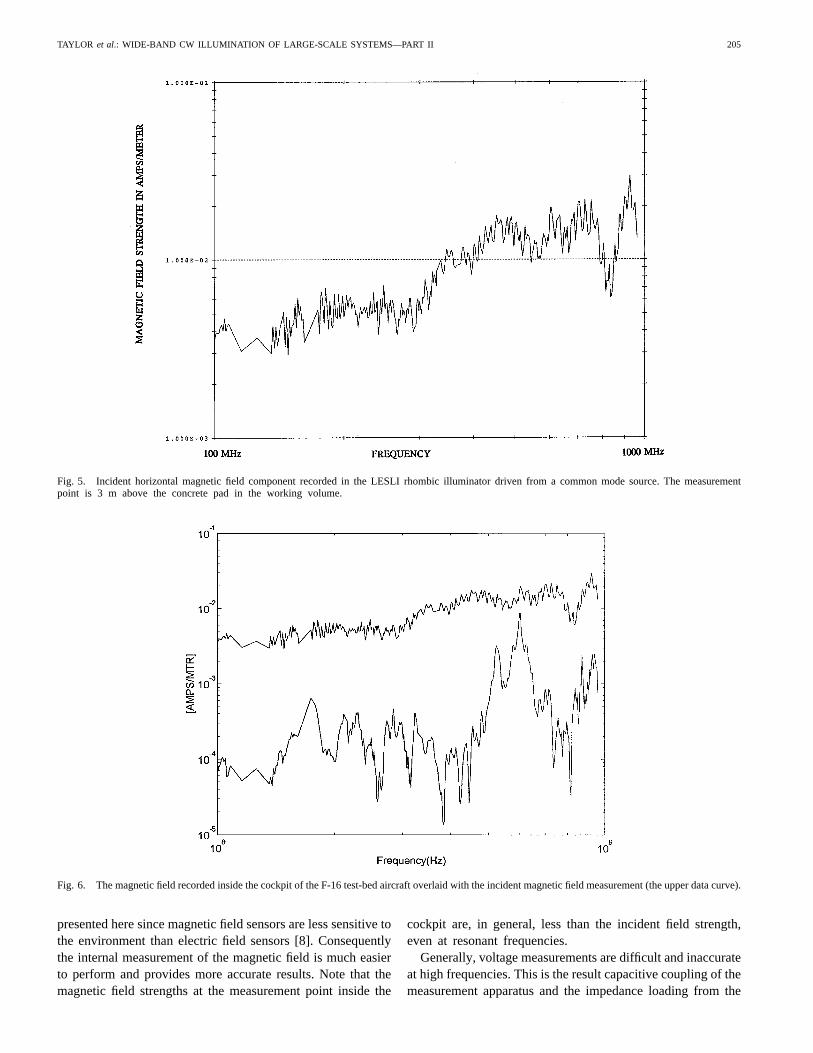
A measurement of the horizontal component of the mag-netic field that is developed in the working volume of therhombic illuminator at the Phillips Laboratory LESLI facilityis shown in Fig. 5 for a common mode drive. These datawere obtained for the frequency range 100 Mhz to 1 GHz
and at a point identified as the center of the region whenthe test object—an F-16 aircraft—would be located. Theinstrumentation was capable of measurements at much lowerfrequencies. The height of the test point above the groundplane was selected to coincide with the mid line of thefuselage and the orientation of the sensor (EG&G MGL-6B-dot sensor [8]) was adjusted to respond to the principlecomponent of the magnetic field. The structure performed asa transmission line for frequencies up to about 500 MHz.Above this frequency multimoding and diffraction effectsbegin to affect the field measurements. In spite of thesephenomena, the magnetic field that is developed is relativelyuniform with frequency. Multiple measurements demonstratethat some noise perturbations of the data are present. Thereadily apparent straight line segments in the swept frequencydata are the result of linear interpolation across the frequencybands assigned for communication.
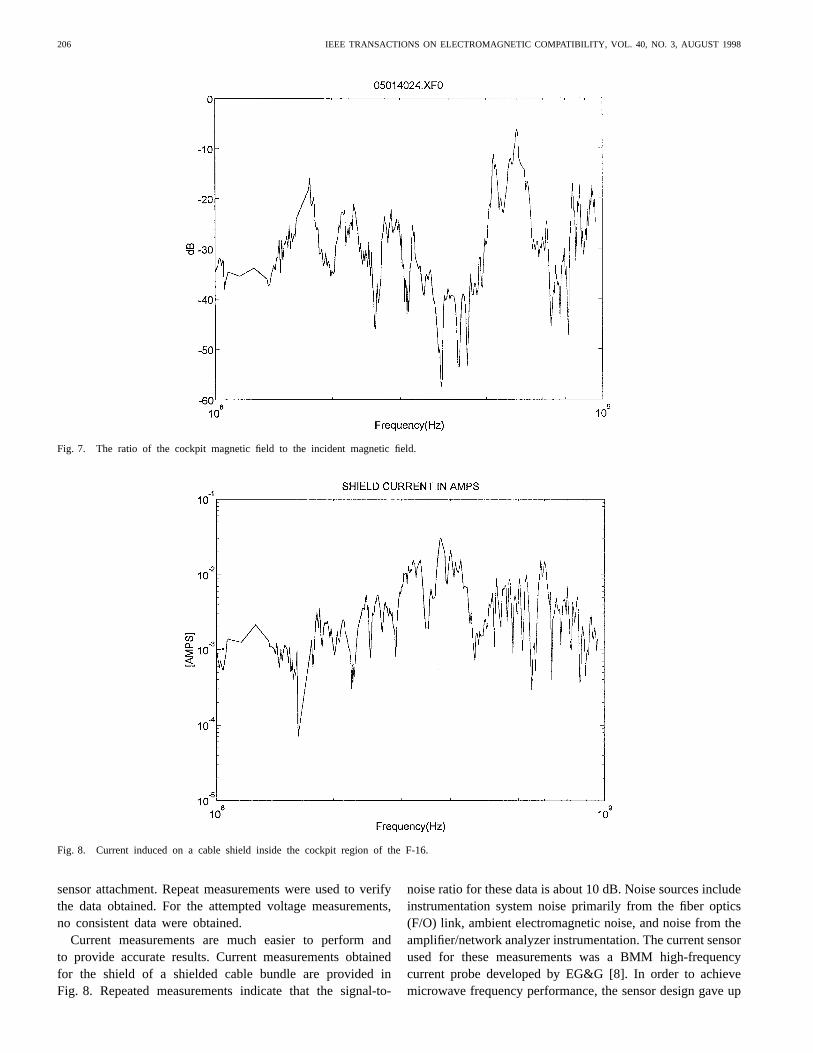
Internal field measurements are possible with the instrumen-tation setup shown in Fig. 4. The F-16 aircraft used for thesemeasurements was a test bed and not an operational aircraft.It was intended for studying the interaction processes andproviding an estimate of responses. In Fig. 6 data are providedfor the magnetic field inside the cockpit. Nose-on illuminationwas used to obtain the data in Fig. 6 in the following figures.In order to obtain a transfer function for the response. the ratioof the data sets in Fig. 6 must be evaluated. Results for thetransfer function are shown in Fig. 7. Magnetic field data are
TAYLOR et al.: WIDE-BAND CW ILLUMINATION OF LARGE-SCALE SYSTEMS—PART II 205
Fig. 5. Incident horizontal magnetic field component recorded in the LESLI rhombic illuminator driven from a common mode source. The measurementpoint is 3 m above the concrete pad in the working volume.
Fig. 6. The magnetic field recorded inside the cockpit of the F-16 test-bed aircraft overlaid with the incident magnetic field measurement (the upper data curve).
presented here since magnetic field sensors are less sensitive tothe environment than electric field sensors [8]. Consequentlythe internal measurement of the magnetic field is much easierto perform and provides more accurate results. Note that themagnetic field strengths at the measurement point inside the
cockpit are, in general, less than the incident field strength,even at resonant frequencies.
Generally, voltage measurements are difficult and inaccurateat high frequencies. This is the result capacitive coupling of themeasurement apparatus and the impedance loading from the
206 IEEE TRANSACTIONS ON ELECTROMAGNETIC COMPATIBILITY, VOL. 40, NO. 3, AUGUST 1998
Fig. 7. The ratio of the cockpit magnetic field to the incident magnetic field.
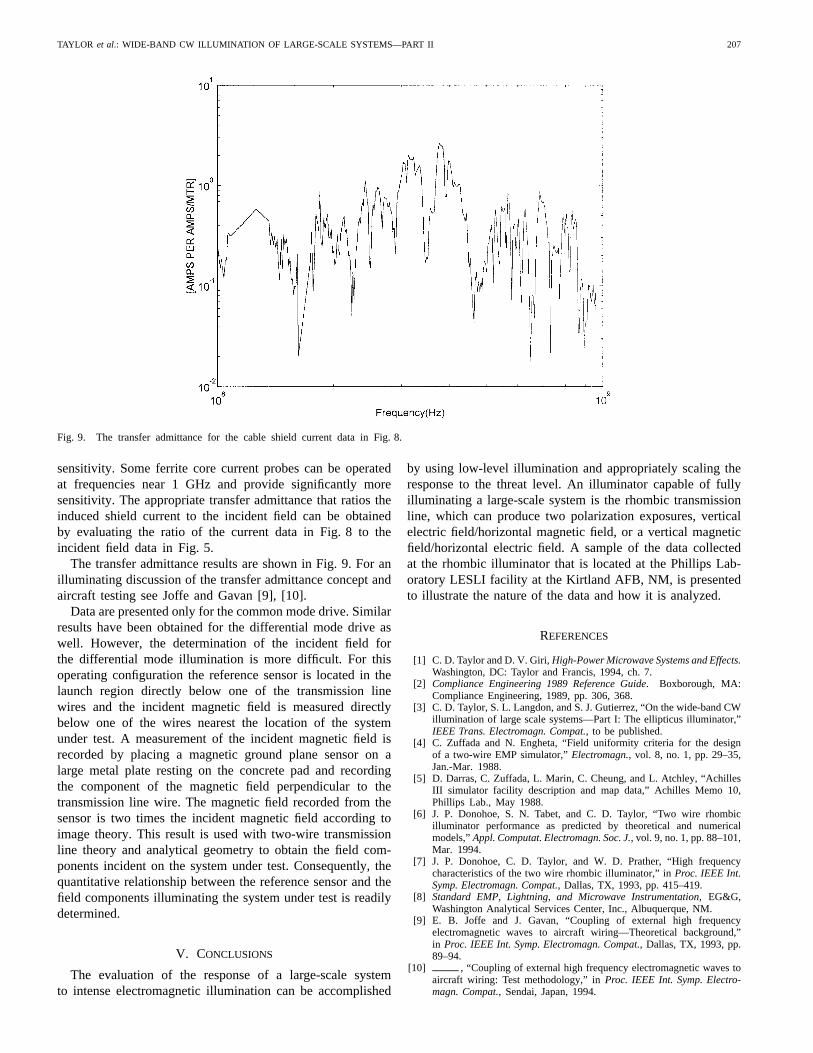
Fig. 8. Current induced on a cable shield inside the cockpit region of the F-16.
sensor attachment. Repeat measurements were used to verifythe data obtained. For the attempted voltage measurements,no consistent data were obtained.
Current measurements are much easier to perform andto provide accurate results. Current measurements obtainedfor the shield of a shielded cable bundle are provided inFig. 8. Repeated measurements indicate that the signal-to-
noise ratio for these data is about 10 dB. Noise sources includeinstrumentation system noise primarily from the fiber optics(F/O) link, ambient electromagnetic noise, and noise from theamplifier/network analyzer instrumentation. The current sensorused for these measurements was a BMM high-frequencycurrent probe developed by EG&G [8]. In order to achievemicrowave frequency performance, the sensor design gave up
TAYLOR et al.: WIDE-BAND CW ILLUMINATION OF LARGE-SCALE SYSTEMS—PART II 207
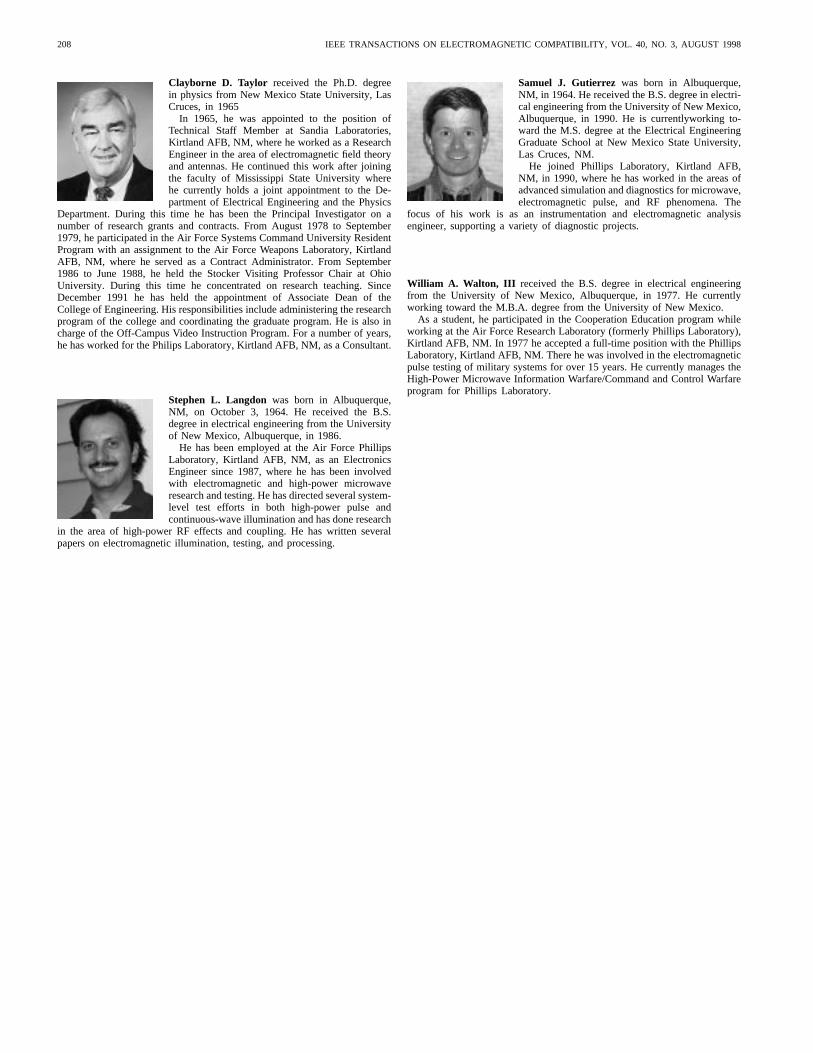
Fig. 9. The transfer admittance for the cable shield current data in Fig. 8.
sensitivity. Some ferrite core current probes can be operatedat frequencies near 1 GHz and provide significantly moresensitivity. The appropriate transfer admittance that ratios theinduced shield current to the incident field can be obtainedby evaluating the ratio of the current data in Fig. 8 to theincident field data in Fig. 5.
The transfer admittance results are shown in Fig. 9. For anilluminating discussion of the transfer admittance concept andaircraft testing see Joffe and Gavan [9], [10].
Data are presented only for the common mode drive. Similarresults have been obtained for the differential mode drive aswell. However, the determination of the incident field forthe differential mode illumination is more difficult. For thisoperating configuration the reference sensor is located in thelaunch region directly below one of the transmission linewires and the incident magnetic field is measured directlybelow one of the wires nearest the location of the systemunder test. A measurement of the incident magnetic field isrecorded by placing a magnetic ground plane sensor on alarge metal plate resting on the concrete pad and recordingthe component of the magnetic field perpendicular to thetransmission line wire. The magnetic field recorded from thesensor is two times the incident magnetic field according toimage theory. This result is used with two-wire transmissionline theory and analytical geometry to obtain the field com-ponents incident on the system under test. Consequently, thequantitative relationship between the reference sensor and thefield components illuminating the system under test is readilydetermined.
V. CONCLUSIONS
The evaluation of the response of a large-scale systemto intense electromagnetic illumination can be accomplished
by using low-level illumination and appropriately scaling theresponse to the threat level. An illuminator capable of fullyilluminating a large-scale system is the rhombic transmissionline, which can produce two polarization exposures, verticalelectric field/horizontal magnetic field, or a vertical magneticfield/horizontal electric field. A sample of the data collectedat the rhombic illuminator that is located at the Phillips Lab-oratory LESLI facility at the Kirtland AFB, NM, is presentedto illustrate the nature of the data and how it is analyzed.
REFERENCES
[1] C. D. Taylor and D. V. Giri,High-Power Microwave Systems and Effects.Washington, DC: Taylor and Francis, 1994, ch. 7.
[2] Compliance Engineering 1989 Reference Guide. Boxborough, MA:Compliance Engineering, 1989, pp. 306, 368.
[3] C. D. Taylor, S. L. Langdon, and S. J. Gutierrez, “On the wide-band CWillumination of large scale systems—Part I: The ellipticus illuminator,”IEEE Trans. Electromagn. Compat., to be published.
[4] C. Zuffada and N. Engheta, “Field uniformity criteria for the designof a two-wire EMP simulator,”Electromagn., vol. 8, no. 1, pp. 29–35,Jan.-Mar. 1988.
[5] D. Darras, C. Zuffada, L. Marin, C. Cheung, and L. Atchley, “AchillesIII simulator facility description and map data,” Achilles Memo 10,Phillips Lab., May 1988.
[6] J. P. Donohoe, S. N. Tabet, and C. D. Taylor, “Two wire rhombicilluminator performance as predicted by theoretical and numericalmodels,”Appl. Computat. Electromagn. Soc. J., vol. 9, no. 1, pp. 88–101,Mar. 1994.
[7] J. P. Donohoe, C. D. Taylor, and W. D. Prather, “High frequencycharacteristics of the two wire rhombic illuminator,” inProc. IEEE Int.Symp. Electromagn. Compat., Dallas, TX, 1993, pp. 415–419.
[8] Standard EMP, Lightning, and Microwave Instrumentation, EG&G,Washington Analytical Services Center, Inc., Albuquerque, NM.
[9] E. B. Joffe and J. Gavan, “Coupling of external high frequencyelectromagnetic waves to aircraft wiring—Theoretical background,”in Proc. IEEE Int. Symp. Electromagn. Compat., Dallas, TX, 1993, pp.89–94.
[10] , “Coupling of external high frequency electromagnetic waves toaircraft wiring: Test methodology,” inProc. IEEE Int. Symp. Electro-magn. Compat., Sendai, Japan, 1994.
208 IEEE TRANSACTIONS ON ELECTROMAGNETIC COMPATIBILITY, VOL. 40, NO. 3, AUGUST 1998
Clayborne D. Taylor received the Ph.D. degreein physics from New Mexico State University, LasCruces, in 1965
In 1965, he was appointed to the position ofTechnical Staff Member at Sandia Laboratories,Kirtland AFB, NM, where he worked as a ResearchEngineer in the area of electromagnetic field theoryand antennas. He continued this work after joiningthe faculty of Mississippi State University wherehe currently holds a joint appointment to the De-partment of Electrical Engineering and the Physics
Department. During this time he has been the Principal Investigator on anumber of research grants and contracts. From August 1978 to September1979, he participated in the Air Force Systems Command University ResidentProgram with an assignment to the Air Force Weapons Laboratory, KirtlandAFB, NM, where he served as a Contract Administrator. From September1986 to June 1988, he held the Stocker Visiting Professor Chair at OhioUniversity. During this time he concentrated on research teaching. SinceDecember 1991 he has held the appointment of Associate Dean of theCollege of Engineering. His responsibilities include administering the researchprogram of the college and coordinating the graduate program. He is also incharge of the Off-Campus Video Instruction Program. For a number of years,he has worked for the Philips Laboratory, Kirtland AFB, NM, as a Consultant.
Stephen L. Langdon was born in Albuquerque,NM, on October 3, 1964. He received the B.S.degree in electrical engineering from the Universityof New Mexico, Albuquerque, in 1986.
He has been employed at the Air Force PhillipsLaboratory, Kirtland AFB, NM, as an ElectronicsEngineer since 1987, where he has been involvedwith electromagnetic and high-power microwaveresearch and testing. He has directed several system-level test efforts in both high-power pulse andcontinuous-wave illumination and has done research
in the area of high-power RF effects and coupling. He has written severalpapers on electromagnetic illumination, testing, and processing.
Samuel J. Gutierrez was born in Albuquerque,NM, in 1964. He received the B.S. degree in electri-cal engineering from the University of New Mexico,Albuquerque, in 1990. He is currentlyworking to-ward the M.S. degree at the Electrical EngineeringGraduate School at New Mexico State University,Las Cruces, NM.
He joined Phillips Laboratory, Kirtland AFB,NM, in 1990, where he has worked in the areas ofadvanced simulation and diagnostics for microwave,electromagnetic pulse, and RF phenomena. The
focus of his work is as an instrumentation and electromagnetic analysisengineer, supporting a variety of diagnostic projects.
William A. Walton, III received the B.S. degree in electrical engineeringfrom the University of New Mexico, Albuquerque, in 1977. He currentlyworking toward the M.B.A. degree from the University of New Mexico.
As a student, he participated in the Cooperation Education program whileworking at the Air Force Research Laboratory (formerly Phillips Laboratory),Kirtland AFB, NM. In 1977 he accepted a full-time position with the PhillipsLaboratory, Kirtland AFB, NM. There he was involved in the electromagneticpulse testing of military systems for over 15 years. He currently manages theHigh-Power Microwave Information Warfare/Command and Control Warfareprogram for Phillips Laboratory.