Embed Size (px)
Citation preview

ON THE USE OF THE WHOLE EIGENVALUE SPECTRUM TO OBTAIN SINGLE MOLECULE BAND STRUCTURES AND SOLID BAND GAPS FOR MOLECULAR ELECTRONICS STUDIES.
JUAN S. GÓMEZ-JERIA*
Programa de Doctorado en Fisicoquímica Molecular. Facultad de Ecología y Recursos Naturales, Universidad Andrés Bello, Santiago, Chile; and Universidad de Chile, Facultad de Ciencias, Departamento de Química. Santiago, Chile.
SUMMARY
A Density Functional microscopic model of C60, consisting of seven molecular orbitals
(3 occupied and 4 empty), was employed to get the best values for the half-width and the scanning distance of the mathematical function used to obtain the theoretical DOS spectrum. It is found that the convolution of the whole eigenvalue spectrum with a Gaussian function should be made with values of 0.1 eV for both, the broadening parameter and the scanning distance. The theoretical calculation of the VB-CB band
gap for the solid from results belonging to isolated C60 is in a relatively good
agreement with most experimental results. We were able to simulate the "experimental" band gap starting from the theoretical DOS spectrum and using some experimental data. Regarding the HOMO-LUMO gap, the isolated molecule results are
in very good agreement with experimental results for solid C60. Finally it is suggested
that experimentalists select their results based on an a priori knowledge of theoretical results because they intend to calculate some properties needing them.
Keywords: Buckminsterfullerene, ADF, band structure, eigenvalue spectrum,
molecular electronics, solid band gap.
1. INTRODUCTION
Molecular electronics has reached a point in which molecules are not the starting point for bulk electronic materials but the active device components within electronic circuitry [1]. In this sense molecular electronics can be defined as the technology using single molecules, small groups of molecules, molecular wires or similar nanostructures to perform electronic functions [2]. The work at this level needs a correct knowledge of the single molecule's geometric, optical, chemical, electronic, etc. properties. Due to the small size of the constituents, new physical and chemical effects are to be expected, or known properties may be improved substantially.
The logical approach to the experimental study at this level is the single molecule spectroscopy [3]. The ideal situation is the experimental study of molecules in a highly diluted gas phase. Essential experimental tools are Surface-Enhanced Resonance Raman Scattering spectroscopy, Scanning Near-Field Optical Microscopy, Scanning Probe Microscopy (SPM), Total Internal Reflection Fluorescence Microscopy, etc. SPM is especially useful for the study of structural (topographic) and functional (electronic conduction) properties at the level of a single molecule, as a function of the environment conditions. Nevertheless, the quantity of data recorded up today with these techniques is still not enough for comparison with theoretical results for a great number of different molecular systems.
The lack of enough single molecule studies makes it necessary to use, as a first approach, experimental results obtained for bulk materials. We must emphasize here that a comparison between experimental results obtained for the bulk material and the single- molecule theoretical results can be done only on a qualitative basis.
At the level of solid molecular systems, one of the properties used to characterize them is their band structure. Two of the bands, the valence band (VB) and the conduction band (CB), together with their energy gap (VB-CB gap), are useful to classify a solid as an insulator, a semiconductor, or a metal. An associated concept is that of density of states (DOS), which describes the energy levels per unit energy increment.
The band structure for bulk materials is obtained with several experimental techniques like optical reflectivity [4-7] and photoelectron spectroscopy (PES) [8]. One of the most useful implementations of PES is the angle-resolved photoemission spectroscopy technique. With this technique the most crucial low-energy excitations near the Fermi surface may be directly probed [9].
The analysis of the conduction band structure is carried out with the technique of inverse photoemission spectroscopy (IPES, the new name for bremsstrahlung isochromat spectroscopy), which yields the energy and momentum of a photon emitted when an electron makes the transition from the conduction band to the valence band [10, 11].
Quantum chemistry represents an essential tool to assign photoelectron spectra, to analyze band structure and to rationalize experimental observations. We shall center ourselves hereafter only on band structures. The general procedure to obtain the
Página 2 de 22

band structure of a single molecule within any standard quantum chemical scheme (semiempirical, ab initio or density functional one) is the following. A quantum chemical calculation is carried out to obtain the complete eigenvalue spectrum. The band structure is then built by synthesizing the whole eigenvalue spectrum into a DOS spectrum by convolution with a unit area Gaussian with a certain width.
There are many conceptual problems remaining unsolved to date at the experimental and theoretical levels. The experimentalist must solve problems such as device addressability, heat dissipation, defined placement of molecules and prevention of diffusion, as well as the exchange of information with other devices and the macroscopic world.
At the level of the theory, an analysis of the literature shows that some fundamental aspects of the broadening process have never been fully addressed. The first one is that, in contrast with experimental measurements, the convolution procedure is not limited by resolution. The second one is related to the energy distance between each calculated DOS value (called here scanning distance, SD) to generate the theoretical curve. The use of different resolution and SD values produces different spectra. The third, and most important one, is related to the following fact. In general, theoretical calculations are compared with experimental results obtained by separate for the valence and conduction bands for the bulk material. The "experimental" gap between the valence and conduction bands is determined in an indirect way. On the other hand, if we take the whole molecular eigenvalue spectra of a single molecule, a putative BV-CB gap is obtained. Nevertheless, this putative BV-CB gap is influenced by the convoluting function's half-width and by the scanning distance. The fourth point is related to the selection of the experimental results we pretend to compare with theory and it is resumed in the following question. What experimental results should be selected to compare with theoretical ones and for what purposes? This question is very important when molecules are the single bricks in electronic circuitry.
In this paper we address the above points through the analysis of a simple molecular model and its comparison with some experimental results. Also we discuss the problem associated with the "experimental" determination of the VB-CB gap in solids and the role of theory in selecting experimental results.
2. METHODS, MODEL AND CALCULATIONS.
The first step consists in building an appropriate molecular model to deduce some possible restrictions to be imposed on the broadening process for the theoretical
calculations. The foregoing analysis will be based on the C60fullerene molecule that
was the object of an earlier study [12].
For this task, a microscopy model of Buckminsterfullerene C60consisting of seven
molecular orbitals (MOs, 3 occupied and 4 empty) was considered. We excluded other MOs because they are energetically well separated from the selected ones and therefore they should have no influence on the convoluting process, unless we employ a large broadening value (as we shall see below a large broadening value is ruled out). The MOs result from a Density Functional Theory calculation (full geometry optimization) with the Amsterdam Density Functional (ADF) package of programs [13-15]. The local density approximation (LDA) characterized by the homogeneous electron gas exchange [16] together with the VWN parameterization [17] were used. The gradient-corrected Becke [18] and Perdew [19] functionals for exchange and correlation are included, respectively. A STO basis set of double-z +
Página 3 de 22

polarization quality was used to describe the valence electrons of all atoms. The 1s electrons were treated as frozen core shells. The level of study at which we are placed discards all quantum chemical methods used for calculations in crystals or other solid state phases with or without periodical conditions.
With these MOs we shall build the theoretical DOS spectrum for the first two valence and first three conduction bands. The DOS spectrum can be obtained through the convolution of the MOs with a variety of mathematical functions. For our analysis we selected a Gaussian function [20], a 50:50 mixture of Gaussian and Lorentzian functions [21] and a purely Lorentzian function taken from Ref. 21. Other convoluting functions have been also used in the literature [22]. The mathematical forms of these functions are:
for a purely Gaussian function,
for a 50:50 combination of Gaussian and Lorentzian functions, and
for a purely Lorentzian function.
In Eq. 1 to 3, DOS(E) is the density of states at energy E, Ei is the energy of the i-th
MO and σ is the function's half-width. The population of all the MOs was taken as 2. The DOS is calculated for a given number of points within a suitable range of energies E.
Examining the form of Eq. 1 to 3 we may see that the choice of s and SD will necessarily influence the resulting DOS curves shape. Therefore, we calculated the DOS curve for several values of both parameters. Also, for each couple of values of s and SD we obtained a VB-CB energy "gap". We used these theoretical results to find possible restrictions to apply for the selection of the correct theoretical spectrum.
The second step consisted in comparing the theoretical DOS spectrum with some experimental spectra selected from the literature [23-26]. The last part is a short discussion about how experimentalists select their results.
2. RESULTS AND DISCUSSION
(1)
(2)
(3)
Página 4 de 22

The C60 crystal is formed from an ordered array of molecules which retain their
identities [27]. Solid-state NMR studies showed that molecules are randomly rotating at room temperature [28] as a result of their sphericity and weak interactions
between them. It was shown that C60 they spin so easily that they rival gas phase
C60 molecules in their rotational characteristics [27, 29]. Therefore we should expect
that many properties of isolated C60 be preserved when the solid is formed [27].
The selection of the theoretical DOS spectrum.
Let us begin by making some purely theoretical considerations. Table 1 shows the degeneracies and energies of the selected MOs. The HOMO is separated by about 1.15 eV from the HOMO-1 and it will form the first valence band (VB1).The HOMO-1 is separated only by about 0.11 eV from the HOMO-2. Therefore the HOMO-1 and HOMO-2 should both form the second valence band (VB2) which must have more states that VB1.
This is the first formal qualitative restriction that we must impose on the DOS spectrum results.
The LUMO, LUMO+1 and LUMO+2 are separated by about 1 eV. The degeneracies are the same (3) for all. LUMO+3 (fivefold degenerate) is separated by only 0.16 eV from LUMO+2. Therefore the first two conduction bands of the DOS spectrum (the LUMO-derived and LUMO+1-derived respectively) should have almost the same number of states but the third band must have more states because it is formed by LUMO+2 and LUMO+3. This is the second formal qualitative restriction imposed on the DOS spectrum results.
Associating the above number of states with the value at the peak of each band in the theoretical DOS spectrum we obtain some relationships between the band's relative heights which are displayed in Table 2. These relative intensities are also quantitative formal restrictions to impose over the resulting theoretical DOS
Table 1.
Degeneracy and energy (eV) of the C60 Molecular Orbitals used in the
model. Erel is the energy relative to the Fermi level located at 0.0 eV.
MO Degeneracy Energy (eV) (eV)
HOMO-2 5 -8.303 -2.094
HOMO-1 4 -8.190 -1.981
HOMO 5 -7.041 -0.832
LUMO 3 -5.377 0.832
LUMO+1 3 -4.295 1.914
LUMO+2 3 -3.334 2.872
LUMO+3 5 -3.172 3.037
Fermi Level = -6.209 eV.
Página 5 de 22

spectrum.
Let us analyze now the results of the various convolution results at the light of the above restrictions.
Figure 1 shows the DOS curves for several values of s for the case of a Gaussian function with a fixed scanning distance of 0.1 eV. Figures 2 and 3 show the same curves for a Lorentzian function and a 50:50 Gaussian and Lorentzian functions mixture respectively. For the Gaussian case we may see that the only acceptable spectra is the one obtained with σ = 0.1 eV. The relative intensities are maintained and the VB-CB "gap" is about 1.0 eV as shown in Table 3. If we employ higher values for s we observe that the VB-CB "gap" disappears (see Table 3) and that the bands become progressively mixed. For the case of the Lorentzian broadening shown in Fig. 2 all s values employed give a zero VB-CB "gap". Interestingly the relative intensities are more or less well represented for s = 0.3 eV. The fact that the Lorentzian function gives a zero "band gap" is also reflected in the case of a Gaussian and Lorentzian mixture for s = 0.1 (see Fig. 3 and Table 3). Here the Lorentzian function is again the cause of the null band gap. Therefore a first general conclusion of these results if that Lorentzian functions, alone or combined, as represented in Eq. 2 and 3, are not suitable for calculating VB-CB "gaps" for isolated molecules. A second conclusion is that a Gaussian function with a s value of about 0.1 eV seems to be the most suitable methodology for calculating at the same time VB-CB band "gaps" and relative band intensities. For the case of a Gaussian broadening with s = 0.1 eV and SD = 0.1 eV we have I(CB2) 1.0 I(CB1), I(VB1) H" 1.6 I(CB1), I(VB2) H" 2.5 I(CB1) and I(CB3) H" 2.1 I(CB1). These results compare very well with the ones in Table 2.
Table 2.
Relative heights for some bands of C60 DOS spectrum. CB1
intensity was taken as the unit value.
Band I
VB2 3
VB1 1.7
CB1 1
CB2 ~1
CB3 2.7
Página 6 de 22
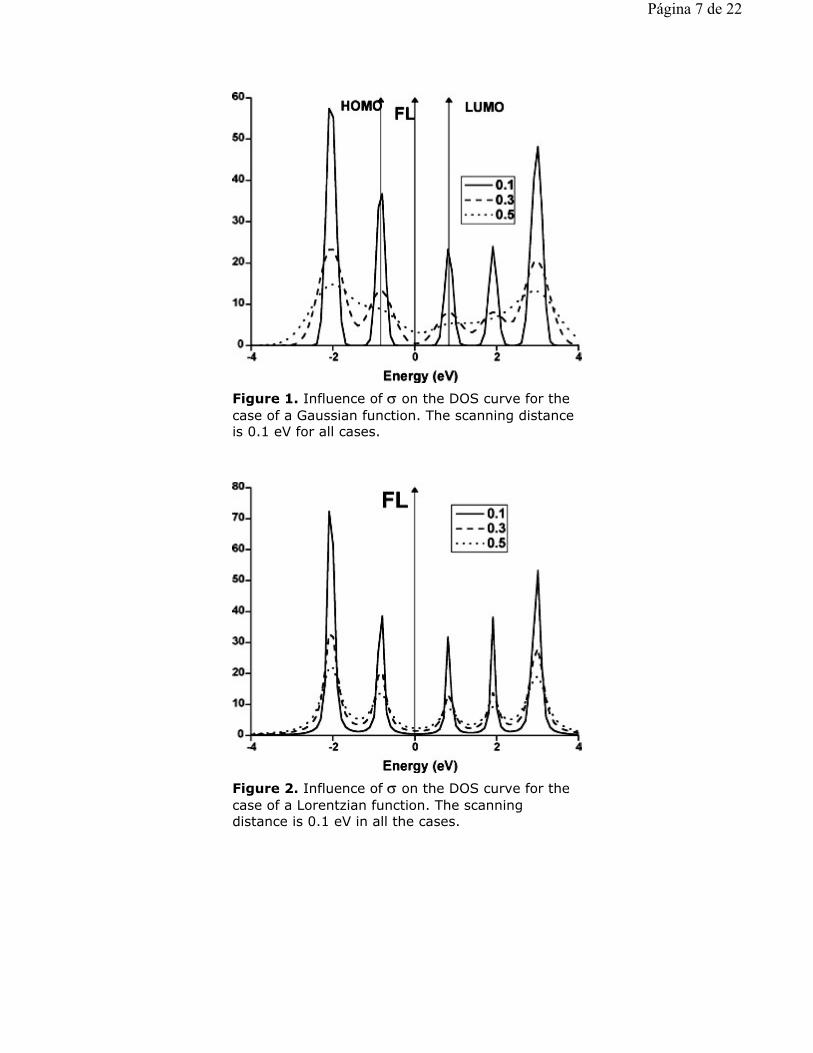
Figure 1. Influence of σ on the DOS curve for the case of a Gaussian function. The scanning distance is 0.1 eV for all cases.
Figure 2. Influence of σ on the DOS curve for the case of a Lorentzian function. The scanning distance is 0.1 eV in all the cases.
Página 7 de 22

Figures 4 to 6 show, for the same three functions, the influence of the variation of the scanning distance on the DOS curves when the broadening parameter is kept
constant (σ = 0.1 eV). The associated VB-CB band "gaps" are shown in Table 4. We may see immediately that a rising of the scanning distance SD= 0.3 and 0.5 eV) produces spectra which are not compatible with the theoretical considerations exposed above. The conclusion is that a scanning distance of 0.1 eV or less is to be
Figure 3. Influence of ó on the DOS curve for a 50:50 mixture of Gaussian and Lorentzian functions. The scanning distance is 0.1 eV for all the cases.
Table 3.
BV-CB "gap" of C60 for different values of the bandwidth parameter (in eV)
and a constant value (0.1 eV) for the scan distance. *When the band "gap" is zero, the DOS at the Fermi level is given between parentheses.
σ Gaussian gap Lorentzian gap Gaussian + Lorentzian
gap
0.1 1.0 (DOS = 0.0)No gap (DOS =
0.55)No gap (DOS =
0.49)
0.3No gap (DOS =
0.56)No gap (DOS =
1.49)No gap (DOS =
1.53)
0.5No gap (DOS =
3.2)No gap (DOS =
2.37)No gap (DOS =
2.45)
* The "gaps" were calculated as the difference of energy of the points at which the associated DOS in the right and left tails of the BV and CB respectively are lesser than 0.01.
Página 8 de 22

used. We must note that diminishing the scanning distance could influence only a band's fine structure.
Figure 4. Influence of the scanning distance on the DOS curve for the case of a Gaussian function. The broadening parameter is constant in all the cases (σ = 0.1 eV).
Figure 5. Influence of the scanning distance on the DOS curve for the case of a Lorentzian function. The broadening parameter is constant in all the cases (σ = 0.1 eV).
Página 9 de 22

Figure 6. Influence of the scanning distance on the DOS curve for a 50:50 mixture of Gaussian and Lorentzian functions. The broadening parameter is constant in all the cases (σ = 0.1 eV).
Table 4.
BV-CB "gap" of for different values of the scan distance (in eV) for a fixed
bandwidth (C60σ = 0.1 eV).
Scan distance Gaussian gap Lorentzian gapGaussian + Lorentzian
gap
0.1 1.0 No gap (DOS = 0.48) No gap (DOS = 0.48)
0.3 0.9 No gap (DOS = 0.48) No gap (DOS = 0.48)
0.5 0.5 No gap (DOS = 0.51) No gap (DOS = 0.51)
Página 10 de 22
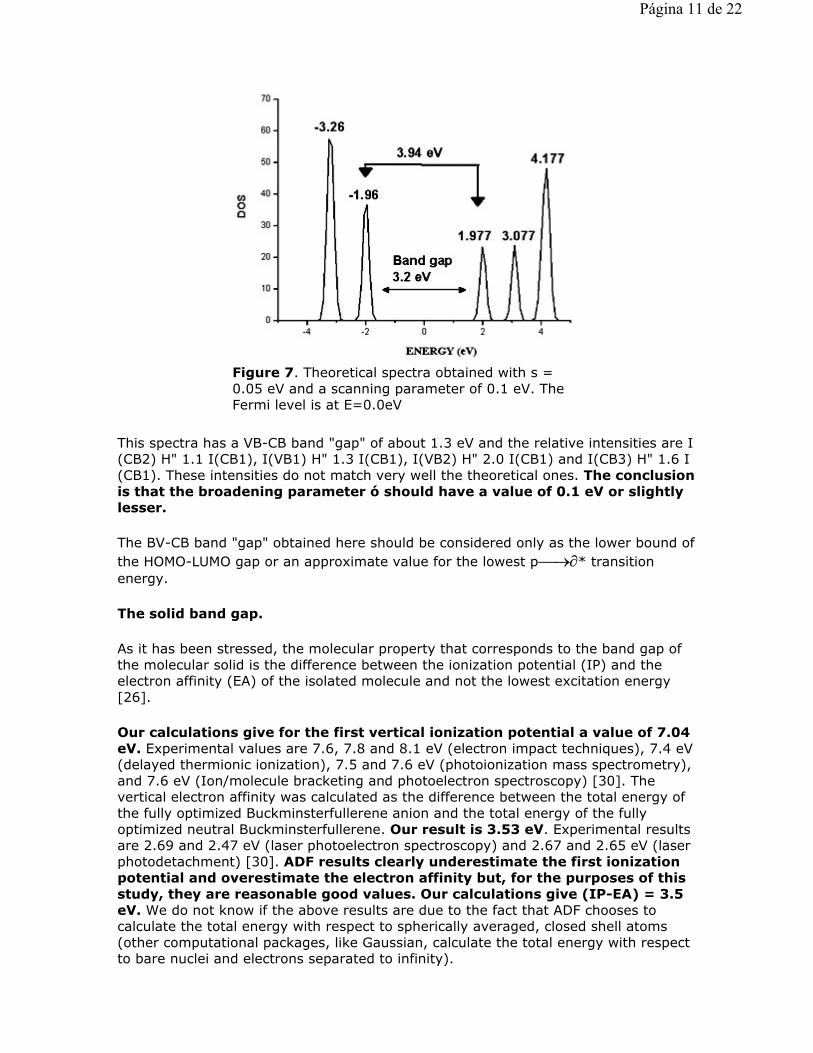
This spectra has a VB-CB band "gap" of about 1.3 eV and the relative intensities are I(CB2) H" 1.1 I(CB1), I(VB1) H" 1.3 I(CB1), I(VB2) H" 2.0 I(CB1) and I(CB3) H" 1.6 I(CB1). These intensities do not match very well the theoretical ones. The conclusion is that the broadening parameter ó should have a value of 0.1 eV or slightly lesser.
The BV-CB band "gap" obtained here should be considered only as the lower bound of the HOMO-LUMO gap or an approximate value for the lowest p→∂* transition energy.
The solid band gap.
As it has been stressed, the molecular property that corresponds to the band gap of the molecular solid is the difference between the ionization potential (IP) and the electron affinity (EA) of the isolated molecule and not the lowest excitation energy [26].
Our calculations give for the first vertical ionization potential a value of 7.04 eV. Experimental values are 7.6, 7.8 and 8.1 eV (electron impact techniques), 7.4 eV (delayed thermionic ionization), 7.5 and 7.6 eV (photoionization mass spectrometry), and 7.6 eV (Ion/molecule bracketing and photoelectron spectroscopy) [30]. The vertical electron affinity was calculated as the difference between the total energy of the fully optimized Buckminsterfullerene anion and the total energy of the fully optimized neutral Buckminsterfullerene. Our result is 3.53 eV. Experimental results are 2.69 and 2.47 eV (laser photoelectron spectroscopy) and 2.67 and 2.65 eV (laser photodetachment) [30]. ADF results clearly underestimate the first ionization potential and overestimate the electron affinity but, for the purposes of this study, they are reasonable good values. Our calculations give (IP-EA) = 3.5 eV. We do not know if the above results are due to the fact that ADF chooses to calculate the total energy with respect to spherically averaged, closed shell atoms (other computational packages, like Gaussian, calculate the total energy with respect to bare nuclei and electrons separated to infinity).
Figure 7. Theoretical spectra obtained with s = 0.05 eV and a scanning parameter of 0.1 eV. The Fermi level is at E=0.0eV
Página 11 de 22

Using the experimental values IP = 7.6 eV and EA = 2.7 eV we get (IP-EA) = 4.9 eV. Some reported values for the solid band gap obtained from experimental results are: 1.85 eV [31], less that 3.5 eV [26], 1.5 eV [32], 2.3 eV [25] and less than 3.7 eV [24]. Why are these values so different? The answer is that the band gap is a property that is not determined in a direct way. Interestingly the above results below 2 eV seem to be closer to the HOMO-LUMO gap rather than to the solid band gap.
Let us examine some experimental results to clarify this point. Lof et al. [25]
employed 3 to 6 layers of C60 deposited on a Si(100) substrate. After the PES and
IPES spectra were measured the Fermi level was obtained by measuring an Ag reference, correcting when necessary. They obtain a band gap of 2.3 ± 0.1 eV and a BV-CB band peak distance of 3.5 eV. Jost et al. [26] measured the IPES and reported the spectrum referenced in energy to the center of the lowest empty state, 1.5 eV below the Fermi level of the spectrometer. After they make use of their measured PES spectra [23] in which the center of the highest occupied state lays 2 eV below the Fermi level of the spectrometer. With the assumption that the Fermi level of both samples are the same they get an energy separation between the peak centers of about 3.5 eV (the band gap will be necessarily smaller). Ohno et al. [24] measured
the PES and IPES spectra of 50-100 Å thick films of C60 grown on GaAs(110). Next,
they present a distribution of occupied and empty electronic states referenced to the Fermi level of the grounded spectrometers. They obtain an energy separation between the HOMO- and LUMO-derived peaks of 3.7 eV. Naturally the band gap should be smaller. Interestingly, their spectrum is normalized so that the total intensity of the LUMO-derived peak was 60% of the HOMO-derived peak, reflecting the degeneracies of these levels and in perfect agreement with Table 2.
With one exception (1.85 eV which is very closed to the HOMO-LUMO gap) we may conclude that our theoretical calculation of the VB-CB band gap is in a relatively good agreement with most experimental results.
On the other hand, it is possible to simulate the "experimental" band gap starting from the theoretical spectrum and using some experimental data. The procedure is the following. First we obtained the valence bands. Next we used the experimental Fermi level value of the spectrometer reported in Ref. 23 (2 eV) and we shift the valence spectrum to zero. Finally we made the same procedure for the conduction bands. The resulting spectrum (with s = SD = 0.1 eV) is shown in Figure 8. We may observe that we get a VB-CB gap of about 3.2 eV and an energy separation between the peak centers of about 3.94 eV, values being in very good agreement with the above experimental results. The VB-CB value is close to the 3.5 value we calculated as (IP-EA).
Página 12 de 22

The HOMO-LUMO gap.
Our calculated HOMO-LUMO gap is about 1.7 eV. High-resolution electron-energy-loss
spectroscopy studies of C60 thin films deposed on Si(100) show that the value of the
first one-electron excitation of C60 is 1.55 eV [33]. This value is consistent with the
optical absorption spectrum in the solid, in which an onset appears at about 1.5 eV [34]. It is interesting to note that the optical absorption spectrum of in n-hexane solution has an onset at a slightly energy [25]. Therefore, regarding the HOMO-LUMO gap, the isolated molecule results are in very good agreement with experimental results for solid .
On the other hand, as the single molecule is the object of study we may think in a first approach, that some of the experimental results obtained in films that attenuate totally the substrate emission, that employ low-energy
photons or electrons, and/or in which the density of C60 molecules is low,
should be the most suitable ones to make a comparison with the theoretical DOS spectrum of the isolated molecule. We must keep in mind that any PES or IPES experiment will produce several results depending on the photon or electron energies.
Figures 9 and 10 show the experimental PES results for the valence band of
condensed C60 [23]. Figures 11 and 12 show, respectively, the valence band spectra
of C60 on metallic Bi and Mg layers [24]. Note that the experimental results reported
in Figs. 9 and 10 correspond to deposition on thick films that are supposed to attenuate totally the substrate emission [25]. Figures 13 and 14 show the
corresponding results for the empty states of C60 experimentally obtained through
IPES [24, 26].
Figure 8. Simulation of the experimental VB-CB band gap from the theoretical DOS spectrum. The Fermi level is at E=0.0 eV
Página 13 de 22

Figure 9. Photoemission energy distribution curves
for condensed C60 showing
the full valence band. Reprinted (Fig. 1) with permission from J.H. Weaver, J.L. Martins, Y. Chen, T.R. Ohno, G.H. Kroll, N. Troullier, R.E. Hauffer and R.E. Smalley, Phys. Rev. Lett., 66, 1741, 1991. © (1991) by the American Physical Society.
Página 14 de 22

Regarding the valence band region features displayed in figures 9 to 12 it can be observed that the line shapes change dramatically as a function of the incident photon energy. It is expected that the photons with lower energies provide information mainly from the upper part of the valence band.
Figure 10. High-resolution energy distribution curve showing some resolvable experimental
features in the photoemission spectrum of C60.
Reprinted (Fig. 2) with permission from J.H. Weaver, J.L. Martins, Y. Chen, T.R. Ohno, G.H. Kroll, N. Troullier, R.E. Hauffer and R.E. Smalley, Phys. Rev. Lett., 66, 1741, 1991. © (1991) by the American Physical Society.
Figure 11: Valence-band spectra
for C60 condensed on a 120-Å-
thick Bi layer. One ML is equivalent to 1,15 x 10¹⁴ molecules/cm2. Reprinted (Fig. 3)
Página 15 de 22

with permission from T.R. Ohno, Y. Chen, S.E. Harvey, G.H. Kroll, J.H. Weaver, R.E. Hauffer and R.E. Smalley, Phys. Rev. B44, 13747, 1991. © (1991) by the American Physical Society.
Figure 12. Valence-band
spectra for C60 condensed
on a 300-Å-thick Mg film. LVV shows the valence band transition of Mg. Reprinted (Fig. 4) with permission from T.R. Ohno, Y. Chen, S.E. Harvey, G.H. Kroll, J.H. Weaver, R.E. Hauffer and R.E. Smalley, Phys. Rev. B44, 13747, 1991. © (1991) by the American Physical Society.
Página 16 de 22

Let us center our attention on the experimentally resolvable features of the valence bands VB1 and VB2. We shall look for cases in which the experimental intensity of theVB2 band is higher that the intensity of the VB1 band (about 1.8 times, see Table 2). Figure 9 shows that this condition is fulfilled for hr = 65 and 170 eV, the latter being more acceptable. In Fig. 10, with hr = 50 eV, VB1 and VB2 have almost the same
intensity. In Fig. 11, with hr = 70 eV, only in the case of C60a thickness of 0.7 ML
there is an indication that the intensity of VB2 is greater than the intensity of VB1. Figure 12 shows no results compatible with our aim. The conclusion is then that the spectrum of Fig. 10 with hr = 170 eV is the most similar to the corresponding theoretical DOS spectrum (see Table 2).
The empty states of C60 are shown in Figures 13 and 14. Here we are looking for a
spectrum in which CB1 and CB2 have the same intensity, and CB3 having 2.7 times the intensity of the formers. In Fig. 13 we may observe some experimental results in which I(CB1) and I(CB2) are the same and I(CB3) is greater: they are the cases in which hr = 15.25 and 19.25 eV. In Fig. 14 we may see that I(CB1) is greater than I(CB2) in all the spectra, therefore we shall not consider them.
Página 17 de 22

With these criteria, the best experimental result for the valence band displayed in Fig. 9 should be selected. It corresponds to a photon energy of 170 eV. In the case of the
Figure 13. Normalized photon distribution curves showing electronic features within 15 eV of the lowest unoccupied level of solid
C60. Reprinted (Fig. 2) with
permission from: M.B. Jost, N. Troullier, D.M. Poirier, J.L. Martins, J.H. Weaver, L.P.F. Chibante and R.E. Smalley, Phys. Rev. B44, 1966, 1991. © (1991) by the American Physical Society.
Figure 14. Empty state spectra obtained with inverse photoemission for
C60 on Au showing a shift in
energy for the monolayer results relative to those for thicker layers because of first-layer mixing of LUMO with Au substrate levels. Reprinted (Fig. 9) with permission from T.R. Ohno, Y. Chen, S.E. Harvey, G.H. Kroll, J.H. Weaver, R.E. Hauffer and R.E. Smalley, Phys. Rev. B44, 13747, 1991. © (1991) by the American Physical Society.
Página 18 de 22

conduction band the results displayed in Fig. 13, corresponding to an electron beam energy of 15.25 eV, should be selected. Ohno et al. made a different choice. They used the 65 eV spectrum of Fig. 9 and the spectrum with hr = 19.25 eV of Fig. 13 [24]. The important point is that these selections are based on an a priori knowledge of the theoretical results and therefore they are theory-based because they seek to reproduce its results. Note that if we take the spectra we selected and normalized them so that the total intensity of the LUMO-derived peak is about 60% of the HOMO-derived peak we follow a similar procedure than Ohno et al [24], procedure that is in agreement with the theoretical results presented in Table 2. Does this mean that other experimental results should be neglected? The answer is that these results are explainable in terms of more complex phenomena and theories but they are discarded for further discussion in these papers only because a philosophical choice was made. This is a clear case of dependence on theory [36]. Then, if we want to provide an "experimental" estimate of the band gap of the solid we must select spectroscopic results matching the theoretical DOS spectra.
CONCLUSIONS.
ACKNOWLEDGMENTS
Prof. Dr. John H. Weaver (U. of Illinois at Urbana-Champaign, USA) and the American Physical Society are thanked for their permission to reproduce some figures. This work has been partially funded by Departamento de Química, Facultad de Ciencias, Universidad de Chile. Dr. Ramiro Arratia-Pérez (UNAB) is thanked for granting access to the ADF program.
REFERENCES
1. J.R. Heat and M.A. Ratner, Physics Today, May, 43 (2003).
2. H. Hahn, Adv. Eng. Mater. 5, 277 (2003).
3. Rigler, R.; Orrit, M.; Basche, T. (Eds.). Single Molecule Spectroscopy Nobel Conference Lectures Series: Springer Series in Chemical Physics, Vol. 67, 2001.
1. The convolution of the eigenvalue spectrum with a Gaussian function should be made with values of 0.1 eV for the broadening parameter and the scanning distance.
2. The theoretical calculation of the VB-CB band gap for the solid, from results
belonging to isolated C60, is in a relatively good agreement with most
experimental results. We were able to simulate the "experimental" band gap starting from the theoretical DOS spectrum and using some experimental data.
3. Regarding the HOMO-LUMO gap, the isolated molecule results are in very good agreement with experimental results for solid .
4. When experimentalists discuss the solid band gap, they use only those experimental results resembling the theoretical DOS spectrum. This is a good case of a theory-directed choice.
Página 19 de 22

4. D. Aspnes, Nuovo Cimento, 39, 337 (1977).
5. M. Cardona, Solid State Physics, Suppl. (1969).
6. D. L. Greenaway and K. Harbeke. Optical Properties and Band Structures of Semiconductors (Oxford: Pergamon Press. 1968).
7. F. Bassani and G. Pastori. Electronic States and Optical Transition in Solids (Oxford: Pergamon Press. 1975).
8. N. V. Smith. Photoelectron Spectroscopy of Solids. (New York: Springer. 1977).
9. P. D. Johnson, Rep. Prog. Phys, 60, 1217 (1997).
10. N.V. Smith, Rep. Prog. Phys., 51, 1227 (1988).
11. S. Hüfner. Photoelectron Spectroscopy (New York: Springer. 2003).
12. J.S. Gómez-Jeria, N. Gónzalez-Tejeda and F. Soto-Morales, J. Chil. Chem. Soc., 48, 85 (2003).
13. G. te Velde, F.M. Bickelhaupt, S.J.A. van Gisbergen, C. Fonseca Guerra, E.J. Baerends, J.G. Snijders, T. Ziegler, J. Comput. Chem. 22, 931-967 (2001).
14. C. Fonseca Guerra, J.G. Snijders, G. te Velde, and E.J. Baerends, Theor. Chem. Acc. 99, 391 (1998).
15. ADF-2004.01, SCM, Theoretical Chemistry, Vrije Universiteit, Amsterdam, The Netherlands.
16. Slater, J.C. Quantum Theory of Molecules and Solids. Vol. 4. McGraw"Hill, New York, 1974.
17. H. Vosko, L. Wilk, and M. Nusair. Can. J. Phys., 58, 1200 (1980).
18. A.D. Becke, Physical Review A, 38, 3098 (1988).
19. J.P. Perdew, Physical Review B, 33, 8822 (1986).
20. H.L.Yu, Phys. Rev. B15, 3609 (1977).
21. A. Rochefort, D.R. Salahub and P. Avouris, J. Phys. Chem., B103, 641 (1999).
22. S.J. Sferco and M.C.G. Passegi, J. Phys. C: Solid State Phys., 18, 3717 (1985).
23. J.H. Weaver, J.L. Martins, T. Komeda, Y. Chen, T.R.Ohno, G.H. Kroll, N. Troullier, R.E. Hauffer and R.E. Smalley, Phys. Rev. Lett. 13, 1741 (1991).
24. T.H. Ohno, Y. Chen, S.E. Harvey, G.H. Kroll, J.H. Weaver, R.E. Hauffer and R.E. Smalley, Phys. Rev., B44, 13747 (1991).
Página 20 de 22

25. R.W. Lof, M.A. van Veenendaal, B. Koopmans, H.T. Jonkman and G.A. Sawatzky, Phys. Rev. Lett., 68, 3924 (1992).
26. M.B. Jost, N. Troullier, D.M. Poirier, J.L. Martins, J.H. Weaver, L.P.F. Chibante and R.E. Smalley, Phys. Rev. B44, 1966 (1991).
27. D. R. Huffman in: Nanomaterials: Synthesis, properties and Applications. A. S. Edelstein and R. C. Cammarata, Eds. (IOP, Philadelphia. 2002). Pp.477-494.
28. C. S. Yanoni, R. D. Johnson, G. Meijier, D. S. Bethune and J. R. Salem, J. Phys. Chem., 95, 9 (1991).
29. R. D. Johnson, C. S. Yanoni, H. C. Dorn, J. R. Salem and D. S. Bethune, Science, 255, 1235 (1992).
30. For ionization potential: D. Muigg, P. Scheier, K. Becker and T.D. Mark, J. Phys. B, 29, 5193 (1996); M. SaiBaba, T.S. LakshmiNarasimhan, R. Balasubramanian and C.K. Mathews , J. Phys. Chem., 99, 3020, (1995); P. Scheier, B. Dunser, R. Worgotter, M. Lezius, R. Robl and Mark, T.D., Int. J. Mass Spectrom. Ion Processes, 138, 77 (1994); R.D. Beck, P. Weis, G. Brauchle and M.M. Kappes , J. Chem. Phys., 100, 262 (1994); M. SaiBaba, T.S. LakshmiNarasimhan, R. Balasubramanian and C.K.Mathews, Int. J. Mass Spectrom. Ion Processes, 125, R1 (1993); K.K. Yoo, B. Ruscic and J.J. Berkowitz, Chem. Phys., 96, 911 (1992); M. SaiBaba, T.S. LakshmiNarasimhan, R. Balasubramanian and C.K. Mathews, Int. J. Mass Spectrom. Ion Processes, 114, R1 (1992); I.V. Hertel, H. Steger, J. DeVries, B. Weisser, C. Menzel, B. Kamke and W. Kamke, Phys. Rev. Lett., 68, 784 (1992); J. DeVries, H. Steger, B. Kamke, C. Menzel, B. Weisser, W. Kamke and I.V. Hertel, Chem. Phys. Lett., 188, 159 (1992); J.A. Zimmerman and J.R. Eyler, J. Chem. Phys., 94, 3556 (1991); S.W. McElvany and B.H. Bach, Proc. 39th ASMS Conference on Mass Spectrometry and Allied Topics, 39, 422 (1991); D.L. Lichtenberger, M.E. Jatko, K.W. Nebesny, C.D. Ray, D.R. Huffman, L.D. Lamb, Mater. Res. Soc. Symp. Proc., 206, 673 (1991); D.L. Lichtenberger, K.W. Nebesny, C.D. Ray, D.R. Huffman and L.D. Lamb, J. Am. Chem. Soc., 176, 203 (1991). For electron affinity: X.B. Wang, C.F. Ding and L.S. Wang, J. Chem. Phys., 110, 8217 (1999); C. Brink, L.H. Andersen, P. Hvelplund, D. Mathur and J.D. Voldstad , Chem. Phys. Lett., 233, 52 (1995); L.- S. Wang, J. Conceicao, C. Jin, R.E. Smalley, Chem. Phys. Lett., 182, 5 (1991); B. Palpant, A. Otake, F. Hayakawa, Y. Negishi, G.H. Lee, A. Nakajima and K. Kaya, Phys.Rev. B-Condens Matter, 60, 4509 (1999); G. Chen, S. Ma, R.G. Cooks, H.E. Bronstein, M.D. Best and L.T. Scott, J. Mass Spectrom., 32, 1305 (1997); S.H. Yang, C.L. Pettiette, J. Conceicao, O. Cheshnovsky and R.E. Smalley, Chem. Phys. Lett., 139, 233 (1987).
31. R. S. Kremer, T. Rabenau, W. K. Maser, M. Kaiser, A. Simon, M. Haluiska and H. Kuzmany, Appl. Phys., A56, 211 (1993).
32. S. Saito and A. Oshiyama, Phys. Rev. Lett., 66, 2637 (1991).
33. G. Gensterblum, J.J. Pireaux, P.A. Thiry, R. Caudano, J.P. Vigneron, Ph. Lambin, and A.A. Lucas, Phys. Rev. Lett., 67, 2171 (1991).
34. A. Skumanich, Chem. Phys. Lett., 182, 486 (1991).
35. J.P. Hare, H.W. Kroto and R. Taylor, Chem. Phys. Lett., 177, 394 (1991).
Página 21 de 22

36. A. Franklin, The Epistemology of Experiment, in: D. Gooding, T. Pinch and S. Schaffer, Eds., The uses of Experiment (Cambrige U. Press, Cambridge 1989). Pp.437-467.
Página 22 de 22