Embed Size (px)
Citation preview
17th International Symposium on Applications of Laser Techniques to Fluid Mechanics Lisbon, Portugal, 07-10 July, 2014
- 1 -
On the use of helium-filled soap bubbles for large-scale Tomographic
PIV wind tunnel experiments
Scarano F1, Ghaemi S2, Caridi G1, Bosbach J3, Dierksheide U4, Sciacchitano A1
1: Aerospace Engineering Department, Delft University of Technology, Delft, The Netherlands 2: Mechanical Engineering Department, University of Alberta, Canada
3: Institute of Aerodynamics, German Aerospace Center (DLR), Göttingen, Germany 4: LaVision GmbH, Göttingen, Germany
*correspondent author: [email protected]
Abstract Experiments are conducted with helium-filled soap bubbles (HFSB) in the sub-millimetre diameter range in the low speed flow regime to ascertain the aerodynamic behaviour of these tracers for PIV measurements in wind tunnels. The flow-tracing fidelity of HFSB relies on their neutral buoyancy and partly on their relative size to the flow time and length scales. This study follows closely the methodology proposed in an early work by Kerho and Bragg (1994) who investigated the capabilities of HFSB within a steady potential flow close to a stagnation point. The conclusions of the present investigation differ from those drawn in the latter work as it is concluded that HFSB do represent a valid alternative for quantitative velocimetry in wind tunnel aerodynamic experiments.
The flow stagnating ahead of a circular cylinder of 25 mm diameter is considered at speed varying from 5 to 30 m/s. The HFSB are injected at the end of the wind tunnel nozzle contraction. Planar high-speed PIV and PTV techniques are used to obtain the velocity field distribution, velocity streamlines and to map the fluid flow acceleration along the trajectories. PIV experiments conducted in the same conditions with micron size fog droplets are taken as a term of comparison. The parameters governing the HFSB production are also varied: helium relative to soap and relative to air flow rates. The variation of the latter parameters affects the bubble size, characterized with the shadow technique, as well as the HFSB tracing fidelity. The latter is quantified by the velocity slip and with an estimate of the time response in analogy to the case of small heavy tracers.
The HFSB tracers are used for a feasibility demonstration of large-scale tomographic PIV in wind tunnels. The wake of a cylinder at Re = 17,000 is considered. It is shown that the HFSB allow wind-tunnel tomographic PIV measurements over the unprecedented nominal volume of above 4,000 cm3. Within the current measurement, the large scale motions induced by the counter-rotating vortices in the cylinder wake are captured; in contrast, turbulent sub-structures are not resolved due to the low spatial resolution, mainly ascribed to the low seeding concentration.
1. Introduction
The use of particle image velocimetry in wind tunnels has evolved from experiments done at moderate scale (typically 10x10 cm2) up to large scale ones both for aeronautical as well as automotive applications (50x50 cm2). In literature, PIV experiments can be found that report a measurement domain exceeding a meter by means of several fields of view of typically 40x30 cm2 size.
Considering three-dimensional techniques, tomographic PIV has been applied successfully in several wind tunnel experiments, however even the largest size of the investigated volume was of the order of 16x22x8 cm3 (e.g. Fukuchi et al., 2012).The main factors limiting the upscale of particle image velocimetry to macroscopic dimensions are the limited pulse energy from the illumination source, the scattering efficiency of the tracers and the sensitivity and spatial resolution of the imagers.
The progress obtained in the last 20 years is largely due to the evolution of sensor technology that have led to CCD cameras up to 30 Mpixel and with quantum efficiency around 50%. Comparatively, the pulse energy of PIV lasers has essentially remained the same during these years. The same can be said for the seeding techniques, which are still based on fog generators or Laskin nozzles for large-scale wind tunnels.
On the other side, the increased need to investigate turbulent flows around complex engineering systems
within the aerospace, automotive, and wind energy sectors requires the development of large-scale volumetric
17th International Symposium on Applications of Laser Techniques to Fluid Mechanics Lisbon, Portugal, 07-10 July, 2014
- 2 -
flow measurement. The immediate application of a large-scale volumetric flow measurement system ranges from characterization of the flow around aircraft models (Carmer et al. 2008), helicopter blades (Kindler et al. 2011; De Gregorio et al. 2012), propellers (Ragni et al. 2012), wind turbines (Zhang et al. 2012), and also urban elements and complex terrains in wind tunnels (Reynolds and Castro 2008).
The initial tomo-PIV experiment of Elsinga et al. (2006) was conducted over a volume of 37×36×8 mm3, which is equivalent to 13 cm3. Later tomo-PIV experiments in air conducted by Schröder et al. (2009), Humble et al. (2009), Violato et al. (2011) and Ghaemi and Scarano (2011) were also limited to volumes smaller than 20 cm3. Slightly larger measurement volumes have been applied by Schröder et al. (2011) and Atkinson et al. (2011); nevertheless they did not exceed 52 cm3. The major challenge facing large-scale tomo-PIV measurement is the issue of providing enough illumination over a large volume to record the scattered light of the minute tracer particles.
The imaging of the tracer particles in a tomo-PIV experiment is conducted at an illumination intensity, which is typically an order of magnitude smaller than that of a planar PIV due to the expansion of the laser beam over a large cross-section. The problem is further intensified due to small aperture (high f-number) settings of the imaging system ensuring focused particles across the measurement depth. As a result, the signal to noise ratio of the tracer particles, which are typically droplets of about 1µm in diameter for experiments in air, can be significantly small. This problem has been addressed for conventional tomo-PIV experiments by applying high power lasers or multi-pass light amplification system (Ghaemi and Scarano, 2010), but its extension to volumes approaching the cubic meter requires further exploration of alternative solutions.
A possible solution to image the tracer particles in a large domain is to apply larger tracer particles instead of increasing the illumination intensity. However, the tracer particles should be light enough to ensure their fidelity to the flow motions. This requirement has suggested the helium filled soap bubbles (HFSB) as a viable solution due to their potential towards neutral buoyancy and their large diameter in the order of one millimetre. Moreover, a stronger scattering from the tracer particles is also advantageous for measurements in the vicinity of solid surfaces where high illumination intensity is undesirable due to light reflections from solid objects.
In the past few decades, the HFSB tracers have been applied for visualization of different aerodynamic flows such as the flow around a parachute (Pounder 1956, Klimas 1973), separated flow around an airfoil (Hale et al. 1971a), wing-tip vortices (Hale et al. 1971b) and jet flows (Ferrel et al. 1985). The low concentration of the HFSB along with their large diameter makes them ideal for visualization of the pathline of individual fluid elements within complex flows. This technique is different from the visualization of large-scale flow patterns using high concentrations of micrometer size smoke particles in which the flow patterns are identified from the smoke patterns (Hale et al. 1971b). Although the HFSB visualization has been extended to transonic regime and the bubbles have been observed to persist up to Mach 0.9 (Iwan et al. 1973), they have been mostly applied for qualitative visualization due to uncertainties in their aerodynamic performance.
The aerodynamic performance of the HFSBs in tracing the flow field has been thoroughly investigated by Kerho and Bragg (1994) at the stagnation region of a NACA 0012 airfoil. Their experiments reported a deviation of the HFSB trajectories from the theoretical streamlines due to non neutrally buoyant tracers. This was mostly due to the use of a cyclone device used to reject the heavier bubbles. As a result, the average weight of the tracers was biased towards lighter-than-air bubbles. They concluded that “the use of bubbles generated by the commercially available system to trace flow patterns should be limited to qualitative measurements unless care is taken to ensure neutral buoyancy”. As a result, the HFSBs have mostly been quantitatively used only in measurements of convective flows at low velocities (typically less than 1 m/s). Müller et al. (2000) conducted planar PIV measurement over a field-of-view of 2×2.5 m2 inside an aircraft cabin using HFSB of approximately 2 mm in diameter. Sun & Zhang (2003) developed three dimensional particle streak velocimetry techniques tracing the HFSBs which were used later by Sun et al. (2005) to conduct large-scale flow measurement within a mock-up aircraft cabin. Bosbach et al. (2009) conducted a large-scale planar PIV experiment with a field-of-view up to 7 m2 using HFSB to investigate the convective flow within full-scale aircraft cabin. More recently, Kühn et al. (2011) evaluated the feasibility of large-scale tomo-PIV measurement of the flow field in a convection cell of 750 mm × 450 mm × 165 mm using HFSB. These studies demonstrate the feasibility of conducting large-scale tomo-PIV measurement using HFSB. However, the reliable extension of the technique
17th International Symposium on Applications of Laser Techniques to Fluid Mechanics Lisbon, Portugal, 07-10 July, 2014
- 3 -
towards aerodynamic studies in wind tunnels is hampered by the lack of a detailed evaluation of their tracing fidelity.
The current investigation aims at characterization of the temporal response of the HFSB tracers from experiments in the aerodynamic regime. The evaluation is conducted in a similar way as that of Kerho and Bragg (1994), measuring the bubbles velocity around the stagnation region of a cylinder. Additionally, a reference velocity field is obtained in the same experiment with PIV measurements, where micron-sized droplets are used. The size and shape of HFSB generated at different ratios of soap and helium flow rate into the nozzle and their aerodynamic performance is also investigated. Finally, a tomo-PIV experiment is conducted to demonstrate the feasibility of employing HFSB as tracers for large-scale tomographic PIV measurements in wind tunnels.
2. Experimental assessment of HFSB Experiments are conducted in a low-speed open section open-return-loop wind tunnel (W-Tunnel) of the
Aerodynamic Laboratories of the Aerospace Engineering Department at TU Delft. The flow around the front stagnation region of a circular cylinder is considered as it can be easily reproduced and it features a rather steady behaviour. The cylinder diameter represents in this case the reference length scale for non-dimensional analysis. The tracers velocity is compared to that of micron sized droplets from a fog machine, conventionally used for PIV experiments in air flows. The velocity of tracers is measured both in high image number density regime by spatial cross-correlation, as well as in low density regime by particle tracking velocimetry (PTV), where the trajectory of individual particles is measured.
2.1. Wind tunnel and model
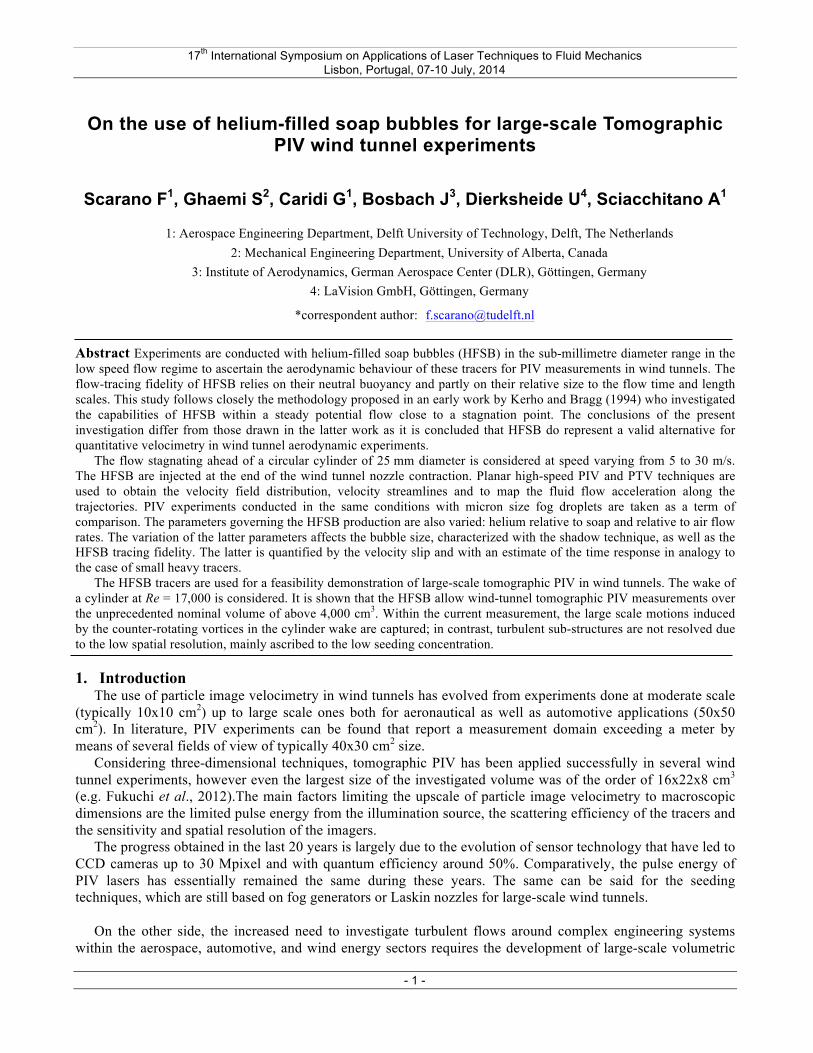
The wind tunnel features a contraction ratio of 8:1 followed by 1.4 m long rectangular channel. The exit cross section is 0.4×0.4 m2. A smooth cylinder with diameter D = 25 mm is installed in the mid-section at the exit of the wind tunnel. Experiments are conducted at free-stream velocity U∞ ranging from 5 to 30 m/s.
Fig. 1 Schematic arrangement of the experiment: wind tunnel channel and exit; HFSB injection; cylinder model;
illumination, imaging and measurement region.
2.2. HFSB tracers
The system that generates helium filled soap bubbles is developed at the German Aerospace Center DLR and has been used in a considerable number of large scale PIV experiments in buoyant flows. A brief description is given here and the reader is referred to the more detailed discussion given by Bosbach et al. (2009). The
17th International Symposium on Applications of Laser Techniques to Fluid Mechanics Lisbon, Portugal, 07-10 July, 2014
- 4 -
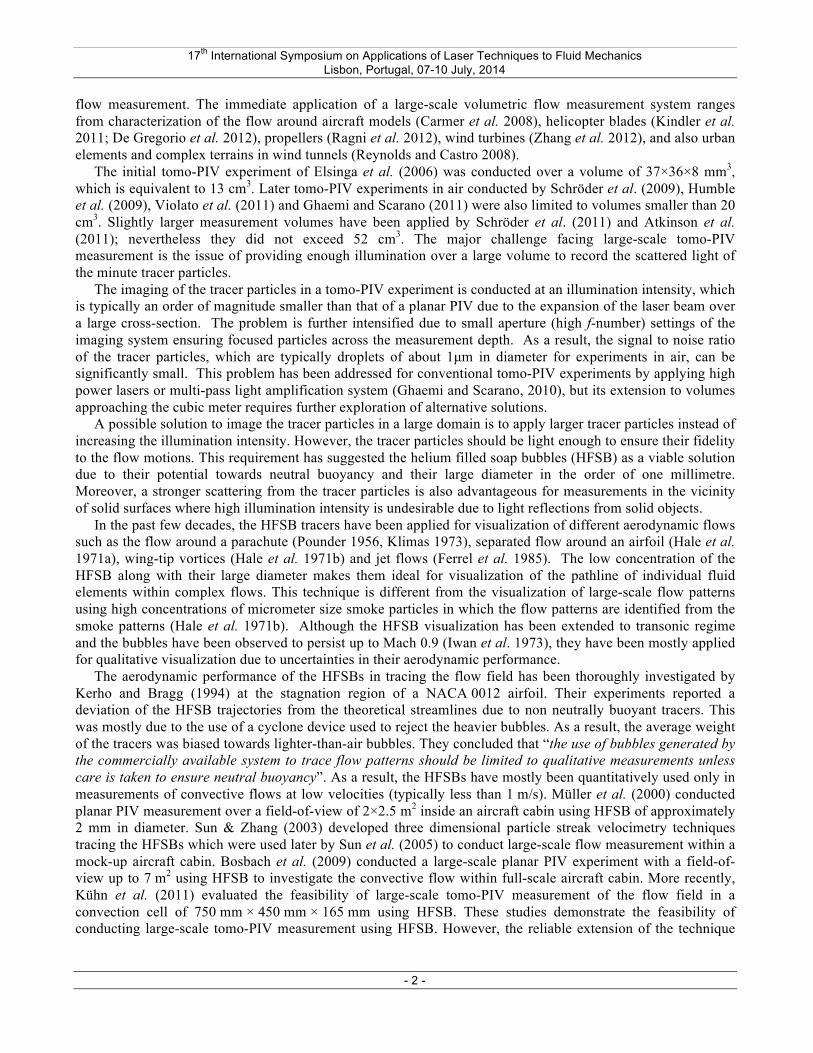
working principle of bubbles generation is based on coaxial channels terminating with a small circular orifice. Its characteristic dimensions are illustrated in Fig. 2. The inner diameter of the bubble fluid solution (BFS) tube, d is 1.6 mm, the orifice diameter is D = 1 mm, and the cap has a thickness t = 1 mm. In order to ensure a stable operation, the distance between orifice and the end of the coaxial tubes can be adjusted by a thread in the nozzle cap, set approximately to h = 1 mm.
The BFS is a commercially available mixture of water, glycerine and soap and its flow is driven by pressurized air vessel with a standpipe. Stable operational conditions were achieved by controlling the BFS, air and helium flow using digital thermal-mass flow controllers. The flow is supplied through polyamide tubes with an inner diameter of 2 mm and a length of 8 m. Most experiments are conducted at a flow rate of 70 litres per minute for the air, while soap and helium flow rates were varied as reported in Table 1.
Table 1 Volume flow rates for HFSB production during experiments
!BFS [ml/h] 4 4 4 4 5 5 5 5
!He [l/h] 3 4 5 6 3 4 5 6
Fig. 2 Schematic overview of the nozzle used for HFSB generation. Illustration reproduced from Bosbach et al., 2009.
2.3. Velocity measurement
The velocity field around the front stagnation region of the cylinder is characterized using PIV. Liquid droplets of approximately 1 µm diameter generated using a smoke generator (SAFEX Twin Fog) provide a reference velocity field. These tracers are commonly used for PIV in air at low subsonic velocities and follow accurately the velocity fluctuations due to their short response time of about 2 µs (Ragni et al., 2011). A Quantronix Darwin-Duo Nd:YLF laser delivers double pulses at a rate of 3kHz with pulse energy of approximately 13 mJ. The beam is shaped into a light sheet of approximately 2 mm thickness. The imaging system consists of a Photron Fast CAM SA1 camera (CMOS, 1,024 × 1,024 pixels, 12-bit, pixel dimension 20 µm). The camera is equipped with a 105 mm Nikkor objective at aperture setting of f/5.6 and the imaging magnification is M = 0.54. Sequences up to 5000 double frame images were acquired with time separation of Δt = 25 µs (for a free stream velocity of 30 m/s) at acquisition frequency of 500 Hz. The image cross-correlation process is carried out within LaVision Davis 8.1.4 with initial window size of 64 × 64 pixels whereas the final window size is 32 × 32 pixels. An overlap factor of 75% is applied between adjacent interrogation windows yielding vectors with a pitch of approximately 300 µm. The same procedure is applied to obtain the average velocity field of the HFSB tracers. However, due to the much lower number density of the HFSB tracers in the individual images, the cross-correlation analysis is applied to a single image pair obtained as the maximum intensity of each pixel from a sequence of 5000 recordings.
Furthermore, high-speed measurements at a rate of 20 kHz were performed to enable a specific analysis on the trajectory of individual HFSB tracers by PTV.
The latter analysis is made with a MATLAB script. Particle peak detection is based on local maximum, the pairing makes use of a velocity predictor from the PIV results on the fog droplets. The multi-point trajectory is regularized with a Least-Squares regression of a 3rd order polynomial based upon a kernel of 7 exposures. It is worth noting that every bubble produces a pair of intensity peaks, known as glare spots (van de Hulst and Wang,

17th International Symposium on Applications of Laser Techniques to Fluid Mechanics Lisbon, Portugal, 07-10 July, 2014
- 5 -
1991) oriented approximately along the vertical direction (see Fig. 3-left). These points are due to the first reflection of laser light on the outer surface of the bubble and the second reflection on the outer surface. Given the present illumination and imaging geometry, the distance between the glare points DG indicates also the bubble diameter DB ≈ √2×DG. The presence of the glare points poses an additional problem for the cross-correlation analysis, as the correlation map will also feature two peaks corresponding to the autocorrelation of the glare points. This is taken into account by ignoring the regions of the correlation map affected by the glare points autocorrelation. Similarly, the PTV analysis is made with the additional control that no confusion is made in pairing the lower glare point with the higher one between subsequent exposures. In the low image density regime this procedure is applied in a robust way as particle images never overlap with each other. The tracking of particles is done with sub-pixel precision using a Gaussian peak fit as commonly done in PIV. Finally, the centre of the bubble is assumed to be in the middle position between the two glare points.
Fig. 3 – Left: glare points from a single image of HFSB. Right: superimposed exposures of HFSB tracers.
2.4. Aerodynamic behaviour of HFSB
Given the tracers size and the operating velocities, the Reynolds number related to the bubble diameter is in the order of magnitude between 1 and 10. As a result, the forces acting on the bubble originate from a combination of aerodynamic effects. For small tracers the operating Reynolds is well below unity, indicating that the interactions with the surrounding fluid pertain to the Stokes regime. As a result, the behaviour of the tracers can be reduced to a single time constant τ, referred to as the relaxation time. For small, heavy particles the relaxation time depends upon the square of the diameter and the difference in density to the fluid (Melling, 1997). However, from dimensional considerations, the relaxation time can also be estimated as the ratio between the slip velocity (i.e. the local difference between the tracer velocity and the immediately surrounding fluid) and the local acceleration. In the present case, the analysis of the aerodynamic behaviour of the HFSB tracers will lead to the determination of such characteristic time, with the caveat that it cannot be interpreted as a constant as in the case of micron sized tracers. The definition of the relaxation time reads as:
! =!!"#$ − !!"#
!!
Where UHFSB and Uair represent the streamwise velocity component of the tracer and the surrounding air respectively. On the denominator, ax is the acceleration of the tracer along its trajectory. Most experiments are
Glare-points from single HFSB tracer
Cylinder
Cylinder
Shadow
17th International Symposium on Applications of Laser Techniques to Fluid Mechanics Lisbon, Portugal, 07-10 July, 2014
- 6 -
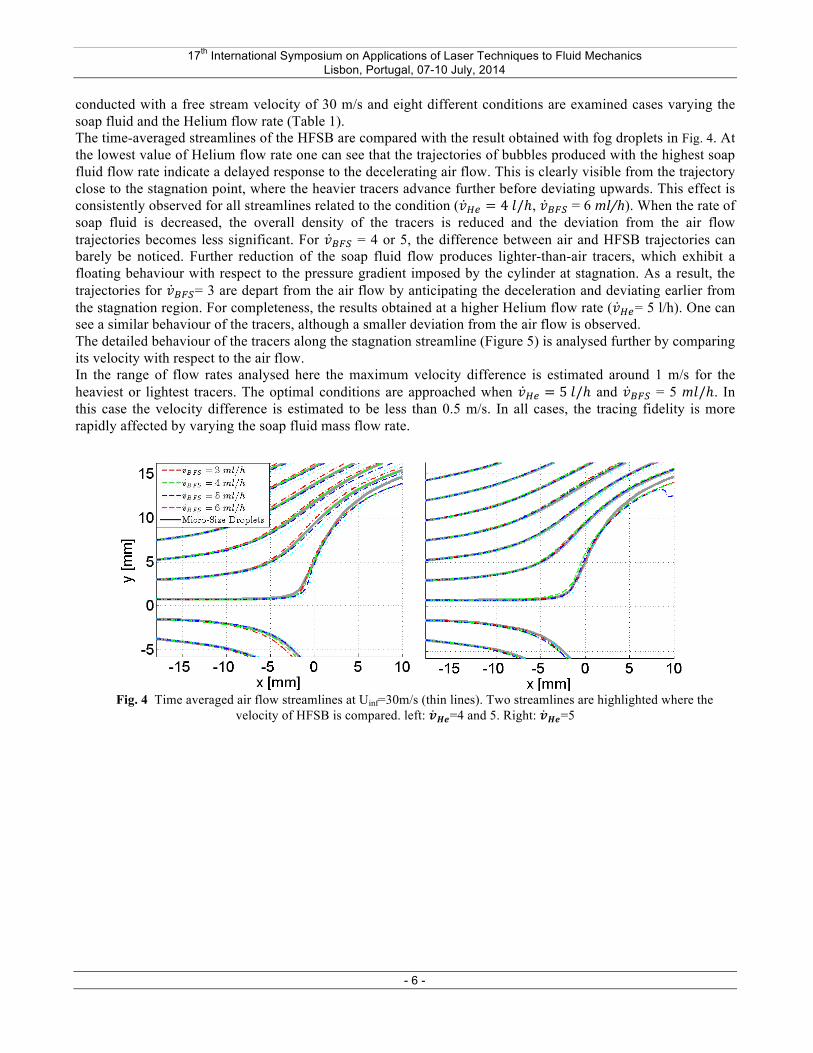
conducted with a free stream velocity of 30 m/s and eight different conditions are examined cases varying the soap fluid and the Helium flow rate (Table 1). The time-averaged streamlines of the HFSB are compared with the result obtained with fog droplets in Fig. 4. At the lowest value of Helium flow rate one can see that the trajectories of bubbles produced with the highest soap fluid flow rate indicate a delayed response to the decelerating air flow. This is clearly visible from the trajectory close to the stagnation point, where the heavier tracers advance further before deviating upwards. This effect is consistently observed for all streamlines related to the condition (!!" = 4 !/ℎ, !!"# = 6 ml/h). When the rate of soap fluid is decreased, the overall density of the tracers is reduced and the deviation from the air flow trajectories becomes less significant. For !!"# = 4 or 5, the difference between air and HFSB trajectories can barely be noticed. Further reduction of the soap fluid flow produces lighter-than-air tracers, which exhibit a floating behaviour with respect to the pressure gradient imposed by the cylinder at stagnation. As a result, the trajectories for !!"#= 3 are depart from the air flow by anticipating the deceleration and deviating earlier from the stagnation region. For completeness, the results obtained at a higher Helium flow rate (!!"= 5 l/h). One can see a similar behaviour of the tracers, although a smaller deviation from the air flow is observed. The detailed behaviour of the tracers along the stagnation streamline (Figure 5) is analysed further by comparing its velocity with respect to the air flow. In the range of flow rates analysed here the maximum velocity difference is estimated around 1 m/s for the heaviest or lightest tracers. The optimal conditions are approached when !!" = 5 !/ℎ and !!"# = 5 m!/ℎ. In this case the velocity difference is estimated to be less than 0.5 m/s. In all cases, the tracing fidelity is more rapidly affected by varying the soap fluid mass flow rate.
Fig. 4 Time averaged air flow streamlines at Uinf=30m/s (thin lines). Two streamlines are highlighted where the
velocity of HFSB is compared. left: !!"=4 and 5. Right: !!"=5

17th International Symposium on Applications of Laser Techniques to Fluid Mechanics Lisbon, Portugal, 07-10 July, 2014
- 7 -
Fig. 5 Comparison of HFSB velocity along the stagnation streamline. Results are shown for different values of the Helium flow, soap fluid flow (left) and for the case of Nitrogen filled bubbles (right).
A Lagrangian approach is followed to determine the local velocity of HFSB. The slip velocity, between the HFSB tracers and the air flow UHFSB–Uair. The position of the tracers is determined within a time series of recordings acquired at 2kHz. The typical displacement of the tracers when they enter the measurement region is approximately 20 pixels. The position of the tracer is estimated with sub-pixel accuracy using a Gaussian fit. The properties of the trajectory (position, velocity and acceleration) are estimated with a 3rd order polynomial Least Square fitting of the measured position, based on a kernel of 7 exposures. The analysis is conducted in a confined region 3mm high around the stagnation streamline. Negative values of the mean slip velocity in Table 2 correspond to lighter-than-air bubbles, where a lower flow rate of BFS is used. Instead, a positive slip velocity characterizes the heavier bubbles. The fluctuation is estimated considering different bubbles. Considering that the experiments were conducted at 30 m/s, the mean value of slip velocity for optimal tracers is fairly below 1%, which indicates their potential use in wind tunnel experiments.
The relatively large values of the fluctuation can be ascribed to two effects. The first is the different value of the slip velocity at varying positions in the domain. Moreover, as reported by Bosbach et al. (2009) the generation process of the bubbles is affected by a variance in the diameter of 20%, for the same type of nozzle, in turn affecting the buoyancy of HFSB.
The above measurements also yield the particles acceleration, which is reported in Fig. 6 for different values of the soap fluid flow rate. The acceleration of HFSB closely follows the trend of the reference PIV data obtained with fog droplets. The lighter bubbles appear to anticipate the effect of stagnation, whereas for the heavier bubbles the delay is not evident.
Table 2 - Slip Velocity expressed by the mean value and standard deviation for !!" = 4 !/ℎ and different bubble fluid solution (BFS) flow rate at free-stream velocity of 30 m/s.
!!"# Mean Uslip STD USlip [ml/h] [m/s] [m/s]
3 -0.37 0.71 4 -0.14 0.73 5 0.13 0.91 6 0.51 0.82

17th International Symposium on Applications of Laser Techniques to Fluid Mechanics Lisbon, Portugal, 07-10 July, 2014
- 8 -
Fig. 6 Acceleration of HFSB (labels) and of the airflow (solid black line) along the stagnation streamline at free-stream
velocity of 30 m/s and !!" = 4 !/ℎ.
The ratio between the local slip velocity and the acceleration returns a characteristic time scale that may be associated with the relaxation time of the tracer τ. Table 3 summarizes the results, with minimum values of τ in small excess of 10 microseconds. An estimate of the flow time scale τflow for the present experiment, is given by the ratio between the cylinder diameter and the velocity. For a free-stream velocity of 30 m/s, τflow = 0.7 ms, which is two orders of magnitude above the tracers characteristic time.
Table 3 HFSB tracing governing parameters, slip velocity, acceleration and characteristic response time. !!"# Mean Uslip Acceleration τ
[ml/h] [m/s] [m/s2] [µs] 3 -0.37 -1.2x10⁴ 31
4 -0.14 -1.2x10⁴ 12
5 0.13 -1.2x10⁴ 11
6 0.51 -1.2x10⁴ 42
3. Large-scale tomographic PIV experiment The HFSB tracers are used for a feasibility demonstration of large-scale tomographic PIV in wind tunnels.
The apparatus used is based on that used for the previous experiments. However, a number of notable differences need to be discussed.
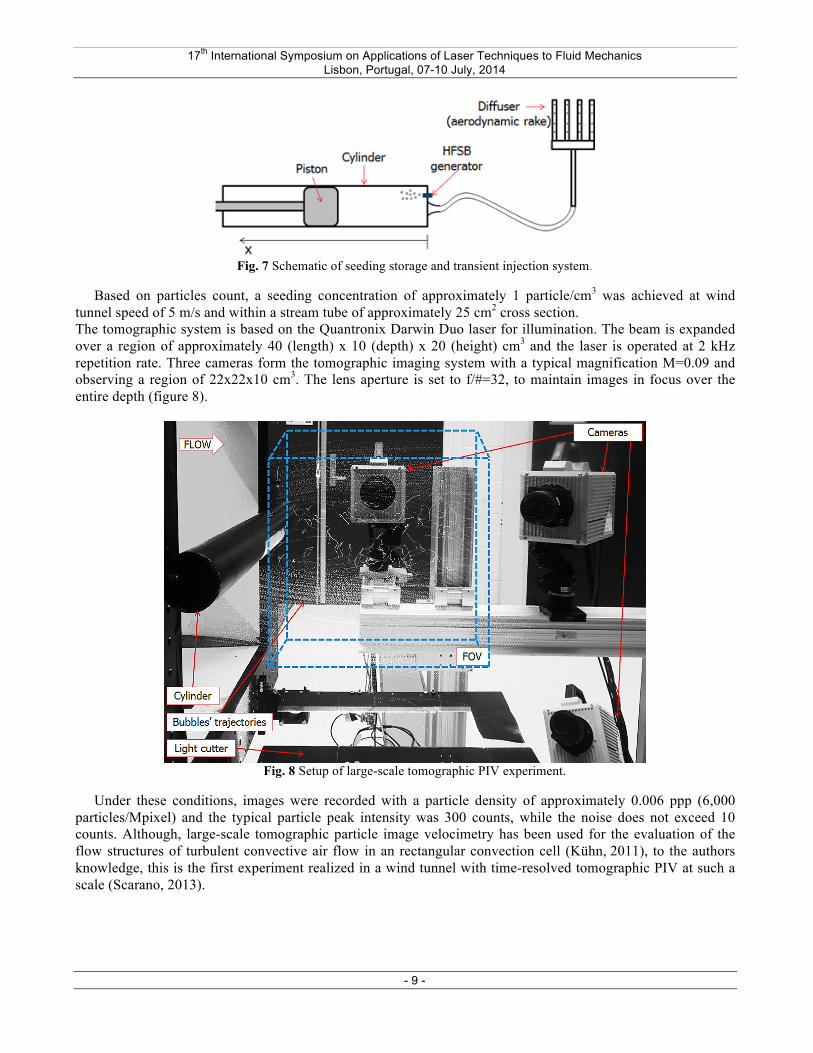
The cylinder has a diameter of 4.5 cm and is placed horizontally at the wind tunnel exit. A dedicated seeding system is realized that increases the rate of particles injected in the stream of several orders of magnitude. The system, shown in Fig. 7, is based on a large cylindrical reservoir where the HFSB are stored temporarily before being ejected by the motion of a piston. The stream with air and bubbles is transported into the settling chamber where a diffuser distributes the tracers within a confined part of the whole stream.
17th International Symposium on Applications of Laser Techniques to Fluid Mechanics Lisbon, Portugal, 07-10 July, 2014
- 9 -
Fig. 7 Schematic of seeding storage and transient injection system.
Based on particles count, a seeding concentration of approximately 1 particle/cm3 was achieved at wind tunnel speed of 5 m/s and within a stream tube of approximately 25 cm2 cross section. The tomographic system is based on the Quantronix Darwin Duo laser for illumination. The beam is expanded over a region of approximately 40 (length) x 10 (depth) x 20 (height) cm3 and the laser is operated at 2 kHz repetition rate. Three cameras form the tomographic imaging system with a typical magnification M=0.09 and observing a region of 22x22x10 cm3. The lens aperture is set to f/#=32, to maintain images in focus over the entire depth (figure 8).
Fig. 8 Setup of large-scale tomographic PIV experiment.
Under these conditions, images were recorded with a particle density of approximately 0.006 ppp (6,000 particles/Mpixel) and the typical particle peak intensity was 300 counts, while the noise does not exceed 10 counts. Although, large-scale tomographic particle image velocimetry has been used for the evaluation of the flow structures of turbulent convective air flow in an rectangular convection cell (Kühn, 2011), to the authors knowledge, this is the first experiment realized in a wind tunnel with time-resolved tomographic PIV at such a scale (Scarano, 2013).
17th International Symposium on Applications of Laser Techniques to Fluid Mechanics Lisbon, Portugal, 07-10 July, 2014
- 10 -
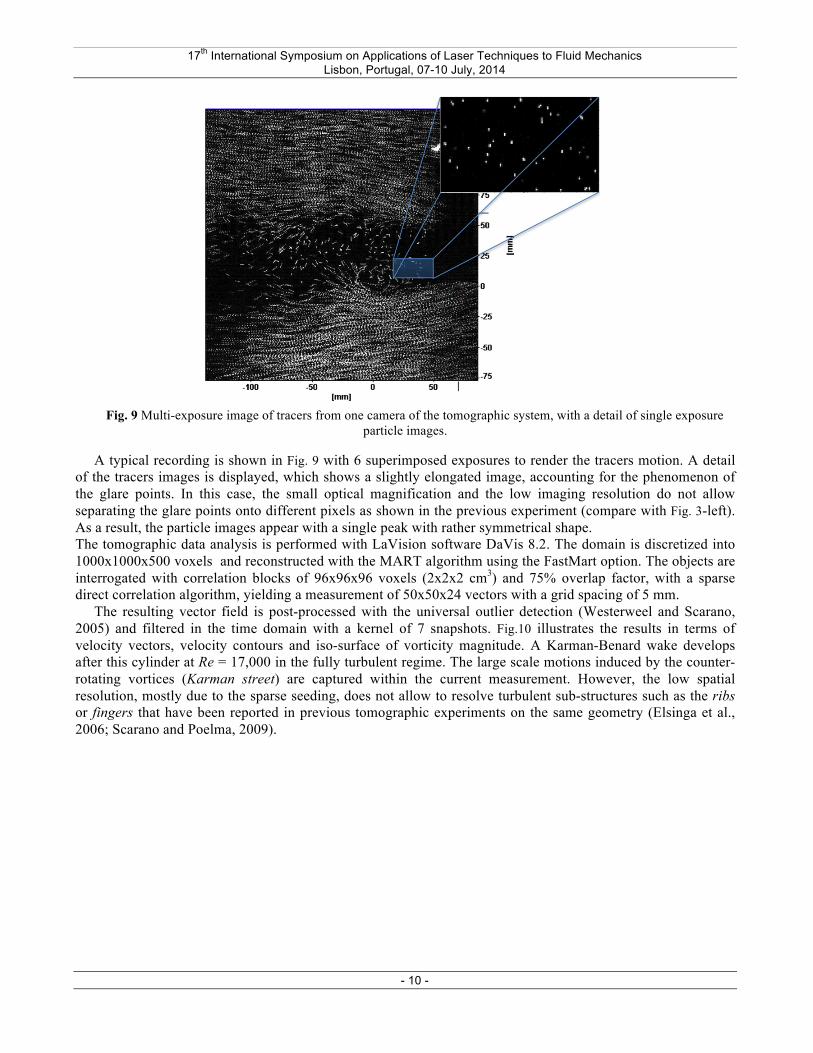
Fig. 9 Multi-exposure image of tracers from one camera of the tomographic system, with a detail of single exposure
particle images.
A typical recording is shown in Fig. 9 with 6 superimposed exposures to render the tracers motion. A detail of the tracers images is displayed, which shows a slightly elongated image, accounting for the phenomenon of the glare points. In this case, the small optical magnification and the low imaging resolution do not allow separating the glare points onto different pixels as shown in the previous experiment (compare with Fig. 3-left). As a result, the particle images appear with a single peak with rather symmetrical shape. The tomographic data analysis is performed with LaVision software DaVis 8.2. The domain is discretized into 1000x1000x500 voxels and reconstructed with the MART algorithm using the FastMart option. The objects are interrogated with correlation blocks of 96x96x96 voxels (2x2x2 cm3) and 75% overlap factor, with a sparse direct correlation algorithm, yielding a measurement of 50x50x24 vectors with a grid spacing of 5 mm.
The resulting vector field is post-processed with the universal outlier detection (Westerweel and Scarano, 2005) and filtered in the time domain with a kernel of 7 snapshots. Fig.10 illustrates the results in terms of velocity vectors, velocity contours and iso-surface of vorticity magnitude. A Karman-Benard wake develops after this cylinder at Re = 17,000 in the fully turbulent regime. The large scale motions induced by the counter-rotating vortices (Karman street) are captured within the current measurement. However, the low spatial resolution, mostly due to the sparse seeding, does not allow to resolve turbulent sub-structures such as the ribs or fingers that have been reported in previous tomographic experiments on the same geometry (Elsinga et al., 2006; Scarano and Poelma, 2009).

17th International Symposium on Applications of Laser Techniques to Fluid Mechanics Lisbon, Portugal, 07-10 July, 2014
- 11 -
Fig.10 Time-resolved sequence of the instantaneous velocity and vorticity distribution in the wake of the cylinder a) t =
0 ms; b) t = 25 ms; c) t = 50 ms; d) t = 75 ms.
4. Conclusions Experiments conducted in an aerodynamic wind tunnel have determined the tracing fidelity of HFSB in a
potential flow up to a speed of 30 m/s. Varying the mass flow rate of the bubbles components it was determined that an optimum can be achieved where the tracers exhibit minimum slip velocity. In these conditions the estimated characteristic time scale for the response to velocity fluctuations is in the range of 10 µs, which opens good perspectives for the use of these tracers in wind tunnel experiments. In contrast with the study conducted by Kerho and Bragg (1994) the current work concludes positively on the use of HFSB for quantitative studies of aerodynamic flows. One of the main difference with respect to the above authors is that HFSB of approximately one order of magnitude smaller size have been used for the current study and no pre-filtering of negatively buoyant particles was applied. A seeding accumulator and transient injector system was developed to significantly increase the particle concentration in the wind tunnel stream with the purpose to realize a large scale tomographic PIV experiment. The velocity field in a volume up to 4,000 cm3 was realized at a measurement rate of 2kHz, which is unprecedented for wind tunnel experiments. Although tomographic PIV could be performed with spatial cross-correlation analysis, the low spatial resolution due to the low concentration of tracers could only yield the large-
17th International Symposium on Applications of Laser Techniques to Fluid Mechanics Lisbon, Portugal, 07-10 July, 2014
- 12 -
scale flow features of the cylinder wake. Further developments are aiming at increasing the HFSB production rate, as well as the controlled confinement of the seeded streamtube.
References
Atkinson C, Coudert S, Foucaunt J M, Stanislas M, & Soria, J (2011). Tomographic particle image velocimetry measurement of a high Reynolds number turbulent boundary layer. In Progress in Wall Turbulence: Understanding and modelling. (pp 113-120). Springer Netherlands
Bosbach J, Kühn M, Wagner C (2009), Large scale particle image velocimetry with helium filled soap bubbles, Exp. Fluids 46: 539-547
Carmer CFV, Konrath R, Schröder A, Monnier JC (2008) Identification of vortex pairs in aircraft wakes from sectional velocity data, Exp. Fluids 44: 367-380
De Gregorio F, Pengel K, Kindler K (2012) A comprehensive PIV measurement campaign on a fully equipped helicopter model, Exp. Fluids 53: 37-49
Elsinga GE, Scarano F, Wieneke B, Van Oudheusden BW (2006), Tomographic particle image velocimetry, Exp. Fluids 41: 933-947
Ferrell, GB, Aoki K, Lilley DG (1985), Flow visualization of lateral jet injection into swirling crossflow. In AIAA 23rd Aerospace Sciences Meeting, 14-17
Fukuchi Y, (2012) Influence of number of cameras and preprocessing for thick volume Tomographic PIV. 16th Int. Symp. on Applications of Laser Techniques to Fluid Mechanics, Lisbon, Portugal
Ghaemi S, & Scarano F (2010). Multi-pass light amplification for tomographc particle image velocimetry application, Meas. Sci. Technol. 21(12), 127002
Ghaemi S, Scarano F (2011), Counter-hairpin vortices in the turbulent wake of a sharp trailing edge, J. Fluid Mech. 689: 317-356
Hale RW, Tan P, Ordway DE (1971a), Experimental investigation of several neutrally-buoyant bubble generators for aerodynamic flow visualization, Naval Research Reviews 24, 19-24
Hale RW, Tan P, Stowell RC, Ordway DE (1971b), Development of an integrated system for flow visualization in air using neutrally-buoyant bubbles, SAI-RR 7107, SAGE ACTION, Inc., Ithaca, NY
Humble RA, Elsinga GE, Scarano F, Van Oudheusden BW (2009), Three-dimensional instantaneous structure of a shock wave/turbulent boundary layer interaction, J. Fluid Mech. 622: 33-62
Iwan, LS, Hale RW, Tan P, Stowell RC (1973), Transonic flow visualization with neutrally-buoyant bubbles, SAI-RR 7304, Ithaca, New York
Kerho MF, Bragg MB (1994), Neutrally buoyant bubbles used as flow tracers in air, Exp. Fluids 16: 393-400
Kindler K, Mulleners K, Richard H, van der Wall B G, Raffel M. (2011) Aperiodicity in the near field of full scale rotor blade tip vortex, Exp. Fluids 50(6): 1601-1610.
Klimas P (1973), Helium bubble survey of an opening parachute flowfield, J of Aircraft 10, 567-569
Kühn M, Ehrenfried K, Bosbach J, Wagner C (2011), Large-scale tomographic particle image velocimetry using helium-filled soap bubbles, Exp. Fluids 50: 929-948
Melling A (1997), Tracer particles and seeding for particle image velocimetry, Meas. Sci. Technol. 8: 1406
Müller RHG, Flögel H, Scherer T, Schaumann O, Markwart M (2000), Investigation of large scale low speed air conditioning flow using PIV, 9th Int Symp on Flow Visualization, Edinburgh, UK
Pounder E, (1956). Parachute inflation process Wind-Tunnel Study. WADC Technical report 56-391, Equipment Laboratory, Wright-Patterson Air Force Base, Ohio, pp 17-18
17th International Symposium on Applications of Laser Techniques to Fluid Mechanics Lisbon, Portugal, 07-10 July, 2014
- 13 -
Ragni D, Schrijer F, van Oudheusden BW and Scarano F (2011), Particle tracer response across shock measured by PIV, Exp. Fluids 50:53-64
Ragni D, van Oudheusden BW, Scarano F (2012) 3D pressure imaging of an aircraft propeller blade-tip flow by phase-locked stereoscopic PIV, Exp. Fluids 52: 463-477
Reynolds RT, Castro IP (2008), Measurements in an urban-type boundary layer, Exp. Fluids 45: 141-156
Scarano F (2013), Tomographic PIV: principles and practice, Meas. Sci. Technol. 24: 012001
Scarano F, Poelma C (2009) Three-dimensional vorticity patterns of cylinder wakes, Exp. Fluids 47: 69-83
Schröder A, Geisler R, Sieverling A, Wieneke B, Henning A,, Scarano F, Elsinga GE, Poelma C (2009). Lagrangian aspects of choerent structures in a turbulent boundary layer flow using TR-Tomo PIV and FTV. In Proceeding of 7th international symposium on particle image velocimetry, Melburne, Victoria, Australia, 25-28 Aug
Schröder A, Geisler R, Staack K, Elsinga GE, Scarano F, Wieneke B, Westerweel J (2011) Eulerian and Lagrangian views of a turbulent boundary layer flow using time-resolved tomographic PIV, Exp. Fluids 50, 1071-1091
Sun Y, Zhang Y (2003), Development of a stereoscopic particle image velocimetry system for full-scale room airflow studies, Part 2: experimental setup. ASHRAE 2003, annual meeting, Kansas City, USA, paper KC-03-4-4, 9-12
Sun Y, Zhang Y, Wang A, Topmiller JL, Bennet JS (2005), Experimental Characterization of Airflows in Aircraft Cabins, Part I: Experimental System and Measurement Procedure. ASHRAE transactions, 111
Van de Hulst HC, Wang RT (1991), Glare points, Appl. Opt. 30: 4755-4763
Violato D, Moore P, Scarano F (2011), Lagrangian and Eulerian pressure field evaluation of rod-airfoil flow from time-resolved tomographic PIV, Exp. Fluids 50: 1057-1070
Westerweel J, Scarano F (2005), Universal outlier detection for PIV data, Exp. Fluids 39:1096-1100
Zhang W, Markfort CD & Porté-Angel F (2012) Near-wake flow structure downwind of a wind turbine in a turbulent boundary layer, Exp. Fluids 52(5): 1219-1235