Embed Size (px)
Citation preview

Vol.:(0123456789)
Bulletin of Earthquake Engineering (2020) 18:2723–2757https://doi.org/10.1007/s10518-020-00797-0
1 3
ORIGINAL RESEARCH
On the seismic fragility of pipe rack—piping systems considering soil–structure interaction
Luigi Di Sarno1,2 · George Karagiannakis1
Received: 24 May 2019 / Accepted: 29 January 2020 / Published online: 10 February 2020 © The Author(s) 2020
AbstractPiping systems constitute the most vulnerable component in down- and mid-stream facili-ties posing immediate threat to human lives, communities financial robustness and environ-ment. Pipe racks present several mechanical and geometrical idiosyncrasies compared to common buildings and the seismic response is governed by the pipework layout. Important design requirements e.g. dynamic interaction between pipelines and supporting structure are commonly overlooked during pipe racks design process and uncertainties relevant to modelling of soil or seismic input are not quantified. In the present work, after review-ing the technical literature and codes, a 3D RC rack was used as a testbed and analysed as coupled and decoupled with a non-seismic code conforming piping system accounting for soil–structure interaction. Incremental dynamic analysis was adopted as an assessment methodology for deriving fragility curves considering ground motions in near- and far-field conditions. It was deduced that the modelling (boundary conditions of pipes) was the most considerable uncertainty since it increased the probability of collapse limit state of struc-tural members from 0 to 59%. It was also demonstrated that soil deformability as well as source conditions altered considerably the dispersion of intensity measure conditional on engineering demand parameter of structural and nonstructural members. The results may be another indication that code provisions should be more normative regarding industrial pipe racks.
Keywords Pipe rack · Piping · Dynamic coupling · Seismic input · Soil–structure interaction · Fragility curves
* Luigi Di Sarno [email protected]; [email protected]
George Karagiannakis [email protected]
1 University of Sannio, Piazza Roma, 21, 82100 Benevento, Italy2 University of Liverpool, Liverpool L69 3BX, UK

2724 Bulletin of Earthquake Engineering (2020) 18:2723–2757
1 3
1 Introduction
1.1 Background and motivation
Liquified Natural Gas (LNG) terminals and petrochemical plants constitute strategic life-line facilities, and thus should remain intact during Natural Technological (NaTech) events towards achieving resilience in modern communities. The connection between process plants and the prosperity of nearby communities is highly reciprocal since a loss of con-tainment event due to a failure to nonstructural components or nonbuilding structures may cause loss of human lives and catastrophic repercussions to the plant and environ-ment. Nowadays, the resilience of industrial facilities may not be adequate or in other words the design process followed by industrial engineers may not be up to par against natural hazards e.g. inundation or seismic events due to several uncertainties involved. To this effect, European Union (EN) and other societies have put at the top of their portfolio the risk assessment of these plants against natural hazards accounting also for the increas-ing risk due to climate change (see EN regulation Seveso III 2012 for industrial accidents prevention). The seismic hazard is a highly accountable one in European countries e.g. Italy, Greece and Portugal considering that 28 LNG terminals and several oil refineries are located along European coastline some of which are planned or being expanded and the number is going to increase in the future particularly in the Mediterranean Sea due to the rise of LNG imports as well as future exploitation of natural resources in the region (EN 2018). The location of midstream facilities is a strategic choice towards minimizing the cost for transferring the feedstock gas via pipelines, and thus the construction in a seismic-prone area may be inevitable.
Aside from storage tanks and other process units, process plants include nonbuild-ing structures similar to buildings or Pipe Racks (PRs) that are outfitted by pipelines and other nonbuilding structures in order to process and distribute combustible or toxic materi-als from one unit to another (the equipment is above grade for maintenance, operational and safety reasons, Fig. 1). There are ample key parameters when modelling, designing and assessing a pipe rack—Piping System (PS) that increase considerably the risk due to uncertainties included in; the analysis methodology (static or dynamic), the dynamic
Vertical bracingNonstructural component
Nonbuilding structure similar to buildingNonbuilding structure not similar to building
Fig. 1 Typical configuration of nonstructural components and nonbuilding structures within a process plant ( http://www.pente chglo bal.com/en)

2725Bulletin of Earthquake Engineering (2020) 18:2723–2757
1 3
interaction of nonbuilding structure– nonstructural components [Coupled Case (CC) or Decoupled Case (DC)], the type of pipe elements (stick or refined) and the Boundary Con-ditions (BCs) of pipes, to name just a few. PRs could support a complex system of com-ponents as shown in Fig. 1 that attribute mass, stiffness and geometrical irregularities to the system, causing torsional effects, and thus the use of dynamic analysis methodologies could be more appropriate as recommended by code provisions such as EN 1998-1 (2004) and ASCE/SEI 7-16 (2017).
Earthquake events of the past have shown that PRs may not be the most vulnerable structure themselves, however, the differential movement with the supported equipment may cause material leakage (Krausmann et al. 2010; Paolacci et al. 2012). Furthermore, PSs are placed first in the catalogue of the most vulnerable equipment in process indus-tries with the main contributors being the human/organizational errors, fabrication, instal-lation and layout (FKD 2011; Kidam and Hurme 2013). To minimise the computational cost, many times the seismic risk assessment focuses on components e.g. elbows, T-joints and nonbuilding structures that have been found to be the most critical during earthquake events of the past neglecting the dynamic interaction. In this vein, the seismic response of PRs has not been examined in unison with the supported equipment. Indeed, this is a common practice that is followed even by engineers in the industrial sector who overlook critical design aspects due to the lack of provisions of codes (particularly of EN) and in order to meet the time constraints (Bedair 2015). Therefore, it is essential the design pro-cess to account, if necessary, for the dynamic interaction between the multiply supported nonstructural components and supporting structure considering additional parameters apart from the relative weight ratio that is mostly prescribed in the codes.
Suffice it to say that the soil deformability could be the most decisive design param-eter for the seismic risk mitigation in mid- and down-stream facilities. The soil composi-tion beneath LNG terminals and oil refineries is rather weak and liquefiable since they are located at the seaside, and thus strengthening measures are undertaken. Even though stor-age tanks have been examined mostly with respect to soil deformation in virtue of heavi-ness and large plan area, the seismic response of PRs along with the complex piping when accounting for SSI could be an intriguing research topic since racks may be massive and stiff due to the numerous supported structures and components as well as rigid connec-tions, as shown in Fig. 1 and the following Case Study (CS), and thus it might impact the response on nonstructural components. The 2010 Chile earthquake caused high relevant displacements of pipe rack spread footings in an LPG terminal due to the unimproved soil (marsh) beneath, though, the performance of soil that an adjacent storage tank was rested upon was viewed as a success due to the soil strengthening (Soules et al. 2016a). This is a clear example of liquefaction potential that should also be examined for PRs. The period elongation of PRs could exceed 20% resulting in higher or lower spectrum demand. Non-structural components e.g. pipelines are mostly designed as flexible systems on PRs, and thus the higher displacement demand could sensationally affect the design requirements. The robustness of SSI investigation comes along with the soil modelling. Seismic code provisions do not prescribe nonlinear soil behaviour, however, it is possible near-field soil to experience nonlinearity causing decrease or increase to seismic demand (Raychowdhury and Ray-Chaudhuri 2015; Sáez et al. 2011).
The next type of uncertainty refers to earthquake characterization that appears to be predominant and could supersede other sources e.g. modelling (Kwon and Elnashai 2006). A couple of decades ago, it was very much in vogue to simply separate near- and far-source conditions based upon the Epicentral Distance (ED); nowadays, engineers espouse a more advanced perspective view that considers the impulsive type of records (near-source)

2726 Bulletin of Earthquake Engineering (2020) 18:2723–2757
1 3
especially for structural inelastic response. The interested reader could find more infor-mation in Baltzopoulos et al. (2016), Chioccarelli and Iervolino (2010) and Pacor et al. (2018). All the aforementioned design and modelling challenges for pipe racks are sum-marized and prioritized in Fig. 2.
1.2 Objectives
To the best of Authors’ knowledge, there is no research effort that addresses the seismic fragility of PRs accounting for SSI effects among other uncertainties. To this effect, an analytical study is conducted herein for deriving Fragility Functions (FFs) for structural members and nonstructural components incorporating nonlinear soil deformation. This paper aims at reviewing the technical and non-technical literature, and then estimating the fragility of the system shedding some light on the seismic response variability of struc-tural and nonstructural components by considering uncertainties in the seismic input (near- and far-field), modelling e.g. nonlinear soil deformation and coupling effects, Engineering Demand Parameter (EDP) e.g. shear force and pipe strain as well as Intensity Measure (IM) selection. By virtue of limitations that are discussed in the following, the FFs that are produced might not reflect the exact response of the system.
2 Modelling and analysis of pipe racks
The hostile environmental conditions at coastal sites makes the use of steel a workable solution for corrosion avoidance, though, concrete is used as well to minimize the cost (lower cost of the material and less time consuming compared to the long installation period of steel frames) and the high uncertainty in the welding process. When it comes to LNG terminals in particular, concrete racks may be selected at critical regions to avoid the low fire resistance of steel and high cost of fire protection systems. The answer to the ques-tion whether the response of steel and concrete could be similar given the supported equip-ment is not straightforward. Usually, pinned connections are typically utilized for beams in the longitudinal direction (struts) and shear tabs for the transverse (bent) beams where pipes are supported on. Also, a bracing system is also installed not only for reducing the lateral displacement but also for carrying equipment that might run out of the pipe rack frame (Di Sarno and Karagiannakis 2019). Therefore, steel racks could be stiff but they are not as much heavy as concrete racks, which may lead in different SSI impact. In this
Soil modelling
Pipe modelling
Seismicinput
Soil-stucture interaction
Dynamic couplingAnalysis
methodology
i) Weight ratio, rigidity of connections, relative stiffnessbetween pipe and pipe support
i) Static, spectrum and/or linear/nonlinear dynamicii) Dynamic methods may reveal critical local modes
i) Spring/finite elements and linear/nonlinear dependingon the stratigraphy underneath
i) Stick models with simple/advanced beam elementsii) Shell elements
i) Near- and far-field conditionsii) Vertical component consideration
i) System heaviness, extension and rigidityii) Foundation type
Prior
itaza
tion o
f Acti
ons
Industrial Pipe Rack
Prior
itiza
tion o
f acti
ons
Fig. 2 Summarisation and prioritization of pipe rack modelling and analysis challenges

2727Bulletin of Earthquake Engineering (2020) 18:2723–2757
1 3
section, code provisions and research endeavors regarding the analysis of PRs are exam-ined. The analysis methods of supported components e.g. floor response spectra, relative displacement accommodation or allowable stress are excluded; however, some references are made to the point that are related to the connection with the supporting structure.
2.1 Code provisions
Industrial PRs are also called building-like nonbuilding structures in the codes since they are designed and constructed in a manner similar to buildings, respond to strong ground motion in a fashion similar to buildings and constitute moment, braced or dual systems. Building-like structures may share design parameters and expected behaviour with regard to common building ones but they might have also considerable differences. The main European contribution for seismic-resistant design of structures EN1998-1 (2004) does not make reference to process plant PRs yet to irregular structures only, and thus could be inap-plicable. Even though EN regulations deal with other type of structures included in pro-cess plants such as tanks, silos, towers and pipelines (EN1998-4 2006; EN1998-6 2005), the important design aspects of PRs along with the pipelines are not stipulated. On the other hand, the American (AM) code ASCE/SEI 7-16 (2017) or the petrochemical plant structures guideline ASCE (2011) encompass a few regulations for the design and analysis of PRs. In addition to these codes, there are several other national codes and guidelines that make reference particularly to industrial facilities regarding modelling considera-tions, analysis methods and design parameters e.g. importance factors. More information could be found in (Butenweg and Holtschoppen 2014; Pecker 2014; Soules et al. 2016a, b). Finally, the International Standard ISO/DIS (2013) addresses performance objectives and seismic design analysis specifically for non-structural components.
The analysis methodology determination is not straightforward and relies on the con-sideration of several parameters, viz the vertical and horizontal irregularities, the config-uration of nonbuilding structures e.g. heat exchanger or tower vessels mass, the relative rigidity of beams that should not be confused with the rigid or flexible way of supporting e.g. a PS on a nonbuilding structure, the seismic design category (the last is defined in the AM code as a function of importance class, seismicity and site class) and the fundamental period, T. In contrast with the EN codes, the AM ones specify several analysis method-ologies and give high latitude to the engineer in selecting the most suitable. Petrochemical PRs are usually subjected to vertical irregularities since horizontal ones are defined in the code based upon the differential drift between perimeter points when there is diaphrag-matic behaviour but PRs most commonly have no diaphragms. The vertical irregularity could be due to the inequality of stiffness, strength, geometry and/or weight of adjacent storeys. It is rather usual PRs to be outfitted by nonbuilding structures with significant mass (WP1) among one or multiple storeys leading in the denomination of response by the first mode (Fig. 3a); in this case, the equivalent lateral force analysis method may be applied. Also, it is rather common inconsistencies in stiffness and strength to be found due to the distinct vibration of concentrated masses on upper floors, which cause higher mode effects, as well as geometry e.g. side overhang cantilevers that support nonstructural components running out of the main frame (Fig. 3a, b) in order to attribute flexibility into a PS making the use of dynamic analyses e.g. response spectrum or linear time-history an inevitable choice. Severe concentrated mass e.g. W2 may also cause torsional effects to the entire sys-tem or local modes of weak beams compared to strong columns or braces since there is no diaphragmatic behaviour (Fig. 3b). The code implies that the nonlinear time-history shall

2728 Bulletin of Earthquake Engineering (2020) 18:2723–2757
1 3
be used with caution due to higher uncertainties induced in modelling and interpretation of results.
It is a common industrial practice that engineers analyze supported components and supporting structure separately. This comes from the lack of code provisions that fail to stipulate clearly design requirements for dynamic interaction or the unavailability of analy-sis software. Concerning the seismic design criteria that the AM code stipulates, if the weight of nonbuilding structures not similar to buildings as well as nonstructural compo-nents (the code specifies that the total operating weight of permanent equipment should be considered) WP (WP1 + WP2 + WP3) compared to the one of nonbuilding structure similar to building WS (Fig. 3a) is less than 25% of the effective weight W (Ws + Wp), the decoupled case could be addressed. Of course, this is a very rough rule that relies on the low influence the supported components will have on the system response and intents some nonlinear-ity to be appeared on the nonbuilding structure to avoid resonance phenomena, reduce the Peak Floor Acceleration (PFA) and lessen the interaction. Also, the supporting structure and nonstructural components design parameters e.g. behaviour factor (q-factor) or com-ponent force amplification factor ap are defined separately. Should this not be the case, the
WP1 WP2
WP3
WS, TS
W1
W2
W3
Pipe
Nonbuilding-like structure
Side-overhang cantilever
WP, TP
a b
c
Fig. 3 a Support of a heavy nonbuilding structure on pipe rack, b mass irregularity among storeys and c piping system analysis along with the supporting towers

2729Bulletin of Earthquake Engineering (2020) 18:2723–2757
1 3
dynamic interaction is considered. However, if nonbuilding structure and/or nonstructural components are rigidly attached to the supporting structure (Tp < 0.06 s, the value is esti-mated by considering the flexibility of beams that the components is attached to e.g. the towers in Fig. 3c), they should be analyzed as rigid elements considering only the q-factor of the rack, otherwise both the supporting and nonbuilding structure should be modelled together in a combined model adopting the lesser q-factor between them. All the above-mentioned aspects of PRs modelling and analysis are recapped in Table 1.
2.2 Previous studies
Even though experiences from past earthquakes have shown that pipelines constitute the most vulnerable component being 44% more damage-prone than the runner-up storage tanks and reactors out of 364 industrial accidents (Kidam and Hurme 2013), to-date, it still remains to be examined the dynamic interaction between a supporting structure and a PS towards highlighting the most critical design challenges and preventing accidents in the future. The research is rather limited on this topic since the majority of research has focused on the analysis of critical components individually, whereas research efforts that undertake the dynamic interaction and assess both PR and PS are rather obscure. For instance, Salimi Firoozabad et al. (2015) considered various support excitation analysis techniques for a nuclear plant piping system e.g. single or multiple response spectrum, however, no coupling effects were considered probably in virtue of different nature of nuclear piping. An interesting research upon the effects of dynamic interaction on pipe-way and piping system response by considering different weight ratio, diameters and end-condition of pipes as well as thickness of U-rings (they encircle pipes without restraining the longitudinal direction) was conducted in Azizpour and Hosseini (2009). The governing result of the case-study referred to the significant role the end-conditions and the stiffness of U-bolt rings played in the seismic response. Another study that highlighted the idiosyn-crasy of multiply-supported secondary systems could be found in Chaudhuri and Gupta (2002). The research deduced that the dynamic interaction could be ignored only in those secondary modes which are at least 7 times as stiff as the governing mode of the primary system. The conclusions above emphasize that apart from the weight ratio, the rigidity of connection of multiple-supported components and not only of single-supported nonbuild-ing structures as the ASCE 7 specifies should be taken into consideration. Finally, a fragil-ity analysis was conducted in Salem et al. (2019) on different pipe rack configurations by altering the height, the span length and section dimensions. The fragility affected mostly due to the first two parameters, however, no dynamic interaction was considered in order to demonstrate the performance e.g. of pipes.
3 Soil–structure interaction
The grey areas of knowledge that exists to date not only for the analysis methodologies but also for the soil deformability effects on structural and nonstructural members necessitates the investigation of this topic. Site response analysis towards acquiring a better insight of soil stratigraphy underneath PRs and SSI effects evaluation constitutes logically a sine qua non in the overall design process of oil refinery structures.

2730 Bulletin of Earthquake Engineering (2020) 18:2723–2757
1 3
Tabl
e 1
Mod
ellin
g an
d an
alys
is c
onsi
dera
tions
for p
ipe
rack
s
Des
crip
tion
App
licab
ility
and
/or s
eism
ic re
spon
se
Mat
eria
l and
stru
ctur
al
type
(con
nect
ions
)C
oncr
ete
mod
ular
rack
sFi
re re
sist
ance
Tim
e effi
cien
cy in
the
inst
alla
tion
Lim
itatio
n of
con
nect
ion
unce
rtain
ties
Stee
l mod
ular
rack
sPi
nned
con
nect
ion
in lo
ngitu
dina
l dire
ctio
nSh
ear t
abs/
bent
bea
ms i
n th
e tra
nsve
rse
due
to th
e su
ppor
t of p
ipes
and
oth
er e
quip
men
tB
raci
ng is
ess
entia
l for
the
trans
porta
tion,
lifti
ng a
nd su
ppor
t of p
erm
anen
t and
ope
ratin
g lo
ad-
ing
Mos
t com
mon
opt
ion
for c
orro
sion
avo
idan
ce a
t co
asta
l site
sLo
cal m
odes
of w
eak
beam
s
Equi
pmen
tPi
pew
ork
Flex
ibili
ty o
r rig
idity
of c
onne
ctio
n (T
p <>
0.06
s)G
eom
etric
al ir
regu
larit
ies
Verti
cal c
olum
ns o
r tow
ers
Impo
rtanc
e fa
ctor
I p (=
1–1.
5)Ve
rtica
l and
hor
izon
tal i
rreg
ular
ities
(stiff
ness
, str
engt
h an
d m
ass d
istrib
utio
n)H
oriz
onta
l pre
ssur
e ve
ssel
sFo
rce
ampl
ifica
tion
fact
or a
p (=
1–2.
5)C
ompo
nent
q-fa
ctor
Tors
iona
l effe
cts
Ana
lysi
s met
hods
for P
Rs
Con
side
ratio
ns1.
Dec
oupl
ed W
< 25
% (d
iffer
ent q
-fact
or fo
r PS
&PR
)Eq
uiva
lent
late
ral f
orce
(lin
ear o
r non
linea
r)R
acks
with
sign
ifica
nt m
ass a
t one
or m
ultip
le
floor
s (fir
st m
ode
pred
omin
ant)
2. C
oupl
ed W
> 25
% (w
hen
T p >
0.06
s, q
fac-
tor t
he le
sser
bet
wee
n PS
&PR
or o
nly
of P
R
othe
rwis
e)
Resp
onse
spec
trum
Con
tribu
tion
of to
rsio
nal a
nd/o
r hig
her m
ode
effec
tsTi
me-
histo
ryLi
near
beh
avio
ur is
reco
mm
ende
d du
e to
unc
er-
tain
ties i
n th
e no
nlin
earit
y

2731Bulletin of Earthquake Engineering (2020) 18:2723–2757
1 3
3.1 State‑of‑the‑art
Except for the well-known effects of SSI on system response, namely period elongation and damping increase, the SSI has been found to affect mostly heavy and stiff structures. The longer period as well as the additional damping in the system reduce the seismic demand forces (lower response spectrum) and thus SSI could be beneficial from this point of view. On the other hand, the higher displacement demand due to the soil deformation could be strictly necessary within the displacement-based design particularly for pipe racks that are outfitted by sensitive to high-deformation pipelines. According to Elnashai and Di Sarno (2015), the ratio of h/(Vs·T) (h is the effective height, Vs is the shear velocity and T is the natural period) could be a reliable indicator of the degree of period elongation and damping increase.
Depending on the rigorousness of soil constitutive models and analysis method, the evaluation of SSI effects could be a challenging task. The influence of SSI has been exam-ined mostly for storage tanks and nuclear containment structures so far (Peña Ruiz and Guzmán Gutiérrez 2015; Wang et al. 2017), although process plant pipe racks could be stiff due to the vertical and horizontal bracing that intend to keep low the ductility as well as heavy since other nonbuilding structures and components are usually supported on them (Di Sarno and Karagiannakis 2019).
3.2 SSI models
The literature is fraught with models that are used to describe the soil–foundation–structure interaction. A categorization of SSI models could be made into three scales; first, ‘domain type models’ pertain to local scale since the soil is examined by constitutive laws, sec-ondly macroelements (intermediate-scale) where the soil–foundation–structure interface is described by a link element, and finally soil springs that is the simplest and most com-monly adopted type of model by practitioners based on impedance functions considering only for the fundamental frequency of the superstructure (global scale).
Spring models represent the soil compliance and are considered mainly for shallow foundations making the assumption that the superstructure is underneath by a homogene-ous, elastic and semi-infinite medium (Mylonakis et al. 2006). When the foundation is rigid enough and the seismic excitation is not severe, the assumption of linear behaviour in the vicinity of foundation could be acceptable. The energy dissipation of soil due to radiation and hysteretic damping is represented by dampers. Spring models are less time consuming and can account for soil nonlinearity. They are suggested by code-of-practice provisions as a practically acceptable method (Elnashai and Di Sarno 2015). That being said, the latter model accounting for soil nonlinearity will be described hereafter and used for the fragility analysis in the following CS. A representative spring-foundation-pipe rack layout as con-sidered in the CS is illustrated in Fig. 4.
The soil develops nonlinear response under strong ground motion and in the vicinity of foundation interface (near-field) even at low strain levels. The soil hysteretic behaviour (or hysteresis loop) is described by the inclination (that refers to soil stiffness) and the breadth of the loop (the larger the loop, the higher the energy dissipation, Fig. 5a). Usually, the secant stiffness (Gsec = τc/γc) is used to describe the average stiffness of soil along an entire loop instead of the tangent Gtan (= Gmax) and the damping ξ for the dissipation of energy due to the material nonlinearity. The Gsec and ξ constitute the equivalent linear soil properties; the

2732 Bulletin of Earthquake Engineering (2020) 18:2723–2757
1 3
increase of shear strain amplitude decreases the secant modulus and increases the energy dis-sipation due to the hysteresis phenomenon (Tsinidis 2015).
Plentiful nonlinear constitutive models of different rigorousness and complexity exist in the literature. Soil models with hysteretic behaviour can be rather difficult to be calibrated since they require a lot of parameters. In this respect, a simplified model is adopted in the sequel to account for the nonlinear behaviour of soil underneath an LNG RC rack. The model relies on the Ramberg–Osgood (RO) curve (SeismoSoft 2019), which is described by the following equation:
where γy and τy are the yield strain and stress (Gmax = ty/γy) and the parameters α and r are positive constants (r ≥ 1 and a ≥ 0). When the strain is very small (γ → 0 and τ → 0 given that r > 1), the eq. 1 can be rewritten according to Masing’s rule as follows:
(1)�
�y=
�
�y
(1 + a
|||||�
�y
|||||
r−1)
(2)�
�y=
�
Gmax ⋅ �y
(1 + a ⋅
|||||�
Gmax ⋅ �y
|||||
r−1)
FOOTING STRIP BEAM
PIPE RACK
PIPE
SPRING & DASHPOT
Fig. 4 Representative layout of spring-foundation configuration
Gsec
Gmax
a b
Fig. 5 a Hysteresis loop of soil element subjected to symmetric cyclic loading (Tsinidis 2015), and b typi-cal G-γ-D curves of a soil deposit

2733Bulletin of Earthquake Engineering (2020) 18:2723–2757
1 3
also, the hysteretic damping according to RO model is defined as:
The parameters a, r and γy are to be determined by using a code that tries repetitively to estimate the best fit of the original soil properties with Gmax. The selected soil for the CS pertains to an alluvium deposit of sandy clay to clayey sand that can be found at coastal sites with some plasticity Ip that shifts the G-γ-D curve to the upper and right-hand direc-tion and reduces the damping ratio D. According to Ishibashi and Zhang (1993), the modi-fied equations that describe such a kind of soil have the following form:
where K(γ, Ιp) and m(γ, Ιp) is a decreasing and increasing function of the cyclic shear strain γ, respectively, �̄�0 is the mean confining (or overburden) pressure, m0 = m(γ ≤ 10−6) and A(Ip) is a modification function that modifies Dsand so as to incorporate soil plasticity in the damping ratio. The complete provision of all equations is omitted for brevity, however, the same nomenclature has been used so that the reader could find easily all the information for the construction of the target curves in the pertinent reference.
Finally, a code has been developed on MATLAB (2018) using two fitting methods, namely the Root Mean Square Error (RMSE) and the coefficient of determination (R2), in order to compare the results. Since the former method calibrated better the G-γ curve, the pertinent parameters were selected as an input in SeismoSoft (2019). The original G-γ-D curves, nearly 50 curves by the iterating process of the method as well as the final selected are shown in Fig. 5b.
4 Fragility analysis methods
Numerical analyses of structural models are plagued with uncertainties and this is why the research has lent weight in the probabilistic seismic assessment of structures. There are three main parameters to be considered when selecting a fragility assessment methodology for structures, viz the structural type, the assessment target e.g. evaluation of serviceabil-ity or ultimate Limit State (LS) and time constraints related to model scale and computa-tional capacity. As highlighted above, the mass and stiffness irregularities as well as local mode effects of PRs may constitute nonlinear static analysis methodologies inappropriate (Baltzopoulos et al. 2017; Fragiadakis et al. 2014; Di Sarno and Karagiannakis 2019). To this effect, probabilistic dynamic analysis methods are more capable to reveal hidden epis-temic e.g. errors in modelling assumptions and aleatory e.g. seismic input or soil properties uncertainties in the models, and thus they are selected for review in the following.
4.1 Methodologies
The most common analytical approach is the so-called Incremental Dynamic Analysis (IDA) (Vamvatsikos and Allin Cornell 2002), where a suite of records is incrementally
(3)G
Gmax
= 1 −D ⋅ � ⋅ (r + 1)
2(r − 1)
(4)G
Gmax
= K(𝛾 , Ip
)⋅ �̄�
m(𝛾 ,Ip)−m0
0
(5)D = Dsand ⋅ A(Ip)

2734 Bulletin of Earthquake Engineering (2020) 18:2723–2757
1 3
applied to a structural model at various IMs, resulting in response curves (or IDA curves) that parameterize the intensity level with the EDP. The selection of EDP in the abscissa depends on the structural model; for instance, the interstorey drift ratio in the vicinity where nonbuilding structures not similar to building are supported on, the base shear resistance (V) or the peak floor acceleration for the assessment of nonstructural components could be a reasonable choice for oil/gas nonbuilding structures.
In contrast with the IDA, the Multiple-Stripes Analysis (MSA) method is performed at specific IMs each of which has a unique set of ground motions (Jalayer and Cornell 2009). Both MSA and IDA can be characterized as wide-range assessment methods, since they can be conducted for a large range of IMs. A competitive edge of MSA versus IDA is the accuracy due to the compatibility of records with the conditional spectrum at different IMs. Furthermore, another popular method particularly during the recent years that attempts to substitute the IDA towards minimizing even more the computational time by performing analysis at different IMs for un-scaled records is the so-called cloud analysis. The method is not only used to describe the uncertainty in ground motion representation but also to propagate other types of uncertainties such as modelling or component capacity. More information about this method can be found in Jalayer et al. (2015). In Table 2, the main benefits and limitations that each method encounters are quoted.
The relationship between the IM and structural response is well described by the Lognormal Distribution (Eads et al. 2013). The random variable X e.g. IM is lognor-mally distributed if Y = lnX has lognormal distribution. The lognormal cumulative dis-tribution function (or CDF) is used to describe the relation between the IM and prob-ability of collapse of a certain LS and holds:
where Pf (·) is the probability of being at or exceeding a particular damage state (ds) given the IM = x, Φ is the CDF function and θ and β are the median and standard deviation (or dispersion of IM), respectively. The central values of the distribution can be calculated by
(6)Pf
�ds ≥ dsi�IM = x
�= �
⎛⎜⎜⎜⎝
ln
�x
�
�
�
⎞⎟⎟⎟⎠
Table 2 Comparison of analytical assessment analysis methods
Method Pros Cons
IDA Simple in implementation and record selectionThorough understanding of response-IM relation, global
system capacity and record-to-record variabilitySimple fitting approachesInsight in the IM effectiveness
Time consumingScaling of low magnitude motion may
not be accurateScaling of records up to impractical
IMsMSA Wise selection of IMs based upon the dispersion
Appropriate for spectrum compatible records for each LSUse of unscaled time-historiesEstimation of uncertainty propagation
Not clear picture of collapse capacityUnavailability of records per each IMMore advanced fitting approaches
Cloud Time efficientUse of simple regressionEstimation of record-to-record variabilityUse of unscaled time-histories
High dependence of regression pre-diction on the suite of records
Constant conditional standard devia-tion of damage given IM

2735Bulletin of Earthquake Engineering (2020) 18:2723–2757
1 3
simple and advanced e.g. maximum likelihood estimation formulae, which are adopted for the CS, or fractiles for each LS.
4.2 Fragility assessment in previous studies
The seismic fragility evaluation of RC buildings but also of nonstructural components is reviewed to compare the results in conjunction with the fragility analysis of the RC PR and PS in the following. A fragility assessment of a sample of existing regular RC buildings by considering both flexural and shear failure modes according to EN 1998-3 (2004), which were also adopted for the CS, as well as Peak Ground Acceleration (PGA) as IM was con-ducted in Tsonis and Fardis (2014). Among others, the research showed that the shear fail-ure mode is the predominant for the collapse LS of columns, as it was also deduced in the sequel for the RC rack, and the modelling e.g. space of stirrups in columns could affect considerably the fragility. The predominance of shear failure mode against flexural one is not acceptable and this is what the capacity design intents to prevent. In the majority of assessment efforts of RC buildings when adopting the IDA method, interstorey drift ratio or chord rotation was used as an EDP (Al Mamun and Saatcioglu 2017; Karapetrou et al. 2015). RC structures should be assessed accounting for both modes due to uncertainties in the design process or when addressing existing structures that do not comply with modern codes (EN 1998-3 2004). This conclusion is more stringent for pipe racks due to the higher importance class and the load exerted by the pipelines and other nonbuilding structures. Also, researchers have been trying during the last decade to evaluate the effects of another modelling parameter, namely soil deformability, in a probabilistic manner. Even though this attempt has been partially completed for common building structures and bridges (Karapetrou et al. 2015; Kwon and Elnashai 2007; Mitropoulou et al. 2016), the litera-ture lacks clearly of a probabilistic methodology that investigates the damage of pipe racks accounting for dynamic coupling and soil–structure interaction.
Except for the estimation of fragility quantitatively, assessment methodologies intend to evaluate as much as possible the number of uncertainties. An intriguing fragility assess-ment of a typical high-rise building by using the IDA method accounting for linear regres-sion and considering different sources of uncertainty, namely linear and nonlinear soil, coupled and decoupled SSI approach as well as soil depth and stratigraphy was conducted in Karapetrou et al. (2015). The results highlighted that different assumptions on modelling e.g. linear or nonlinear soil, stratigraphy omission, higher soil depths and seismic input may result in inverse SSI effects. A sufficient number of uncertainty sources related to record selection (natural and artificial records were selected accounting for spectral accel-eration-to-velocity ratio), statistical processing of results and material modelling were con-sidered within a fragility analysis framework of RC building in Kwon and Elnashai (2006). The most relevant result was the significant higher effect of seismic source conditions com-pared to modelling parameters.
The assessment of nonstructural components, which mostly present flexible behaviour and high geometrical irregularities e.g. piping, relies on different damage parameters and thus alternative probabilistic estimators should be adopted. For instance, the IDA method was applied to nonstructural components for near- and far-field conditions (rigid blocks) that were included in healthcare facilities by considering different IMs in Di Sarno et al. (2017). The research clearly showed that the PGA was the most efficient IM for short rigid blocks, whereas PGV was the most appropriate for taller ones. Also, the fragility estima-tion of a nuclear power plant piping system was addressed in Salimi Firoozabad et al.

2736 Bulletin of Earthquake Engineering (2020) 18:2723–2757
1 3
(2015) and it was found that the fragility estimation yielded better results when considering as an EDP the relative displacement between the pipe support and the ground. Thus, the selection of common IMs e.g. Sa or PGA and unique EDP may not be the best choice for nonstructural components because of dynamic incompatibility with the supports that are attached to. A question that arose in the following CS regarded the selection of spectrum-related IM on the principal period of supporting structure or nonstructural component. Finally, a numerical study that addressed the dynamic coupling of an example primary-secondary system accounting for uncertainties in soil Poisson’s ratio and shear wave veloc-ity was conducted in Chaudhuri and Gupta (2002). It was proved that if the fundamental period of the system due to the soil deformability gets increased by more than 20%, then the uncertainties should be addressed.
5 Model description
A RC pipe rack included in an existing LNG terminal is addressed (Fig. 6a). Except for the process pipe rack area, the terminal constitutes several utility zones e.g. knock-out drum, or ethylene storage tank that are interconnected with pipelines (Fig. 6b). This study focuses exclusively on the process pipe rack area that serves to support the pipelines that come from the tank and distribute ethylene to the surrounding units (Fig. 6a). The RC rack consists of two sub-racks; a 6 × 9 × 8.3 m short rack that supports the pipelines that come immediately from the LNG storage tank and a 102 × 6.5 × 7.3 long rack that transfers
a b
c
Fig. 6 a LNG terminal layout, b the pipe rack under consideration and a process area, c dimensions of short and long racks in two planes
2737Bulletin of Earthquake Engineering (2020) 18:2723–2757
1 3
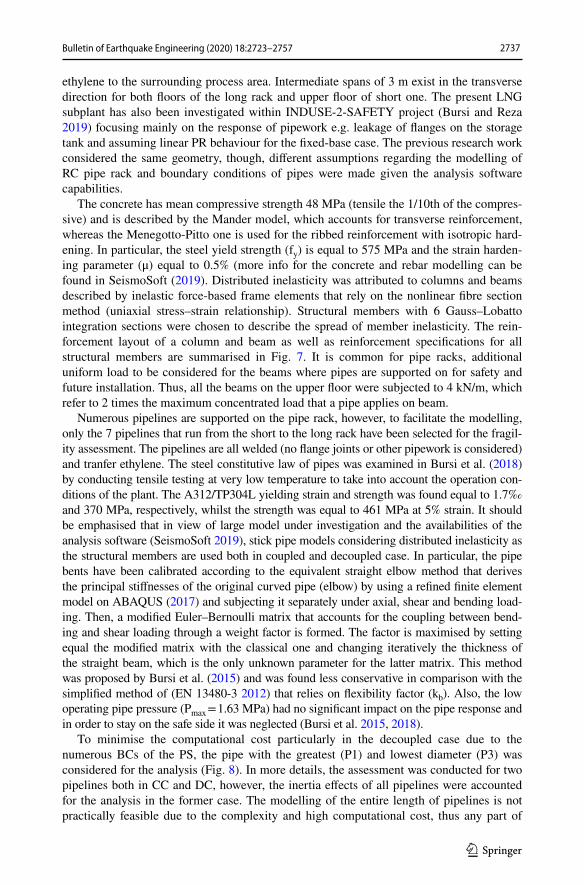
ethylene to the surrounding process area. Intermediate spans of 3 m exist in the transverse direction for both floors of the long rack and upper floor of short one. The present LNG subplant has also been investigated within INDUSE-2-SAFETY project (Bursi and Reza 2019) focusing mainly on the response of pipework e.g. leakage of flanges on the storage tank and assuming linear PR behaviour for the fixed-base case. Τhe previous research work considered the same geometry, though, different assumptions regarding the modelling of RC pipe rack and boundary conditions of pipes were made given the analysis software capabilities.
The concrete has mean compressive strength 48 MPa (tensile the 1/10th of the compres-sive) and is described by the Mander model, which accounts for transverse reinforcement, whereas the Menegotto-Pitto one is used for the ribbed reinforcement with isotropic hard-ening. In particular, the steel yield strength (fy) is equal to 575 MPa and the strain harden-ing parameter (μ) equal to 0.5% (more info for the concrete and rebar modelling can be found in SeismoSoft (2019). Distributed inelasticity was attributed to columns and beams described by inelastic force-based frame elements that rely on the nonlinear fibre section method (uniaxial stress–strain relationship). Structural members with 6 Gauss–Lobatto integration sections were chosen to describe the spread of member inelasticity. The rein-forcement layout of a column and beam as well as reinforcement specifications for all structural members are summarised in Fig. 7. It is common for pipe racks, additional uniform load to be considered for the beams where pipes are supported on for safety and future installation. Thus, all the beams on the upper floor were subjected to 4 kN/m, which refer to 2 times the maximum concentrated load that a pipe applies on beam.
Numerous pipelines are supported on the pipe rack, however, to facilitate the modelling, only the 7 pipelines that run from the short to the long rack have been selected for the fragil-ity assessment. The pipelines are all welded (no flange joints or other pipework is considered) and tranfer ethylene. The steel constitutive law of pipes was examined in Bursi et al. (2018) by conducting tensile testing at very low temperature to take into account the operation con-ditions of the plant. The A312/TP304L yielding strain and strength was found equal to 1.7‰ and 370 MPa, respectively, whilst the strength was equal to 461 MPa at 5% strain. It should be emphasised that in view of large model under investigation and the availabilities of the analysis software (SeismoSoft 2019), stick pipe models considering distributed inelasticity as the structural members are used both in coupled and decoupled case. In particular, the pipe bents have been calibrated according to the equivalent straight elbow method that derives the principal stiffnesses of the original curved pipe (elbow) by using a refined finite element model on ABAQUS (2017) and subjecting it separately under axial, shear and bending load-ing. Then, a modified Euler–Bernoulli matrix that accounts for the coupling between bend-ing and shear loading through a weight factor is formed. The factor is maximised by setting equal the modified matrix with the classical one and changing iteratively the thickness of the straight beam, which is the only unknown parameter for the latter matrix. This method was proposed by Bursi et al. (2015) and was found less conservative in comparison with the simplified method of (EN 13480-3 2012) that relies on flexibility factor (kb). Also, the low operating pipe pressure (Pmax = 1.63 MPa) had no significant impact on the pipe response and in order to stay on the safe side it was neglected (Bursi et al. 2015, 2018).
To minimise the computational cost particularly in the decoupled case due to the numerous BCs of the PS, the pipe with the greatest (P1) and lowest diameter (P3) was considered for the analysis (Fig. 8). In more details, the assessment was conducted for two pipelines both in CC and DC, however, the inertia effects of all pipelines were accounted for the analysis in the former case. The modelling of the entire length of pipelines is not practically feasible due to the complexity and high computational cost, thus any part of

2738 Bulletin of Earthquake Engineering (2020) 18:2723–2757
1 3
3
3
12
2 39F 8 L=1.387F
8/50
4
4*1F 20
4*1F 20
2F 12
19 22 19
1922
1949
1327
3F10
L=1
.78
8
8
3*1F 10
3F 10/2502*2F 16
4 27F 10/250
52*
2F28
L=8
.08
in th
e co
rner
68F
20 L
=8.0
578
0
780
only next to short rack
4F 10/150
10 2*2F 16
9 2*2F 20
29F 8/200
88
4
27
15
15
1 1
2 22 22
3
3
13
30 30 5.40 30 30
6.00
35
88
4
88
60
25
4F 12 L=1.454F 20 L=5.26
526
2F 12
4*1F 20
4*1F 20
2F 12
4
5F8/
50
11F
8/20
0
11F
8/20
0
5F8/
50
2*2F 28corner
49
49
13
67
5
6
2*2F 28
2*4F 20427F 10/250
5.5 49 5.5
8.5 14.3 14.4 8.5
5.5
495.
5
8.5
14.4
8.5
14.3
14.3
14.3
6
5
2*4F 20
2*2F 28
Member: Column - Long Pipe rack (CL) Reinforcement Specification
Ethylene terminal: Reinforcement Layout& Specification
Member: Beam - Long Pipe rack (BL6)
Longitudinal Transverse
BL6 4*2F 20
BL6.5
BS6
BS9
CL
CS
FF
FSB
F 8200 & F 8
50
4*2F 20 F 8200 & F 8
50
4*2F 20 F 8200 & F 8
50
2*2F 20+3*2F 12 F 8100 & F 8
50
2*2F 28+2*4F 20 F 10250 & 3*F 10
250
2*2F 28+2*4F 20 F 10250 & 3*F 10
250
4*2F 20+3*2F 16 F 10150
4F 10100 & 4F 8
502*2F 20+2*2F 16
1. Denser transverse reinforcement isused at the edges of beams andcolumns. For beams, it covers 5% ofthe member.
2. Denser transverse reinforcement in themiddle is used only for BL6 as shownabove.
3. Concrete 40/50 & ReinforcementB500S
4. Exposure class XC48/XD1/XF1/XA15. Concrete cover:Top / Bottom / lateral Beams: 40 / 40 / 40 Columns: 55 / 55 / 55
AbbreviationsBL6: Long rack beam of 6 metersBS6: Short rack beam of 6 meters
CL: Long rack columnFF: Foundation footing
FSB: Foundation strip beam
a
b
c
Fig. 7 Representative specification of reinforcement for a a beam (BL6) and b a column (CL) as well as c for the rest of structural members

2739Bulletin of Earthquake Engineering (2020) 18:2723–2757
1 3
pipelines that runs out of the main frame of the rack was not considered. Usually, pinned connections are adopted for the pipe ends, which is a conservative assumption, since pipes that present relative flexibility -mostly bend downwards or upwards after the main frame- are considered more rigidly restrained. Regarding the internal supports of the pipes on the rack, it is generally acceptable the longitudinal and all the rotational degrees of freedom to be unrestrained in order to attribute flexibility to the system. During the initial design pro-cess of the rack that placed the structure in a low-seismicity region, except for the previous type of BC, fixed supports with special clamps were considered as well, probably, for oper-ational purposes. To examine the performance of the pipes and rack for earthquake events of higher probability of occurrence, that consideration was not modified in our CS (Fig. 8, see also Fig. 6b for global coordinate system). Finally, it is a common industrial practice detailed isometric drawings of piping systems including the location and type of supports to be shared among engineers to facilitate the design or assessment process (Table 3).
The bearing capacity of the soil, which is categorized as soil type C in EN 1998-1 (2004), as well as the surface foundation that consists of centered footings and strip beams has been checked under axial, bending and shear loading according to Fardis (2009) after placing the structure in a high seismicity area (Priolo Gargalo, Sicily, Italy) in contrast with the initial design. The mechanical and geometrical properties of RC rack, pipelines (reduced thickness of pipe bents in parentheses to account for higher flexibility), founda-tion and soil modelling are recapped in Table 4 and the final model of RC rack in CS con-sidering SSI is illustrated in Fig. 9.
6 Assessment of RC rack
6.1 Methodology
The assessment of RC pipe rack entails six main successive steps that have been followed for this CS and can be used as a guidance for the reader. After the material and frame ele-ment modelling that have been presented in the previous sections, the pushover analysis of RC rack follows for the determination of the weakest direction for which the funda-mental period will be used for the record selection. The results from the modal analysis with (W/) and without (W/O) SSI both in horizontal and vertical directions are presented
P12P22P32
P33P42P52P62P72
P34P35
P36P13 P23
P73P63P53P43
P37 P38
P39 P310 P311 P312
P313 P28
P27P15P26
P14
P25
P64
P24P74
P75
P44
P54P45
P55
P46
P56
P16
P11P21 P41P71
P61P31 P51
Fig. 8 The PS layout and pipe supports IDs

2740 Bulletin of Earthquake Engineering (2020) 18:2723–2757
1 3
Table 3 Coordinates (midline) and piping system support types
Location (X, Y, Z) (m) Support ID Type Restrained direction
(42.7, 19.8, 15.678) P11 Pinned U(X, Y, Z)(42.7, 15.5, 8.697) P12 Guided support U(X, Z)(42.7, 6.500, 8.697) P13 Guided support U(X, Z)(48, 999.4, 7.677) P14 Guided support U(Y, Z)(57, 999.4, 7.677) P15 Guided support U(Y, Z)(66, 999.4, 7.677) P16 Fixed U(X, Y, Z), UR(X, Y, Z)(75, 999.4, 7.677. P17 Guided support U(Y, Z)(84, 999.4, 7.677) P18 Guided support U(Y, Z)(93, 999.4, 7.677) P19 Guided support U(Y, Z)(99, 999.4, 7.677) P110 Guided support U(Y, Z)(102, 999.4, 7.677) P111 Pinned U(X, Y, Z)(43.9, 19.8, 15.69) P21 Pinned U(X, Y, Z)(43.6, 15.5, 8.624) P22 Guided support U(X, Z)(43.6, 6.5, 8.624) P23 Guided support U(X, Z)(45, 2.0, 7.612) P24 Guided support U(Y, Z)(48, 2.0, 7.612) P25 Fixed U(X, Y, Z), UR(X, Y, Z)(54, 2.0, 7.612) P26 Guided support U(Y, Z)(60, 2.0, 7.612) P27 Guided support U(Y, Z)(61.95, 0, 7.612) P28 Pinned U(X, Y, Z)(44.37, 19.8, 15.678) P31 Pinned U(X, Y, Z)(44.37, 18.5, 8.532) P32 Guided support U(X, Z)(44.37, 15.5, 15.678) P33 Guided support U(X, Z)(44.37, 12.5, 15.678) P34 Guided support U(X, Z)(44.37, 9.5, 15.678) P35 Guided support U(X, Z)(44.37, 6.5, 15.678) P36 Guided support U(X, Z)(44.37, 6.5, 15.678) P37 Guided support U(Y, Z)(45, 5.57, 7.532) P38 Guided support U(Y, Z)(51, 5.57, 7.532) P39 Guided support U(Y, Z)(54, 5.57, 5.532) P310 Fixed U(X, Y, Z), UR(X, Y, Z)(57, 5.57, 5.532) P311 Guided support U(Y, Z)(60, 5.57, 5.532) P312 Guided support U(Y, Z)(60.488, 0, 6.308) P313 Guided support U(X, Z)(45.535, 19.8, 15.678) P41 Pinned U(X, Y, Z)(45.535, 15.5, 8.559) P42 Guided support U(X, Z)(45.535, 6.5, 8.559) P43 Guided support U(X, Z)(42, 3.2, 7.559) P44 Guided support U(Y, Z)(36, 3.2, 7.559) P45 Guided support U(Y, Z)(30, 3.2, 7.559) P46 Guided support U(Y, Z)(24, 3.2, 7.559) P47 Guided support U(Y, Z)(18, 3.2, 7.559) P48 Guided support U(Y, Z)(12, 3.2, 7.559) P49 Guided support U(Y, Z)(9, 3.2, 7.559) P410 Guided support U(Y, Z)(45.985, 19.8, 15.678) P51 Pinned U(X, Y, Z)(45.985, 15.5, 8.652) P52 Guided support U(X, Z)

2741Bulletin of Earthquake Engineering (2020) 18:2723–2757
1 3
in Table 5 and Fig. 10. The SSI caused nearly 20% increase in the first two principal peri-ods of the structure and modal mass decreased considerably. Furthermore, the selection of records considering the fundamental period should comply with the recommendations of EN1998-1 (2004). In this CS, 21 spectrum-compatible records were selected in total for far- and near-field conditions and Safe Life Limit State (SLLS) accounting for soil type C. The number of ground motions was probably insufficient to fully depict the record-to-record variability, however, it constituted the minimum number of records for seismic assessment proposed in ASCE/SEI 7-16 (2017) and made the analysis computationally feasible given the large model scale. The compatibility was achieved in REXEL software (Iervolino et al. 2010) and the records attained compatibility separately in the horizontal and vertical direction for near-field conditions (NEAR-HOR and NEAR-VERT) and only in the horizontal for far-field conditions (FAR-HOR) (Table 6, Fig. 11), although all the components were used in all cases. As mentioned in the introduction, the ED could be used as a parameter for the source characterisation, and thus it was assumed that ED < 15 km referred to near-source effects (Heydari and Mousavi 2015).
A fundamental step in the assessment process is the determination of acceptance criteria of structural members and pipes. Concerning the former type, two failures modes were considered, viz shear and flexure, according to Fardis (2014) (Table 7). The failure modes that were taken into account for the pipes referred to failure in tension and local buckling according to Vathi et al. (2017). The three LSs for each of the failure modes considered are shown in Tables 7 and 8 for the structural and nonstructural components, respectively.
In particular, the SLS pertained to tensile strain εp = 0.5%, whereas the conservative value of εΤu = 2% is considered as ultimate tensile strain. Furthermore, the compressive strain resistance εCu in the axial pipe direction primarily depends on the diameter to thick-ness ratio (D/t) and is given by (Vathi et al. 2017):
Table 3 (continued)
Location (X, Y, Z) (m) Support ID Type Restrained direction
(45.985, 6.5, 8.652) P53 Guided support U(X, Z)(42, 3.65, 7.637) P54 Guided support U(Y, Z)(36, 3.65, 7.637) P55 Guided support U(Y, Z)(30, 3.65, 7.637) P56 Guided support U(Y, Z)(24, 3.65, 7.637) P57 Guided support U(Y, Z)(18, 3.65, 7.637) P58 Guided support U(Y, Z)(12, 3.65, 7.637) P59 Fixed U(X, Y, Z), UR(X, Y, Z)(6, 3.65, 7.637) P510 Guided support U(Y, Z)(0, 3.65, 7.637) P511 Pinned U(X, Y, Z)(46.6, 19.8, 15.678) P61 Pinned U(X, Y, Z)(46.6, 15.5, 8.585) P62 Guided support U(X, Z)(46.6, 6.5, 8.585) P63 Fixed U(X, Y, Z), UR(X, Y, Z)(46.6, 0, 6.175) P64 Pinned U(X, Y, Z)(47.35, 19.8, 15.678) P71 Pinned U(X, Y, Z)(47.35, 15.5, 8.559) P72 Guided support U(X, Z)(47.35, 6.5, 8.559) P73 Fixed U(X, Y, Z), UR(X, Y, Z)(45, 2.75, 7.559) P74 Guided support U(Y, Z)(44.566, 0, 6.162) P75 Pinned U(X, Y, Z)

2742 Bulletin of Earthquake Engineering (2020) 18:2723–2757
1 3
where σh is the hoop stress due to internal pressure (null for this CS), and E is the elastic modulus.
The sixth step of the assessment framework includes the decision-making for the fra-gility analysis selection. The limited number of earthquakes found given the constraints on epicentral distance and spectrum compatibility gave rise to the IDA method employ-ment. The number of runs per each record was dependent on the record. The initial run was determined roughly at 0.05 g and step increments of 0.05 g for ag ≤ 1 g and 0.1 g for ag > 1 g were employed. The scaling factor was applied both for the horizontal (H) and vertical (V) component in order to keep the ratio V/H constant. The same procedure was
(6)�Cu = 0.5
(t
D
)− 0.0025 + 3000
(�hE
)2
Table 4 RC rack, pipelines, foundation and soil properties
Characteristic Description
LNG RC PR Beam (short and long) 350 × 350 mmBeam (upper in Y direction of short rack) 350 × 700 mmColumn 600 × 600 mmTotal weight 523 tMaterial C40/50 and S500
Pipelines Liquid EthyleneStraight pipe thickness (elbow) t1 = 4.78 (2.79) mm
t2 = 4.19 (1.98) mmt3 = 3.05 (1.05) mmt4,7 = 3.40 (1.23) mmt5 = 4.57 (2.49) mmt6 = 3.76 (1.56) mm
Pipe bends radius R1 = 610 mmR2 = 381 mmR3 = 152 mmR4,7 = 229 mmR5 = 457 mmR6 = 305 mm
Total Weight 20.6 tYield and ultimate strength 370 and 461 Mpa
Foundation Footing Square 1.4 × 1.4 × 0.7 mStrip beam 0.35 × 0.6 m
Soil Soil Category CShear modulus 105 MPaPoisson ratio, ν 0.33Average Shear Wave Velocity, Vs,30 210 m/sYield strain (γy) 0.65‰RO parameter 2.72a 1Plasticity Ip 10Mean effective confining pressure, �̄�
0144 kPa

2743Bulletin of Earthquake Engineering (2020) 18:2723–2757
1 3
Fig. 9 The mathematical model of soil–foundation, pipe rack and pipelines
Table 5 The fundamental periods of the rack
Mode Period (s) (W/O) ΔΤ (%) Μ (%) ΔM (%)
3(Y) 0.269 + 17 43 − 215 (X) 0.230 + 20 87 − 3711 (Z) 0.056 – 29.91 –
a b
Col61
Fig. 10 The two principal modes of the RC rack in a Y direction, and b X direction

2744 Bulletin of Earthquake Engineering (2020) 18:2723–2757
1 3
Tabl
e 6
Sei
smic
reco
rds c
onsi
dere
d fo
r nea
r- an
d fa
r-fiel
d co
nditi
ons
*The
bra
cket
ed d
urat
ion
refe
rs to
thre
shol
d va
lue
0.03
–0.0
5 g
#Ev
ent n
ame
Dat
eM
wED
(km
)PG
AX
(g)
PGA
Y (g
)PG
A Z
(g)
ΔΤ*
(s)
Pred
omin
ant
perio
d (s
)
NEA
R-H
OR
1Fa
ial
09/0
7/19
986.
111
0.42
00.
382
0.31
79.
360.
476
2B
. Luk
a13
/08/
1981
5.7
70.
362
0.22
20.
099
2.52
0.21
73
Duz
ce12
/11/
1999
7.2
80.
377
0.51
30.
345
22.4
60.
417
4D
inar
01/1
0/19
956.
48
0.27
30.
319
0.12
622
.92
0.34
55
UM
arch
e16
/10/
1997
4.3
20.
067
0.04
40.
036
2.56
0.90
96
UM
arch
e26
/09/
1997
65
0.19
90.
223
0.16
512
.54
0.18
57
Ioni
an04
/11/
1973
5.8
150.
525
0.25
50.
096
7.78
0.50
0FA
R-H
OR
8Iz
mit
13/0
9/19
995.
810
00.
071
0.06
40.
026
2.01
0.25
69
Ada
na27
/06/
1998
6.3
300.
220
0.26
90.
088
9.72
0.66
710
Lios
ia07
/09/
1999
619
0.08
30.
101
0.11
43.
100.
204
11Sp
itak
07/1
2/19
886.
736
0.18
30.
183
0.13
810
.76
0.30
312
Azo
res
01/0
1/19
806.
980
0.05
70.
043
0.03
57.
420.
161
13Vo
lvi
20/0
6/19
786.
229
0.13
90.
146
0.12
26.
520.
303
14B
Tirr
eno
15/0
4/19
786
180.
073
0.16
10.
050
5.88
0.43
5N
EAR-
VER
T15
Faia
l09
/07/
1998
6.1
110.
420
0.38
20.
317
9.34
0.47
616
Duz
ce12
/11/
1999
7.2
80.
377
0.51
30.
345
3.08
0.34
517
UM
arch
e26
/03/
1998
5.4
150.
010
0.01
10.
011
2.75
0.13
918
UM
arch
e03
/10/
1997
5.3
130.
051
0.06
00.
029
6.79
0.17
919
UM
arch
e26
/09/
1997
5.7
30.
345
0.26
10.
218
6.05
0.30
320
Rac
ha03
/05/
1991
5.6
110.
352
0.50
90.
100
6.58
0.66
721
Friu
li15
/09/
1976
611
0.08
30.
090
0.09
09.
610.
526

2745Bulletin of Earthquake Engineering (2020) 18:2723–2757
1 3
considered for the case with SSI. Both PGA and spectral acceleration (Sa) are selected to describe the damage-to-record variability, albeit the latter is commonly preferred since it is more informative and structural-oriented. The PGA as recorded on the free field consider-ing site effects could be employed as a simple and consistent with the initial design IM and compare new with existing FFs.
Before proceeding with the IDA analysis, it was found necessary to explain graphically the main failure modes of the structural members and pipelines. The former presented higher sensitivity to shear, and that might come from the initial design of pipe rack in the
a b
c
Fig. 11 Response spectra for a near- and far-field conditions in the X-direction, b near- and far-field in the Y-direction, and c near-field in the Z direction
Table 7 Acceptance criteria of concrete members (Fardis 2014)
*VRd, EC2 is the shear resistance without reinforcement and VRd,EC8 is the ultimate capacity
Failure mode Serviceability LS (SLS) Safe life LS (SLLS) Collapse LS (LS)
Flexure (rad) θE ≤ θy θE ≤ 0.75·θu, m−σ θE ≤ θu, m−σ
Shear (kN) VE ≤ V*Rd.EC2 VE ≤ 0.75·VRd.EC8 VE ≤ VRd.EC8*
Table 8 Acceptance criteria of steel pipelines (Vathi et al. 2017)
Mechanism EDP Performance level Limit states (LSs)
Tensile fracture tensile strain, εΤ εΤ < εT ≤ εP SLSεP < εT ≤ εTu SLLSεΤ ≥ εTu CLS
Local buckling compressive strain, εC εY < εC ≤ εCu SLSεCu < εC ≤ 5εCu SLLSεC ≥ 5εCu CLS

2746 Bulletin of Earthquake Engineering (2020) 18:2723–2757
1 3
nonseismic-prone area. As shown in Fig. 12a, b, the shear demand overpassed the SLS for two records (up to 2.3 times) (farfield, Fig. 12a) and for DC, whilst the chord rotation supply was higher for the four representative cases of Fig. 12c, d. The histories referred to Col61 as highlighted in Fig. 10a for the same PGA (ag) and the rack presented either the principal (farfield) or the runner-up (nearfield) modal shape, probably, because it was stiffer in the longitudinal direction.
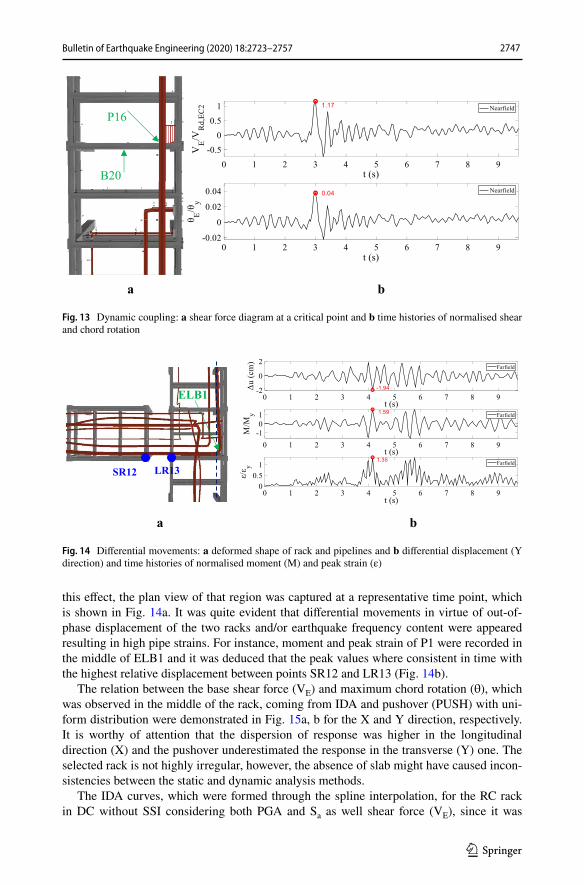
Furthermore, the initial assumption of BCs affected significantly the seismic response. As clearly illustrated in Fig. 13a, the P1 subjected the beam (B20) into considerable load-ing resulting in the exceedance by 17% of the SLS for PGA = ag. On the other hand, the chord rotation of the pertinent joint did not exceed by more than 4% the yielding value. This is another indication of pipe rack sensitivity to shear due to the initial design as it was observed for existing buildings in Tsonis and Fardis (2014). It should be emphasized that the conservative assumption of fixed point (P16) as well as the rigid support did not account for energy dissipation due to the relative stiffness between the support and pipe-lines (Azizpour and Hosseini (2009)) and pipe friction (with snubbers) that may act as a fuse for the seismic response.
Finally, the main failure mode of pipeline regarded the differential displacement between adjacent supports, particularly between the short and long rack. To demonstrate
a
b
c
d
Fig. 12 Time histories referring to a and b shear force and c and d chord rotation at Col61 for far- and near-field conditions
2747Bulletin of Earthquake Engineering (2020) 18:2723–2757
1 3
this effect, the plan view of that region was captured at a representative time point, which is shown in Fig. 14a. It was quite evident that differential movements in virtue of out-of-phase displacement of the two racks and/or earthquake frequency content were appeared resulting in high pipe strains. For instance, moment and peak strain of P1 were recorded in the middle of ELB1 and it was deduced that the peak values where consistent in time with the highest relative displacement between points SR12 and LR13 (Fig. 14b).
The relation between the base shear force (VE) and maximum chord rotation (θ), which was observed in the middle of the rack, coming from IDA and pushover (PUSH) with uni-form distribution were demonstrated in Fig. 15a, b for the X and Y direction, respectively. It is worthy of attention that the dispersion of response was higher in the longitudinal direction (X) and the pushover underestimated the response in the transverse (Y) one. The selected rack is not highly irregular, however, the absence of slab might have caused incon-sistencies between the static and dynamic analysis methods.
The IDA curves, which were formed through the spline interpolation, for the RC rack in DC without SSI considering both PGA and Sa as well shear force (VE), since it was
P16
a b
B20
Fig. 13 Dynamic coupling: a shear force diagram at a critical point and b time histories of normalised shear and chord rotation
LR13
ELB1
SR12
a b
Fig. 14 Differential movements: a deformed shape of rack and pipelines and b differential displacement (Y direction) and time histories of normalised moment (M) and peak strain (ε)

2748 Bulletin of Earthquake Engineering (2020) 18:2723–2757
1 3
found more predominant as proved above, were presented in Fig. 16a, b. The first remark pertained to the higher dispersion of response in case of Sa that proved PGA a better esti-mator of IM variability. Another interesting outcome shown in Fig. 16c, and it was also depicted in Fig. 12, concerned the considerable higher fragility of the system when the far-field records were used and this might be due to the closer to the rack fundamental fre-quency of far-field records predominant period (Table 6 and Fig. 11). In particular, the SLS and SLLS for the worst case was exceeded for PGA equal to 10% and 39% greater than the ag, respectively. The relationship between the PGA and PFA, which may be useful for the response of pipelines for future assessment, was plotted in Fig. 16d. It can been seen that around 30% of records have passed the PFA limit by ASCE 7 (3Sa(T3)) at the ag let alone the limit of 2.5·Sa(T3) as defined by EN1998-1 (2004). This behaviour was expected since the rack was initially designed for lower PGA.
The records belonging to the far-field conditions were also more damaging for pipe-lines (Fig. 17). This consistency was also expected since the initial BCs of pipes were not
a b
Fig. 15 Capacity curves for different compatibility of records (IDA) and from pushover analysis in a X and b Y direction without SSI
a b
c d
Fig. 16 IDA curves considering shear force a Vs versus PGA, b Vs versus Sa, and c PFA versus PGA with-out SSI in decoupled case [Sa(T0) is the design input acceleration including site effects]
2749Bulletin of Earthquake Engineering (2020) 18:2723–2757
1 3
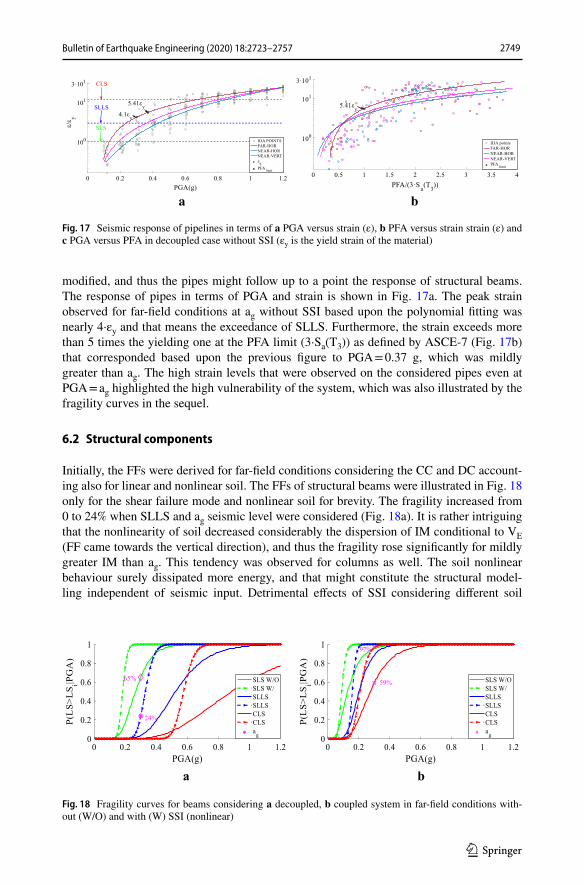
modified, and thus the pipes might follow up to a point the response of structural beams. The response of pipes in terms of PGA and strain is shown in Fig. 17a. The peak strain observed for far-field conditions at ag without SSI based upon the polynomial fitting was nearly 4·εy and that means the exceedance of SLLS. Furthermore, the strain exceeds more than 5 times the yielding one at the PFA limit (3·Sa(T3)) as defined by ASCE-7 (Fig. 17b) that corresponded based upon the previous figure to PGA = 0.37 g, which was mildly greater than ag. The high strain levels that were observed on the considered pipes even at PGA = ag highlighted the high vulnerability of the system, which was also illustrated by the fragility curves in the sequel.
6.2 Structural components
Initially, the FFs were derived for far-field conditions considering the CC and DC account-ing also for linear and nonlinear soil. The FFs of structural beams were illustrated in Fig. 18 only for the shear failure mode and nonlinear soil for brevity. The fragility increased from 0 to 24% when SLLS and ag seismic level were considered (Fig. 18a). It is rather intriguing that the nonlinearity of soil decreased considerably the dispersion of IM conditional to VE (FF came towards the vertical direction), and thus the fragility rose significantly for mildly greater IM than ag. This tendency was observed for columns as well. The soil nonlinear behaviour surely dissipated more energy, and that might constitute the structural model-ling independent of seismic input. Detrimental effects of SSI considering different soil
a b
Fig. 17 Seismic response of pipelines in terms of a PGA versus strain (ε), b PFA versus strain strain (ε) and c PGA versus PFA in decoupled case without SSI (εy is the yield strain of the material)
a b
Fig. 18 Fragility curves for beams considering a decoupled, b coupled system in far-field conditions with-out (W/O) and with (W) SSI (nonlinear)

2750 Bulletin of Earthquake Engineering (2020) 18:2723–2757
1 3
modelling for RC buildings have also been observed in Karapetrou et al. (2015) and Anvar-samarin et al. (2018). When it comes to CC (Fig. 18b), the dynamic interaction of pipelines and beams significantly deteriorated the system response rising the fragility up to 59% for the CLS at ag. Of course, this behaviour was not acceptable and signified the important role the individual pipe supports played for the integrity of the system. It also signified that shear failure mode could be a better option for pipe racks with supported equipment since chord rotation, which refers to global scale, might not capture efficiently the damage of individual members.
The seismic input seemed to affect considerably the system performance as demon-strated in Sect. 6.1 (Fig. 12). Considering the response for horizontal (Fig. 19a) and verti-cal compatibility (Fig. 19b), the probability of exceedance of SLLS W/O SSI was found at 7% and 25%, respectively, compared to the 3% value for far-field conditions. The most useful remark that was drawn when comparing the source conditions regarded the lower dispersion that was observed far from the earthquake source compared to the other two cases (Table 9). A straightforward comparison of modelling and seismic input influence on system fragility is not always feasible given that it depends on LS, number of records and seismic level, however, considering the previous results, it was obvious that the modelling assumption of fixed pipe support sensationally affected the response of the system (as illus-trated also in Fig. 13), and thus it overpassed the seismic input impact.
a b
Fig. 19 Fragility curves for beams considering near-field conditions with a horizontal and b vertical com-patibility with soil nonlinearity
Table 9 Dispersion β of beams in far- and near-field conditions (decoupled case)
Beams W/O SSI W/SSI–nonlinear
SLS SLLS CLS SLS SLLS CLS
PGA FAR-HOR 0.31 0.31 0.41 0.12 0.13 0.09 NEAR-HOR 0.42 0.58 0.50 0.50 0.51 0.36 NEAR-VERT 0.66 0.82 0.75 0.38 0.33 0.29
Sa
FAR-HOR 0.36 0.36 0.76 0.22 0.28 0.19 NEAR-HOR 0.27 0.71 0.69 0.36 0.58 0.51 NEAR-VERT 0.62 0.56 0.53 0.35 0.39 0.42

2751Bulletin of Earthquake Engineering (2020) 18:2723–2757
1 3
To compare the appropriateness of IM to describe the pipe rack damage, the fragility curves of columns and beams in the decoupled case as well as far-field conditions con-sidering for IM = Sa(T3) with 5% damping were derived (Fig. 20). The SSI had negative impact on the system as previously. The spectral acceleration Sa(T3) yielded either greater or lower dispersion depending on the IM and source conditions. Also, it is worthy of atten-tion that the standard deviation was higher for the vertical compatibility than the other two cases for the same IM.
6.3 Nonstructural components
The consideration of the piping system BCs without modifying the initial modalities resulted in the significant dependence of fragility curves upon the response of most critical components and particularly fixed supports. First, it was considered important to compare the response of structural and nonstructural components in unison and DC (Fig. 21a, b). The pipes failed earlier than the beams for SLLS and ag seismic level (24% compared to 4%), however, the dynamic interaction rose excessively the fragil-ity of beams at 89%. This is justified by the excessive force that the pipes imposed on beams on fixed points leading in the early failure in shear. With respect to seismic input, it was observed that the pipes fragility did not change as much as that of beams did particularly for the first two LSs. For instance, the fragility of pipes remained almost constant for the SLLS in both conditions, whereas the risk that beams imposed to the system decreased considerably for IM > ag due to the higher dispersion. As mentioned in Sect. 6.1, the records with compatibility in the vertical direction proved more vulnerable to pipelines than the horizontal one rising the probability of collapse from 22 to 32% for the SLLS (Fig. 22).
Lastly, the effects of soil deformability with nonlinear properties on pipelines were considered, which is another interesting topic since very few publications deal with this issue as well. The SSI decreased the dispersion of IM but again not as much as the structural members, probably in virtue of the incompatibility and differential move-ments that acted as safepad to soil-induced higher displacements (Fig. 22). The SSI did not prove to influence the pipelines at ag, however, the influence was accountable for higher IMs, and may attribute a dependency of SSI effects on IM level. The detrimental impact of pipelines verified the statement of Chaudhuri and Gupta (2002) that consid-ered the SSI effects for nonstructural components when period amplification was equal
a b
Fig. 20 Fragility curves in decoupled case and far-field conditions considering for IM = Sa ( T ′3 is the funda-
mental period considering SSI). a beams and b columns

2752 Bulletin of Earthquake Engineering (2020) 18:2723–2757
1 3
or higher than 20%. Finally, the dispersion and median of pipelines fragility functions are quoted in Tables 10 and 11. The dispersion was comparable between Sa(T3) and PGA among the LSs, however, the vertical component did not cause higher dispersion, as it was observed for the structural members. It should be stated that the Sa was also estimated at the principal mode of pipelines, however, the dispersion occurred even higher. The median occurred rather high for structural members W/O SSI, which was not observed for pipelines. The Table 12 quotes the error estimation with respect to fixed-base assumption where it was demonstrated that the fixed-base underestimated the
a
b
Fig. 21 Fragility curves in a. decoupled and b. coupled case considering far- and near-field conditions (B: beam, and P: pipe)
a
b
Fig. 22 Fragility curves for pipes in near-field condition with nonlinear soil considering. a PGA and b Sa as IMs

2753Bulletin of Earthquake Engineering (2020) 18:2723–2757
1 3
Table 10 Dispersion β of pipelines in far- and near-field conditions (decoupled case)
Pipelines W/O SSI W/SSI–nonlinear
SLS SLLS CLS SLS SLLS CLS
PGA FAR-HOR 0.34 0.30 0.18 0.30 0.28 0.15 NEAR-HOR 0.41 0.41 0.33 0.19 0.45 0.32 NEAR-VERT 0.57 0.57 0.40 0.20 0.14 0.20
Sa
FAR-HOR 0.46 0.41 0.23 0.25 0.30 0.18 NEAR-HOR 0.53 0.40 0.42 0.52 0.53 0.48 NEAR-VERT 0.49 0.36 0.37 0.48 0.39 0.38
Table 11 Median θ in far- and near-field conditions (decoupled case)
Pipelines W/O SSI W/SSI–nonlinear
SLS SLLS CLS SLS SLLS CLS
PGA FAR-HOR 0.26 0.40 0.55 0.18 0.30 0.45 NEAR-HOR 0.22 0.39 0.60 0.20 0.36 0.48 NEAR-VERT 0.24 0.35 0.53 0.22 0.35 0.43
Sa
FAR-HOR 0.61 0.94 1.43 0.42 0.75 1.25 NEAR-HOR 0.44 0.69 1.09 0.40 0.65 1.09 NEAR-VERT 0.50 0.71 1.05 0.52 0.70 1.09
Table 12 Error estimation in median θ for the fixed-base assumption
Pipelines W/SSI–nonlinear
SLS (%) SLLS (%) CLS (%)
PGA FAR-HOR − 22 − 17 − 13 NEAR-HOR − 9 3 − 14 NEAR-VERT 5 6 − 10
Sa
FAR-HOR − 14 − 11 − 7 NEAR-HOR − 7 − 7 1 NEAR-VERT 11 − 5 2

2754 Bulletin of Earthquake Engineering (2020) 18:2723–2757
1 3
pipelines fragility in the majority of cases with the maximum value coming from the nonlinear soil by 17% for SLLS and far-field conditions.
7 Conclusions
The present work inferred that uncertainties in the modelling e.g. assumption of bound-ary conditions and reinforcement, seismic input, intensity measure selection as well as soil–structure interaction phenomenon may have considerable impact on pipe rack—piping system seismic integrity. Overall, the following conclusions can be drawn:
• the fragility of RC beams surged from 0 to 59% for CLS at ag seismic level due to the severe loading exerted by the pipelines.
• the maximum rise of beams fragility due to soil-deformability observed for far-field conditions soaring from 0 to 24% for the SLLS at ag. Also, compatibility in near-field conditions increased the dispersion of conditional IM making the soil effects dependent on seismic level.
• The impact of all sources of uncertainty to pipework was not as much intense as for the structural members. For instance, the fragility increased from 4 and 24% to 89 and 42% at ag for beams and pipelines in the CC, respectively considering SLLS. The influence of soil and seismic input was even lower.
• The IM sensitivity analysis proved that PGA and Sa yielded comparable dispersion among the LSs and source compatibility. The dispersion for the vertical component compatibility was higher among all the other cases.
Considering the aforementioned results, it is deduced that soil-deformability and dynamic interaction may act as a fuse to pipelines response making it partially independent of supports. Also, it should be considered that soil modelling may alter the dispersion of IM, and thus nonlinear response seems definitely a better choice. Arguably, the high prob-ability of SLLS exceedance of pipelines at ag when accounting for dynamic interaction and deformable soil may not be acceptable in an LNG terminal, and thus interventions by alter-ing the boundary conditions of pipes and/or foundation type e.g. piles might improve the system performance.
Acknowledgements The work presented herein has received funding from the European Union’s Horizon 2020 research and innovation programme under the Marie Sklodowska-Curie Grant Agreement No. 721816. This support is gratefully acknowledged. The authors would also thank the reviewers for their meticulous revision and the comments that were provided.
Open Access This article is licensed under a Creative Commons Attribution 4.0 International License, which permits use, sharing, adaptation, distribution and reproduction in any medium or format, as long as you give appropriate credit to the original author(s) and the source, provide a link to the Creative Com-mons licence, and indicate if changes were made. The images or other third party material in this article are included in the article’s Creative Commons licence, unless indicated otherwise in a credit line to the material. If material is not included in the article’s Creative Commons licence and your intended use is not permitted by statutory regulation or exceeds the permitted use, you will need to obtain permission directly from the copyright holder. To view a copy of this licence, visit http://creat iveco mmons .org/licen ses/by/4.0/.

2755Bulletin of Earthquake Engineering (2020) 18:2723–2757
1 3
References
ABAQUS 6.17 (2017) Analysis user’s manual’. Online documentation help: Dassault SystèmesAl Mamun A, Saatcioglu M (2017) Seismic fragility curves for reinforced concrete frame buildings in Can-
ada designed after 1985. Can J Civ Eng 44(7):558–568. https ://doi.org/10.1139/cjce-2016-0388Anvarsamarin A, Rofooei FR, Nekooei M (2018) Soil–Structure interaction effect on fragility curve of 3D
models of concrete moment-resisting buildings. Shock Vib. https ://doi.org/10.1155/2018/72701 37ASCE (2011, n.d.) Guidelines for seismic evaluation and design of petrochemical facilities, 2nd edn. Ameri-
can Society of Civil Engineers, Reston, VA. Retrieved from ASCEASCE/SEI 7-16 (2017) Minimum design loads and associated criteria for buildings and other structures.
American Society of Civil Engineers, Reston, VA. https ://doi.org/10.1061/97807 84414 248Azizpour O, Hosseini M (2009) A verification study of ASCE recommended guidelines for seismic evalu-
ation and design of combination structures in petrochemical facilities. J Appl Sci 9(20):3609–3628. https ://doi.org/10.3923/jas.2009.3609.3628
Baltzopoulos G, Vamvatsikos D, Iervolino I (2016) Analytical modelling of near-source pulse-like seismic demand for multi-linear backbone oscillators. Earthq Eng Struct Dyn. https ://doi.org/10.1002/eqe.2729
Baltzopoulos G, Baraschino R, Iervolino I, Vamvatsikos D (2017) SPO2FRAG: software for seismic fragil-ity assessment based on static pushover. Bull Earthq Eng. https ://doi.org/10.1007/s1051 8-017-0145-3
Bedair O (2015) Rational design of pipe racks used for oil sands and petrochemical facilities. Pract Period Struct Design Constr. https ://doi.org/10.1061/(ASCE)SC.1943-5576.00002 24
Bursi OS, Reza MS et al (2019) Component fragility evaluation, seismic safety assessment and design of petrochemical plants under design-basis and beyond-design-basis accident conditions. Mid-term report, INDUSE-2-SAFETY Project, Contr. No.: RFS-PR-13056, Research Fund for Coal and Steel. https ://doi.org/10.2777/5667
Bursi OS, Reza MS, Abbiati G, Paolacci F (2015) Performance-based earthquake evaluation of a full-scale petrochemical piping system. J Loss Prev Process Ind 33:10–22. https ://doi.org/10.1016/j.jlp.2014.11.004
Bursi OS, di Filippo R, La Salandra V, Pedot M, Reza MS (2018) Probabilistic seismic analysis of an LNG subplant. J Loss Prev Process Ind. https ://doi.org/10.1016/j.jlp.2017.10.009
Butenweg C, Holtschoppen B (2014) Seismic design of industrial facilities in Germany. In: Proceedings of the international conference on seismic design of industrial facilities (SeDIF-conference). https ://doi.org/10.1007/978-3-658-02810 -7
Chaudhuri SR, Gupta VK (2002) Variability in seismic response of secondary systems due to uncertain soil properties. Eng Struct. https ://doi.org/10.1016/S0141 -0296(02)00103 -7
Chioccarelli E, Iervolino I (2010) Near-source seismic demand and pulse-like records: a discussion for L’Aquila earthquake. Earthq Eng Struct Dyn. https ://doi.org/10.1002/eqe.987
Di Sarno L, Karagiannakis G (2019) Petrochemical steel pipe rack: critical assessment of existing design code provisions and a case study. Int J Steel Struct. https ://doi.org/10.1007/s1329 6-019-00280 -w
Di Sarno L, Petrone C, Magliulo G, Cosenza E (2017) Seismic fragility of freestanding buildings con-tents modelled as rigid blocks. In: Conference: 6th international conference on computational methods in structural dynamics and earthquake engineering methods in structural dynamics and earthquake engineering. https://doi.org/10.7712/120117.5617.17865
Eads L, Miranda E, Krawinkler H, Lignos DG (2013) An efficient method for estimating the collapse risk of structures in seismic regions. Earthq Eng Struct Dyn 42(1):25–41. https ://doi.org/10.1002/eqe.2191
Elnashai AS, Di Sarno L (2015) Fundamentals of earthquake engineering: from source to fragility, 2nd edn. Wiley, New York. https ://doi.org/10.1002/97804 70024 867.fmatt er/pdf
EN 1998-1 (2004) Eurocode 8: design of structures for earthquake resistance—Part 1: general rules, seismic actions and rules for buildings. European Committee for Standardization (vol 1). [Author-ity: The European Union per Regulation 305/2011, Directive 98/34/EC, Directive 2004/18/EC]
EN 1998-3 (2004) Eurocode 8: design of structures for earthquake resistance—Part 3: assessment and retrofitting of buildings. CEN, pp 1–97
EN 1998-4 (2006) Design of structures for earthquake resistance—Part 4: Silos, tanks and pipelines [Authority: The European Union Per Regulation 305/2011, Directive 98/34/EC, Directive 2004/18/EC]
EN 1998-6 (2005) (English): design of structures for earthquake resistance—Part 6: Towers, masts and chimneys [Authority: The European Union Per Regulation 305/2011, Directive 98/34/EC, Directive 2004/18/EC]

2756 Bulletin of Earthquake Engineering (2020) 18:2723–2757
1 3
EN (2018) European commission, press release database: EU-U.S. Joint Statement of 25 July: European Union imports of U.S. Liquefied Natural Gas (LNG) are on the rise (http://europ a.eu/rapid /press -relea se_IP-18-4920_en.htm#_ftn1), Brussels, 9 Aug (2018)
EN 13480-3 (2012) EN 13480–3, 2002, Metallic Industrial Piping-Part 3: Design and Calculation. CEN, Brussels
European Parliament (2012) Directive 2012/18/EU (Seveso III) on the Control of Major-Accident Haz-ards Involving Dangerous Substances Amending and Subsequently Repealing Council Directive 96/82/EC. European Union, Bruxelles, pp 1–37
Fardis MN (2014) From performance- and displacement-based assessment of existing buildings per EN1998-3 to Design of New Concrete Structures in fib MC2010, pp 227–266
FKD (2011) Failure knowledge database. http://www.sozog aku.com/fkd/en/. Accessed 24 Apr 19Fragiadakis M, Vamvatsikos D, Aschheim M (2014) Application of nonlinear static procedures for
the seismic assessment of regular RC moment frame buildings. Earthq Spectra. https ://doi.org/10.1193/11151 1EQS2 81M
Heydari M, Mousavi M (2015) The comparison of seismic effects of near-field and far-field earthquakes on relative displacement of seven-storey concrete building with shear wall. Curr World Environ. https ://doi.org/10.12944 /cwe.10.speci al-issue 1.07
Iervolino I, Galasso C, Cosenza E (2010) REXEL: computer aided record selection for code-based seis-mic structural analysis. Bull Earthq Eng 8(2):339–362. https ://doi.org/10.1007/s1051 8-009-9146-1
Ishibashi I, Zhang X (1993) Unified dynamic shear moduli and damping patios of sand and clay. Soils Found. https ://doi.org/10.3208/sandf 1972.33.182
ISO/DIS 13033 (2013) Seismic actions on nonstructural components for building applications Basics of the calculations and calculation models
Jalayer Fati, Cornell CA (2009) Alternative non-linear demand estimation methods for probability-based seismic assessments. Earthq Eng Struct Dyn. https ://doi.org/10.1002/eqe.876
Jalayer Fatemeh, De Risi R, Manfredi G (2015) Bayesian cloud analysis: efficient structural fragility assessment using linear regression. Bull Earthq Eng. https ://doi.org/10.1007/s1051 8-014-9692-z
Karapetrou ST, Fotopoulou SD, Pitilakis KD (2015) Seismic vulnerability assessment of high-rise non-ductile RC buildings considering soil–structure interaction effects. Soil Dyn Earthq Eng. https ://doi.org/10.1016/j.soild yn.2015.02.016
Kidam K, Hurme M (2013) Analysis of equipment failures as contributors to chemical process acci-dents. Process Saf Environ Prot 91(1–2):61–78. https ://doi.org/10.1016/j.psep.2012.02.001
Krausmann E, Cruz AM, Affeltranger B (2010) The impact of the 12 May 2008 Wenchuan earth-quake on industrial facilities. J Loss Prev Process Ind 23(2):242–248. https ://doi.org/10.1016/j.jlp.2009.10.004
Kwon OS, Elnashai A (2006) The effect of material and ground motion uncertainty on the seismic vul-nerability curves of RC structure. Eng Struct. https ://doi.org/10.1016/j.engst ruct.2005.07.010
Kwon O-S, Elnashai AS (2007) Fragility analysis of a bridge with consideration of soil–structure-inter-action using multi-platform analysis. Struct Eng Res Front. https ://doi.org/10.1061/40944 (249)45
MATLAB and Statistics Toolbox Release (2018, n.d.) The MathWorks, Inc., Natick, MAMitropoulou CC, Kostopanagiotis C, Kopanos M, Ioakim D, Lagaros ND (2016) Influence of soil–struc-
ture interaction on fragility assessment of building structures. Structures. https ://doi.org/10.1016/j.istru c.2016.02.005
Fardis MN (2009) Seismic design, assessment and retrofitting of concrete buildings. In: Greek (ed) Media. Springer, Dordrecht. https ://doi.org/10.1007/978-1-4020-9842-0
Mylonakis G, Nikolaou S, Gazetas G (2006) Footings under seismic loading: analysis and design issues with emphasis on bridge foundations. Soil Dyn Earthq Eng 26(9):824–853. https ://doi.org/10.1016/j.soild yn.2005.12.005
Pacor F, Felicetta C, Lanzano G, Sgobba S, Puglia R, D’Amico M, Iervolino I (2018) NESS1: a worldwide collection of strong-motion data to investigate near-source effects. Seismol Res Lett 89(6):2299–2313. https ://doi.org/10.1785/02201 80149
Paolacci F, Giannini R, De Angelis M (2012) Analysis of the seismic risk of major-hazard industrial plants and applicability of innovative seismic protection systems. In: Petrochemicals (InTech). https://doi.org/10.5772/38365
Pecker A (2014) Overview of seismic regulations for french industrial facilities. In: Proceedings of the international conference on seismic design of industrial facilities (SeDIF-conference). https ://doi.org/10.1007/978-3-658-02810 -7
Peña Ruiz D, Guzmán Gutiérrez S (2015) Finite element methodology for the evaluation of soil damp-ing in LNG tanks supported on homogeneous elastic halfspace. Bull Earthq Eng. https ://doi.org/10.1007/s1051 8-014-9655-4
2757Bulletin of Earthquake Engineering (2020) 18:2723–2757
1 3
Raychowdhury P, Ray-Chaudhuri S (2015) Seismic response of nonstructural components supported by a 4-story SMRF: effect of nonlinear soil–structure interaction. Structures. https ://doi.org/10.1016/j.istru c.2015.04.006
Sáez E, Lopez-Caballero F, Modaressi-Farahmand-Razavi A (2011) Effect of the inelastic dynamic soil–structure interaction on the seismic vulnerability assessment. Struct Saf. https ://doi.org/10.1016/j.strus afe.2010.05.004
Salem YS, Tiffany Yoo PE, Gad GM, Cho JS (2019) Analytical fragility curves for pipe rack structure. In: Advances and challenges in structural engineering, pp 292–306. https://doi.org/10.1007/978-3-030-01932-7_23
Salimi Firoozabad E, Jeon BG, Choi HS, Kim NS (2015) Seismic fragility analysis of seismically isolated nuclear power plants piping system. Nucl Eng Des. https ://doi.org/10.1016/j.nucen gdes.2014.12.012
SeismoSoft (2019) A computer program for static and dynamic nonlinear analysis of framed structures. Available from http://www.seism osoft .com
Soules JG, Bachman RE, Silva JF (2016a) Chile earthquake of 2010: assessment of industrial facilities around concepción. American Society of Civil Engineers, Reston. https ://doi.org/10.1061/97807 84413 647
Soules JG, Bachman RE, Silva JF (2016b) Chilean Standard NCh2369.Of2003: earthquake-resistant design of industrial structures and facilities source. In: Chile Earthquake of 2010. https ://doi.org/10.1061/97807 84413 647.ap02
Tsinidis G (2015) On the seismic design and behaviour of tunnels. Doctoral thesis. Aristotle University of Thessaloniki. Retrieved from http://hdl.handl e.net/10442 /hedi/36086 . Accessed 30 Apr 2019
Tsonis G, Fardis MN (2014) Seismic fragility curves for reinforced concrete buildings and bridges in Thessaloniki. In: Second European conference on earthquake engineering and seismology, Istanbul. 25–29 Aug 2014
Vamvatsikos D, Allin Cornell C (2002) Incremental dynamic analysis. Earthq Eng Struct Dyn 31(3):491–514. https ://doi.org/10.1002/eqe.141
Vathi M, Karamanos SA, Kapogiannis IA, Spiliopoulos KV (2017) Peformance criteria for liquid stor-age tanks and piping systems subjected to seismic loading. J Press Vessel Technol. https ://doi.org/10.1115/1.40369 16
Wang X, Zhou Q, Zhu K, Shi L, Li X, Wang H (2017) Analysis of seismic soil–structure interac-tion for a nuclear power plant (HTR-10). Sci Technol Nuclear Install 2017:1–13. https ://doi.org/10.1155/2017/23584 03
Publisher’s Note Springer Nature remains neutral with regard to jurisdictional claims in published maps and institutional affiliations.