Embed Size (px)
Citation preview
1
On the Role of Relative Prices and Capital Flows in Balance-of-Payments Constrained
Growth: the Experiences of Portugal and Spain in the Euro Area
Carlos Garcimartín Luis Rivas
Pilar García Martínez WP05/10

2
3
Resumen Pese al respaldo empírico con el que ha contado la teoría de la restricción externa desarro-llada a partir del modelo de Thirlwall, éste muestra algunas deficiencias destacadas en la literatura. En nuestra opinión, dos de ellas merecen ser analizadas. Por un lado, la necesi-dad de incorporar desequilibrios transitorios de la balanza de pagos y los consiguientes flujos de capital. Por otro, creemos los precios relativos pueden desempeñar un papel im-portante en el comercio exterior, sin que ello invalide la existencia de una restricción ex-terna. El objetivo del presente trabajo consiste en desarrollar un modelo que incorpore ambas cuestiones, permitiendo, así, un mayor protagonismo a los precios relativos y a los desequilibrios temporales de la balanza de pagos. Este modelo se emplea posteriormente para analizar la evolución de las economías española y portuguesa en las últimas décadas y, en especial, las diferencias mostradas desde su incorporación a la Eurozona. Palabras clave: Crecimiento, restricción externa, tipo de cambio.
Abstract Broadly speaking, the balance-of-payments constraint hypothesis as developed by Thirl-wall has been empirically supported. Yet, it shows some shortcomings highlighted in the literature. In our opinion, two of them must be analysed. First, temporary disequilibria and capital flows must be incorporated into the balance-of-payments constrained growth models. Second, the role of relative prices must be made explicit, since it can be relevant even in an external constraint framework. This study is aimed at developing a model that incorporates both possibilities: temporary external disequilibria and a the impact of relati-ve prices. This model is subsequently used to analyse the evolution of the Spanish and Portuguese economies in last decades, and, in particular, the different path shown by both countries since their accession to the Eurozone. Key words: Growth, balance of payments constraint, exchange rate. Carlos Garcimartín Universidad Rey Juan Carlos [email protected] Luis Rivas IE University [email protected] Pilar García Martínez Universidad de Salamanca [email protected] Instituto Complutense de Estudios Internacionales, Universidad Complutense de Madrid. Campus de Somo-saguas, Finca Mas Ferre. 28223, Pozuelo de Alarcón, Madrid, Spain.
© Carlos Garcimartín, Luis Rivas, Pilar García Martínez
ISBN: 978-84-693-1512-5 Depósito legal: El ICEI no comparte necesariamente las opiniones expresadas en este trabajo, que son de exclusiva responsabilidad de sus autores/as.

4

5
Index 1. Introduction……………………………………………………………………………………7 2. Thirlwall’s Law and its Limits ……………….……………………...………………………...7 3. An Augmented BoP Constrained Growth Model ..…………………………………………...9 4. An Application of the Model. Portugal and Spain in the
Euro Area: An Opposite Experience………………………………….……………………...10 5. Concluding remarks………………………………………………………………………….17 Appendix 1..…………………………………………………………………………………..19 Appendix 2……………………………………………………………………………………20 Bibliographical references…………………………………………………………………….21

6

7
1. Introduction One of the primary aims of growth theory has been to explain why growth rates differ across countries and over time. According to the neo-classical approach, these differences could be explained by the diversity of the growth rates of inputs that make up the production func-tion. Yet, endogenous growth theorists stress the role played by this function. They argue that not only does growth vary across coun-tries due to dynamic resource endowment; it also varies, to an important extent, on the form of the production function. Although a shared shortcoming of this approaches is the fact that both are supply-side oriented: as long as resources are available, growth will materi-alize and demand will play a minor role, if any. However, demand matters for an open econ-omy. In order to grow, not only are inputs to production necessary; but there also must be a market in which to sell goods.1 Due to the structure of consumption, a country cannot consume every new good produced; instead, some new goods must be exchanged for other goods, which better fit domestic demand. Since, in a pure neo-classical framework, every country can sell goods produced at the inter-national price, this fact adds nothing new to the standard one-sector theory. But if price elasticity is not infinite, the country must re-duce either the selling price — thus worsening the terms of trade — or the potential output. In both cases growth depends on demand, in value terms in the former and in quantity terms in the latter. In contrast to neo-classical and endogenous growth theories, the Keynesian approach to growth considers that the exogenous variable is not the amount of inputs, but the quantity of output, which in turn determines the level of employment. One the most fruitful Keynes-ian-oriented growth approaches is the balance-of-payments (BoP) constrained growth theory developed by Thirlwall (1979). According to this theory, since relative prices do not play an important role in international trade, and the BoP must be in equilibrium in the long run, growth is BoP constrained.
1 By ‘open economy’ we do not mean only countries, but also regions, cities, districts and almost any form of collective organi-sation. For the sake of simplicity, in this paper we call open economies countries.
Despite its empirical support, Thirlwall model shows some deficiencies. While these are noted in the literature, two must be high-lighted here. First, although in the long run the BoP must be in equilibrium, short-and-mid-run disequilibria are permitted in the real world and this must be incorporated into the model; otherwise the empirical testing of the theory can lead to a misinterpretation of the results. Second, the role of relative prices is oversimplified. Contrary to Thirlwall’s theory, an economy may be BoP constrained while, at the same time, relative prices impact growth. In this paper we intend to develop an aug-mented Thirlwall model in order to overcome the deficiencies mentioned above. Our model gives a more important role to both BoP dis-equilibria and relative prices. The model is tested against the cases of Spain and Portugal for several reasons. First, both Spain and Por-tugal are BoP constrained. Second, both coun-tries have experienced major changes in their external sector following their respective ac-cessions to the European Union (EU) and the European Monetary Union (EMU). According to Thirlwall´s theory, and most of the models inspired by it, it is irrelevant to long-run growth whether an economy uses an inde-pendent or a common currency. As we shall see, this is not the case, at least not for the Iberian countries. Finally, since Spain and Portugal adopted the euro, the Spanish and Portuguese economies have followed an oppo-site path, due to reasons closely related to what our model predicts.
2. Thirlwall’s Law and its Limits
The BoP constraint theory originally developed by Thirlwall is built upon the following set of equations:
MP*,=XP (1)
*Y)*P
PA(=X εγ ,(2)
,Y)*P
PB(=M πη (3)
where X and M denote export and import volume, respectively; P and P* stand for domestic and foreign price level, respectively,

8
both expressed in a common currency; Y* and Y represent world and domestic income, respectively; A and B are constants, η and γ are price elasticities of imports and exports, respectively; and and are import and export income elasticities, respectively. Taking logs and time derivatives and plugging the dynamic version of (2) and (3) into (1) we obtain the rate of growth of income consistent with trade balance equilibrium
(4) If relative prices do not matter, that is, if
equals zero, then
(5) This expression is known as Thirlwall’s law. It states that long-run growth depends only on external income growth multiplied by the ratio of income export-to-import elasticities. Therefore, in order to grow above this rate, a country must be able to improve income elasticities. Otherwise, increases to inputs will have no impact on growth. The law has been tested in many works. In Thirlwall’s pioneering study, it was tested by applying the Spearman’s rank correlation coefficient to the actual and the hypothetical growth rate (calculated according to (5)). However, following criticism by McGregor and Swales (1985), the law was tested by regressing hypothetical growth on actual growth. If Thirlwall’s law holds, the intercept should equal zero and the hypothetical growth coefficient should equal one. Generally speaking, the empirical work supports Thirlwall’s law (McGregor and Swales, 1985, 1986 and 1991; Bairam, 1988; Bairam and Dempster, 1991; MacCombie, 1989 and 1992; and Sonmez Atesoglu, 1993, 1994 and 1995). However, it is important to note the basic assumptions of Thirlwall’s model and the criticism of each, since these critiques have been useful in developing further extensions of the model. Thus, the first crucial assumption is contained in equation (1). It states that the BoP must be in equilibrium. This is a plausible hypothesis in the long run but not in the short run. In practice, there is no objective way to distinguish between short and long run, two concepts that, in addition, may change across countries. For example, suppose that we test the
law in a certain country by regressing the actual growth rate on a theoretical growth rate, and the result is a deviation. We can not conclude from this evidence that Thilwall’s model is unsound if the possibility of temporary BoP disequilibria is accepted. The economy can be long-run BoP constrained but not, for example, in the last five years of our sample, so our results will be biased. For this reason, capital flows and BoP disequilibria must be incorporated into the model. Indeed, Thirlwall himself presented three years later an extended version of his original model (Thirlwall and Hussain, 1982). In this extended version, capital inflows are incorporated into the model by adding a new term to equation (1). It must be noted that allowing disequilibria through this addition does not invalidate the BoP constraint theory, since capital inflows are not endogenous to potential growth. It simply means that the external constraint can be relaxed for an economy in a certain moment in time. In fact, what Thirlwall and Hussain found is that the sample countries were BoP constrained, but the growth rates estimated using the new extended model aligned more closely to actual rates than did the old ones. Other extended versions in the same line were developed by Elliot and Rhodd (1999), Hussain (2000), Moreno-Brid (1998, 2001 and 2003) and Britto and McCombie (2009), finding new evidence to support the BoP constraint theory. The second crucial assumption of Thirlwall model relates to relative prices. According to Thirlwall, relative prices do not play a role in long-run growth for two reasons, which are, to some extent, incompatible. The first is the stability of relative prices in the long run, so that PPP theory holds. The second is that price elasticities are very small in absolute terms, so the expression (1+γ+η) is close to zero. It is only by assuming the former that equation (4) becomes equation (5). Yet, as Alonso and Garcimartín (1998) noted, this is a strong assumption and, furthermore, it is not necessary. Relative prices may play a role and the economy can still be BoP constrained. What is relevant to the theory is not if relative prices have an impact on growth but whether or not they are endogenous to BoP disequilibria. If relative prices decrease in the presence of a deficit, then the neo-classical approach to growth is correct and growth will not be BoP constrained. But, if they are exogenous, the mentioned approach will be incorrect. In the Alonso and Garcimartín’s
9
sample of ten OECD countries, they found that relative prices were exogenous in all cases. On the contrary, they argued, the crucial test to the BoP constrained theory is whether or not income (and not prices) adjusts to BoP disequilibria. And this was the case for eight of ten countries in the sample. Other works, using cointegration techniques, also have tested for the long-run adjustment of actual income to BoP constrained income (Alonso, 1999; Bagnai, 2008; and Britto and McCombie, 2009), while other studies have explicitly tested the adjustment of income to BoP disequilibria (Garcimartín et al., 2008). Both critiques are important and must be incorporated into any extension of Thirlwall´s model. This means that 1) capital flows must play a role in relaxing (temporarily) the BoP constraint; 2) although it does not invalidate the BoP constraint hypothesis, relative prices can influence growth, at least in the short-run and, therefore, the model must take this effect into account; and 3) in order not to reject the BoP constraint hypothesis, it must be shown that income adjusts to external disequilibria. In the next section we build a BoP constraint model based on these three premises. Then, we test the model by applying it to two case economies: Spain and Portugal. As we demons-trate, the converse performance of these economies can be explained in terms of the BoP constraint theory. In order to do this, an important role must be given to relative prices.
3. An Augmented BoP Con-strained Growth Model
As stated in the previous section, our aim is to develop a model that incorporates capital in-flows, allows relative prices to play a role, and tests whether or not income adjusts to BoP disequilibria. This model is presented in the following five equations2. Each equation repre-sents the adjustment path of the relevant vari-able to its partial equilibrium level, so the sig-nificance of parameter αi is crucial to validate the equilibrium equations3.
2 Lower-case letters denote logs, and a dot on top of the variables indicates the derivative with respect to time. 3 See Gandolfo (1981) for a detailed description of the analysis and econometric estimation of differential equation systems.
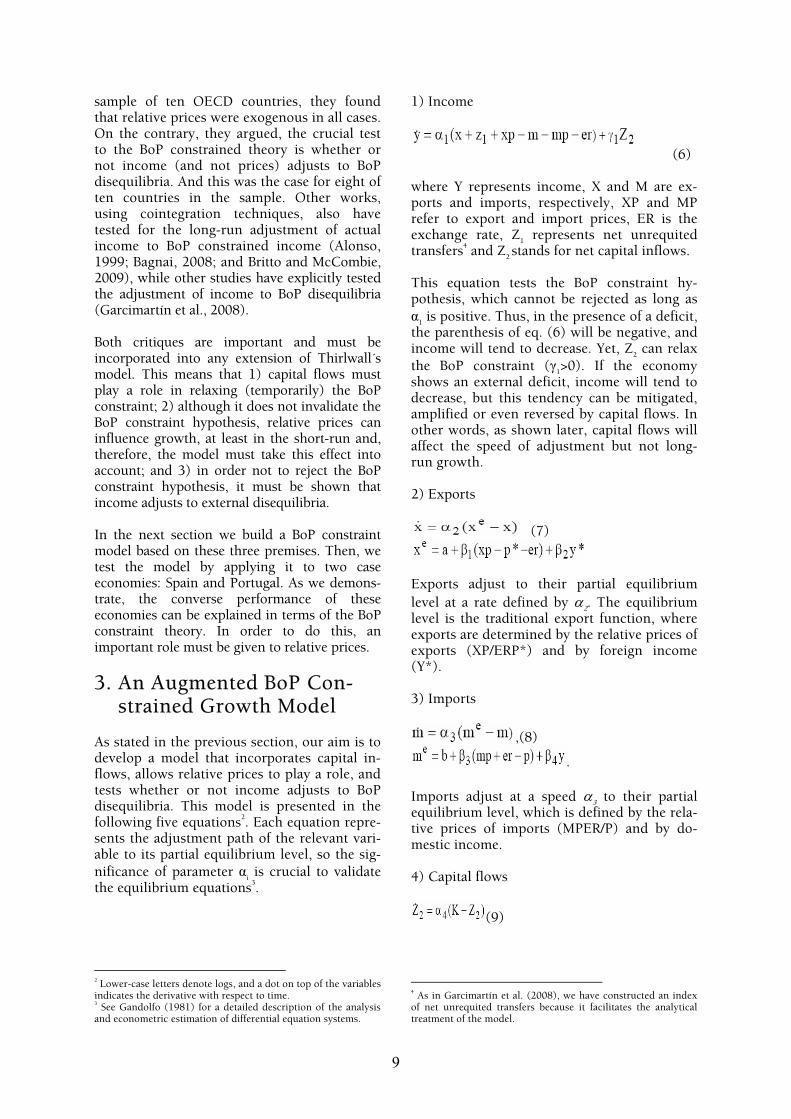
1) Income
(6) where Y represents income, X and M are ex-ports and imports, respectively, XP and MP refer to export and import prices, ER is the exchange rate, Z1 represents net unrequited transfers4 and Z2 stands for net capital inflows. This equation tests the BoP constraint hy-pothesis, which cannot be rejected as long as α1 is positive. Thus, in the presence of a deficit, the parenthesis of eq. (6) will be negative, and income will tend to decrease. Yet, Z2 can relax the BoP constraint (γ1>0). If the economy shows an external deficit, income will tend to decrease, but this tendency can be mitigated, amplified or even reversed by capital flows. In other words, as shown later, capital flows will affect the speed of adjustment but not long-run growth. 2) Exports
(7)
Exports adjust to their partial equilibrium level at a rate defined by α2. The equilibrium level is the traditional export function, where exports are determined by the relative prices of exports (XP/ERP*) and by foreign income (Y*). 3) Imports
,(8)
. Imports adjust at a speed α3 to their partial equilibrium level, which is defined by the rela-tive prices of imports (MPER/P) and by do-mestic income. 4) Capital flows
(9)
4 As in Garcimartín et al. (2008), we have constructed an index of net unrequited transfers because it facilitates the analytical treatment of the model.

10
Capital flows find equilibrium at a speed α4. That equilibrium is a constant, than can differ across countries and can be zero. What is rele-vant for an economy to be BoP constrained is that capital flows do not adjust to BoP disequi-libria (at least, not in the long run). In other words, external deficits cannot be permanently financed by capital inflows. 5) Exchange rate
,(10)
. First, we consider prices in domestic curren-cies as exogenous. Second, the exchange rate is assumed to adjust to its equilibrium level at a speed α5. This equilibrium is the PPP exchange rate plus a constant, since there may be per-manent deviations from PPP due to the pres-ence of non-tradable goods or barriers to trade. In addition, capital flows can influence the speed of adjustment of the exchange rate, but not its equilibrium level. Thus, if the exchange rate is above its equilibrium, it will tend to converge toward it, but this path can be miti-gated, amplified or even reversed by capital flows. These will not affect the long-run ex-change rate but can influence short-run devia-tions. The steady-state rate of growth of income in this model is5
4
*y2zPPPmpp3
4
PPPpxp1mpxpy
1)(
)()(
β
λβ+λ+λ−λ−λβ
+β
λ−λ−λβ+λ−λ=λ
∗
(11) where i stands for the steady-state growth rate of variable i. This expression can be inter-preted as follows. First, in the long run income is BoP constrained, since capital flows do not permanently finance external deficits. In fact, if prices do not play any role, this expression becomes
4
*y2y β
λβ=λ
, which is Thirlwall’s
law. Therefore, capital flows may influence income in the short-run but not in the long-run. Since capital flows are constant in the long-run, if K is positive and the model is sta-
5 See Appendix I.
ble, the BoP will show a deficit; and income (though not the rate of growth of income) will be above the level compatible with external equilibrium. Second, prices do not play a role as long as the exchange rate adjusts to its PPP value. Other-wise, prices have an impact on growth (if the Marshall-Lerner condition holds). This means, for example, that exchange-rate policies can influence (positively or negatively) growth, as long as they are able to maintain the exchange rate deviation with respect to its PPP value. What is important is that even if prices play a role, this does not imply that the BoP theory does not hold. This becomes important in ex-plaining the recent economic performance of Portugal and Spain. Finally, note that if ex-change rates perfectly adjust to their PPP val-ues, then equation (11) becomes Thirlwall’s law. In sum, the model presented above differs from the standard Thirlwall’s model in the relevance given to capital flows in the income and exchange rate adjustment paths, and the role that relative prices can play. Capital in-flows can slow down BoP adjustment, and growth can be maintained above its long-term rate for a longer period of time. At the same time, capital inflows can slow down the ex-change rate adjustment, thus penalising growth. On the contrary, capital outflows, in the presence of an external deficit, can con-strain growth to a greater degree, while simul-taneously facilitating an exchange rate adjust-ment, fueling exports and fostering growth. In the next section we show that this double ef-fect of capital flows is crucial to understanding the two different types of BoP constrained growth recently experienced in Portugal and Spain.
4. An Application of the Mo-del. Portugal and Spain in the Euro Area: An Opposite Experience
The Spanish and Portuguese economies ex-perienced similar performance in the decades leading up to entry into the euro area. Trade barriers were reduced, fiscal and monetary conditions improved and income per head had been approaching the European average. As a consequence of the modernisation of these economies, both countries met the so-called

11
Figure 2. Goods and services; BoP(% GDP)
-12.0
-10.0
-8.0
-6.0
-4.0
-2.0
0.0
2.0
1994 1995 1996 1997 1998 1999 2000 2001 2002 2003 2004 2005 2006 2007
SpainPortugal
Source: World Bank
Maastricht criteria and gained access to the euro area in 1999 with the first group of coun-tries that adopted the euro as the common European currency. However, since joining, each economy has responded differently: while Portugal has suf-fered a deep stagnation, Spain has experienced a significant boost. Between 1995 and 1999 GDP grew 4.1% per year in Portugal and 3.3% in Spain, while between 1999 and 2007 the annual GDP growth rate declined to 1.4% in Portugal but increased to 3.6% in Spain. The
gap between both countries was even larger between 2002 to 2007: 3.4% in Spain and 0.9% in Portugal (Figure 1). Regarding the BoP (goods and services), be-tween 1995 and 1998 – just prior to joining the EMU – Spain exhibited a small surplus (0.3% of GDP), while Portugal experienced a large deficit (7.6% of GDP). Yet, from 1999 onwards, the Spanish surplus turned into a high deficit, while the Portuguese deficit de-creased. By 2007 the BoP outcome for both countries was similar (Figure 2). 6
6 See Lane and Milesi-Ferreti (2006) for a detailed analysis of the Spanish and Portuguese BoP outcome during the period be-tween 1995 and 2004.
Figure 1. GDP growth rate
-1.0
0.0
1.0
2.0
3.0
4.0
5.0
6.0
1994 1995 1996 1997 1998 1999 2000 2001 2002 2003 2004 2005 2006 2007
SpainPortugal
Source: World Bank
12
Why have these countries shown such con-trary performance since joining the EMU? Why has Spain experienced an economic boom unknown since the 1960s, while Portu-gal has suffered such a long-lasting stagnation? The augmented BoP constrained growth model presented above helps answer these questions. Our hypothesis is twofold. On the one hand, both economies are BoP constrained. On the other, the EMU has amplified their respective economic cycles. Spain has exhibited growth over a longer period of time because capital inflows have financed BoP deficits during a longer timeframe than usual, since no cur-rency devaluation was expected. Portugal, on the contrary, has experienced a longer-than-usual stagnation because the return to BoP equilibrium has taken a longer time than usual, since no devaluation — which could improve the BoP outcome — has occurred. Both countries joined the euro in different phases of their respective BoP cycles: Spain was close to equilibrium, while Portugal had a large deficit. In addition, as we shall see below, while the conversion rate of the Spanish cur-rency against the euro was close to its PPP value, the Portuguese currency was converted at a notably appreciated rate with respect to its PPP value. Before presenting the results of our estimates, some remarks must be made. First, a dummy, accounting for the effect of the accession to the European Union, has been included in export and import equations (μ1 and μ2, re-spectively). It takes the value of one from 1986 onwards. Second, another dummy (γ3) for the EMU has been incorporated into the capital flows equation, since investors no longer face exchange rate risk, and therefore flows are expected to be more stable. Third, another dummy (μ3) for the European Monetary Sys-tem has been introduced in the exchange rate equation. Fourth, equations 1-4 are jointly estimated, while equation 5 is estimated sepa-rately.7 This is due to the fact that, since 1999, national currencies have been replaced by the euro, so national exchange rates no longer exist. Fifth, the estimation period is from 1975 to 2007, with the exception of the exchange rate equation, which covers the period be-tween 1975 and1998.8
7 Therefore, this equation is similar to a single equation error correction model. 8 The model was estimated using the FIML program “RE-SIMUL,” developed by Clifford Wymer. See Appendix II for the definition and sources of variables. The Carter-Nagar system R2
W statistic (Carter and Nagar, 1977) is 0.55 for Portugal and 0.28
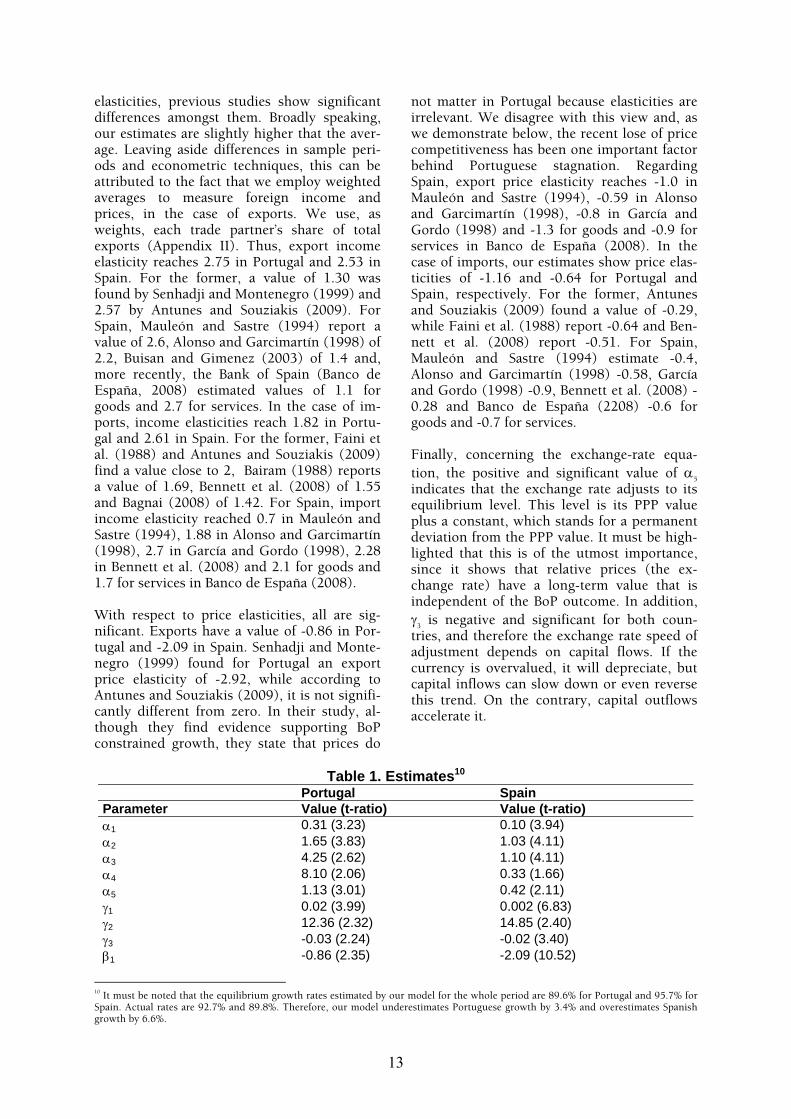
Adjustment parameters are significant to a 95% probability, except α4 in Spain, whose level of significance is 90%. Further, each pa-rameter has the anticipated sign, so all en-dogenous variables adjust to their long-run equilibrium levels (Table 1). In particular, the positive sign of α1 indicates that both econo-mies are BoP constrained rather than resource constrained, and therefore one of the essential hypotheses of this study cannot be rejected. In addition, γ1 is positive and significant in both countries, which means that capital flows in-fluence the speed of adjustment for income; that is, its short-run rate of variation, but not its long-run growth rate. If capital flows to a country experiencing a BoP deficit, income can grow beyond equilibrium. Similarly, if capital flows out of the country, the adjustment of income will be faster. But, capital flows do not change the long-run income growth rate. This is due to the fact that the long-run value of capital flows is a constant (k), which is posi-tive for Portugal and not significantly different from zero for Spain. In addition, γ2 is positive and significant in both countries, which im-plies that the speed of adjustment of capital flows to equilibrium has been reduced since the introduction of the euro. In other words, if capital inflows are above the equilibrium level, they will decrease (though, since 1999, the speed of this decrease has declined. This is probably due to the lack of an exchange rate). Regarding trade functions, price and income elasticities are significant and show the ex-pected sign in both countries, while the EU dummy is only significant in Portugal and shows a negative value in the case of imports (at a 90% significance level).9 Of importance, price elasticities (β1 and β3, for exports and imports, respectively) are negative, and the term (1+γ+η) lies below zero in both countries: -1.02 in Portugal and -1.73 in Spain. There-fore, the Marshall-Lerner condition holds: relative prices matter. This does not invalidate the BoP constrained growth theory as long as income adjusts to BoP disequilibria. As stated above, this has been the case for the Iberian countries. With regard to the absolute values of trade
for Spain and, since the value of the 2 at a 99% significance level is 30.6, the hypothesis that the model is not consistent with the data must be rejected in both cases. 9 It must be noted that Bagnai (2008) did not find any structural break in import function either for Portugal or for Spain.
13
elasticities, previous studies show significant differences amongst them. Broadly speaking, our estimates are slightly higher that the aver-age. Leaving aside differences in sample peri-ods and econometric techniques, this can be attributed to the fact that we employ weighted averages to measure foreign income and prices, in the case of exports. We use, as weights, each trade partner’s share of total exports (Appendix II). Thus, export income elasticity reaches 2.75 in Portugal and 2.53 in Spain. For the former, a value of 1.30 was found by Senhadji and Montenegro (1999) and 2.57 by Antunes and Souziakis (2009). For Spain, Mauleón and Sastre (1994) report a value of 2.6, Alonso and Garcimartín (1998) of 2.2, Buisan and Gimenez (2003) of 1.4 and, more recently, the Bank of Spain (Banco de España, 2008) estimated values of 1.1 for goods and 2.7 for services. In the case of im-ports, income elasticities reach 1.82 in Portu-gal and 2.61 in Spain. For the former, Faini et al. (1988) and Antunes and Souziakis (2009) find a value close to 2, Bairam (1988) reports a value of 1.69, Bennett et al. (2008) of 1.55 and Bagnai (2008) of 1.42. For Spain, import income elasticity reached 0.7 in Mauleón and Sastre (1994), 1.88 in Alonso and Garcimartín (1998), 2.7 in García and Gordo (1998), 2.28 in Bennett et al. (2008) and 2.1 for goods and 1.7 for services in Banco de España (2008). With respect to price elasticities, all are sig-nificant. Exports have a value of -0.86 in Por-tugal and -2.09 in Spain. Senhadji and Monte-negro (1999) found for Portugal an export price elasticity of -2.92, while according to Antunes and Souziakis (2009), it is not signifi-cantly different from zero. In their study, al-though they find evidence supporting BoP constrained growth, they state that prices do
not matter in Portugal because elasticities are irrelevant. We disagree with this view and, as we demonstrate below, the recent lose of price competitiveness has been one important factor behind Portuguese stagnation. Regarding Spain, export price elasticity reaches -1.0 in Mauleón and Sastre (1994), -0.59 in Alonso and Garcimartín (1998), -0.8 in García and Gordo (1998) and -1.3 for goods and -0.9 for services in Banco de España (2008). In the case of imports, our estimates show price elas-ticities of -1.16 and -0.64 for Portugal and Spain, respectively. For the former, Antunes and Souziakis (2009) found a value of -0.29, while Faini et al. (1988) report -0.64 and Ben-nett et al. (2008) report -0.51. For Spain, Mauleón and Sastre (1994) estimate -0.4, Alonso and Garcimartín (1998) -0.58, García and Gordo (1998) -0.9, Bennett et al. (2008) -0.28 and Banco de España (2208) -0.6 for goods and -0.7 for services. Finally, concerning the exchange-rate equa-tion, the positive and significant value of α5
indicates that the exchange rate adjusts to its equilibrium level. This level is its PPP value plus a constant, which stands for a permanent deviation from the PPP value. It must be high-lighted that this is of the utmost importance, since it shows that relative prices (the ex-change rate) have a long-term value that is independent of the BoP outcome. In addition, γ3 is negative and significant for both coun-tries, and therefore the exchange rate speed of adjustment depends on capital flows. If the currency is overvalued, it will depreciate, but capital inflows can slow down or even reverse this trend. On the contrary, capital outflows accelerate it.
Table 1. Estimates10
Portugal Spain Parameter Value (t-ratio) Value (t-ratio) α1 0.31 (3.23) 0.10 (3.94) α2 1.65 (3.83) 1.03 (4.11) α3 4.25 (2.62) 1.10 (4.11) α4 8.10 (2.06) 0.33 (1.66) α5 1.13 (3.01) 0.42 (2.11) γ1 0.02 (3.99) 0.002 (6.83) γ2 12.36 (2.32) 14.85 (2.40) γ3 -0.03 (2.24) -0.02 (3.40) β1 -0.86 (2.35) -2.09 (10.52)
10 It must be noted that the equilibrium growth rates estimated by our model for the whole period are 89.6% for Portugal and 95.7% for Spain. Actual rates are 92.7% and 89.8%. Therefore, our model underestimates Portuguese growth by 3.4% and overestimates Spanish growth by 6.6%.
14
Figure 3. Net capital inflows (1975 constant $. Billions.)
-10
0
10
20
30
40
50
60
70
80
1990 1991 1992 1993 1994 1995 1996 1997 1998 1999 2000 2001 2002 2003 2004 2005 2006 2007
-3
-2
-1
0
1
2
3
4
5
6
7
Spain (left axis)
Portugal (rightaxis)
Source: World Bank
Portugal Spain Parameter Value (t-ratio) Value (t-ratio) β2 2.75 (13.99) 2.53 (42.18) β3 -1.16 (6.95) -0.64 (5.97 β4 1.82(22.88) 2.61 (28.88) μ1 0.20 (5.70) n.s. μ2 -0.02 (1.85) n.s. μ3 -0.31 (4.06) -0.05 (1.79) k 0.85 (2.67) n.s. δ 0.68 (20.62) 0.45 (6.76)
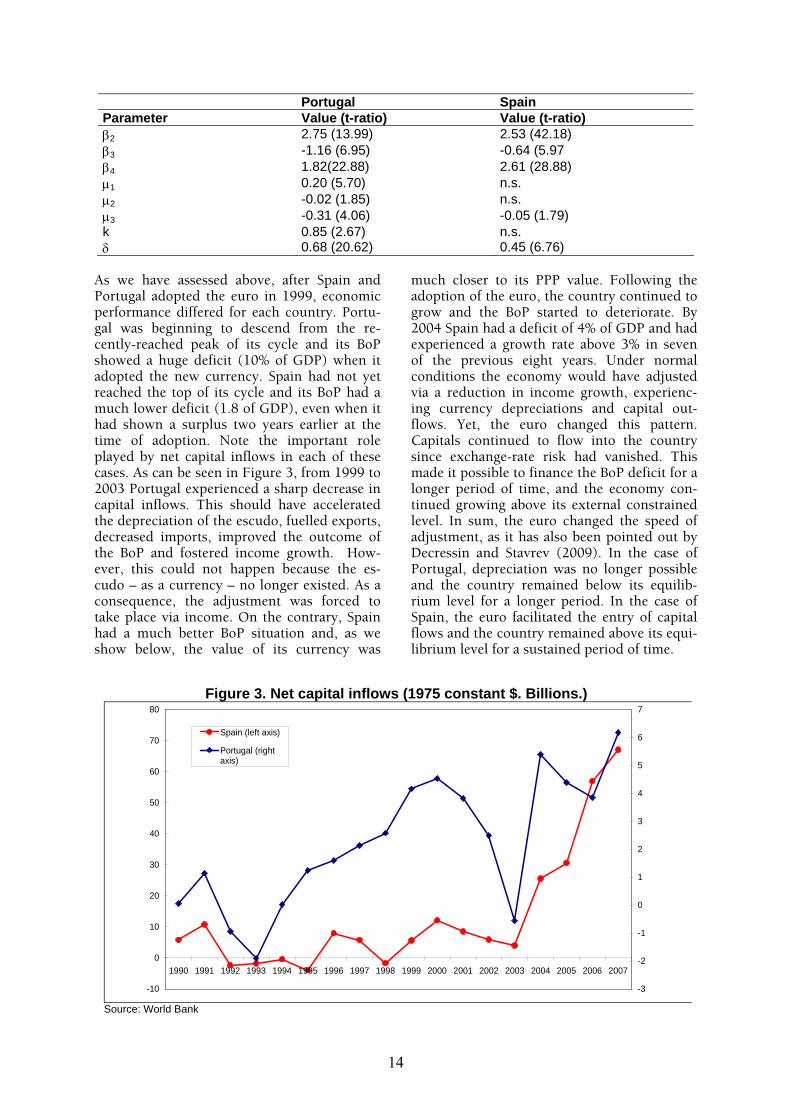
As we have assessed above, after Spain and Portugal adopted the euro in 1999, economic performance differed for each country. Portu-gal was beginning to descend from the re-cently-reached peak of its cycle and its BoP showed a huge deficit (10% of GDP) when it adopted the new currency. Spain had not yet reached the top of its cycle and its BoP had a much lower deficit (1.8 of GDP), even when it had shown a surplus two years earlier at the time of adoption. Note the important role played by net capital inflows in each of these cases. As can be seen in Figure 3, from 1999 to 2003 Portugal experienced a sharp decrease in capital inflows. This should have accelerated the depreciation of the escudo, fuelled exports, decreased imports, improved the outcome of the BoP and fostered income growth. How-ever, this could not happen because the es-cudo – as a currency – no longer existed. As a consequence, the adjustment was forced to take place via income. On the contrary, Spain had a much better BoP situation and, as we show below, the value of its currency was
much closer to its PPP value. Following the adoption of the euro, the country continued to grow and the BoP started to deteriorate. By 2004 Spain had a deficit of 4% of GDP and had experienced a growth rate above 3% in seven of the previous eight years. Under normal conditions the economy would have adjusted via a reduction in income growth, experienc-ing currency depreciations and capital out-flows. Yet, the euro changed this pattern. Capitals continued to flow into the country since exchange-rate risk had vanished. This made it possible to finance the BoP deficit for a longer period of time, and the economy con-tinued growing above its external constrained level. In sum, the euro changed the speed of adjustment, as it has also been pointed out by Decressin and Stavrev (2009). In the case of Portugal, depreciation was no longer possible and the country remained below its equilib-rium level for a longer period. In the case of Spain, the euro facilitated the entry of capital flows and the country remained above its equi-librium level for a sustained period of time.
15
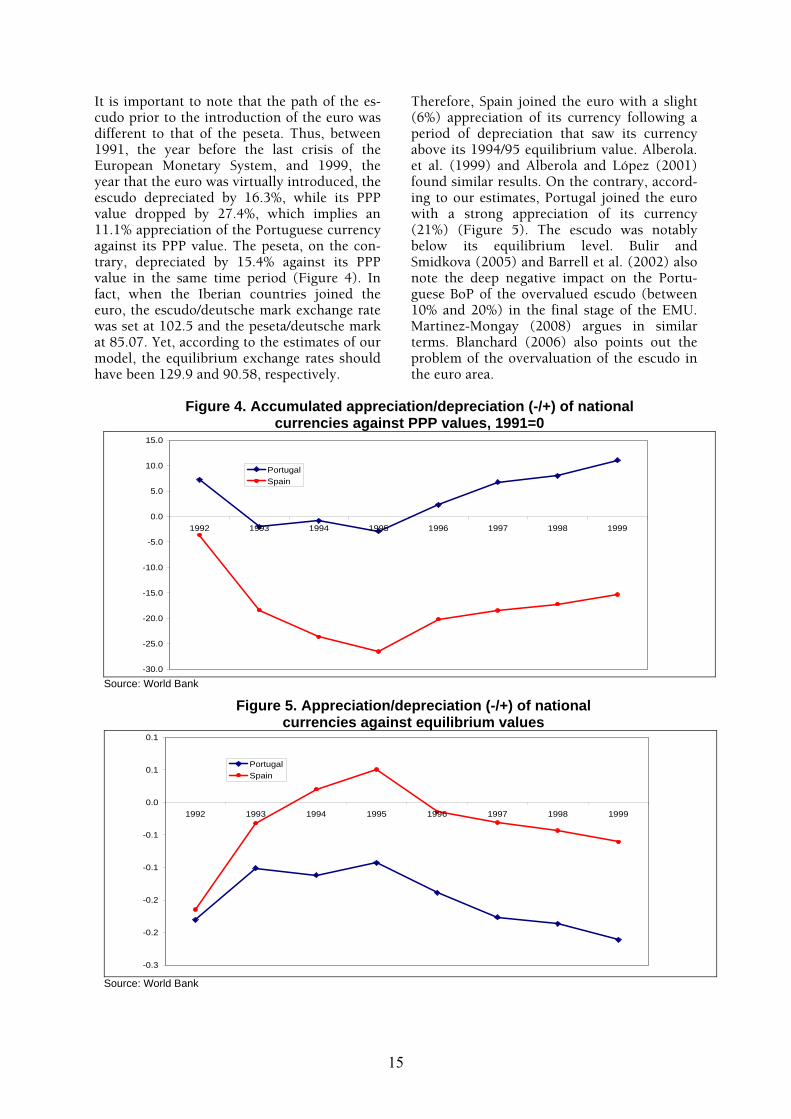
Figure 4. Accumulated appreciation/depreciation (-/+) of national currencies against PPP values, 1991=0
-30.0
-25.0
-20.0
-15.0
-10.0
-5.0
0.0
5.0
10.0
15.0
1992 1993 1994 1995 1996 1997 1998 1999
PortugalSpain
Source: World Bank
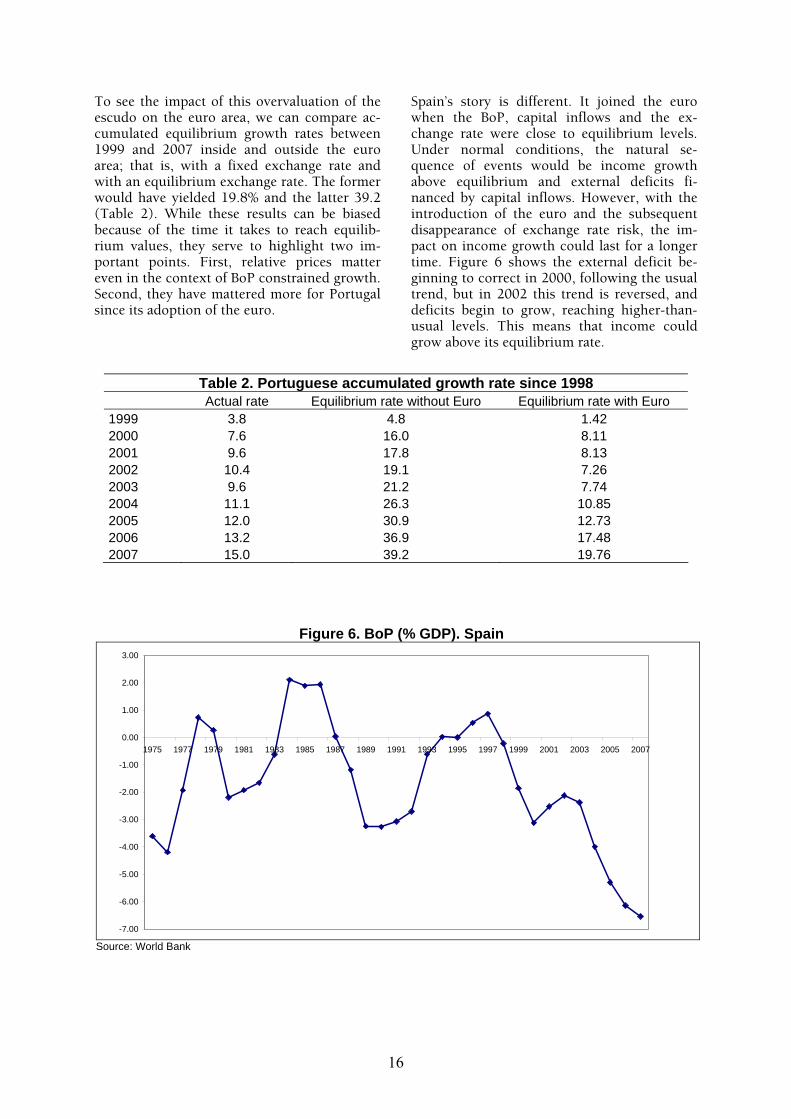
Figure 5. Appreciation/depreciation (-/+) of national currencies against equilibrium values
-0.3
-0.2
-0.2
-0.1
-0.1
0.0
0.1
0.1
1992 1993 1994 1995 1996 1997 1998 1999
PortugalSpain
Source: World Bank
It is important to note that the path of the es-cudo prior to the introduction of the euro was different to that of the peseta. Thus, between 1991, the year before the last crisis of the European Monetary System, and 1999, the year that the euro was virtually introduced, the escudo depreciated by 16.3%, while its PPP value dropped by 27.4%, which implies an 11.1% appreciation of the Portuguese currency against its PPP value. The peseta, on the con-trary, depreciated by 15.4% against its PPP value in the same time period (Figure 4). In fact, when the Iberian countries joined the euro, the escudo/deutsche mark exchange rate was set at 102.5 and the peseta/deutsche mark at 85.07. Yet, according to the estimates of our model, the equilibrium exchange rates should have been 129.9 and 90.58, respectively.
Therefore, Spain joined the euro with a slight (6%) appreciation of its currency following a period of depreciation that saw its currency above its 1994/95 equilibrium value. Alberola. et al. (1999) and Alberola and López (2001) found similar results. On the contrary, accord-ing to our estimates, Portugal joined the euro with a strong appreciation of its currency (21%) (Figure 5). The escudo was notably below its equilibrium level. Bulir and Smidkova (2005) and Barrell et al. (2002) also note the deep negative impact on the Portu-guese BoP of the overvalued escudo (between 10% and 20%) in the final stage of the EMU. Martinez-Mongay (2008) argues in similar terms. Blanchard (2006) also points out the problem of the overvaluation of the escudo in the euro area.
16
To see the impact of this overvaluation of the escudo on the euro area, we can compare ac-cumulated equilibrium growth rates between 1999 and 2007 inside and outside the euro area; that is, with a fixed exchange rate and with an equilibrium exchange rate. The former would have yielded 19.8% and the latter 39.2 (Table 2). While these results can be biased because of the time it takes to reach equilib-rium values, they serve to highlight two im-portant points. First, relative prices matter even in the context of BoP constrained growth. Second, they have mattered more for Portugal since its adoption of the euro.
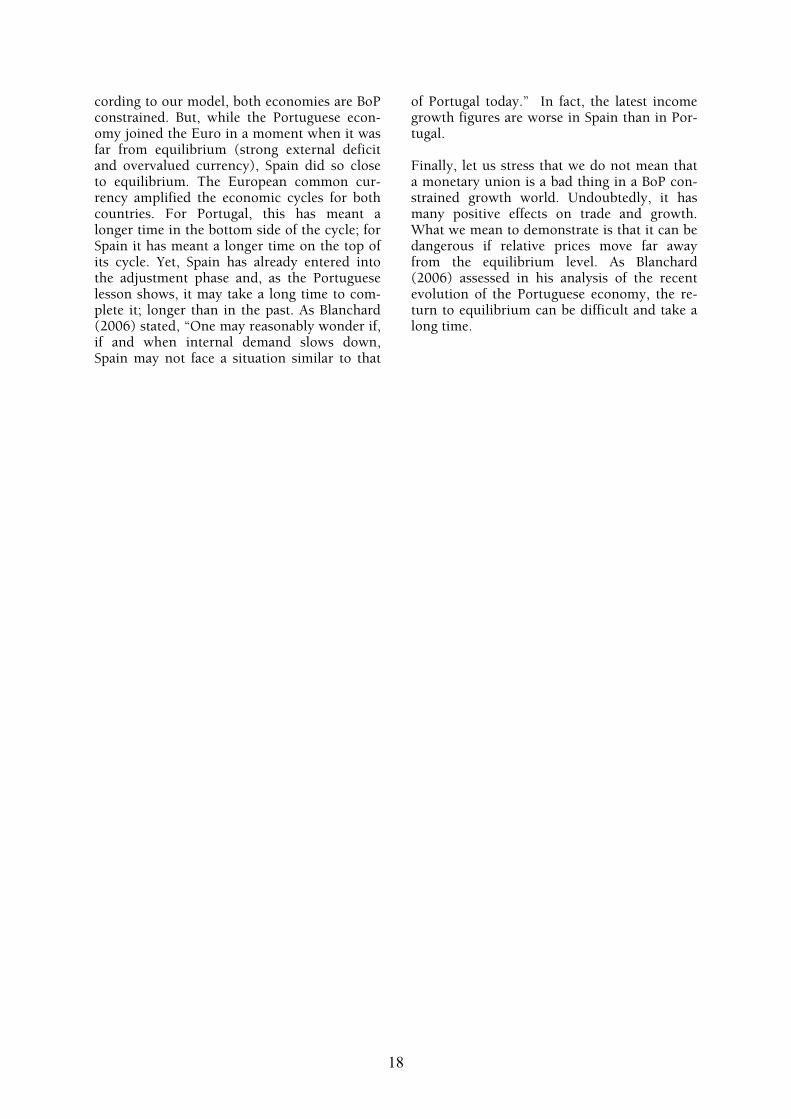
Spain’s story is different. It joined the euro when the BoP, capital inflows and the ex-change rate were close to equilibrium levels. Under normal conditions, the natural se-quence of events would be income growth above equilibrium and external deficits fi-nanced by capital inflows. However, with the introduction of the euro and the subsequent disappearance of exchange rate risk, the im-pact on income growth could last for a longer time. Figure 6 shows the external deficit be-ginning to correct in 2000, following the usual trend, but in 2002 this trend is reversed, and deficits begin to grow, reaching higher-than-usual levels. This means that income could grow above its equilibrium rate.
Table 2. Portuguese accumulated growth rate since 1998 Actual rate Equilibrium rate without Euro Equilibrium rate with Euro 1999 3.8 4.8 1.42 2000 7.6 16.0 8.11 2001 9.6 17.8 8.13 2002 10.4 19.1 7.26 2003 9.6 21.2 7.74 2004 11.1 26.3 10.85 2005 12.0 30.9 12.73 2006 13.2 36.9 17.48 2007 15.0 39.2 19.76
Figure 6. BoP (% GDP). Spain
-7.00
-6.00
-5.00
-4.00
-3.00
-2.00
-1.00
0.00
1.00
2.00
3.00
1975 1977 1979 1981 1983 1985 1987 1989 1991 1993 1995 1997 1999 2001 2003 2005 2007
Source: World Bank

17
Figure 7. Actual and equilibrium accumulated growth rates. Spain
-10
0
10
20
30
40
50
60
1999 2000 2001 2002 2003 2004 2005 2006 2007
Actual growth rateEquilibrium growth rateNet capital inflows. US$ billion
Source: World Bank
This sequence can be fully appreciated in Fig-ure 7. Between 1999 and 2001, the accumu-lated actual growth rate is higher that the equi-librium rate. From 2001 onwards, the opposite occurs, indicating that the adjustment had started. Yet, in 2003 this situation turns upside down. The actual growth rate overtakes the equilibrium rate and capital inflows increase dramatically.
In fact, the situation is very similar between the periods 1987-1991 and 1998-2000: high growth rates and external deficits. Yet, there is a crucial difference between both periods. At the end of the former growth cycle begins to slow, the BoP starts to move toward equilib-rium, capital outflows begin and the currency depreciates, which, in turn, boosts exports and reduces imports. However, while the economic situation was similar at the end of the second period, the reaction was different, especially from 2004 onwards. Income continued to grow at high rates and the external deficit con-tinued to increase. What makes this possible is the strong inflow of capital. Without the euro, the story likely would have been much differ-ent; similar to that in the aftermath of the 1987-1991 period. The euro reduces the speed of adjustment: making expansions last longer, as in the Spanish case, but during recessions, creating the need for other types of adjust-ments, as in the case of Portugal. Currently, the Spanish economy is far from its equilib-rium level. The future of Spain may resemble the past of Portugal.
5. Concluding remarks Throughout this paper we have defended that relative prices and capital flows matter in the real world, at least in the short run, and there-fore should be incorporated into BoP con-strained growth models. To this aim, we have presented a model where capital flows influ-ence the speed of adjustment of income and
exchange rates, prices do have a role in trade equations and exchange rates adjusts to their PPP values. By doing this, under normal cir-cumstances long-term growth rates in our model become those predicted by Thilwall’s law. Further, if capital flows or exchange rates differ from equilibrium values during a certain period of time our model will take account of this. In our opinion, this is important when testing the BoP constrained growth theory. Regressing Thilwall’s law growth rates on ac-tual rates may lead to an erroneous rejection of the BoP constraint hypothesis. We think that this hypothesis should be tested by checking if income adjusts to external disequilibria, with-out imposing a priori restrictions on prices and capital flows. To empirically support our model, we have used it to analyse a case in which prices and capital flows indeed have played a significant role: the opposite evolution of Portugal and Spain after the introduction of the euro. While the former has suffered a deep stagnation, the latter has experienced a significant boost. Ac-
18
cording to our model, both economies are BoP constrained. But, while the Portuguese econ-omy joined the Euro in a moment when it was far from equilibrium (strong external deficit and overvalued currency), Spain did so close to equilibrium. The European common cur-rency amplified the economic cycles for both countries. For Portugal, this has meant a longer time in the bottom side of the cycle; for Spain it has meant a longer time on the top of its cycle. Yet, Spain has already entered into the adjustment phase and, as the Portuguese lesson shows, it may take a long time to com-plete it; longer than in the past. As Blanchard (2006) stated, “One may reasonably wonder if, if and when internal demand slows down, Spain may not face a situation similar to that
of Portugal today.” In fact, the latest income growth figures are worse in Spain than in Por-tugal. Finally, let us stress that we do not mean that a monetary union is a bad thing in a BoP con-strained growth world. Undoubtedly, it has many positive effects on trade and growth. What we mean to demonstrate is that it can be dangerous if relative prices move far away from the equilibrium level. As Blanchard (2006) assessed in his analysis of the recent evolution of the Portuguese economy, the re-turn to equilibrium can be difficult and take a long time.

19
Appendix I. The steady-state rate of growth The steady-state solution of the model can be found using the method of undetermined coefficients, where all variables —with the exception of dummies— grow at a constant rate, which can be zero.
Therefore each variable (i) at time t can be defined as t0t ieii λ= , exception made of Z2, which is a
constant: 22 ZZ = . Substitution of (I.1) into the model yields
21er0mp0m0
xp01z1x01y
Z)tertmptm
txptztx(0
γ+λ−−λ−−λ+−
−λ++λ++λ+α=λ (I.1)
)tx)t*y(
)tert*ptxp(a(
x0*y02
er0*p0xp012x
λ−−λ+β+
+λ−−λ−−λ+β+α=λ, (I.2)
)tm)ty(
)tptertmp(b(
m0y04
p0er0mp033m
λ−−λ+β
+λ+−λ++λ+β+α=λ (I.3)
)ZK(0 24 −α= (I.4)
22er0PPP05er Z)tertPPP( γ+λ+−λ++δα=λ (I.5)
Rearranging terms, we obtain
)(t
Z)ermpmxpzx(
ermpmxp1zx1
2100001001y
λ−λλ−λ+λ+λα+
γ+−−−++α=λ
− (I.6)
))((t)x*y)er*pxp(a(
x*y2er*pxp12
00200012xλ−λβ+λ−λ−λβα
+−β+−−β+α=λ (I.7)
))((t)my)permp(b(
my4permp33
00400033mλ−λβ+λ−λ+λβα+
−β+−+β+α=λ (I.8)
)ZK(0 24 −α= (I.9)
)t(tZ)erPPP( erPPP522005er λ−λα+γ+−+δα=λ (I.10)
For these expressions to be identically satisfied, the following equations must hold
)(0 ermpmxp1zx λ−λλ−λ+λ+λ= − (I.9)
*y2er*pxp1x )( λβ+λ−λ−λβ=λ (I.10)
y4permp3m )( λβ+λ−λ+λβ=λ (I.11)
KZ2 = (I.12)
PPPer λ=λ (I.13)
From this set of equations, the rate of growth of the endogenous variables can be obtained as a function of the growth rates of the exogenous variables. In the case of income, its steady-state growth rate will be:
4
*y2zPPPmpp3PPPpxp1mpxpy
1)()()(
β
λβ+λ+λ−λ−λβ+λ−λ−λβ+λ−λ=λ
∗ (I.14)

20
Appendix II. Data description and data sources The variables used to estimate the model are in constant prices, except Z1, which must necessarily be in current prices. The sample period is 1975-2007, except for the estimation of the exchange rate equation, whose sample period is 1975-1998. - Y. GDP. Source: World Bank. - X. Exports of goods and services. Source: World Bank. - M. Imports of goods and services. Source: World Bank. - XP. Exports price deflator. Source: Source: World Bank. - MP. Imports price deflator. Source: Source: World Bank. - P. GDP price deflator. Source: World Bank. - P*. Foreign price level. This index was constructed by weighting the GDP deflators of Portuguese and Spanish export destination countries:
j
jjj
e
wP
P∑
=∗ ,
where Pj, is the GDP deflator of country j, ej represents the exchange rate against the currency of country j, and wj is the weight of country j in Portuguese and Spanish exports. To construct this indicator we used the top-36 export destinations. Therefore, the evolution of relative prices with respect to the rest of countries is considered to follow this weighted average. All foreign prices have been converted into deutsche marks, which has been used as vehicular currency in this paper. Source: World Bank. - Z. Index of net current transfers, net FDI and EU transfers (Regional and Cohesion Funds until 1991 and Structural Actions afterwards). Source: for the first two variables, World Bank, for the latter, European Commission. - Y*. Weighted foreign GDP. The weights are the share of each country in Portuguese and Spanish exports. As in the case of foreign prices, we have only used the top-36 export destinations to con-struct this variable. Source: World Bank Z2. Net portfolio investment and net other investment. Source: World Bank. ER. Exchange rate against deutsche mark. Source: World Bank PPP. Purchasing Power Parity exchange rate. It has been computed by multiplying the actual ex-change rate by the World Bank PPP conversion factor to official exchange rate ratio.

21
Bibliographical references Alberola, E.; Cervero, S. G.; López, H.; and Ubide A. “Global Equilibrium Exchange Rates - Euro, Dollar, "Ins," "Outs," and Other Major Currencies in a Panel Cointegration Framework”, IMF Working Papers 99/175, 1999, International Monetary Fund. Alberola, E. and López J. H. “Internal and external exchange rate equilibrium in a cointegration framework: an application to the Spanish peseta”, Spanish Economic Review, 2001, vol.3, n.1, 23-41. Alonso, J. A, “Growth and the External Constraint: Lessons from the Spanish Case,” Applied Economics,, February 1999, vol. 31, 245-253. Alonso, J. A. and Garcimartín, C. “A new approach to balance-of-payments-constrained growth model”. Journal of Postkeynesian Economics, 1998, Vol. 21, nº. 2, 259-282. Antunes, M. and Soukiazis, E., “How well the balance-of-payments constraint approach explains the Portu-guese growth performance. Empirical evidence for the 1965-2008 Period”, Working Paper nº. 13, 2009, GEMF, Universidade de Coimbra. Atesoglu, H. S., “Balance of Payments Constrained Growth. Evidence from the United States”. Journal of Post Keynesian Economics, 1993, vol. 15, nº 4, 507-514. Atesoglu, H. S., “Balance of Payments Determined Growth in Germany”. Applied Economic Letters, 1994, vol. 1, nº 6, 89-91. Atesoglu, H. S., “An Explanation of the Slowdown in US Economic Growth”, Applied Economics Letters, 1995, 2, 91-94. Bagnai, A., “Structural breaks, cointegration, and the empirics of Thirlwall’s law”, Applied Economics, No-vember 2008, 1-15 . Bairam, E., “Balance of payments, the Harrod foreign multiplier and economic growth: the European and North American experience”. Applied Economics, December 1988, nº 20, 1635-1642. Bairam, E. and Dempster, G., “The Harrod Foreign Trade Multiplier and Economic Growth in Asian Coun-tries”. Applied Economics, November 1991, vol. 23, n.º 11, 1719-1724. Banco de España, “Una actualización de las funciones de exportación e importación de la economía españo-la”, Boletín Económico, diciembre 2008, Banco de España. Barrell, R.; Holland, D.; Jakab, Z. M.; Kovacs, M. A.; Smidkova, K.; Sepp, U; and Eufer, U., “An econometric macro-model of transition: policy choices in the pre-accession period”, in Proceedings of AMFET’2001 Con-ference – Modelling Economies in Transition, Krag (Poland), Lodz, Absolwent, 2008. Bennett, H.; Escolano, J.; Fabrizio, S.; Gutiérrez, E.; Ivaschenko, I.; Lissovolik, B.; Moreno-Badia, M.; Schule, W.; Tokarick, S.; Xiao, Y.; and Zarnic, Z., “Competitiveness in the Southern Euro Area: France, Greece, Italy, Portugal, and Spain”, IMF Working Paper, 08/112, 2008.
Blanchard, O., “Adjustment within the euro. The difficult case of Portugal”. Portuguese Economic Journal, April 2007, Vol. 6, No. 1, 1-21.
Britto, G. and McCombie, J. L. S., “Thirlwall's law and the long-term equilibrium growth rate: an application to Brazil”. Journal of Post Keynesian Economics, Fall 2009, Volume 32, N° 1, 115-137. Buisán, A., J.; Caballero C.; and Jiménez, N., “Determinación de las exportaciones de manufacturas en los países de la UEM a partir de un modelo de oferta-demanda”, Boletín Económico, octubre 2003, Banco de España. Bulir, A. and Smidkova, K., “Exchange rates in the new EU accession countries: what have we learned from the forerunners?”, Economic Systems 29, 2005, 163–186. Carter, R. and Nagar, A. L., “Coefficients of Correlation for Simultaneous Equations Systems”. Journal of Econometrics, 1977, vol. 6, 39-50
22
Elliot, D. R. and Rhodd, R., “Explaining Growth Rate Difference in Highly Indebted Countries: An Extension to Thirlwall and Hussain”, Applied Economics, 1999, 31, 1145-1148. Faini, R.; Pritchett, L; and Clavijo, F. “Import Demand in Developing Countries”, World Bank Working Paper, 1988, Country Economics Department, Trade Policy. Gandolfo, G., Qualitative Analysis and Econometric Estimation of Continuous Time Dynamic Models. Ams-terdam, North Holland, 1981. García, C. and Gordo, E., “Funciones trimestrales de exportación e importación para la economía española”. Documentos de Trabajo n.º 9822, 1988, Banco de España. Garcimartín, C., Rivas, L. and Díaz, S., “Accounting for the Irish growth: a balance-ofpayments-constrint approach”, Journal of Post Keynesian Economics, 2008, Vol. 30, nº. 3, 409-433. Hussain, M., “The Balance of Payments Constraint and Growth Rate Differences Among African and East Asian Economies”, African Development Review, June 1999, 103-137. Lane, P and Milesi-Ferreti, G., “The external wealth of nations Mark II: Revised and expanded estimates of foreign assets and liabilities, 1970-2004”, IMF Working Paper 06/69, 2006. McCombie, J., “Thirlwall´s Law and Balance of Payments Constrained Growth—A Comment on the Debate”, Applied Economics, 1989, 21, 611-629. McCombie, J. S., “Thirlwall's Law and Balance of Payments Constrained Growth, More on the Debate”, Ap-plied Economics, 1992, 5 (1), 611-629. Martinez-Mongay, C., “Spain and Portugal in the Euro Area: Lessons for Cyprus”, Cyprus Economic Policy Review, 2008, vol. 2 no. 1, pp. 33-62. McGregor, P. G. and Swales, J. K., “Professor Thirlwall and Balance of Payments Constrained Growth”, Ap-plied Economics, 1985, vol. 17, nº. 5, 17-32. McGregor, P. G. and Swales, J. K., “Balance of Payments Constrained Growth: A Rejoinder to Professor Thirlwall”, Applied Economics, 1986, , vol. 18, nº. 12, 1265-1274. McGregor, P. G. and Swales, J. K., “Thirlwall´s Law and Balance of Payments Constrained Growth: Further Comment on the Debate”, Applied Economics, 1991, vol. 23, nº. 1, 9-20. Mauleón, I. and Sastre, L., “El saldo comercial en 1993: un análisis econométrico”, Información Comercial Española, 1994, 735, 167-172. Moreno-Brid, J. C., “On capital flows and the balance-of-payments-constrained growth model”. Journal of Postkeynesian Economics, 1998, Vol. 21, Nº. 2, 283-298. Moreno-Brid, J. C., “Capital Flows, Interest Payments and the Balance-of-Payments Constrained Growth Model: A Theoretical and Empirical Analysis”. Metroeconomica 54, 2003, nº. 2-3, 346-365. Senhadji, A. and Montenegro, C., “Time Series Analysis of Export Demand Equations: A Cross-Country Analysis”, IMF Staff Papers, 1999, Vol. 43, No.3. Thirlwall, A., “Balance of payments constraint as an explanation of international growth rate differences”. Banca Nazionale del Lavoro Quarterly Review, 1979, 128(1), 45-53. Thirlwall, A. P. and Hussain, M. N., “The balance of payments constraint, capital flows and growth rate dif-ferences between countries”, Oxford Economic Papers, 1982, nº 3, 498-510.

23
Últimos títulos publicados
DOCUMENTOS DE TRABAJO “EL VALOR ECONÓMICO DEL ESPAÑOL” DT 14/10 Antonio Alonso, José; Gutiérrez, Rodolfo: Lengua y emigración: España y el español en las
migraciones internacionales. DT 13/08 de Diego Álvarez, Dorotea; Rodrigues-Silveira, Rodrigo; Carrera Troyano Miguel: Estrate-
gias para el Desarrollo del Cluster de Enseñanza de Español en Salamanca DT 12/08 Quirós Romero, Cipriano: Lengua e internacionalización: El papel de la lengua en la inter-
nacionalización de las operadoras de telecomunicaciones. DT 11/08 Girón, Francisco Javier; Cañada, Agustín: La contribución de la lengua española al PIB y al
empleo: una aproximación macroeconómica. DT 10/08 Jiménez, Juan Carlos; Narbona, Aranzazu: El español en el comercio internacional. DT 09/07 Carrera, Miguel; Ogonowski, Michał: El valor económico del español: España ante el espejo
de Polonia. DT 08/07 Rojo, Guillermo: El español en la red. DT 07/07 Carrera, Miguel; Bonete, Rafael; Muñoz de Bustillo, Rafael: El programa ERASMUS en el
marco del valor económico de la Enseñanza del Español como Lengua Extranjera. DT 06/07 Criado, María Jesús: Inmigración y población latina en los Estados Unidos: un perfil socio-
demográfico. DT 05/07 Gutiérrez, Rodolfo: Lengua, migraciones y mercado de trabajo. DT 04/07 Quirós Romero, Cipriano; Crespo Galán, Jorge: Sociedad de la Información y presencia del
español en Internet. DT 03/06 Moreno Fernández, Francisco; Otero Roth, Jaime: Demografía de la lengua española. DT 02/06 Alonso, José Antonio: Naturaleza económica de la lengua. DT 01/06 Jiménez, Juan Carlos: La Economía de la lengua: una visión de conjunto. WORKING PAPERS WP 05/10 Garcimartín, Carlos; Rivas Luis; García Martínez, Pilar: On the role of relative prices and
capital flows in balance-of-payments constrained growth: the experiences of Portugal and Spain in the euro area.
WP 04/10 Álvarez, Ignacio; Luengo, Fernando: Financiarización, empleo y salario en la UE: el impac-
to de las nuevas estrategias empresariales. WP 03/10 Sass, Magdolna: Foreign direct investments and relocations in business services – what are
the locational factors? The case of Hungary. WP 02/10 Santos-Arteaga, Francisco J.: Bank Runs Without Sunspots. WP 01/10 Donoso, Vicente; Martín, Víctor: La sostenibilidad del déficit exterior de España. WP 14/09 Dobado, Rafael; García, Héctor: Neither so low nor so short! Wages and heights in eight-
eenth and early nineteenth centuries colonial Hispanic America.
24
WP 13/09 Alonso, José Antonio: Colonisation, formal and informal institutions, and development. WP 12/09 Álvarez, Francisco: Oportunity cost of CO2 emission reductions: developing vs. developed
economies. WP 11/09 J. André, Francisco: Los Biocombustibles. El Estado de la cuestión. WP 10/09 Luengo, Fernando: Las deslocalizaciones internacionales. Una visión desde la economía
crítica WP 09/09 Dobado, Rafael; Guerrero, David: The Integration of Western Hemisphere Grain Markets in
the Eighteenth Century: Early Progress and Decline of Globalization. WP 08/09 Álvarez, Isabel; Marín, Raquel; Maldonado, Georgina: Internal and external factors of com-
petitiveness in the middle-income countries. WP 07/09 Minondo, Asier: Especialización productiva y crecimiento en los países de renta media. WP 06/09 Martín, Víctor; Donoso, Vicente: Selección de mercados prioritarios para los Países de Renta
Media. WP 05/09 Donoso, Vicente; Martín, Víctor: Exportaciones y crecimiento económico: estudios empíri-
cos. WP 04/09 Minondo, Asier; Requena, Francisco: ¿Qué explica las diferencias en el crecimiento de las
exportaciones entre los países de renta media? WP 03/09 Alonso, José Antonio; Garcimartín, Carlos: The Determinants of Institutional Quality. More
on the Debate. WP 02/09 Granda, Inés; Fonfría, Antonio: Technology and economic inequality effects on interna-
tional trade. WP 01/09 Molero, José; Portela, Javier y Álvarez Isabel: Innovative MNEs’ Subsidiaries in different
domestic environments. WP 08/08 Boege, Volker; Brown, Anne; Clements, Kevin y Nolan Anna: ¿Qué es lo “fallido”? ¿Los
Estados del Sur,o la investigación y las políticas de Occidente? Un estudio sobre órdenes políticos híbridos y los Estados emergentes.
WP 07/08 Medialdea García, Bibiana; Álvarez Peralta, Nacho: Liberalización financiera internacional,
inversores institucionales y gobierno corporativo de la empresa WP 06/08 Álvarez, Isabel; Marín, Raquel: FDI and world heterogeneities: The role of absorptive ca-
pacities WP 05/08 Molero, José; García, Antonio: Factors affecting innovation revisited WP 04/08 Tezanos Vázquez, Sergio: The Spanish pattern of aid giving WP 03/08 Fernández, Esther; Pérez, Rafaela; Ruiz, Jesús: Double Dividend in an Endogenous Growth
Model with Pollution and Abatement WP 02/08 Álvarez, Francisco; Camiña, Ester: Moral hazard and tradeable pollution emission permits. WP 01/08 Cerdá Tena, Emilio; Quiroga Gómez, Sonia: Cost-loss decision models with risk aversion. WP 05/07 Palazuelos, Enrique; García, Clara: La transición energética en China. WP 04/07 Palazuelos, Enrique: Dinámica macroeconómica de Estados Unidos: ¿Transición entre dos
recesiones? WP 03/07 Angulo, Gloria: Opinión pública, participación ciudadana y política de cooperación en
España.

25
WP 02/07 Luengo, Fernando; Álvarez, Ignacio: Integración comercial y dinámica económica: España ante el reto de la ampliación.
WP 01/07 Álvarez, Isabel; Magaña, Gerardo: ICT and Cross-Country Comparisons: A proposal of a new composite index.
WP 05/06 Schünemann, Julia: Cooperación interregional e interregionalismo: una aproximación so-
cial-constructivista. WP 04/06 Kruijt, Dirk: América Latina. Democracia, pobreza y violencia: Viejos y nuevos actores. WP 03/06 Donoso, Vicente; Martín, Víctor: Exportaciones y crecimiento en España (1980-2004):
Cointegración y simulación de Montecarlo. WP 02/06 García Sánchez, Antonio; Molero, José: Innovación en servicios en la UE: Una aproximación
a la densidad de innovación y la importancia económica de los innovadores a partir de los datos agregados de la CIS3.
WP 01/06 Briscoe, Ivan: Debt crises, political change and the state in the developing world. WP 06/05 Palazuelos, Enrique: Fases del crecimiento económico de los países de la Unión Europea–
15. WP 05/05 Leyra, Begoña: Trabajo infantil femenino: Las niñas en las calles de la Ciudad de México. WP 04/05 Álvarez, Isabel; Fonfría, Antonio; Marín Raquel: The role of networking in the competitive-
ness profile of Spanish firms. WP 03/05 Kausch, Kristina; Barreñada, Isaías: Alliance of Civilizations. International Security and
Cosmopolitan Democracy. WP 02/05 Sastre, Luis: An alternative model for the trade balance of countries with open economies:
the Spanish case. WP 01/05 Díaz de la Guardia, Carlos; Molero, José; Valadez, Patricia: International competitiveness in
services in some European countries: Basic facts and a preliminary attempt of interpreta-tion.
WP 03/04 Angulo, Gloria: La opinión pública española y la ayuda al desarrollo. WP 02/04 Freres, Christian; Mold, Andrew: European Union trade policy and the poor. Towards im-
proving the poverty impact of the GSP in Latin America. WP 01/04 Álvarez, Isabel; Molero, José: Technology and the generation of international knowledge
spillovers. An application to Spanish manufacturing firms. POLICY PAPERS PP 01/10 Molero, José: Factores críticos de la innovación tecnológica en la economía española. PP 03/09 Ferguson, Lucy: Analysing the Gender Dimensions of Tourism as a Development Strategy. PP 02/09 Carrasco Gallego ,José Antonio: La Ronda de Doha y los países de renta media. PP 01/09 Rodríguez Blanco, Eugenia: Género, Cultura y Desarrollo: Límites y oportunidades para el
cambio cultural pro-igualdad de género en Mozambique. PP 04/08 Tezanos, Sergio: Políticas públicas de apoyo a la investigación para el desarrollo. Los casos
de Canadá, Holanda y Reino Unido PP 03/08 Mattioli, Natalia Including Disability into Development Cooperation. Analysis of Initiatives
by National and International Donors
26
PP 02/08 Elizondo, Luis: Espacio para Respirar: El humanitarismo en Afganistán (2001-2008). PP 01/08 Caramés Boada, Albert: Desarme como vínculo entre seguridad y desarrollo. La reintegra-
ción comunitaria en los programas de Desarme, desmovilización y reintegración (DDR) de combatientes en Haití.
PP 03/07 Guimón, José: Government strategies to attract R&D-intensive FDI. PP 02/07 Czaplińska, Agata: Building public support for development cooperation. PP 01/07 Martínez, Ignacio: La cooperación de las ONGD españolas en Perú: hacia una acción más
estratégica. PP 02/06 Ruiz Sandoval, Erika: Latinoamericanos con destino a Europa: Migración, remesas y codesa-
rrollo como temas emergentes en la relación UE-AL. PP 01/06 Freres, Christian; Sanahuja, José Antonio: Hacia una nueva estrategia en las relaciones
Unión Europea – América Latina. PP 04/05 Manalo, Rosario; Reyes, Melanie: The MDGs: Boon or bane for gender equality and wo-
men’s rights? PP 03/05 Fernández, Rafael: Irlanda y Finlandia: dos modelos de especialización en tecnologías avan-
zadas. PP 02/05 Alonso, José Antonio; Garcimartín, Carlos: Apertura comercial y estrategia de desarrollo. PP 01/05 Lorente, Maite: Diálogos entre culturas: una reflexión sobre feminismo, género, desarrollo y
mujeres indígenas kichwuas. PP 02/04 Álvarez, Isabel: La política europea de I+D: Situación actual y perspectivas. PP 01/04 Alonso, José Antonio; Lozano, Liliana; Prialé, María Ángela: La cooperación cultural espa-
ñola: Más allá de la promoción exterior.