Embed Size (px)
Citation preview
Geophys. J. R. asfr. SOC. (1975) 43, i63-200.
On the Relative Importance of the Driving Forces of Plate Motion*
Donald Forsyth and Seiya Uyedat
(Received 1975 February lo)$
Summary
A number of possible mechanisms have recently been proposed for driving the motions of the lithospheric plates, such as pushing from mid-ocean ridges, pulling by downgoing slabs, suction toward trenches, and coupling of the plates to flow in the mantle. We advance a new observational method of testing these theories of the driving mechanism. Our basic approach is to solve the inverse problem of determining the relative strength of the plausible driving forces, given the observed motions and geometries of the lithospheric plates. Since the inertia of the plates is negligible, each plate must be in dynamic equilibrium, so that the sum of the torques acting on a plate must be zero. Thus, our problem is to determine the relative sizes of the forces that minimize the components of net torque on each plate. The results indicate that the forces acting on the downgoing slab control the velocity of the oceanic plates and are an order of magnitude stronger than any other force. Namely, all the oceanic plates attached to substantial amounts of downgoing slabs move with a ' terminal velocity ' at which the gravitational body force pulling the slabs downward is nearly balanced with the resistance acting on the slab; regardless of the other features of the trailing horizontal part of the plates. The drag on the bottom of the plates which resist motion is stronger under the continents than under the oceans.
Introduction In recent years, the kinematics of continental drift and sea-floor spreading have
been successfully described by the theory of plate tectonics. According to this theory, the Earth's surface is covered by a small number of lithospheric plates, whose relative motions are described in terms of the motions of rigid caps on a sphere (McKenzie & Parker 1967; Morgan 1968; LePichon 1968). Much of the present and past tectonic activity, such as the occurrence of earthquakes (Isacks, Oliver & Sykes 1968), the formation of mid-oceanic ridges, ocean floors, trench-arc systems and mountain belts, (McKenzie 1967; Dewey & Bird 1970) and the distribution of topography and
* Lamont-Doherty Geological Observatory Contribution No. 2241.
t On leave from Earthquake Research Institute, University of Tokyo, Tokyo, Japan. Present address: Lamont-Doherty Geological Observatoi y, Columbia University, Palisades, New York 10964.
2 Received in original form 1974 December 3.
163
164 D. Forsyth and S. Uyeda
heat flow in world oceans (Sclater & Francheteau 1970), has been shown to be a consequence of plate motions. However, rather little is known about the driving mechanisms of plate tectonics, although various types of forces have been suggested.
There are three observational means of testing any theory of the driving mechanism of plate tectonics. First, does the proposed mechanism supply sufficient energy to account for the consumption of mechanical energy accompanying plate motions, such as the elastic energy released in earthquakes taking into account the seismic efficiency, and the viscous dissipation of mantle drag? Second, does the mechanism explain the observations of stress within the plates as well as at the plate boundaries? Third, can the mechanism produce the plate motions as determined by sea-floor spread- ing observations? In this paper, using linear inverse theory, we attempt to derive a system of forces acting on the lithosphere that is consistent with the motions of the plates. Our basic approach is to solve the inverse problem of determining the relative strength of various proposed forces from the observed relative motions and geo- metries of the lithospheric plates. We will then show that this system satisfies the energy condition and examine the recent results on intra-plate stresses (Mendiguren 1971; Forsyth 1973; Sykes & Sbar 1973).
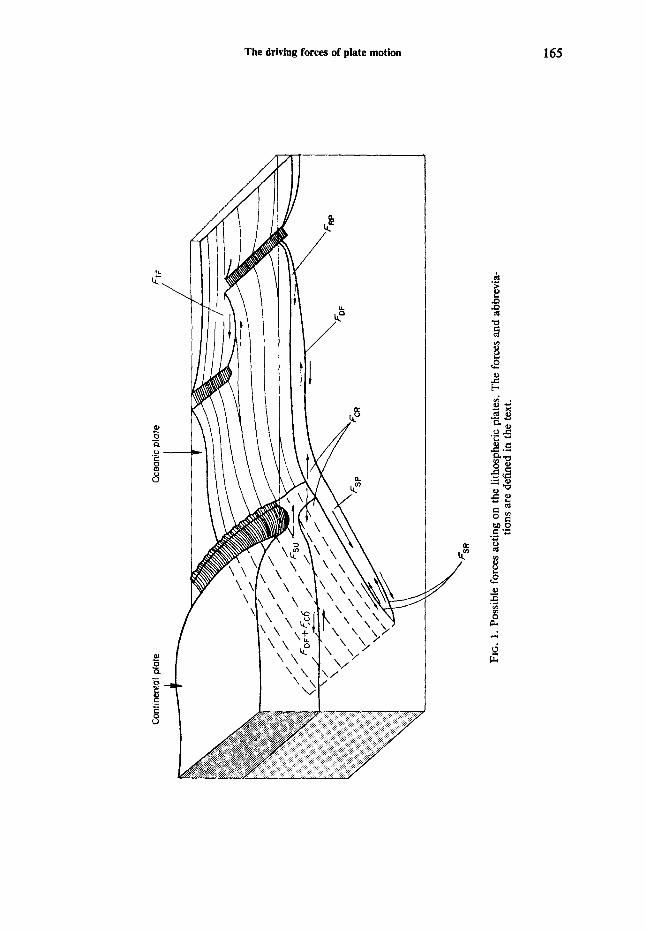
Forces acting on plates
The forces acting on plates can be classified into two categories: the forces acting at the bottom surface of plates and those acting at plate boundaries. In plate tectonics, plate boundaries are of three major types: the diverging, converging (colliding), and shearing boundaries, corresponding to the oceanic ridge and continental rift systems, the trench-arc and mountain belt systems, and the transform fault systems. In the following, we first list the plausible forces acting on the plates as illustrated in Fig. 1, and then discuss qualitatively the physical nature of these forces. The force acting at the bottom surface of plates is due to the viscous coupling between plates and under- lying asthenosphere. It will be called the mantle drag force and denoted FDF in the following. If there is an active flow in the asthenosphere, such as thermal convection, F D F will act as a driving force (e.g. Runcorn 1962; Morgan 1972; Turcotte & Oxburgh 1972). If, on the other hand, the asthenosphere is passive with regard to the plate motion, FDF will be resistive force as in the case of Fig. 1. Because of the possible difference in the rheological properties of the asthenosphere under oceanic and con- tinental plates, the drag force acting on continental plates may be different from that acting on oceanic plates. Therefore, an additional drag force is considered for continental plates, the continental drag, F C D . The drag acting on continental plate is thus expressed as F D F + F C D .
At the diverging boundary, plates are pushed apart by way of gravitational sliding (Orowan 1964; Lliboutry 1969; Hales 1969; Jacoby 1970; Artyushkov 1973). This force is called here the ridge push and denoted F R p . At the transform fault boundary. there should be some resistive force, which we call transform fault resistance, FTF.
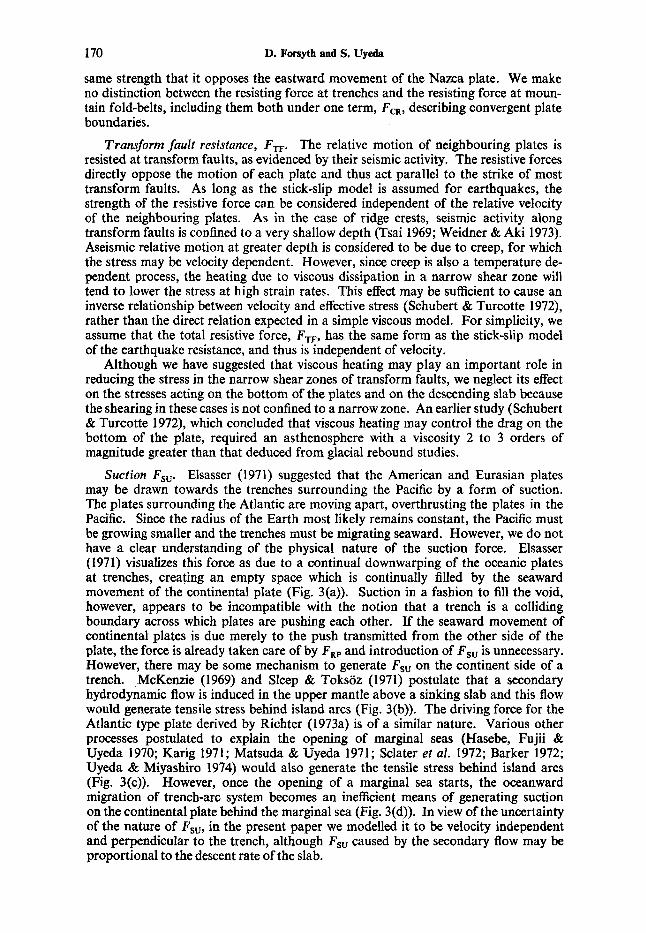
The situation at converging or colliding boundaries is probably somewhat more complicated. First, there is a negative buoyancy force acting on the downgoing slab part of the subducted oceanic plate. This body force will pull the whole oceanic plate toward the trench and is called slab-pull, Fsp. Since the slab is plunging into the mesosphere, where the viscous resistance may be much higher than in the astheno- sphere, the descending slab may meet significant resistance, the slab resistance, FSR (see Fig. 1). At the point of interaction of the two plates, their relative motion is resisted by a frictional force. This force, the colliding resistance, F C R is opposite in direction but identical in magnitude for the two plates because of the principle of action and reaction. For the continental or overthrust plate, another force, called suction, that pulls the plate toward the trench was proposed by Elsasser (1971). We denote it Fsu.
The driving forces of plate motion 165
166 D. Forsyth and S. Uyeda
We neglect forces of plate-plate interaction which act perpendicular to the direction of relative motion, such as normal forces across transform faults. The sign of these forces cannot be predicted without complete knowledge of the other stresses acting on the plates and it is unlikely that large normal forces would exist without causing a re-adjustment of the apparent relative motion.
As has been introduced above, we have a set of eight possible forces, FDF, F,, FRp, FTF, Fsp, FsR, F, and Fsu. At this stage, however, the relative importance of the forces is not clear. It seems to be possible to refute, on observational grounds, an argument that any one of the above driving forces is the sole driving force of plate motions. For instance, if the ridge push, FRp, is the only driving force, why does the Philippine Sea plate, which has no ridge on its boundary, move and why do the intermediate earthquakes in the Benioff-Wadati zone often have tensional axis parallel to the dip of the slab (hacks & Molnar 1969)? Similarly, the slab pull, Fsp, cannot be the sole driving force because the plates on both sides of the mid-Atlantic Ridge are moving apart without being attached to any significant downgoing slab. Apparently, some combined effect of these forces is responsible for maintaining the plate motions and it is the intent of the present paper to decipher the relative impor- tance of these possible forces.
Qualitative discussion of the nature of the forces
Mantle drag force FDF, FcD: When the possible driving mechanism of continental drift was questioned decades
ago, Holmes (1928) put forward the hypothesis that mantle convection drives the continents as passive rafts. Runcorn (1962) proposed, using a theoretical result of Chandrasekhar (1953), that the change in the flow pattern of mantle-wide convection due to growth of the core gave rise to the latest episode of continental drift. Holmes’ hypothesis was revived in the form of the sea-floor spreading by Hess (1962) and Dietz (1961). Theoretical as well as laboratory investigations of the mantle convection have been advanced to obtain more realistic models than the simple Rayleigh-BCnard type model. For instance, the effects of high Rayleigh number-finite amplitude flow, internal heating due both to dispersed sources and localized phase changes, variable viscosity, and horizontal temperature gradients have been considered extensively (e.g. Torrance & Turcotte 1971; Turcotte & Oxburgh 1972; Richter 1973a; McKenzie & Weiss 1974).
Since the aspect ratio of the Rayleigh-BCnard type cell is always nearly one, the cells expected to exist in the asthenosphere must have horizontal scale much smaller than that of typical plates. Although Takeuchi & Sakata (1970) have shown that horizontally extended cells may be possible at the critical Rayleigh number for a mantle with viscosity variable with depth, Foster (1969) showed that the horizontal scale of cells becomes even smaller in the high Rayleigh number range which describes convection in the Earth. Small cells can exert only a periodic stress on the base of the plate, which has little net contribution when integrated over the entire area of the plate. These small cells, which may exist as a mechanism for controlling the heat flow in ocean basins away from ridges, are incapable of driving the plates (Richter 1973b). Richter (1973a) suggested that the convection currents generated by a horizontal temperature gradient may exert a stress effective in the original breakup of large continental masses, but are not capable of driving the broken-up plates for a long distance.
The advent of plate tectonics made the classical mantle convection hypothesis even more untenable. For instance, the supposition that mid-oceanic ridges are the site of upwelling and trenches are that of sinking of the large scale convective flow cannot be valid, because it is now established that actively spreading, oceanic ridges migrate and often collide with trenches (Atwater 1970; Larson & Chase 1970).
The driving forces of plate motion 167
Although Morgan (1972) postulated that the resultant stresses caused by mantle flows associated with ' hot-spots ' or ' plumes ' would be an important driving mechanism, Artyushkov (1973) argued that the viscosity of the asthenosphere is generally vastly overestimated, in particular under oceans, and that convection currents in the mantle, even if they exist, cannot produce any significant stresses on the base of plates.
Clearly, when a large plate moves, there must be a net mass flux in the astheno- sphere from trench to ridge, balancing the mass transport in the moving plate. There- fore, we must treat the plates as an integral part of the circulation. Richter (1973a) found that in a model composed of lithosphere and asthenosphere, the major driving force is the pull from the downgoing slab, Fsp, and the asthenosphere exerts viscous resistive forces on the plates and slab. If the flow is Newtonian, these resistive forces are not affected by the superposition of small convection cells on the large scale mantle flow.
The mantle drag, FDF, on a plate should be proportional to the area and to the velocity of the plate relative to the asthenosphere. For the continental part of a plate, an additional resistive term, also proportional to the velocity but with a different coefficient of proportionality, FcD, is considered. This continental drag term allows for the possibility of greater viscosity under the continents than under the oceans, as suggested by surface wave studies of the low velocity zone (Knopoff 1972; Alexander 1974). Whether FDF and F , act as driving forces or resistive forces is determined by the relative velocity between the plate and the asthenosphere. In our model, the asthenosphere is passive and plays only the role of providing the return flow: the velocity used is the velocity relative to the deep mantle or the ' absolute velocity ' and FDF and FcD resist plate motion.
Ridge push, FRp. Mid-oceanic ridges are approximately in isostatic equilibrium, as indicated by their essentially zero free-air gravity anomaly (Talwani, Worzel & Ewing 1965). The elevated crust is compensated at depth by anomalously hot, low- density mantle. The ridges may originally have formed as a passive consequence of the plates moving apart, or the uplift and injection of hot mantle material may have actively helped to push the plates apart (Wilson & Burke 1973). The elevation of the ridge can be explained entirely by a passive, thermal expansion model in which hot mantle material enters the crack left when two lithospheric plates are pulled apart [McKenzie 1967; Sleep 1969). However, once the elevated topography is produced, it has excess potential energy, so that the ridge tries to spread out to obtain a lower energy state. The resulting force, FRP, acts perpendicular to the strike of the ridge, and has been shown to be on the order of the excess load which attains several hundred bars (Orowan 1964; Hales 1969; Lliboutry 1969; Jacoby 1970; Artyushkov 1973). On the other hand, normal faulting and normal-fault type earthquakes are observed at the crest of ridges (Sykes 1967), indicating the crest is an extensional boundary locally resisting the spreading. In addition, some energy is expended in overcoming viscous dissipation in the rising mantle material (Lachenbuch 1973). We believe these resisting forces are relatively minor, confined primarily to the upper few kilometres Of crust, and that the net effect is a driving force. Because the elevation of the ridge is independent of spreading rate (Anderson, McKenzie & Sclater 1973), in our model, FW is independent of velocity. As the elevation of the ridge is maintained by the continual advection of heat in the rising mantle material, motions of the plates generated by the ridge force may ultimately be considered to be driven by the forces of thermal convection.
Slab pull, Fsp and slab resistance, FsR. The cold downgoing slab under trenches has a density greater than that of the surrounding mantle (McKenzie, 1969; Minear and Toksoz 1970) and, therefore, experiences a body force due to its negative buoyancy. Elsasser (1969) pointed out that the lithosphere may be considered as a stress guide
168 D. Forsyth and S. Uyeda
and that the downward pull of the sinking slab, Fsp, can be transmitted to the horizontal part of the lithosphere to drive its motion. Various authors assessed the intensity of this force (e.g. McKenzie 1969; Lliboutry 1969; Jacoby 1970; Artyushkov 1973). Presumably, the density contrast between the slab and the surrounding mantle, enhanced by the elevation within the slab of the depth of phase transitions, is a function of various factors, such as dip, length, age and rate of subduction of the slab and the material properties of the surrounding mantle (McKenzie 1969; Minear & Toksoz 1970). Based on a model of the thermal regime of a downgoing slab, Turcotte & Schubert (1971) suggested that FSP would be of the order of several kbars.
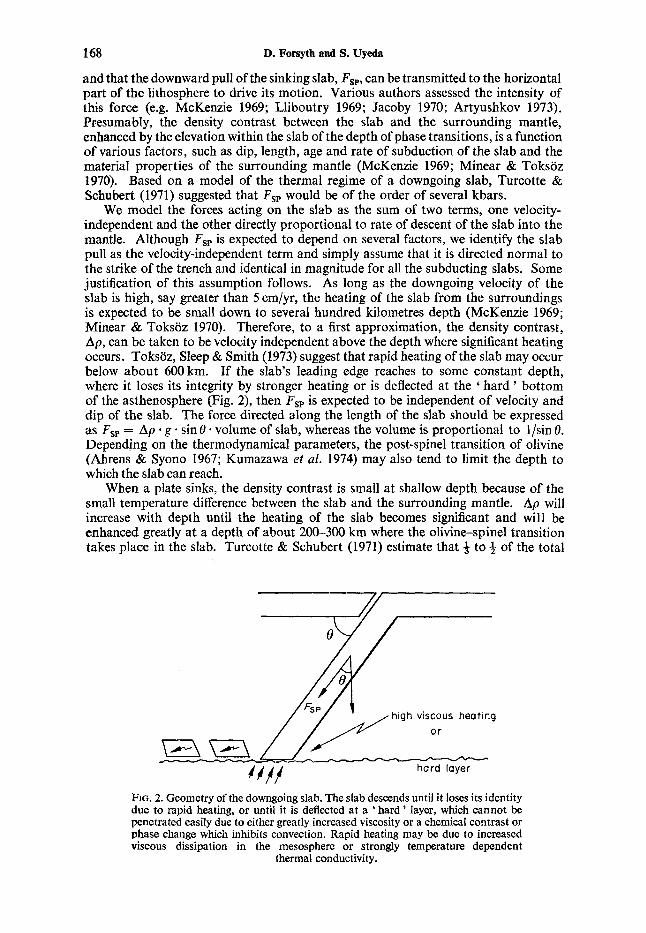
We model the forces acting on the slab as the sum of two terms, one velocity- independent and the other directly proportional to rate of descent of the slab into the mantle. Although Fsp is expected to depend on several factors, we identify the slab pull as the velocity-independent term and simply assume that it is directed normal to the strike of the trench and identical in magnitude for all the subducting slabs. Some justification of this assumption follows. As long as the downgoing velocity of the slab is high, say greater than 5 cm/yr, the heating of the slab from the surroundings is expected to be small down to several hundred kilometres depth (McKenzie 1969; Minear & Toksoz 1970). Therefore, to a first approximation, the density contrast, Ap, can be taken to be velocity independent above the depth where significant heating occurs. Toksoz, Sleep & Smith (1973) suggest that rapid heating of the slab may occur below about 600km. If the slab’s leading edge reaches to some constant depth, where it loses its integrity by stronger heating or is deflected at the ‘ hard ’ bottom of the asthenosphere (Fig. 2), then FSP is expected to be independent of velocity and dip of the slab. The force directed along the length of the slab should be expressed as Fsp = Ap g sin 8 volume of slab, whereas the volume is proportional to l/sin 8. Depending on the thermodynamical parameters, the post-spinel transition of olivine (Ahrens & Syono 1967; Kumazawa et al. 1974) may also tend to limit the depth to which the slab can reach.
When a plate sinks, the density contrast is small at shallow depth because of the small temperature difference between the slab and the surrounding mantle. A p will increase with depth until the heating of the slab becomes significant and will be enhanced greatly at a depth of about 200-300 km where the olivine-spinel transition takes place in the slab. Turcotte & Schubert (1971) estimate that 3 to 3 of the total
high viscous heat ing
h a r d layer
FIG. 2. Geometry of the downgoing slab. The slab descends until it loses its identity due to rapid heating, or until it is deflected at a ‘ hard ’ layer, which cannot be penetrated easily due to either greatly increased viscosity or a chemical contrast or phase change which inhibits convection. Rapid heating may be due to increased viscous dissipation in the mesosphere or strongly temperature dependent
thermal conductivity.
The driving forces of plate motion 169
body force may be due to the elevation of the phase boundary. This contribution to slab pull would not significantly increase if the rate of descent of the slab were in- creased above the threshold of perhaps 5 cm/yr. From these considerations, it may be inferred that the ' centre of gravity ' of the negative buoyancy force, Fsp, is at a depth of about 200-300 km.
In our model, we identify the velocity-dependent force acting on the slab as the resistance to the downgoing motion, F,,, which is due primarily to the viscous drag. Here, we assume it to be proportional to the viscosity of the surrounding mantle and to the velocity of underthrusting. Since the viscosity of the mantle is relatively small in the asthenosphere and may become orders of magnitude greater in the mesosphere (e.g. Gordon 1965), F,, would be largely concentrated at the lower portion of the slab. In addition, Smith & Toksoz (1972) have shown that the force resisting motion on the leading edge of the slab should be three to five times as important as the viscous traction applied to the surfaces of the descending plate. Consequently, in our idealized model, resistance is concentrated at the leading edge. FSR is directed per- pendicular to the strike of the trench, opposing the advance of the plate into the mantle. Any viscous drag due to the motion of the subducted plate parallel to the strike of the trench is neglected.
Pulling from the trenches, like pushing at the ridges, is ultimately a form of thermal convection in which the driving forces are supplied by gravity acting on the density contrasts induced by the cooling of the upper mantle. In order to make a global model feasible, we must assume that all descending plates behave in a similar manner. We do not intend to imply that the forces discussed here completely describe every trench, but we have chosen the simplest physical model describing a system in which the resisting forces increase faster than the driving forces above some threshold rate of motion.
Resistance to the relative motion between plates is apparently the direct cause of most shallow earthquakes. We model this resistance as a stick-slip process (Brace & Byerlee 1966). As the plates try to move past one another, strain energy gradually accumulates at the locked plate boundary. When the stress reaches a certain level, slip on the fault occurs, releasing strain energy in an earthquake. A higher strain rate does not increase the stress; it merely reduces the length of time required to reach the level of stress required to cause slipping. Thus, the average stress over a period of time is independent of the rate of relative motion at the plate boundary. It is possible that some of the displacement can occur in continuous, aseismic creep, in which the stress is dependent on velocity. However, the observation that the rate of relative motion in most major fault zones can be predicted by summing the seismic moment of earthquakes occurring in the zone (Brune 1968; Davies & Brune 1970), supports our assumption that slip during earthquakes and not aseismic creep is the predominant mechanism for accommodating the relative motions of the plates. Studies of the rupture zones of large, shallow earthquakes show that nearly the entire length of the Aleutian arc (Sykes 1971), the Pacific coast of Japan (Mogi 1968), and the west coast of South America (Kelleher 1972) have broken in series of large events, suggesting that the stick-slip model may be an adequate representation of plate-plate interaction in trenches. The recurrence time of great earthquakes can be as little as 30 years (Sykes 1971) or as much as several hundred pars (Plafker & Rubin 1967). The recurrence time may vary on different portions Of the same plate boundary, such as the Nazca-South American boundary (Kelleher 1971). We make the simplifying assumptions that all trenches behave identically a d that the resisting force is independent of velocity and parallel to the relative motion between the plates. As this resisting force is due to interaction between the plates, it acts with equal strength on both plates. For example, resistance in the Peru- Chile trench opposes the westward movement of the South American plate with the
Colliding resistance, Fa.
170 D. Forsyth and S. Uy&
same strength that it opposes the eastward movement of the Nazca plate. We make no distinction between the resisting force at trenches and the resisting force at moun- tain fold-belts, including them both under one term, FCR, describing convergent plate boundaries.
Transform fault resistance, FTF. The relative motion of neighbouring plates is resisted at transform faults, as evidenced by their seismic activity. The resistive forces directly oppose the motion of each plate and thus act parallel to the strike of most transform faults. As long as the stick-slip model is assumed for earthquakes, the strength of the resistive force can be considered independent of the relative velocity of the neighbouring plates. As in the case of ridge crests, seismic activity along transform faults is confined to a very shallow depth (Tsai 1969; Weidner 8c Aki 1973). Aseismic relative motion at greater depth is considered to be due to creep, for which the stress may be velocity dependent. However, since creep is also a temperature de- pendent process, the heating due to viscous dissipation in a narrow shear zone will tend to lower the stress at high strain rates. This effect may be sufficient to cause an inverse relationship between velocity and effective stress (Schubert 8c Turcotte 1972), rather than the direct relation expected in a simple viscous model. For simplicity, we assume that the total resistive force, F T F , has the same form as the stick-slip model of the earthquake resistance, and thus is independent of velocity.
Although we have suggested that viscous heating may play an important role in reducing the stress in the narrow shear zones of transform faults, we neglect its effect on the stresses acting on the bottom of the plates and on the descending slab because the shearing in these cases is not confined to a narrow zone. An earlier study (Schubert & Turcotte 1972), which concluded that viscous heating may control the drag on the bottom of the plate, required an asthenosphere with a viscosity 2 to 3 orders of magnitude greater than that deduced from glacial rebound studies.
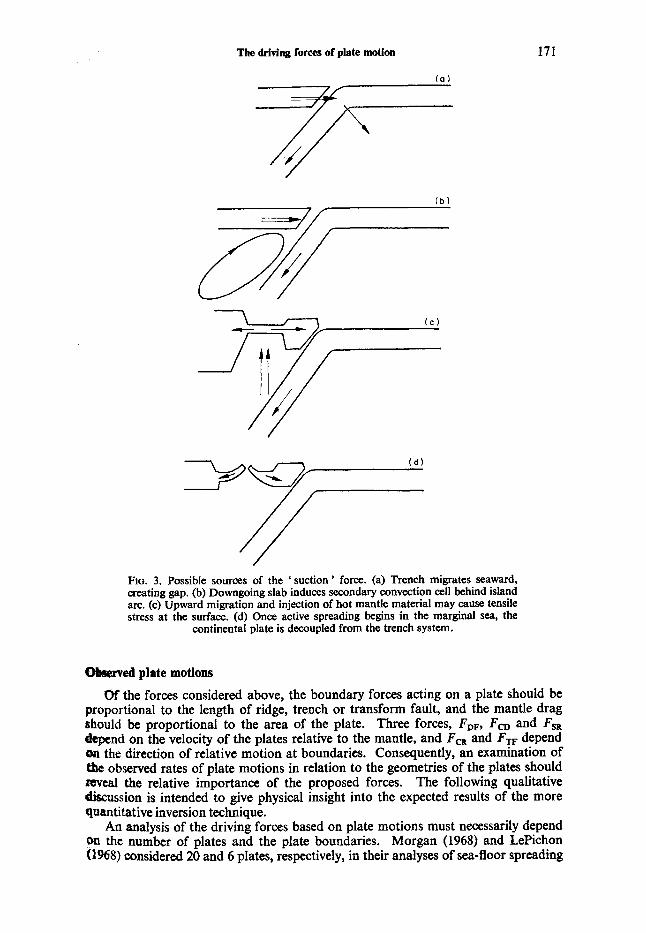
Suction Fsu. Elsasser (1971) suggested that the American and Eurasian plates may be drawn towards the trenches surrounding the Pacific by a form of suction. The plates surrounding the Atlantic are moving apart, overthrusting the plates in the Pacific. Since the radius of the Earth most likely remains constant, the Pacific must be growing smaller and the trenches must be migrating seaward. However, we do not have a clear understanding of the physical nature of the suction force. Elsasser (1971) visualizes this force as due to a continual downwarping of the oceanic plates at trenches, creating an empty space which is continually filled by the seaward movement of the continental plate (Fig. 3(a)). Suction in a fashion to fill the void, however, appears to be incompatible with the notion that a trench is a colliding boundary across which plates are pushing each other. If the seaward movement of continental plates is due merely to the push transmitted from the other side of the plate, the force is already taken care of by FRP and introduction of F,, is unnecessary. However, there may be some mechanism to generate Fs, on the continent side of a trench. McKenzie (1969) and Sleep & Toksoz (1971) postulate that a secondary hydrodynamic flow is induced in the upper mantle above a sinking slab and this flow would generate tensile stress behind island arcs (Fig. 3(b)). The driving force for the Atlantic type plate derived by Richter (1973a) is of a similar nature. Various other processes postulated to explain the opening of marginal seas (Hasebe, Fuji & Uyeda 1970; Karig 1971; Matsuda 8c Uyeda 1971; Sclater et al. 1972; Barker 1972; Uyeda & Miyashiro 1974) would also generate the tensile stress behind island arcs (Fig. 3(c)). However, once the opening of a marginal sea starts, the oceanward migration of trench-arc system becomes an inefficient means of generating suction on the continental plate behind the marginal sea (Fig. 3(d)). In view of the uncertainty of the nature of F,,, in the present paper we modelled it to be velocity independent and perpendicular to the trench, although F,, caused by the secondary flow may be proportional to the descent rate of the slab.
The driving forces of plate motion 171
FIG. 3. Possible sources of the 'suction' force. (a) Trench migrates seaward, creating gap. (b) Downgoing slab induces secondary convection cell behind island ax. (c) Upward migration and injection of hot mantle material may cause tensile stress at the surface. (d) Once active spreading begins in the marginal sea, the
continental plate is decoupled from the trench system.
Oiuerved plate motions
Of the forces considered above, the boundary forces acting on a plate should be pmportional to the length of ridge, trench or transform fault, and the mantle drag rhould be proportional to the area of the plate. Three forces, FDF, FcD and FsR
d on the velocity of the plates relative to the mantle, and Fm and FTF depend a#r %he direction of relative motion at boundaries. Consequently, an examination of * observed rates of plate motions in relation to the geometries of the plates should E#W.fd the relative importance of the proposed forces. The following qualitative &cussion is intended to give physical insight into the expected results of the more -titat ive inversion technique.
An analysis of the driving forces based on plate motions must necessarily depend the number of plates and the plate boundaries. Morgan (1968) and LePichon
considered 20 and 6 plates, respectively, in their analyses of sea-floor spreading
p
FIG
. 4. O
utlin
e of
the
pla
tes
used
in th
is st
udy.
Tria
ngle
s alo
ng b
ound
arie
s in
dica
te d
irect
ion
of u
nder
thru
stin
g w
here
a d
owng
oing
slab
can
be
iden
tifie
d by
th
e oc
curr
ence
of i
nter
med
iate
or d
eep
focu
s ear
thqu
akes
. Sm
all a
rrow
s on
ridge
bou
ndar
ies
indi
cate
app
roxi
mat
e di
rect
ion
of r
elat
ive
mot
ion.
Abb
revi
a-
tions
use
d in
figu
res a
re: E
UR
, Eur
asia
; N
A,
Nor
th A
mer
ica;
SA
, So
uth
Am
eric
a; A
NT,
Ant
arct
ica;
AF,
Afr
ica;
CA
R,
Car
ibbe
an;
AR
AB
, A
rabi
a;
IND
, In
dian
pla
te i
nclu
ding
Aus
tralia
; PH
or
PHIL
, Ph
ilipp
ine;
NA
Z,
Naz
ca;
PAC
, Pa
cific
, and
CO
or C
OC
, CO
CO
S.
The driving forces of plate motion 173
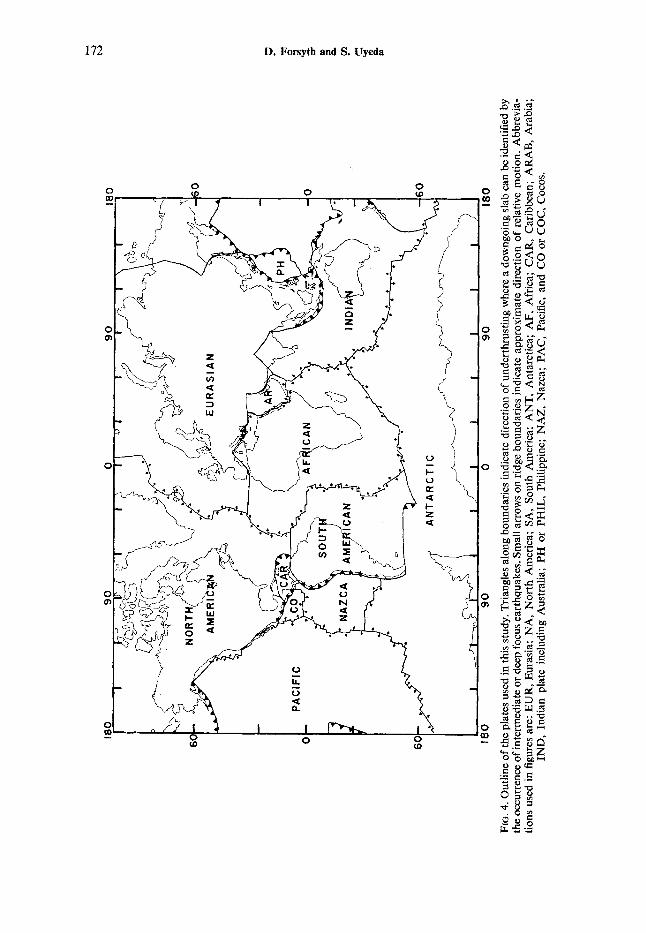
and continental drift, whereas Minster et al. (1974), in their attempt to invert informa- tion on relative motions at plate boundaries to relative plate motions, considered ten plates, including LePichon’s six plates and Cocos, Nazca, Arabia plates and North and South America plates separated. We include, in the present study, the 12 plates as shown in Fig. 4, neglecting any small plates in the Middle America and Mediterran- ean regions as well as the plates whose boundaries and motions are ill-defined, such as the China and Somali plates of Morgan (1973). We treat South America and North America as separate plates, because much evidence suggests to us that they have moved independently throughout much of the history of the opening of the Atlantic (Phillips & Forsyth 1972; LePichon & Fox 1972; LePichon & Hayes 1972; Minster et al. 1974). The boundary between the North American plate and the Eurasian plate is uncertain within the Asian continent due to the small relative motion between the plates in that region. Our boundary is roughly the same as that suggested by Churkin (1972). We used the poles and angular velocities of relative motions between plates given by Morgan (1973). Although more up-to-date information on relative motions is now available (Minster et al. 1974), we feel Morgan’s relative motions are substantially correct and subsequent refinenents will not significantly affect our analysis.
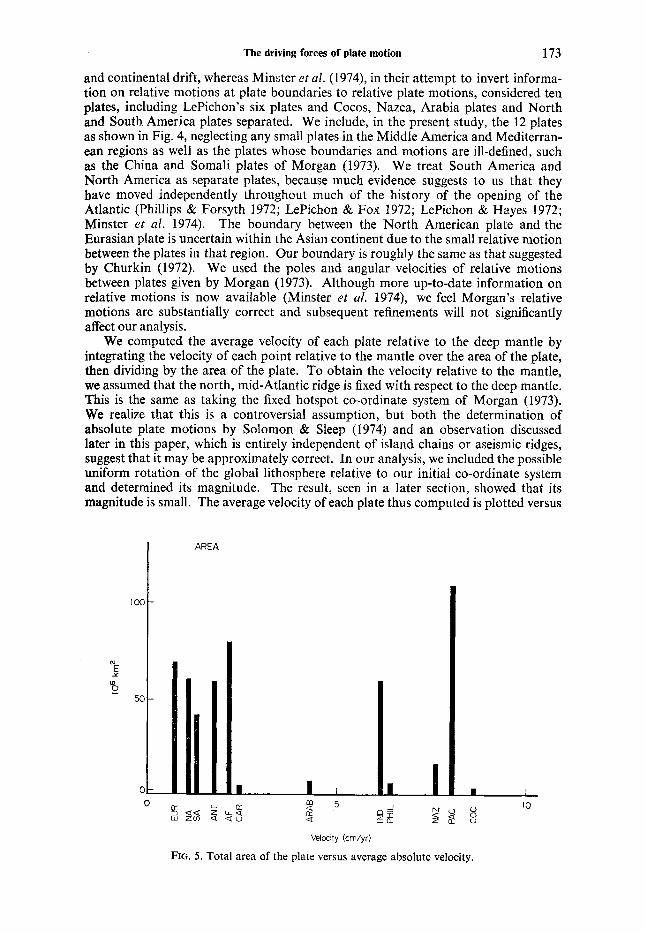
We computed the average velocity of each plate relative to the deep mantle by integrating the velocity of each point relative to the mantle over the area of the plate, then dividing by the area of the plate. To obtain the velocity relative to the mantle, we assumed that the north, mid-Atlantic ridge is fixed with respect to the deep mantle. This is the same as taking the fixed hotspot co-ordinate system of Morgan (1973). We realize that this is a controversial assumption, but both the determination of absolute plate motions by Solomon & Sleep (1974) and an observation discussed later in this paper, which is entirely independent of island chains or aseismic ridges, suggest that it may be approximately correct. In our analysis, we included the possible uniform rotation of the global lithosphere relative to our initiaI co-ordinate system and determined its magnitude. The result, seen in a later section, showed that its magnitude is small. The average velocity of each plate thus computed is plotted versus
N E Y
3 50
Velocity (cm/yr)
FIG. 5. Total area of the plate versus average absolute velocity.
Plat
e
NA
SA
PA
C
AN
T
JND
A
F E
UR
N
AZ
C
OC
C
AR
PHIL
ARAB
area
x lo
6 km
a 60
41
10
8 59
60
79
69
15
2.9
3.8
5.4
4.9
Con
t. ar
ea
x lo
6 km2
36
20
15
15
31
51
-
-
-
-
-
4.4
Ave
r. ah
. vel
.
1.1
1.3
8.0
1.7
6.1
2.1
0.7
7.6
8.6
2.4
6- 4
4.2 lux
Tabl
e 1
Des
crip
tion
of p
late
geo
met
ry
circ
um.
x lof km
388
305
499
356
420
418
421
187 88
88
103 98
Rid
ge
146(
86)
87(7
1)
152(
119)
20
8(17
) 12
4(10
8)
230(
58)
90(3
5)
76(5
4)
40(2
9)
30(2
7)
-
-
Leng
th (
effe
ctiv
e len
gth)
x lo
2 km
Tre
nch
Suct
ion
12(1
0)
60
5(3)
53
12
4(11
3)
30
91(8
3)
30
1~
9)
-
-
116
53(5
2)
-
25(2
5)
-
-
37
41(3
0)
30
-
-
-
-
Tra
nsfo
rm
122
107
180
131
125
I19 56
48
16
44
32
36
p 3 a s 93
Po
167
L
Con
verg
ent
102
Y
17
m 17
1 c
69
Y
63
32
44
71
32
275
E

z a EU
R m
N
A
SA
AN
T 9 3 E: CD
A
F
- C
AR
E
c I;
ti.
AF
P *
CA
R
I
gI
F
5 0
f
Y
AR
AB
L
IND
7
1
Pni
L
5 n - - Y n ? Y
v
AR
AB
t 7-
PH
IL
IN) +
El
0 -1
176
",.
D. Forsyth and S. Uyeda
1
30%
204
10% -
0% ~
Trench length
1 I I
J 10 U U zar 2 2 z a 0 u
0 - 2 5
Velocity (cm/yr)
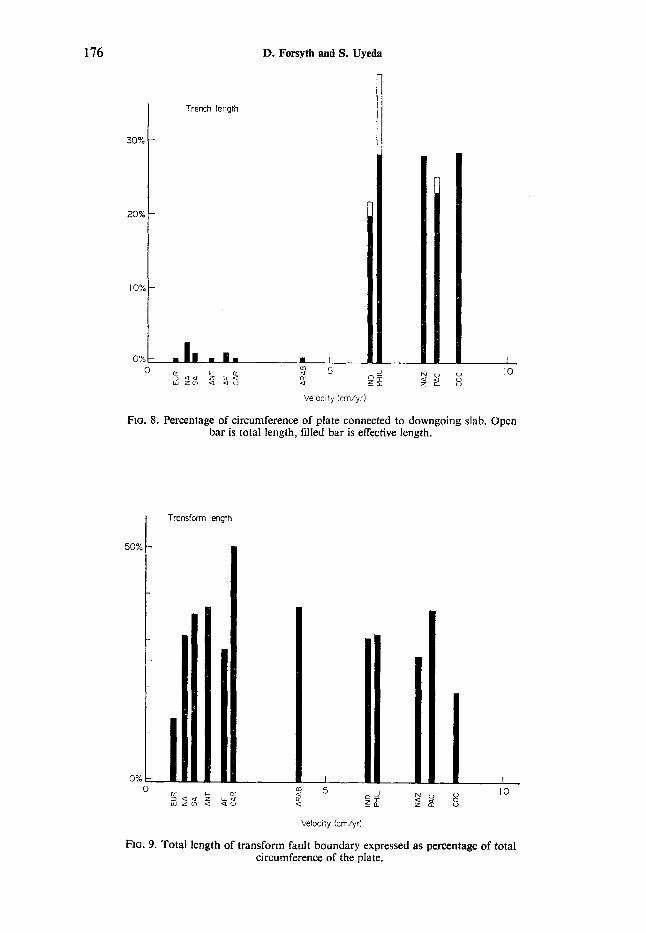
FIG. 8. Percentage of circumference of plate connected to downgoing slab. Open bar is total length, filled bar is effective length.
50:
n c
Transfwm length
II 10
$ 2 8 O n t - r x : 5 o.! % ZiE 3 u u z LL4 w z m < a u
Velocity (cm/yr)
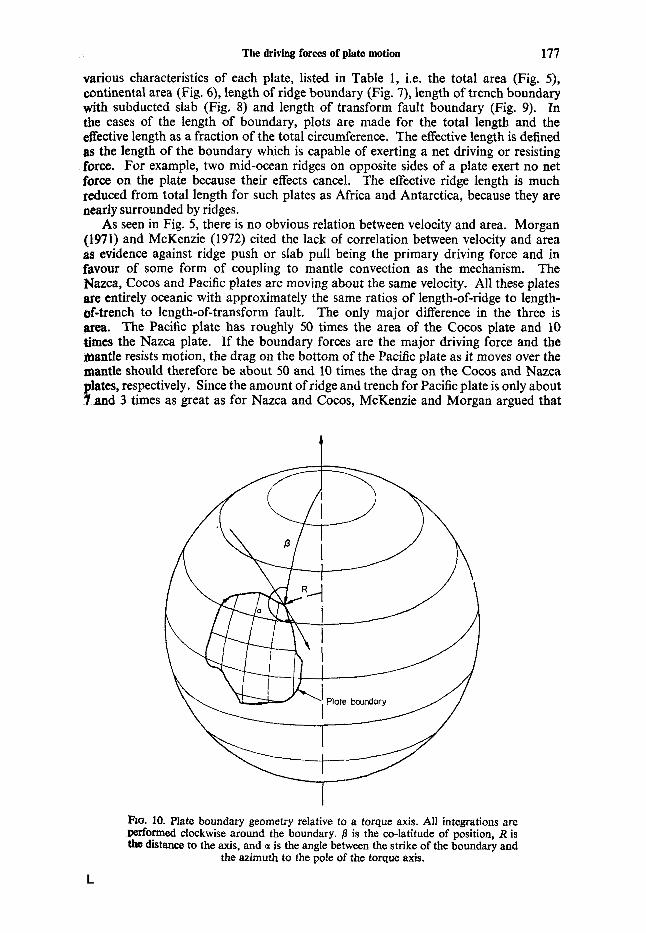
FIG. 9. Total length of transform fault boundary expressed as percentage of total circumference of the plate.
The driving forces of plate motion 177
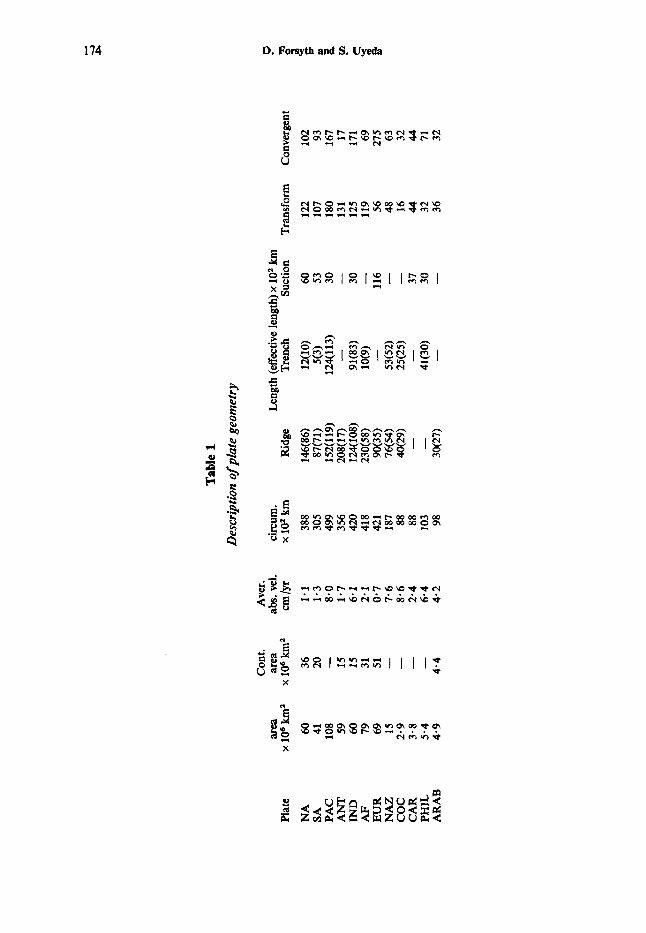
various characteristics of each plate, listed in Table 1, i.e. the total area (Fig. 5), continental area (Fig. 6), length of ridge boundary (Fig. 7), length of trench boundary with subducted slab (Fig. 8) and length of transform fault boundary (Fig. 9). In the cases of the length of boundary, plots are made for the total length and the effective length as a fraction of the total circumference. The effective length is defined as the length of the boundary which is capable of exerting a net driving or resisting force. For example, two mid-ocean ridges on opposite sides of a plate exert no net force on the plate because their effects cancel. The effective ridge length is much reduced from total length for such plates as Africa and Antarctica, because they are nearly surrounded by ridges.
As seen in Fig. 5, there is no obvious relation between velocity and area. Morgan (1971) and McKenzie (1972) cited the lack of correlation between velocity and area as evidence against ridge push or slab pull being the primary driving force and in favour of some form of coupling to mantle convection as the mechanism. The Nazca, Cocos and Pacific plates are moving about the same velocity. All these plates are entirely oceanic with approximately the same ratios of length-of-ridge to length- of-trench to length-of-transform fault. The only major difference in the three is area. The Pacific plate has roughly 50 times the area of the Cocos plate and 10 times the Nazca plate. If the boundary forces are the major driving force and the mantle resists motion, the drag on the bottom of the Pacific plate as it moves over the agantle should therefore be about 50 and 10 times the drag on the Cocos and Nazca plates, respectively. Since the amount of ridge and trench for Pacific plate is only about 7 and 3 times as great as for Nazca and Cocos, McKenzie and Morgan argued that
t
FIG. 10. Plate boundary geometry relative to a torque axis. All integrations are performed clockwise around the boundary. fi is the co-latitude of position, R is the distance to the axis, and a is the angle between the strike of the boundary and
the azimuth to the pole of the torque axis.
L
178 D. Forsyth and S. Uyeda
the Pacific plate would move much more slowly than the other two plates. However, there are two possible explanations of the lack of dependence on area. First, as McKenzie and Morgan favoured, the plates may be strongly coupled to the convection currents in the mantle. Then, the velocity of plates would depend only on the velocity of flow in the mantle beneath them, and the ridges and trenches would be merely secondary features with unimportant influence on the movements of plates. The other possible explanation is that the coupling between plates and mantle beneath them is weak, so that the drag by the mantle has little effect on the velocity of oceanic plates. In this case, the velocity of the oceanic plates are primarily determined by the driving and resistive plate boundary forces. Transform faults are considered to resist relative motion of neighbouring plates. However, Fig. 9 shows no explicit relation between velocity and length-of-transform fault, indicating that resistance at transform faults is not strong enough to be the primary control of plate motions. Ridges may be pushing the plates, but again, Fig. 7 does not indicate any distinct correlation between velocity and length-of-ridge. Fig. 6, essentially the same as Fig. 10 of Minster et al. 1974, does indicate that the plates with greater continental area have smaller velocity. This correlation may be explained either by assuming strong coupling between plates and mantle with slower mantle flow under continents, or by assuming that mantle drag is weak under oceanic plates but strong under continents. Considering the pronounced difference in the low velocity zone under oceans and continents, Knopoff (1972) and Minster et al. (1974) favoured the latter explanation.
The most striking correlation is found between velocity and length of trench with subducted slab as shown in Fig. 8. The plates separate into two distinct groups: plates which are being subducted at trenches over a significant portion of their circum- ference, and those which are not. The Pacific, Nazca, COCOS, Indian and Philippine plates are all connected to downgoing slabs, and are all moving at 6-9 cm/yr relative to the mantle. The other plates are not connected to downgoing slabs and are moving at 0 to 4cm/yr. Another more limited observation, but one not dependent on any absolute co-ordinate system, is that the plate pairs Pacific-Cocos and Pacific-Nazca are moving apart at rates of 12-18cm/yr. (Herron 1972; Larson & Chase 1970), while the plate pairs, North America-Eurasia, North America-Africa and Africa- South America are moving apart at rates of only 2-6 cm/yr. There must be some fundamental difference in the forces acting on these two sets of plates. The suggestion mentioned above that continents are more strongly anchored to the deep mantle may be a partial explanation, but we feel that the dominating factor is the presence or absence of a downgoing slab. Strong continental drag could explain the slower motions of the continental plates, but it does not provide an explanation for the narrow range of velocities of the oceanic plates.
The observations outlined above suggest the following model of the driving mechanism of plate motions. First, the body force associated with the mass excess in the downgoing slab, FSP, is very large. Fsp pulls the plate attached to it and the rate of slab descent into the mantle increases until this force is nearly balanced by the viscous resistive forces acting on the downgoing slab, F S R . The observed fairly uniform rate of descent of 6-9cm/year represents the point of balance which is effectively the terminal velocity of the dense slab falling in a viscous medium. Thus, the velocity of plates attached to downgoing slabs is primarily controlled by the balance of forces acting on the descending slab, FSP + F,, and is independent of the surface geometry. The importance of Fsp and a similar model was proposed previously by Richter (1973a). After attaining the terminal velocity, the net contribution of the downgoing slab to the forces acting on the whole plate is probably small, due to the near balance of the body and viscous forces.
Since plates having no downgoing slabs are also moving, we require pushing from ridges, FRp, and possibly suction toward trenches, F,, to be other driving force or
The driving forces of plate motion 179
forces. These forces, plus any net pull from the downgoing slabs, are balanced by resistive forces, such as the mantle drag F,,, FcD, the colliding resistance, FcR and the transform fault resistance, FTF. All these forces, except possibly the mantle drag under continents, are probably quite small. In the following, we intend to test the above model more quantitatively. As indicated in the preceding discussion, strong coupling to active flow in the asthenosphere is an alternative explanation for the motions of the plates which cannot be eliminated. However, a number of recent theoretical models of convection in the interior of the mantle, briefly summarized in the earlier section on mantle drag, suggest that such a mechanism is unlikely. This mechanism can be tested only if the rate of mantle flow can be measured. Therefore, we disregard the active-flow model in the remainder of the paper and, instead, examine the possibility that the system of boundary forces outlined above can satisfy the existing geophysical constraints.
The model
The basic assumption in our approach is that every plate is in dynamical equili- brium, i.e. the inertia or acceleration term is negligible, so that the sum of the torques acting on a plate must be zero. Since the plates are constrained to move on the surface of the Earth, their instantaneous motions are described as a rotation about an axis passing through the centre of the Earth. In customary plate tectonic terminology, the pole of rotation marks the intersection of the rotation axis with the Earth's surface. If a plate is not undergoing acceleration, the sum of the torques about any axis must be zero. This condition is satisfied if the torques about each of three orthogonal axes, such as 90"N, 0"; 0" N; 0" E; and 0" N, 90" E used in this study, are balanced. A vector representing a torque can be resolved into three components in this Cartesian co-ordinate system. Thus, our problem is to determine the relative sizes of the forces that minimize the components of the net torque on each plate. Since the torques about three axes must vanish, the equilibrium condition gives three equations for each plate in the form that
n
j=1 Ti = C aijxj = 0 (i = 1, 2, 3) (1)
where n is the number of forces under consideration, xj is the coefficient representing the specific intensity of the jth force, and aij includes the geometrical and dynamical factors concerned, such as the length of arm from the axis of rotation, the area, the effective length of trenches, ridges, and transform faults of plates, and the relative velocity between plates or that relative to the mantle, depending which type of forces is to be computed. The expressions for the torque on a plate caused by each type of force are as follows: (suffixes RP, SP etc. have the same meaning as in FRp, Fsp, etc.)
q , R p = a i lx l =fRF~pdl=X,JRCOSadZR (2) Ti,sp = ai2x2 = fRFspdl = -x2jRcosudlT (3)
q , s u = a i 3 x 3 = f R F s u d l = -x,jRcosadl, (4)
Ti, CR = ai4x4 = f RFc-dl = x,JRcos(a+4)dlc ( 5 )
Ti, TF = ai5 X.j = f RFTFdl = X5 J R COS(a+4)dlm (6)
Ti,sR=Ui6Xg = fRFsRd1 =X~JRVMCOS~~ZT (7) ~ , D F = a i 7 x 7 = j J R F D F d A = x 7 V i 5 j R s i n P d A ( 8 )
TitcD = ai8x8 = ffRFc,dA = xg VifjRsinBdA, (9) Wbm! dl, dA, dl,, dl,, dlc, dl,, and dA, are the increments of the plate boundary,
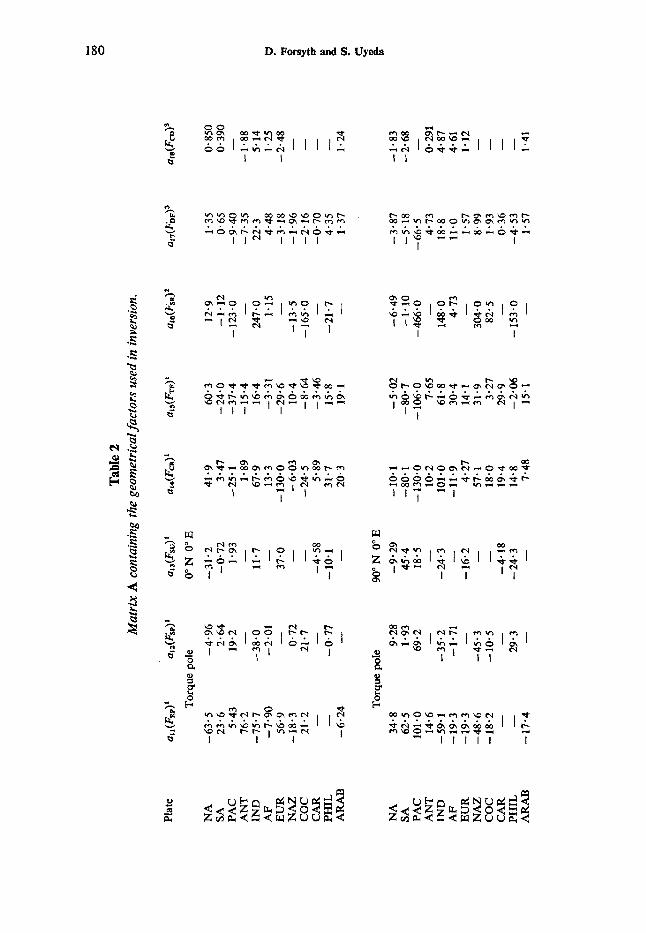
Tabl
e 2
Mat
rix
A c
onta
inin
g th
e ge
omet
rica
l fac
tors
use
d in
inve
rsio
n.
Plat
e
Tor
que
pole
-63.
5 -4
.96
23.6
2.
64
5-43
19
.2
76-2
-
-75.
7 -3
8.0
-7.9
0 -2
.01
56.9
-
- 18
.3
0.72
21
-2
21.7
-
-
-
-0.7
7 -6
.24
-
NA
SA
PA
C
AN
T
IND
A
F E
UR
N
AZ
C
OC
C
AR
PH
IL
AR
AB
-31.
2 -0
.72
1-93
-
11.7
37-0
-
-
-
-4-5
8 -1
0.1 -
41.9
3.
47
1-89
-2
5.1
67.9
13
.3
- 13
0.0
-24.
5 -6
.03
5-89
31
.7
20.3
60.3
-2
4.0
-37.
4 -
15.4
16
.4
-3.3
1 -2
9.6
10-4
-8.64
-3.4
6 15
.8
19.1
12-9
-1
.12
-123
.0 -
247.
0 1.
15
-
-13.
5 -1
65.0
-21.
7 -
-
1.35
0.
65
-9.4
0 -7
.35
22-3
4-
48
-3.1
8 -1
.96
-2.1
6 -0
.70
4.35
1.
37
0.85
0 0.
390
-
-1.8
8 5.
14
1.25
-2
.48 -
P rrl
0 a Y, U
-
1.24
Tor
que
pole
34
.8
9-28
62
.5
1.93
10
1.0
69-2
14
-6
-
-59.
1 -3
5.2
- 19
.3
-1.7
1 -1
9.3
-
-48.
6 -4
5-3
-18.
2 - 1
0.5
-
-
-
29.3
-1
7.4
-
90"N
0"
E
-9.2
9 45
.4
18.5
-
-24.
3
- 16
.2
-
NA
SA
PA
C
AN
T
1ND
A
F
EU
R
NA
Z C
OC
C
AR
PH
IL
AR
AB
-10.
1 - 8
0.1
-130
.0
10.2
10
1.0
-11.
9
57.1
18
.0
19.4
14
.8
4-27
7.48
-5.0
2 -8
0.7
- 10
6.0
7.65
61
.8
30.4
14
-1
31.9
29.9
15- 1
3-27
-2.0
6
-6.4
9 -1
.10
-466
.0 -
148-
0 4.
73
-
304.
0 82
.5
-
- 15
3.0 -
-3.8
7 -5
.18
4.73
-6
6.5
18-8
11
.0
1-57
8.
99
1.93
0.
36
-4.5
3 1-
57
-1.8
3 -2
.68 -
0.29
1 4.
87
4-61
1.
12
-
-
-
-
1.41
-
-4.1
8 -2
4.3
(Tab
le 2
cont
inue
d)
NA
SA
PA
C
AN
T
IND
A
F E
UR
N
AZ
C
OC
C
AR
PH
IL
AR
AB
Not
es:
62.0
-
18.7
-4
7.0
20- 6
-2
5.2
34.5
-5
1.4
20.0
-4
.48 -
-
15.5
Tor
que
pole
0.38
-1
.49
-58.
3
-35.
0 -
7-85
-
13.4
-4
.64
14.5
-
1. I
n un
its o
f 10
" km.
2.
In u
nits
of
10" km
cm y
r-l.
3.
In u
nits
of
lo7 km c
m y
r-l.
0" N
90"
E
38.5
-1
3.3
19.7
11.6
28.3
-
-
-
-
0- 57
5.
67
-22.
8 28
.3
25-7
-
10.0
19
.5
-59.
7 37
.8
- 19.
4 5.
14
2.28
16
.6
-23.
2
-24.
0 16
.7
3.70
-
13.9
43
-3
-7.1
6 0.
61
0.00
6-
83
-17.
6
14.9
-2
3.3
3.60
1.
46
341.
0
242.
0 -
-11.
7
-95.
9 32
.2
55.2
-
-
-1.0
1 -0
.57
30- 3
-1
.84
9.51
-7
.91
2.49
-0
.93
-0.1
2 0.
25
-2.3
2 -0
.07
-0.6
33
-0.1
83
- 0.5
22
2.61
-3
.35
1.84
-
-
-
-
-0.0
67
3 B P c.
c
W
182 D. Forsyth and S. Uyeda
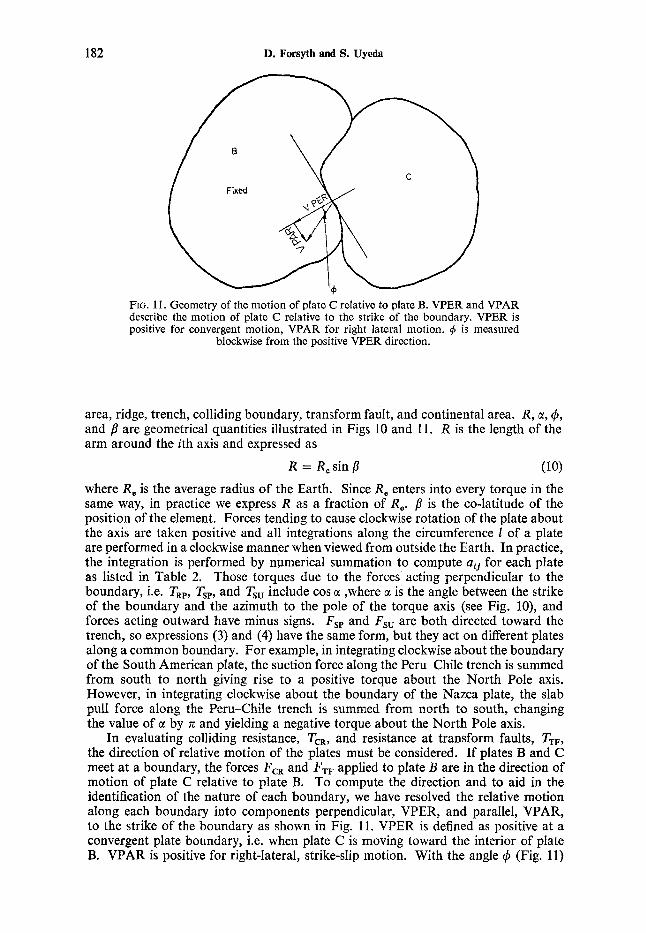
FIG. 11. Geometry of the motion of plate C relative to plate B. VPER and VPAR describe the motion of plate C relative to the strike of the boundary. VPER is positive for convergent motion, VPAR for right lateral motion. 4 is measured
blockwise from the positive VPER direction.
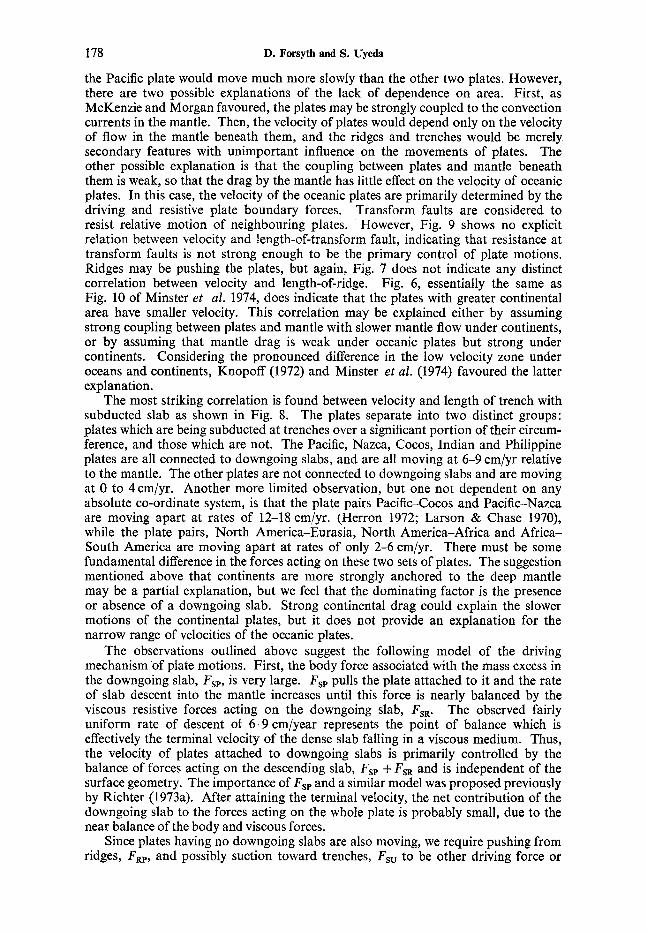
area, ridge, trench, colliding boundary, transform fault, and continental area. R, a, 4, and B are geometrical quantities illustrated in Figs 10 and 11. R is the length of the arm around the ith axis and expressed as
R = Resinp (10) where Re is the average radius of the Earth. Since Re enters into every torque in the same way, in practice we express R as a fraction of Re. p is the co-latitude of the position of the element. Forces tending to cause clockwise rotation of the plate about the axis are taken positive and all integrations along the circumference 1 of a plate are performed in a clockwise manner when viewed from outside the Earth. In practice, the integration is performed by numerical summation to compute aij for each plate as listed in Table 2. Those torques due to the forces acting perpendicular to the boundary, i.e. TRp, Tsp, and T,, include cos a ,where a is the angle between the strike of the boundary and the azimuth to the pole of the torque axis (see Fig. lo), and forces acting outward have minus signs. Fsp and F,, are both directed toward the trench, so expressions (3) and (4) have the same form, but they act on different plates along a common boundary. For example, in integrating clockwise about the boundary of the South American plate, the suction force along the Peru-Chile trench is summed from south to north giving rise to a positive torque about the North Pole axis. However, in integrating clockwise about the boundary of the Nazca plate, the slab pull force along the Peru-Chile trench is summed from north to south, changing the value of a by n and yielding a negative torque about the North Pole axis.
In evaluating colliding resistance, TCR, and resistance at transform faults, TTF,
the direction of relative motion of the plates must be considered. If plates B and C meet at a boundary, the forces FCR and F,F applied to plate B are in the direction of motion of plate C relative to plate B. To compute the direction and to aid in the identification of the nature of each boundary, we have resolved the relative motion along each boundary into components perpendicular, VPER, and parallel, VPAR, to the strike of the boundary as shown in Fig. 11. VPER is defined as positive at a convergent plate boundary, i.e. when plate C is moving toward the interior of plate B. VPAR is positive for right-lateral, strike-slip motion. With the angle 4 (Fig. 11)

The driving forces of plate motion 183
defined as C#J = tan-'(VPAR/VPER),
the torque generated by resistance in the form of shallow earthquakes at convergent plate boundaries, TCR, and the torques generated at transform faults, TTF, are expressed as (5) and (6). At some boundaries where convergent motion of two plates occurs, such as the western Aleutian and the Puerto Rican trenches, a large proportion of strike slip motion is also involved. We have arbitrarily chosen 4 = 60" (WAR = 2 - VPER) as the dividing point between classifying a boundary segment as a conver- gent boundary, I,, or as a transform fault, ITF.
The viscous resistance to the descent of the slab, FSR, and the mantle drag on the base of the plates, F D F , FCD, depend on the motion of the plate relative to the deep mantle. Following the nature of forces given earlier, we take V, as the component of motion of the plate relative to the mantle which is directed perpendicular to the strike of the trench and express the torque TSR as (7).
A simple way to integrate over the area of the plate to find the effect of drag, TCD and TDF, is to resolve the angular rotation vector describing the motion of the plate relative to the mantle into its three components, mi, in the direction of the three, mutually perpendicular, torque axes. Then, if we set Vi = mi Re, the torques acting on a plate are given by (8) and (9). Integration of (9) is performed over the continental part only.
Since there are 12 plates and the net torque on each of them is computed about three perpendicular axes, we have a set of 36 balance equations of the form of (l), with eight unknown parameters xi. In a matrix form the equations are expressed as
AX = 0 (12)
of which elements ai, are listed in Table 2. x is a vector or column matrix containing the coefficients describing the relative size of the forces. Three of the forces, FSR, FDF and F C D require knowledge of the motion of the plates relative to the deep mantle. As discussed previously, the hot spot co-ordinate system which describes this motion may be in error, causing the elements of A involving FSR, F D F , and F c D to be incorrectly computed. Because the three torque axes are orthogonal, when a correction describing the true rotation of the mantle as a whole relative to our original hotspot co-ordinate system is added to the rotation about one of the axes, there is no effect on the terms of A which involve rotation about the other axes. Table 3 lists the corrections to the terms ai6, ai7 and ai8 in Table 2 which would result from a change in our ' fixed mantle ' co-ordinate system. In a later section, we describe a search for the mantle co-ordinate frame in which the equilibrium condition (equation (12)) comes closest to being exactly satisfied.
The condition that the torques on the plates must be balanced has been applied previously by Tullis & Chapple (1973) and Solomon & Sleep (1974) in studies of the driving forces. Tullis and Chapple found, as we do, that pulling from the sinking slab plays a dominant role in controlling plate motions. Solomon and Sleep concluded that the absolute velocities of the plates cannot serve to discriminate among models for the forces driving plates cannot serve to discriminate among models for the forces driving plates. However, the approach of Solomon and Sleep differs from ours in that they considered only the net global torque balance rather than the balance on each individual plate. Consequently, they could say nothing about symmetric forces such as ridge push, colliding resistance, and transform fault resistance, which are involved in the balance on individual plates but exert no net torque on the lithosphere as a whole. In addition, the global balance contains very little information about the asymmetric forces at trenches, due to the nearly symmetric arrangement of trenches surrounding the Pacific. These limitations do not affect the plate-by-plate balance technique.
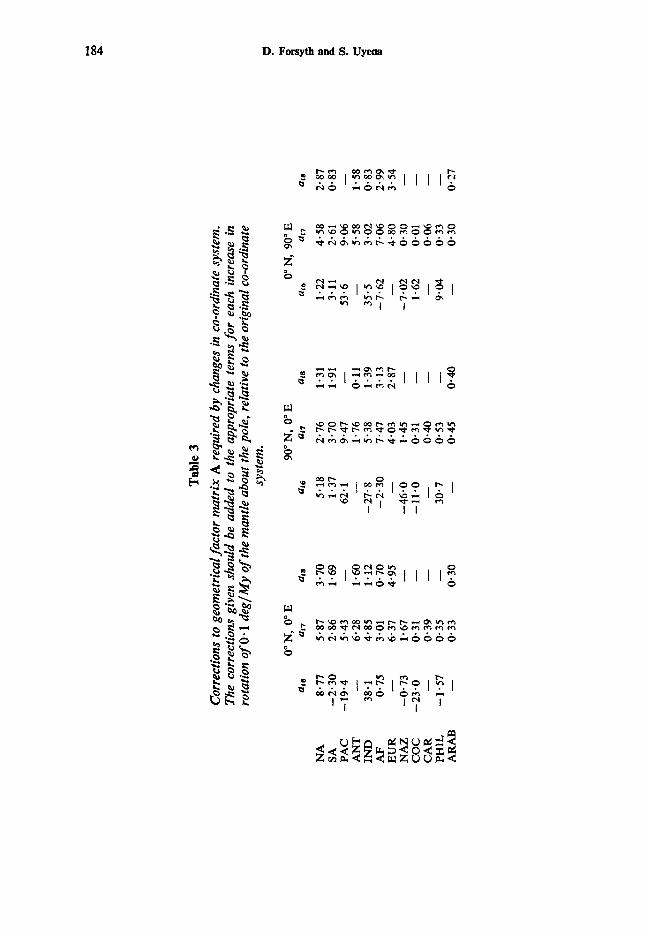
Tab
le 3
C
orre
ctio
ns to
geo
met
rica
l fac
tor
mat
rix
A r
equi
red
by c
hang
es in
co-
ordi
nate
syst
em.
The
corr
ectio
ns g
iven
sho
uld
be a
dded
to
the
appr
opri
ate
term
s for
eac
h in
crea
se in
ro
tatio
n of
0. I
deg
/My of
the
man
tle a
bout
the p
ole,
rela
tive
to th
e or
igin
al c
o-or
dina
te
syst
em.
NA
SA
PA
C
AN
T
IND
A
F
EU
R
NA
Z
CO
C
CA
R
PHIL
A
RA
B
dl6
8.77
-2
.30
- 19.
4
38-1
-
0.75
-
-0.7
3 -2
3.0 -
-1.5
7 -
0' N
, 0"
E
a17
a18
5.87
3-
70
2.86
1.
69
5.43
-
6.28
1.
60
4.85
1.
12
3.01
0.
70
6-31
4.
95
1.67
-
0-31
-
0.39
-
0.35
-
0.33
0.30
dl6
5.18
1.
37
62.1
-
-27.
8 -2
.30 -
-46.
0 -1
1.0
30.7
- -
90" N
, 0"
E
a17
at8
2.76
1.
31
3.70
1.
91
9.47
-
1-76
0.
11
5.38
1-
39
1.47
3-
13
4.03
2-
87
1.45
-
0.31
-
0.40
-
0- 5
3 -
0-45
0.40
0" N
, a1
6
1.22
3.
11
53.6
35.5
-7
.62
-7.0
2 -
-
1.62
9.04
-
-
90" E
a1
7
4.58
2.
61
9.06
5.
58
3.02
7.
06
4.80
0.
30
0.01
0.
06
0.33
0.
30
a18
2- 87
0.
83
1.58
0.
83
2.99
3-
54
-
-
-
-
-
0.27
p 1 m vl
3 a
C 1
The driving forces of plate motion 185
Method of inversion The equilibrium condition yields an overdetermined system, in our case, 36
simultaneous equations in eight unknowns, which we wish to solve in the least- squares sense. If the system is described in the form,
AX = b, (1 3) the matrix A gives the partial derivatives of the model, b is the data, and x are the coefficients or vector which we wish to determine. The first step towards solution is to normalize each column vector of A by a scalar, multiplicative factor which gives the vector unit length. The classic, least-squares solution to the problem is then found by a series of matrix operations. Multiplying each side of (13) by AT, the transposed matrix of A gives
ATAx = ATb (14) where ATA is a square matrix which can be recognized as the correlation matrix of the variables. The diagonal elements of ATA, or the autocorrelation coefficient of each variable, are 1.0 because the column vectors of A were normalized. Equation (14) would give u5 eight equations in eight unknowns, which can be solved to give x:
x = (ATA)-' AT b. (15)
However, our problem differs from the classic, least-squares problem in two significant ways. First, it is usually assumed that the dependent variables, i.e. the elements of A, are perfectly known and that all errors and noise are concentrated in the data, b. In our case, b is perfectly known and there may be errors in A. Secondly, in the equilibrium condition, b is identically zero, so that
A ~ A X = 0. (16) This system of equations has a non-trivial solution only if IAT A1 = 0 or, in other
words, only if there is a zero eigenvalue of AT A. If there is one and only one zero eigenvalue, then the eigenvector for that eigenvalue will be the desired solution for x.
There will be a zero eigenvalue only if there is an exact relation perfectly describing the system, i.e. if the forces acting on every plate are perfectly described by the co- efficients we have measured and listed in Table 2. It is realistic to assume there is some error in our values of A: the plate boundaries are imperfectly known; there is un- certainty in determining the relative motions of the plates; and it is an obvious over- simplification to assume that every ridge or trench pushes or pulls in exactly the same way. Even if our model is correct, the errors in A will lead to non-zero eigenvalues. The difficulty is overcome by using an approximate inverse technique.
We assume that the noise in our model is uncorrelated from one variable to another, so that only the diagonal elements of ATA are affected. With the further assumption that the noise level is the same for each variable, AT A can be expressed in the form
AT A = (A*T A* + E' I ) (1 7) I is the identity matrix, A*' A* is a matrix with a zero eigenvalue, and E' is a measure of the amount of noise in the model. We set ez equal to the value of the smallest eigenvalue of AT A. A*T A* is the best available approximation to the correlation matrix of the variables in the absence of noise. The eigenvector for the smallest eigenvalue of AT A is also the eigenvector for the zero eigenvalue of A*T A* and gives US the desired coefficients describing the relative sizes of the driving forces.
It should be pointed out that a particular solution for x could be obtained by arbitrarily identifying one of the variables as the dependent variable b and proceeding &S in (15). However, this procedure incorrectly implies the other variables are noise free and yields a different solution if a different variable is chosen to be the dependent variable. In the analogous problem with two variables, x and y, we are attempting

186 D. Forsyth and S. Uyeda
to minimize the sum of the square of distances of each point from the regression line, rather than the sum of the squares of the x or y deviations from the line. Lanczos (1961, p. 158) has shown that the smallest possible value of the ratio I A X ~ ~ / ~ X [ ~ is given by the eigenvector for the absolutely smallest eigenvalue of AT A. Our problem has been normalized to give x unit length, so picking the smallest eigenvalue does give the least-squares solution to equation (12). In the two-variable case, this solution is the maximum likelihood solution when the errors in each variable are of the same order (Madansky 1959).
When several variables are considered, there may be several small members among the set of k eigenvalues, &, each yielding a vector giving an approximate solution to (12). Picking only the smallest ,I may result in neglecting some of the information about the system contained in the other eigenvectors, and, because the noise in A also leads to uncertainty in the exact size of each &, we may choose the wrong xk. One way of avoiding these problems is to generate a composite solution which is the weighted sum of several eigenvectors. Each eigenvector is weighted according to the estimate of the noise, &, so that the eigenvector with the smallest eigenvalue is given the most weight. The composite vector is
where the summation is over the p positive eigenvectors whose signal-to-noise ratio, ,I-', is greater than 1.0. Because the sign of an individual eigenvector is arbitrary, we define the sign of each eigenvector so that the sum of its terms is positive, i.e. acting in the direction expected from our earlier physical discussions of the form of the forces. In any individual eigenvector, there may be both positive and negative terms.
We regard the composite solution X, as the most probable solution. The inclusion of several eigenvectors gives information on the non-uniqueness associated with the inverse solution. If there are two small eigenvalues, each eigenvector will yield an equally valid solution to the equilibrium condition, and any linear combination of the two vectors will also be a good solution. Thus, the composite solution defined by equation (18) would be one particular member of a family of possible solutions. If one eigenvalue is only slightly smaller than another, we certainly cannot reject the second eigenvector as being a possible solution. Rather than pick any arbitrary cut-off point at which we reject the second eigenvector, we include it with less weight in our particular solution. The degree of non-uniqueness associated with the particular solution can then be estimated by examining the relative size of the eigenvalues asso- ciated with the vectors included in X,.
At present, no rigorous method is known for estimating the uncertainty in the solution. We can make only a crude estimate based on the size of ,I or 2 for each eigenvector. From repeated experiments using only subsets of the complete data set, it appears that Ek/J(m-n) is a reasonable estimate of the uncertainty in the individual terms of each eigenvector, where m is the number of equations and n the number of unknowns. Thus, in X,, the contribution from eigenvectors with larger eigenvectors is assigned greater error in addition to being given less weight.
Results and discussion
The correlation matrix, ATA, of the geometrical factors related to the various forces is shown in Table 4. In this table, it is immediately noticed that the correlation between the factor describing Fsp (essentially the length of active trench) and the factor describing FSR (product of trench length and the rate of descent of the slab) is much greater than any other correlations. This high correlation (0.9867) dictates

The driving forces of plate motion
Table 4
Correlation matrix A ~ A .
187
FRP
1.0 -0.817 -0.793
0.663 0.405
-0.635 - 0.662 - 0.708
FCR
1.0 0.807
-0.638 - 0.529
0.609 0.597 0.691
- -
1.0 - 0.627 - 0.577
0.603 0.526 0,696
- 1.0
-0.033 -0.987 - 0.367 -0.856
Fsv
- 1.0 0.049
- 0.222 -0.127
FSR
-
-
1.0 0.304 0.852
FCD
- 1.0 0.407
FDF
- 1.0
the whole system. The close correspondence between these two factors is illustrated in Fig. 12. This high correlation coefficient results from the fact that all the plates attached to a significant amount of downgoing slab are moving at roughly the same velocity. It means that, given the geometry of the trench system of a plate, the direction and rate of motion of the plate can be predicted, irrespective of any other geometrical factor describing the plate.
This seems to support our view stated earlier that there is a definite terminal velocity for descent of the slab into the mantle and the motion of the whole plate attached to the slab is controlled by this terminal velocity. For such a situation to take place, the forces acting on the slab must be much larger than the forces acting on the rest of the plate.
A PAC A PHIL
H IND 0 NAZ 0 NA X AF + SA
I I 203 400
-80 t FIG. 12. Relationship between the two geometrical factors describing the down- going slab. aL2 is proportional to trench length and ai6 is proportional to the product of the trench length and the rate of motion of the subducted slab relative to the mantle. The three points for each plate correspond to the three independent
torque axes.
188 D. Forsyth and S. Uyeda
This conclusion is supported by the great number of intermediate and deep focus earthquakes occurring within the descending slabs compared with the number of intra-plate events occurring within the surface plate.
We have modelled the forces acting on the slab as a gravitational body force which is independent of velocity and a resistance to penetration into the mantle which is proportional to velocity. This is the simplest mathematical representation of forces that can result in terminal velocity. However, because of the limited range of velocities of descending plate, there is little observational control over the exact velocity depen- dence of the forces. The form of the actual forces should certainly not be as simple as we have assumed, yet even complex theoretical models involving both the thermal contraction of the colder slab and the elevation of phase boundaries in a plate des- cending into a mantle with realistic rheology suggest there is a fine balance between the gravitational body forces and the mantle resistance or support (Smith & Toksoz, 1972, Toksoz et al. 1973).
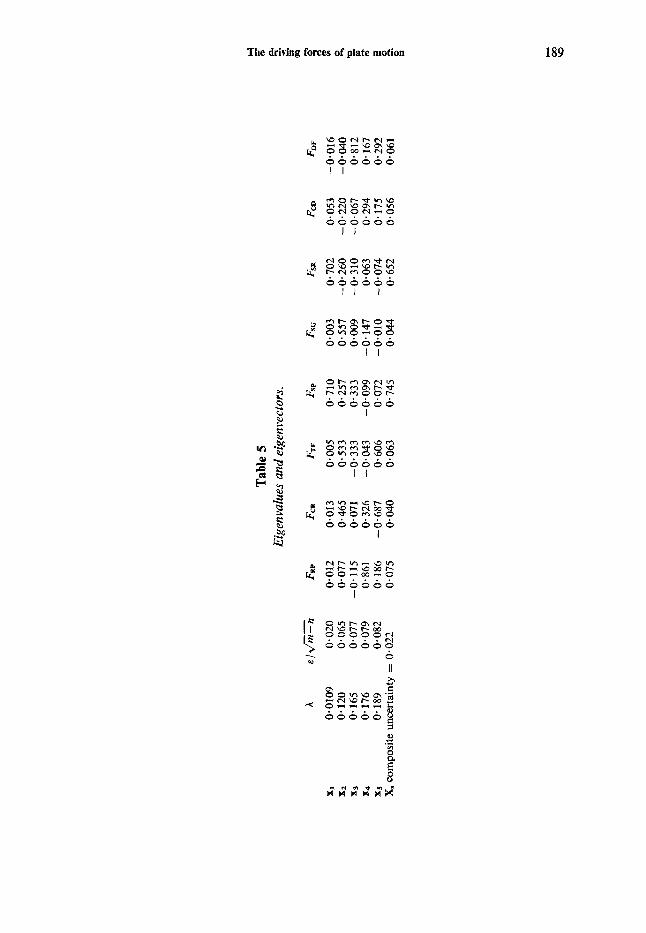
The high correlation coefficient between Fsp and FSR indicates a close linear relation between the two variables which is reff ected in the eigenvector for the smallest eigenvalue. Other than the large terms for slab pull and slab resistance, only drag on the base of the continents is above the noise level in x1 (Table 5). Because A, is significantly smaller than the other eigenvalues, we could cut off the model here, identifying x1 as the unique solution to the equilibrium condition. However, this solution is physically unsatisfying for two reasons. First, taking only the smallest eigenvalue and eigenvector yields a description of the forces acting only on the plates attached to a significant amount of slab and provides no explanation for the motion of the continental plates. Second, since both FSP and F,, act on the sinking portion of the plate, x1 gives little information about the net balance of forces on the surface plates. By adding the other four eigenvectors with small eigenvalues to the solution in obtaining X, (equation 18), the total imbalance of forces, IAx12/(x[Z, is slightly increased over that achieved using x1 alone, but the net balance of forces acting on the surface plates is improved. This method provides a non-unique, but reasonable system of forces which contains a description of forces acting on the slower-moving plates.
The value of E’, the smallest eigenvalue of AT A, is 0.01 1. The amplitude of the noise in the elements of A is of the order of E , or about 10 per cent of the size of the geometrical factors. There is no confusion in picking the smallest eigenvalue, as the next smallest eigenvalue is more than 10 times larger, with a value of 0.120. Table 5 gives the eigenvectors for the smallest eigenvalues, and the solution X,. Because the vectors of geometrical factors describing each force have been normalized to unit length, the relative size of the terms of X, gives the relative importance or net contribution of each force in achieving the balance of torques. A summary of the forces and the interpretation of X, in terms of relative strength per unit length of boundary or per unit area is given in Table 6. Those forces which are proportional to velocity are expressed per unit velocity. To illustrate the difference between relative importance and relative strength, consider the ridge push and suction terms. Even though F R p is not quite as strong per unit length as Fsv, it is more important because of the greater total length of ridge boundary compared to trench and because FRp acts on both neighbouring plates, instead of just the overriding plate.
The final model, X,, shows that slab pull and slab resistance are an order of magnitude more important than the other forces. I-Iowever, the net pull of downgoing slabs on the surface plates, FSP+ FSR, is of the same order as the rest of the terms.
In the equilibrium state, Fsp is roughly balanced by FSR with the terminal velocity computed to be 7.0 cm/yr (= 5.65/0.82). This value is roughly coincident with the average velocity of oceanic plates attached to a slab. Drag under the continents, Fm + FDF, is approximately eight times as strong as the mantle drag under the oceanic portion of the plates. Because the effective area is less and the absolute velocity is
Tabl
e 5
Eige
nval
ues
and
eige
nvec
tors
.
h &
lZ/;;
;-n
FRP
Fca
FTF
FSP
FS,
FSR
FCD
FDF
XI
0.01
09
0.02
0 0.
012
0.01
3 0.
005
0.71
0 0.
003
0.70
2 0.
053
-0.016
x2
0.12
0 0.
065
0-07
7 0.
465
0.53
3 0.
257
0.55
7 -0
.260
-0
.220
-0.040
x3
0-16
5 0.
077
-0.1
15
0.07
1 -0
.333
0.
333
0.00
9 -0
.310
-0
.067
0.
812
x*
0.17
6 0.
079
0.86
1 0.
326
-0.0
43
-0-099
-0.1
47
0.06
3 0-
294
0- 16
7 xs
0.18
9 0.
082
0.18
6 -0
.687
0.
606
0.07
2 -0
.010
-0
.074
0.
175
0.29
2 X.
com
posi
te u
ncer
tain
ty =
0.0
22
0.075
0.04
0 0.
063
0.74
5 0.
044
0.65
2 0-
056
0.061
s E
8
W
190 D. Forsyth and S. Uyeda
Table 6
Summary of the forces Relative
Form Direction Importance, X, strength Force.
FRP FCR FTF FSP Fsu FSR FCD FDF
ad1 I strike a dl opp. rel. motion a dI opp. rel. motion a dl I strike a dl I strike a V M i d l l strike u VM dA opp. abs. motion a VM dA opp. abs. motion
0.075 0.040 0.063 0.745 0.044 0.652 0.056 0.061
0.36 0.16 0.36 6.43 0.50 0.89 5.65 0.82
Uncertainty units
f 0.10 km-' +- 0.09 km-' i- 0.13 km-' & 0.19 km-I f. 0.25 km-I i- 0.03 km-km-' yr i- 2.22 km-2 cm-' yr i- 0.30 lo-' km-2 cm-' yr
slower under the continents, the net importance of FcD is about the same as FDF, even though continental drag is the primary regulator of the velocity of plates not attached to downgoing slabs. The magnitude of uncertainty in the terms prevents any detailed analysis of the relative strength of the smaller terms.
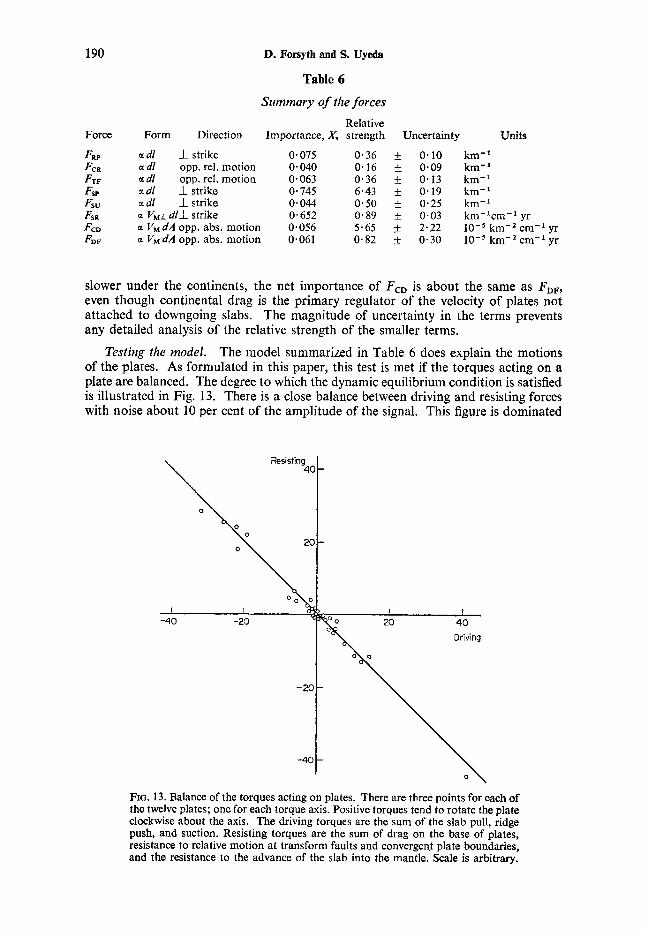
Testing the model. The model summarized in Table 6 does explain the motions of the plates. As formulated in this paper, this test is met if the torques acting on a plate are balanced. The degree to which the dynamic equilibrium condition is satisfied is illustrated in Fig. 13. There is a close balance between driving and resisting forces with noise about 10 per cent of the amplitude of the signal. This figure is dominated
-40 -20
- 21
-41
I I 2Q 40
Driving Driving
FIG. 13. Balance of the torques acting on plates. There are three points for each of the twelve plates; one for each torque axis. Positive torques tend to rotate the plate clockwise about the axis. The driving torques are the sum of the slab pull, ridge push, and suction. Resisting torques are the sum of drag on the base of plates, resistance to relative motion at transform faults and convergenf plate boundaries, and the resistance to the advance of the slab into the mantle. Scale is arbitrary.
The driving forces of plate motion 191
‘ O t
Net resisting
\
FIG. 14. Balance of the net torques acting on the surface plates. Same as Fig. 13 except that slab pull and slab resistance are combined into one term included as a driving torque. As there is uncertainty in both the resisting and driving terms, the best estimate of the error is the perpendicular distance to the balance line. The
scale units are the same as in Fig. 13.
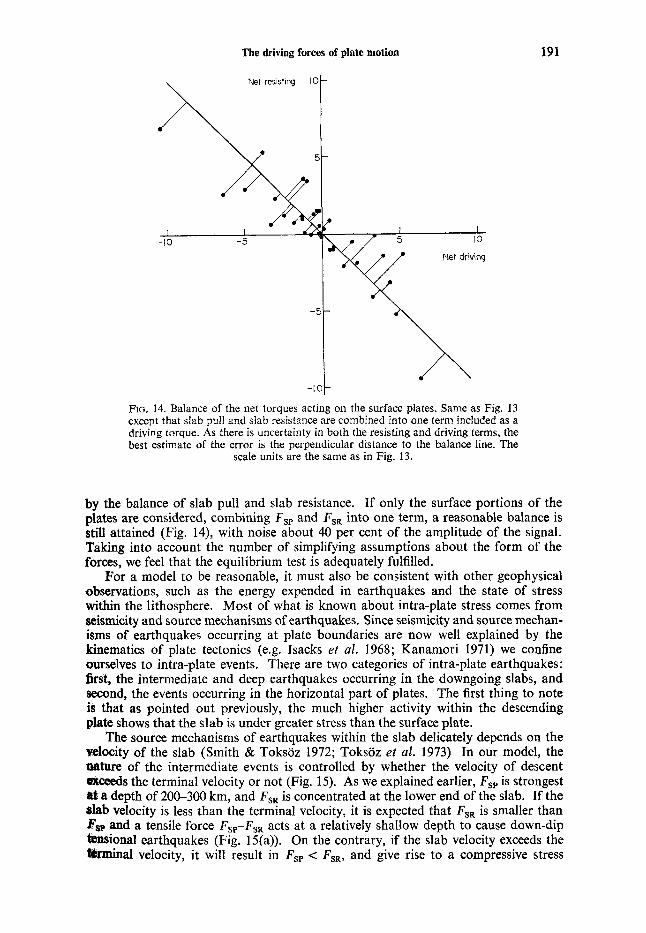
by the balance of slab pull and slab resistance. If only the surface portions of the plates are considered, combining FSP and F,, into one term, a reasonable balance is still attained (Fig. 14), with noise about 40 per cent of the amplitude of the signal. Taking into account the number of simplifying assumptions about the form of the forces, we feel that the equilibrium test is adequately fulfilled.
For a model to be reasonable, it must also be consistent with other geophysical observations, such as the energy expended in earthquakes and the state of stress within the lithosphere. Most of what is known about intra-plate stress comes from seismicity and source mechanisms of earthquakes. Since seismicity and source mechan- isms of earthquakes occurring at plate boundaries are now well explained by the kinematics of plate tectonics (e.g. Isacks et al. 1968; Kanamori 1971) we confine ourselves to intra-plate events. There are two categories of intra-plate earthquakes: first, the intermediate and deep earthquakes occurring in the downgoing slabs, and second, the events occurring in the horizontal part of plates. The first thing to note is that as pointed out previously, the much higher activity within the descending plate shows that the slab is under greater stress than the surface plate.
The source mechanisms of earthquakes within the slab delicately depends on the velocity of the slab (Smith & Toksoz 1972; Toksoz et al. 1973) In our model, the nature of the intermediate events is controlled by whether the velocity of descent a e d s the terminal velocity or not (Fig. 15). As we explained earlier, Fsp is strongest 3tP depth of 200-300 km, and FSR is concentrated at the lower end of the slab. If the slab velocity is less than the terminal velocity, it is expected that FsR is smaller than #‘~p and a tensile force FSp-FSR acts at a relatively shallow depth to cause down-dip htsional earthquakes (Fig. 15(a)). On the contrary, if the slab velocity exceeds the terminal velocity, it will result in Fsp < FSR, and give rise to a compressive stress
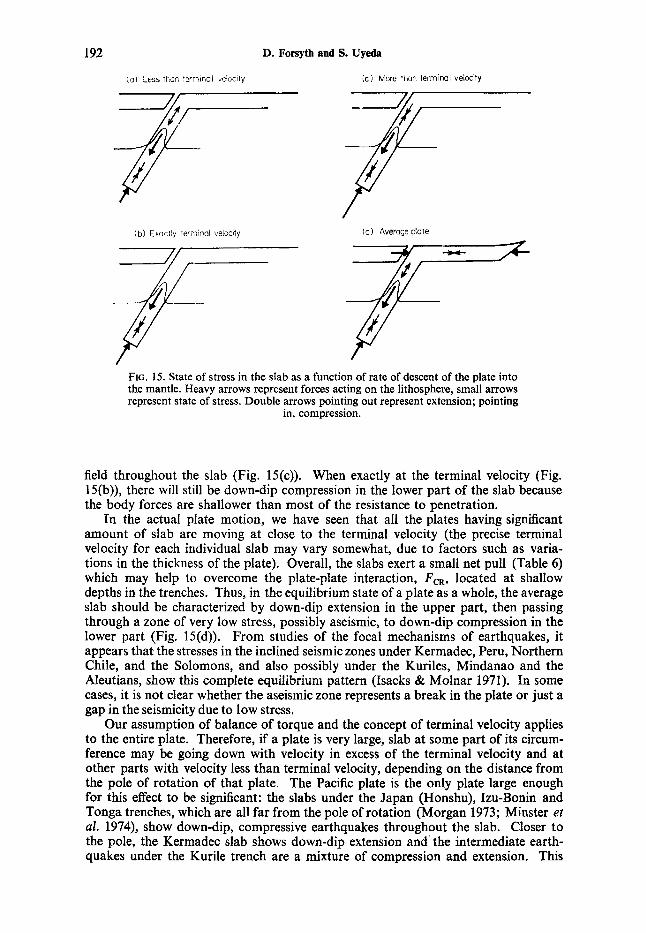
192 D. Forsyth and S. Uyeda
(a) Less tban :mr lnal velocity ( c ) Mere than ierrninal velocity
(b) Exoct'v !efrninal veloci:y (d 1 Average pla te
FIG. 15. State of stress in the slab as a function of rate of descent of the plate into the mantle. Heavy arrows represent forces acting on the lithosphere, small arrows represent state of stress. Double arrows pointing out represent extension; pointing
in, compression.
field throughout the slab (Fig. 15(c)). When exactly at the terminal velocity (Fig. 15(b)), there will still be down-dip compression in the lower part of the slab because the body forces are shallower than most of the resistance to penetration.
In the actual plate motion, we have seen that all the plates having signiiicant amount of slab are moving at close to the terminal velocity (the precise terminal velocity for each individual slab may vary somewhat, due to factors such as varia- tions in the thickness of the plate). Overall, the slabs exert a small net pull (Table 6) which may help to overcome the plate-plate interaction, FCR, located at shallow depths in the trenches. Thus, in the equilibrium state of a plate as a whole, the average slab should be characterized by down-dip extension in the upper part, then passing through a zone of very low stress, possibly aseismic, to down-dip compression in the lower part (Fig. 15(d)). From studies of the focal mechanisms of earthquakes, it appears that the stresses in the inclined seismic zones under Kermadec, Peru, Northern Chile, and the Solomons, and also possibly under the Kuriles, Mindanao and the Aleutians, show this complete equilibrium pattern (fsacks & Molnar 1971). In some cases, it is not clear whether the aseismic zone represents a break in the plate or just a gap in the seismicity due to low stress.
Our assumption of balance of torque and the concept of terminal velocity applies to the entire plate. Therefore, if a plate is very large, slab at some part of its circum- ference may be going down with velocity in excess of the terminal velocity and at other parts with velocity less than terminal velocity, depending on the distance from the pole of rotation of that plate. The Pacific plate is the only plate large enough for this effect to be significant: the slabs under the Japan (Honshu), Izu-Bonin and Tonga trenches, which are all far from the pole of rotation (Morgan 1973; Minster et al. 1974), show down-dip, compressive earthquakes throughout the slab. Closer to the pole, the Kermadec slab shows down-dip extension and- the intermediate earth- quakes under the Kurile trench are a mixture of compression and extension. This
The driving forces of plate motion 193
model predicts that the Aleutian seismic zone should reflect the features of a relatively slow-moving slab and be under extension. One of the only two mechanism solutions known for the area shows down-dip compression, but the other event, which is extensional, is shallower than the inconsistent mechanism (Isacks & Molnar 1969). We do not claim that our model explains the nature of every intermediate or deep earthquake, but it is consistent with the general pattern of stresses within the des- cending plates.
It is worth repeating that even though the forces acting on downgoing slabs control the velocity of the oceanic plates, in the equilibrium state, the net force from the slab is small. Consequently, the horizontal part of the plate should be under a weak, compressive stress due to the push from the ridges which is balanced by resistance at trenches and transform faults and by weak drag on the base of the plate. This is consistent with the predominance of horizontal, compressive stress reported for the rare, oceanic, intra-plate events (Mendiguren 1971; Forsyth 1973; Sykes & Sbar 1973). Plates such as South America, which experience a push from the ridge on one side, and suction and plate-plate collision on the other side, should be under compression in the oceanic portion, but may show little stress in the interior of the continent. The least understood part of our model is the nature of this suction force. Again, our simple model is not capable of explaining all intra-plate stresses, but it is not inconsistent with the limited number of observations now available.
The magnitude of the stresses involved is always difficult to estimate. A number of in situ stress measurements suggest that the deviatoric stresses in surface plates may reach a few hundred bars (Sbar & Sykes 1973), which is consistent with the scaling of forces suggested below. However, Hanks (1971) and Watts & Talwani (1974) have suggested that the topographic rises seaward of some trench axes may be due to horizontal compressive stresses of kilobars. If their simple, elastic flexure model of the formation of these rises is correct, the stresses involved are too large to have been generated by boundary forces. However, the horizontal compressive stresses needed may have been grossly overestimated (Watts & Talwani 1974) due to the neglect of possible effects such as plastic flow within the lithosphere, bending moments applied at the trench, and uplift of the oceanic plate due to upward return flow of astheno- spheric material.
To test whether the model can meet the energy requirements, the relative strength of the forces must be converted to an absolute scale. We feel that ridge push is the best understood force, so we compute its strength in order to calibrate the entire system. McKenzie (1972) showed that the mean excess pressure AP exerted on the lithosphere due to the elevation of the ridges above the surrounding sea floor is approximately
where e is the elevation of the ridge above the deep sea floor and po and pw are the densities of lithosphere and sea water, respectively. This yields an average stress across the lithosphere of the order of 300 bars. Artyushkov (1973), using a more complex model, arrived at an average value of 230 bars. The total work W, done by this force in a year is
where 2V is the mean separation rate of all the world's extensional boundaries of total length L and 1 is the thickness of the lithosphere. Substituting
AP = 38@0 - Pw) e (19)
WRp = 2VAPlL (20)
po = 3.3 g cm-' e = 3 h
L = 50,000 km 1 = 80km
and V = 2.8 cm/yr (Anderson et al. 1973) gives
WRp = 8 x loz5 erg/yr.
M
194 D. Forsyth and S. Uyeda
In our model, the push from the ridge has about the same importance as resistance at collisional boundaries and transform faults. Thus, the annual elastic energy release should be of the same order as the work input at the ridges. The mean annual seismic energy release is about 6 x loz4 erg/yr. Taking into account the seismic efficiency (Wyss 1970),the total elastic energy release is roughly 6 x 10” erg/yr, in excellent agreement with WRp. It must be emphasized that both figures are only order of magnitude estimates. The additional energy dissipated under the plates by drag can be supplied by the work done by suction and by the net pull of the slabs. Thus, the model presented here of boundary driving forces does meet the energy requirements.
We have argued that one possible explanation for the lack of correlation of velocity with area (Fig. 5) is weak-coupling between the lithosphere and the deeper mantle. How low does the viscosity of the asthenosphere have to be to achieve this decoupling and produce the small drag force computed in the model? We convert F D F to absolute units using the absolute size of FRp derived in the previous paragraph and the relative strength of the forces given in Table 6. F D F is directly proportional to absolute velocity, with drag at 8 cm/yr roughly 5 bars. (All estimates in this section are order of magnitude estimates only, due to the uncertainty in the relative sizes of the terms.) If the return flow is confined between the base of an 80 km thick lithosphere and a depth of 300 km, the viscosity of this 220 km thick, asthenospheric layer must be about 5 x loi9 poises to produce the computed drag force. If the bottom of the layer is raised to 200 km, the viscosity must be reduced by a factor of 3 to maintain FDF at the same level. With the same assumptions, the viscosity under the continents is about eight times larger, or from 1 -4 x 10” poises. These estimates are very reasonable. Recent studies of isostatic rebound under Fennoscandia, Canada, West Siberia and Lake Bonneville (Takeuchi & Hasegawa 1967; McConnell 1965, 1968a, b; Walcott 1970; Artyushkov 1971 ; Lliboutry 197 1) indicate that asthenospheric viscosity under continents is on the order of 10’’ to 10” poises. In addition, the increase in viscosity to 10’’ to loz3 poises below the soft asthenosphere would provide the added strength needed to resist the plunge of the downgoing slab into the deeper mantle.
Non-uniqueness. The smallest eigenvalue is an order of magnitude smaller than any other eigenvalue, so the features described in x1 are well determined, i.e. Fsp and FSR must be nearly equal and at least an order of magnitude larger than the other forces. The other features of the model are non-unique. Thus, the tests described in the preceding section based on the scaling of the forces to F,, must be regarded as only tests of one particular solution. These tests show that a model of boundary forces as the driving mechanism is reasonable, but it cannot be stated with any confidence that, for example, FTF is larger than FCR or that the ratio of Fsp to FSR is well known. The relative sizes of these terms cannot be changed arbitrarily without degrading the balance illustrated in Fig. 14, but, if the proper combination of forces is varied, the balance conditions can be equally well satisfied. This non-uniqueness arises from the existence of four eigenvectors with nearly the same eigenvalue or noise-level (Table 5). If the amount of one of the eigenvectors used in obtaining X, is increased at the expense of another eigenvector with the same noise-level, the signal-to-noise ratio of the final solution will be unaltered. Thus, with four eigenvectors with similar values of 2, there are three degrees of freedom which can be used to vary the relative sizes of the smaller terms in X, in such a way as to satisfy pre-existing conditions on their relative strength. If, for example, we think we know from observations of the energy released in earthquakes that resistance to motion at boundaries where plates converge is stronger than at transform faults, we could satisfy F C R > FTF with a proper com- bination of eigenvectors x2 through x5. The non-uniqueness associated with this problem does not affect our primary conclusions that a set of boundary forces can satisfy the existing observational constraints on the driving mechanism of plate tec- tonics and that the forces on the downgoing slab control the motion of the oceanic plates.
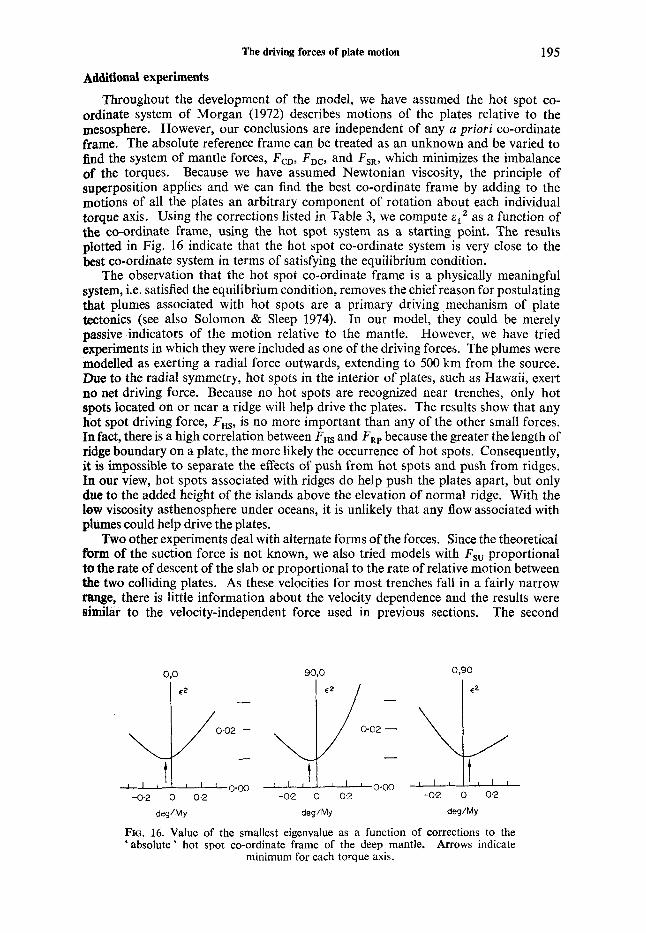
The driving forces of plate motion 195
Additional experiments
Throughout the development of the model, we have assumed the hot spot co- ordinate system of Morgan (1972) describes motions of the plates relative to the mesosphere. However, our conclusions are independent of any a priori co-ordinate frame. The absolute reference frame can be treated as an unknown and be varied to h d the system of mantle forces, FcD, FDc, and FSR, which minimizes the imbalance of the torques. Because we have assumed Newtonian viscosity, the principle of superposition applies and we can find the best co-ordinate frame by adding to the motions of all the plates an arbitrary component of rotation about each individual torque axis. Using the corrections listed in Table 3, we compute e l2 as a function of the co-ordinate frame, using the hot spot system as a starting point. The results plotted in Fig. 16 indicate that the hot spot co-ordinate system is very close to the best co-ordinate system in terms of satisfying the equilibrium condition.
The observation that the hot spot co-ordinate frame is a physically meaningful system, i.e. satisfied the equilibrium condition, removes the chief reason for postulating that plumes associated with hot spots are a primary driving .mechanism of plate tectonics (see also Solomon & Sleep 1974). In our model, they could be merely passive indicators of the motion relative to the mantle. However, we have tried experiments in which they were included as one of the driving forces. The plumes were modelled as exerting a radial force outwards, extending to 500 km from the source. Due to the radial symmetry, hot spots in the interior of plates, such as Hawaii, exert no net driving force. Because no hot spots are recognized near trenches, only hot spots located on or near a ridge will help drive the plates. The results show that any hot spot driving force, FHs, is no more important than any of the other small forces. In fact, there is a high correlation between FHS and FRp because the greater the length of ridge boundary on a plate, the more likely the occurrence of hot spots. Consequently, it is impossible to separate the effects of push from hot spots and push from ridges. In our view, hot spots associated with ridges do help push the plates apart, but only due to the added height of the islands above the elevation of normal ridge. With the low viscosity asthenosphere under oceans, it is unlikely that any flow associated with plumes could help drive the plates.
Two other experiments deal with alternate forms of the forces. Since the theoretical form of the suction force is not known, we also tried models with Fsu proportional to the rate of descent of the slab or proportional to the rate of relative motion between the two colliding plates. As these velocities for most trenches fall in a fairly narrow rmge, there is little information about the velocity dependence and the results were similar to the velocity-independent force used in previous sections. The second
,+, I ,$, I + 0.02 - 0.02 -
OGO 0.00 -0.2 0 0.2 - 0 2 0 0.2 -0.2 0 0 2
deg/My deg/My deg/My
FIG. 16. Value of the smallest eigenvalue as a function of corrections to the ‘absolute’ hot spot co-ordinate frame of the deep mantle. Arrows indicate
minimum for each torque axis.

196 D. Forsyth and S. Uyeda
experiment dealt with the form of slab resistance. We modelled resistance as chiefly opposing the advance of the slab into the mantle, neglecting any resistance to the motion of the slab parallel to the strike of the trench. If we model the resistance as viscous drag on the top and bottom surfaces of the descending plate, so that resistance directly opposes the motion instead of being perpendicular to the trench, increases by a factor of about 3. Thus, we conclude that our original model is better, and that resistance to the downgoing slab is concentrated at the leading edge.
In conclusion, we have derived a system of forces acting primarily at the boundaries of plates, with the asthenosphere playing a passive role, which can produce the observed motions of lithospheric plates. The possibility cannot be eliminated that the surface features may be secondary and plate motion is controlled by strong coupling to convection currents in the mantle. However, this possibility can only be proven if some new observational method is developed which is capable of measuring mantle flow rates. The boundary force model can be further tested. The boundary model can be employed to predict the motions of a set of plates not previously considered, while the coupled convection model says nothing about any other geometry. In our model, as the geometry of the plates gradually changes due to the subduction of ridges, etc., the forces on the plates also evolve, inducing changes in the direction and rate of sea-floor spreading in a predictable manner. Thus, the system of boundary forces derived in this paper can be tested by examining the history of plate motions.
Acknowledgments
This paper grew out of a seminar class held at MIT in the spring of 1972. All participants in the course and many other colleagues contributed to the development of the ideas. We wish to particularly acknowledge discussions with Keiiti Aki, Ken Anderson, Raymon Brown, Paul Kasameyer and A1 Smith. We thank Roger Ander- son, Marcus Langseth, Marc Sbar and Manik Talwani for critically reviewing the manuscript.
This research was supported by the Office of Naval Research under contract N00014-67-02004-0048 and by National Science Foundation grants GA-37093X and DES73-005 12-AO1. While at Lamont-Doherty Geological Observatory, S . Uyeda was Vetlesen Visiting Professor of Geology.
Department of Earth and Planetary Sciences, Lamont-Doherty Geological observatory Massachusetts Institute of Technology of Columbia University
Cambridge, Massachusetts 021 39 Palisades, New York 10964
References Ahrens, T. J. & Syono, Y., 1967. Calculated mineral reactions in the Earth’s mantle,
J. geophys. Ref., 72,41814188. Alexander, S. S., 1974. Comparison of crust and mantle structure beneath shields and
the influence of shields on the dynamics of plate motions, EOS, Trans. Am. geophys. Un., 55,358-359.
Anderson, R. N., McKenzie, D. P. & Sclater, J. G., 1973. Gravity, bathymetry and convection in the earth, Earth planet. Sci. Lett., 18,391407.
Artyushkov, E. V., 1971. Rheological properties of the crust and upper mantle according to data on isostatic movements, J. geophys. Res., 76,1376-1390.
Artyushkov, E. V., 1973, Stresses in the lithosphere caused by crustal thickness inhomogeneities, J. geophys. Res., 78,7675-7708.
The driving forces of plate motion 197
Atwater, T., 1970. Implications of plate tectonics for the Cenozoic tectonic evolution
Barker, P. F., 1972. A spreading center in the east Scotia Sea, Earth planet. Sci. Lett.,
Brace, W. F. & Byerlee, J. D., 1966. Stick-slip as a mechanism of earthquakes, Science, 153,990-992.
Brune, J. N., 1968. Seismic moment, seismicity, and rate of slip along major fault zones, J. geophys. Res., 73,777-784.
Chandrasekhar, S . , 1953. The onset of convection by thermal instability in spherical shells, Phil. Mag. Ser. 7,44,233-241.
Churkin, M., 1972. Western boundary of the North American continental plate in Asia, Geol. SOC. Am. Bull., 83,1027-1036.
Davies, G. F. & Brune, J. N., 1970. Regional and global fault slip rates from seismicity, Science, 229, 101-107.
Dewey, J. F. & Bird, J. M., 1970. Mountain belts and the new global tectonics, J. geophys. Res., 75,2625-2647.
Dietz, R. S., 1961. Continent and ocean basin evolution by spreading of the sea floor, Nature, 190,854-857.
Elsasser, W. M., 1969. Convection and stress propagation in the upper mantle, The application of modern physics to the earth and planetary interiors, 223-246, ed. S . K. Runcorn, Wiley-Interscience, New York.
Elsasser, W. M., 1971. Sea-floor spreading as thermal convection, J . geophys. Res., 76, 1101-1 112.
of western North America, Bull. geol. SOC. Am., 81,351 3-3536.
15,123-132.
Forsyth, D., 1973. Comprehensive stress between two mid-ocean ridges, Nature, 243, 78-79.
Foster, T. D., 1969. Convection in a variable viscosity fluid heated from within, J.
Gordon, R. B., 1965. Diffusion creep in the earth’s mantle, J. geophys. Rex, 70,
Hales, A. L., 1969. Gravitational sliding and continental drift, Earth planet. Sci. Lett.,
Hanks, T. C. , 1971. The Kuril trench-Hokkaido rise system: large shallow earth- quakes and simple models of deformation, Geophys. J. R . astr. SOC., 23, 173-189.
Hasebe, K., Fujii, N. & Uyeda, S., 1970. Thermal processes under island arcs, Tec- tonophysics, 10,3 3 5-3 55,
Herron, E. M., 1972. Sea-floor spreading and the Cenozoic history of the east-central Pacific, Geol. SOC. Am. Bull., 83,1671-1692.
Hess, H. H., 1962. History of ocean basins, Petrologic Studies-volume in Honor of A . F. Buddington, (eds. A. E. J. Engele, H. L. James and B. F. Leonard), 599-620, Geol. SOC. Am., Boulder, Colorado.
Holmes, A., 1928. Radioactivity and earth movements, Trans geol. SOC. Glasgow,
Isacks, B. & Molnar, P., 1959. Mantle earthquake mechanisms and sinking of the lithosphere, Nature, 223,1121-1 124.
Isacks, B. & Molnar, P., 1971. Distribution of stresses in the descending lithosphere from a global survey of focal-mechanism solutions of mantle earthquakes, Rev. Geophysics., 9, 103-174.
Isacks, B., Oliver, J. & Sykes, L. R., 1968. Seismology and the new global tectonics, J. geophys. Res., 73, 5855-5899.
Jacoby, W. B., 1970. Instability in the upper mantle and global plate movements, J. geophys. Res., 75, 5671-5680.
Kanamori, H., 1971. Great earthquakes at island arcs and the lithosphere, Tectono- physics, 12, 187-198.
geophys. Res., 74,685-693.
2413-2418.
6, 31-34.
18,559-606.
198
Karig, D. E., 1971. Origin and development of marginal basins in the western
Kelleher, J. A., 1972. Rupture zones of large South American earthquakes and
Knopoff, L., 1972. Observation and inversion of surface-wave dispersion, Tectono-
Kumazawa, M., Sawamoto, H., Ohtani, E. & Masaki, K., 1974. Postspinel phase
Lachenbruch, A. H., 1973. A simple model for oceanic spreading centers, J. geophys.
Lanczos, C., 1961. Linear diferential operators, 564 pp., D. Van Nostrand, London. Larson, R. L. & Chase, C. G., 1970. Relative velocities of the Pacific, North
America and COCOS plates in the middle America region, Earth planet. Sci. Lett., 7, 425428.
Le Pichon, X., 1968. Sea-floor spreading and continental drift, J. geophys. Res., 73,
Le Pichon, X. & Fox, P. J., 1972. Marginal offsets, fracture zones, and the early opening of the North Atlantic, J. geophys. Res., 76, 6294-6308.
Le Pichon, X. & Hayes, D. E., 1972. Marginal offsets, fracture zones, and the early opening of the South Atlantic, J. geophys. Res., 76, 6283-6293.
Lliboutry, L., 1969. Sea-floor spreading, continental drift, and lithosphere sinking with an asthenosphere at melting point, J. geophys. Res., 74, 6525-6540.
Lliboutry, L., 1971. Rheological properties of the asthenosphere from Fennoscandian data, J. geophys. Res., 76, 1433-1446.
Madansky, A., 1959. The fitting of straight lines when both variables are subject to error, J . Am. Stat. Ass., 54, 173-205.
Matsuda, T. & Uyeda, S . , 1971. On the Pacific-type orogeny and its model. Extension of the paired bolts concept and possible origin of marginal seas. Tectonophysics,
McConnell, R. K., 1965. Isostatic adjustments in a layered earth, J. geophys. Res.,
McConnell, R. K., 1968a. Viscosity of the mantle from relaxation time spectra of isostatic adjustment, J. geophys. Res., 73, 7089-7105.
McConnell, R. K., 1968b. Viscosity of the earth's mantle. Proc. Con$ History Earth's Crust, 1966, 45-57, edited by R. A. Phinney, Princeton University Press, New Jersey.
McKenzie, D. P., 1967. Some remarks on heat flow and gravity anomalies, J. geophys. Res., 72, 6291-6273.
McKenzie, D. P., 1969. Speculations on the consequences and causes of plate motions, Geophys. J. R. astr. Soc., 18, 1-32.
McKenzie, D. P., 1972. Plate tectonics in The Nature of the Solid Earth, 323-360, ed. E. C. Robertson, McGraw-Hill, New York.
McKenzie, D. P. & Parker, R. L., 1967. The North Pacific, an example of tectonics on a sphere, Nature, 216, 1276-1280.
McKenzie, D. P. & Weiss, N., 1974. Convection in the earth's mantle: towards a numerical simulation, J. JIuid Mech., 62, 465-538.
Mendiguren, J. A., 1971. Focal mechanism of a shock in the middle of the Nazca plate, J. geophys. Res., 76, 3861-3879.
Minear, J. W. & Toksoz, M. N., 1970. Thermal regime of a downgoing slab and new global tectonics, J. geophys. Res., 75, 1397-1419.
Minster, J . B., Jordan, T. H., Molnar, P. & Haines, E., 1974. Numerical modelling of instantaneous plate tectonics, Geophys. J. R. astr. Soc., 36, 541-576.
Mogi, K., 1968. Sequential occurrence of recent great earthquakes, J . Phys. Earth
D. Forsyth and S. Uyeda
Pacific, J. geophys. Res., 76, 2542-2561.
some predictions, J. geophys. Res., 77, 2087-2103.
physics, 13, 497-519.
of forsterite and evolution of the earth's mantle, Nature, 247, 356-358.
Res., 78, 3395-3417.
366 1-3697.
11, 5-27.
70, 5171-5188.
(Tokyo), 16, 30-36.
The driving forces of plate motion 199
Morgan, W. J., 1968. Rises, trenches, great faults and crustal blocks, J. geophys.
Morgan, W. J., 1971. Convection plumes in the lower mantle, Nature, 230,4243. Morgan, W. J., 1972. Deep mantle convection plumes and plate motions, Bull. Am.
Morgan, W. J., 1973. (late motions and deep mantle convection, Studies in Earth and
Orowan, E., 1964. Continental drift and the origin of mountains, Science, 146,
Plafker, G. & Rubin, M., 1967. Vertical tectonic displacements in south-central Alaska during and prior to the great 1964 earthquake, Osaka University, J. Geosci., 10, 53-66.
Phillips, J. D. & Forsyth, D., 1972. Plate tectonics, paleomagnetism, and the opening of the Atlantic, Geol. SOC. Am. Bull., 83, 1579-1600.
Richter, F., 1973a. Dynamical models for sea-floor spreading, Rev. Geophys. Space
Richter, F., 1973b. Convection and large-scale circulation of the mantle, J. geophys.
Runcorn, S. K., 1962. Towards a theory of continental drift, Nature, 193, 313-314. Sbar, M. L. & L. R. Sykes, 1973. Contemporary compressive stress and seismicity
in eastern North America: an example of intra-plate tectonics, Bull. geol. SOC. Am., 84, 1861-1882.
Schubert, G. & Turcotte, D. L., 1972. One-dimensional model of shallow-mantle convection, J. geophys. Res., 77, 945-951.
Sclater, J. G. & Francheteau, J., 1970. The implications of terrestrial heat flow observations on current tectonic and geochemical models of the crust and upper mantle of the earth, Geophys. J. R. astr. SOC., 20, 493-509.
Sclater, J. G., Hawkins, J. W., Mammerickx, J. & Chase, C. G., 1972. Crustal exten- sion between the Tonga and Lau ridges; Petrologic and geophysical evidence, Geol. SOC. Am. Bull., 83, 505-518.
Sleep, N. H., 1969. Sensitivity of heat flow and gravity to mechanism of sea-floor spreading, J. geophys. Res., 74, 542-549.
Sleep, N. H. & Toksoz, M. N., 1971. Evolution of marginal basins, Nature, 233,
Smith, A. T. & Toksoz, M. N., 1972. Stress distribution beneath island arcs, Geophys. J, R . astr. Soc., 29, 289-318.
Solomon, S. C. & Sleep, N. H., 1974. Some simple physical models for absolute plate motions, J. geophys. Res., 79,2557-2567.
Sykes, L. R., 1967. Mechanism of earthquakes and nature of faulting on the mid- oceanic ridges, J. geophys. Res., 72, 2131-2153.
Sykes, L. R., 1971. Aftershock zones of great earthquakes, seismicity gaps, and earthquake prediction for Alaska and Aleutians, J. geophys. Res., 76, 8021-8061.
Sykes, L. R. & Sbar, M. L., 1973. Intraplate earthquakes, lithospheric stresses and the driving mechanism of plate tectonics, Nature, 245, 298-302.
Takeuchi, H. & Hasegawa, Y., 1967. Viscosity distribution within the Earth, Geophys. J. R . astr. Soc., 9, 503-508.
Takeuchi, H. & Sakata, M., 1970. Convection in the mantle with variable viscosity, J. geophys. Res., 75, 921-927.
Tdwani, M., Worzel, J. L. & Ewing, M., 1965. Crustal structure of mid-ocean ridges, 2. Computed model from gravity and seismic refraction data, J. geophys. Res., 70, 341-352.
TOksOz, M. N., Sleep, N. H. & Smith, A. T., 1973. Evolution of the downgoing lithosphere and the mechanisms of deep forces earthquakes, Geophys. J . R . astr. Soc., 35, 285-310.
Res., 73, 1959-1982.
Pet. Geol., 56, 203-213.
Space Science, Geol. SOC. Am. Memoir, 132, 7-20.
1003-1010.
Phys., 11, 223-287.
Res., 78, 8735-8745.
548-5 50.
200 D. Forsyth and S. Uyeda
Torrance, K. E. & Turcotte, D. L., 1971. Structure of convection cells in the mantle, J . geophys. Res., 76, 1156-1 161.
Tsai, Y. B., 1969. Determination of focal depths of earthquakes in the mid-ocean ridges from amplitude spectra of surface waves, PhD Thesis, 144 pp., Massachusetts Institute of Technology, Cambridge, Mass.
Tullis, T. E. & Chapple, W. M., 1973. What makes the plates go, Trans. Am. geophys. Un., 54, 468 (abstfact only).
Turcotte, D. L. & Oxburgh, E. R., 1972. Mantle convection and the new global tectonics, Ann. Rev. jluid. Mech., 4, 33-68.
Turcotte, D. L. & Schubert, G., 1971. Structure of the olivine-spinel phase boundary in the descending lithosphere, J. geophys. Res., 76, 7980-7987.
Uyeda, S. & Miyashiro, A., 1974. Plate tectonics and the Japanese islands: A syn- thesis, Geol. SOC. Am. Bull., 85, 1159-1 170.
Walcott, R. I., 1970. Flexural rigidity, thickness and viscosity of the lithosphere, J. geophys. Res., 75, 3941-3954.
Watts, A. B. & Talwani, M., 1974. Gravity anomalies seaward of deep-sea trenches and their tectonic implications, Geophys. J . R. astr. Soc., 36, 57-90.
Weidner, D. J. & Aki, K., 1973. Focal depth and mechanism of mid-ocean ridge earthquakes, J. geophys. Res., 78, 18 18-1 83 1.
Wilson, J. T. & Burke, K., 1973. Plate tectonics and plume mechanics, EOS, Trans. Am. geophys. Un., 54, 238-239.
Wyss, M., 1970. Stress estimates for South American shallow and deep earthquakes, J. geophys. Res., 75, 1529-1544.