Embed Size (px)
Citation preview
On the Relationship between Inertial Instability, Poleward MomentumSurges, and Jet Intensifications near Midlatitude Cyclones
SHELLIE M. ROWE AND MATTHEW H. HITCHMAN
Department of Atmospheric and Oceanic Sciences, University of Wisconsin–Madison,
Madison, Wisconsin
(Manuscript received 4 July 2015, in final form 10 March 2016)
ABSTRACT
This study explores the role of inertial instability in poleward momentum surges and ‘‘flare ups’’ of the
subpolar jet near midlatitude cyclones. Two cases are simulated with the University of Wisconsin Non-
hydrostatic Modeling System to investigate the mechanisms involved in jet accelerations downstream of
quasi-stationary ‘‘digging troughs.’’ Deep convection along the cold front leads to regions of inertial in-
stability in the upper troposphere, which are intimately linked to jet accelerations. Terms in the zonal and
meridional wind equations following the motion are evaluated for a selected air parcel within the inertially
unstable region. A two-stage synoptic evolution is diagnosed, which is a characteristic signature of inertial
instability. First, meridional flow accelerates following the motion, because of the subgeostrophic zonal flow
and strong northward pressure gradient force (a statement of inertial instability). Second, supergeostrophic
poleward flow leads to zonal acceleration and a jet flare-up. Inertial instability thus effectively displaces a
westerly jet maximum poleward relative to inertially stable conditions. The structure of the poleward surge
involves a distinctive ‘‘head’’ of high angular momentum, with the region of inertial instability enclosing the
jet maximum and a core of strongly negative potential vorticity inside the surge. Departures from angular
momentum–conserving profiles during meridional displacement are interpreted in terms of the pressure
gradient force and degree of inertial stability. Inertial instability reduces the resulting zonal wind profile
relative to angular momentum conservation but provides a significant poleward displacement of the resulting
zonal wind maximum.
1. Introduction
a. History of jet intensifications
Midlatitude convective storm systems act to ex-
change properties vertically between the lower and up-
per troposphere and are important in maintaining the
large-scale balance of angular momentum and energy
(Palmén and Newton 1969). Eliassen (1959) studied the
role of diabatic heating in altering mass circulations.
Ninomiya (1971) concluded that thunderstorm outflow
associated with intense convection aloft was a key dy-
namical parameter in changing the upper-level flow in
the vicinity of intense storm development. Fritsch and
Maddox (1981) analyzed the effects of mesoscale con-
vective complexes (MCCs) on synoptic-scale flow and
found that latent heating intensified mass circulations in
the midtroposphere. Numerous case studies have ex-
amined secondary and transverse circulations associated
with upper-level jet streaks (Namias and Clapp 1949;
Uccellini and Johnson 1979; Shapiro 1981; Kocin et al.
1986). For example, Maddox (1980) inferred that a di-
abatic component of the isallobaric wind may be sig-
nificant in areas of intense convection and act to
intensify circulations associated with a jet streak. More
closely related to the work presented here, Keyser and
Johnson (1984) found a connection between jet inten-
sifications and latent heating in an early springtime
MCC. They found a 15m s21 wind speed increase within
a jet streak over a 3–6-h time span. Using isentropic
coordinates, they found that latent heating in the MCC
Supplemental information related to this paper is avail-
able at the Journals Online website: http://dx.doi.org/10.1175/
JAS-D-15-0183.s1.
Corresponding author address: Shellie M. Rowe, Department of
Atmospheric and Oceanic Sciences, University of Wisconsin–
Madison, 1225 W. Dayton St., Madison, WI 53706.
E-mail: [email protected]
JUNE 2016 ROWE AND H I TCHMAN 2299
DOI: 10.1175/JAS-D-15-0183.1
� 2016 American Meteorological Society
modified the direct mass circulation in the jet entrance
region through the forcing of diabatic components of
ageostrophic motion.
Research has shown that there is a connection be-
tween inertial instability and mesoscale circulations
in the atmosphere (Emanuel 1979, 1982). Eliassen
(1951) hypothesized that, for a given source of an-
gular momentum, stronger meridional motions de-
velop if the inertial stability of the vortex is weaker.
Inertial instability also plays a role in the formation
of individual convective cells associated with MCCs
(Maddox 1983). Blanchard et al. (1998) used a con-
ceptual model showing how regions of weak upper-
tropospheric inertial instability can contribute to the
upscale growth of the individual cells into MCCs.
Mecikalski and Tripoli (2003) proposed that, as con-
vection matures and becomes more organized, it
evolves toward a structure that benefits from upper-
tropospheric inertial instability.
Rowe and Hitchman (2015) focused on the role
of inertial instability in facilitating stratosphere–
troposphere exchange by the ‘‘overfold’’ process.
They discussed the production of regions of negative
equivalent potential vorticity (EPV) by vortex com-
pression in the upper troposphere. They showed that
regions of inertial instability in the dry upper tropo-
sphere, as identified by negative regions of EPV or
potential vorticity (PV) or absolute vorticity, are
nearly identical. In the present work, two of the cases
are revisited with a focus on how inertial instability is
related to changes in the speed and structure of the
subpolar jet. The first case highlights jet intensifica-
tion associated with a ;500-km poleward displace-
ment of the subpolar jet associated with inertial
instability. The second case features ‘‘jet flare-ups’’
that occur in conjunction with smaller regions of in-
ertial instability.
b. Synopsis
Aspects of angular momentum and inertial instability
theory relevant to this work are described in section 2,
while section 3 describes the University of Wisconsin
Nonhydrostatic Modeling System (UWNMS) simula-
tions. Sections 4 and 5 comprise two representative
midlatitude cases in which inertial instability is a key
ingredient in jet intensifications and poleward momen-
tum surges. The relationship between regions of inertial
instability, absolute momentum, ageostrophic flow, and
subsequent jet intensifications will be featured. Case 1
emphasizes a poleward surge of the subpolar jet along
with a rapid intensification. Case 2 examines smaller-
scale jet flare-ups on a weaker subpolar jet. Conclusions
are summarized in section 6.
2. Inertial instability theory and angularmomentum
Inertial instability occurs when angular momentum
decreases radially outward. Conversely, resistance to
radial motion occurs when angularmomentum increases
radially outward. Inertial instability also plays a princi-
pal role in the adjustment processes that restore a stable
profile of angular momentum. A diagnosis can be made
for inertial instability where there are distinctive regions
of reversed angularmomentum gradients, negative EPV
anomalies, or regions of negative absolute vorticity.
Distinctive patterns of divergence/convergence and
ageostrophic flow also occur in regions of inertial in-
stability. As parcels enter a region of inertial instability,
they accelerate, causing divergence, and as they leave
such a region, they decelerate, causing convergence.
Cross-equatorial flow in the middle atmosphere gives
rise to a deep region of inertial instability in the winter
subtropics (Dunkerton 1981). Here one may find verti-
cally stacked circulation cells and corresponding layered
temperature perturbations or pancake structures as seen
in satellite and mesosphere–stratosphere–troposphere ra-
dar data, especially when quasi-stationary planetary wave
activity is impinging on the subtropical middle atmosphere
(Hitchman et al. 1987; Fritts et al. 1992; Hayashi et al.
1998). In the rapidly evolving environment of midlatitude
cyclones and embedded convection, inertial instability
structures are not usually so well ordered. A summary of
inertial instability theory relevant to midlatitude cyclones
is given in Rowe and Hitchman (2015). Here the re-
lationship between inertial instability, the horizontal
equations of motion, and angular momentum is re-
visited with a view toward a synoptic description of
inertially unstable flow upstream of a ridge.
Although it is traditional to diagnose inertial insta-
bility in a linear, Eulerian framework, where meridional
advection of zonal flow is grouped with the Coriolis
term: –y 3 (f2 ›u/›y), it proves to be useful to consider
the changes of wind following the motion in an inertially
unstable region. The zonal and meridional momentum
equations for synoptic scaling may be written
du
dt5 f y2
1
r
›p
›xand (1a)
dy
dt52fu2
1
r
›p
›y, (1b)
where d/dt5 ›/›t1 u›/›x1 y›/›x1w›/›z is the mate-
rial derivative following the motion, u is zonal flow, y is
meridional flow, r is density, p is pressure, and f 52V sinu is the Coriolis factor. Consider a synoptic situ-
ation in the upper troposphere with a jet streak de-
veloping northward then eastward around a ridge. First,
2300 JOURNAL OF THE ATMOSPHER IC SC IENCES VOLUME 73
the meridional flow accelerates because of the poleward
pressure gradient force overcoming the Coriolis term for
weak zonal flow in (1b). As the meridional flow accel-
erates poleward, the Coriolis term becomes larger than
the westward pressure gradient force in (1a), causing
eastward zonal flow acceleration. Inertial instability
would be expected to excite this sequence.
Starting from (1), traditional presentations of inertial
instability in steady sheared zonal geostrophic flow U
assume meridional parcel displacements dy in the ab-
sence of a zonal pressure gradient force, yielding the
oscillator–accelerator equation:
›2
›t2dy52f
�f 2
›U
›y
�dy , (2a)
with meridional acceleration occurring (inertial instabil-
ity) if the coefficient is negative: f(f – ›U/›y), 0 (Holton
2006). This provides an impetus for poleward accelera-
tion down the pressure gradient, which from (1b) implies
that the zonal flow is weaker than geostrophic. Down-
stream, as the meridional flow accelerates, the Coriolis
term leads to acceleration of the zonal flow in (1a).
A generalization of the linear inertial instability cri-
terion for radial parcel displacement ds in an axisym-
metric vortex yields
›2
›t2ds52f ( f 1 z)ds , (2b)
with inertial instability occurring if f(f 1 z) , 0, where
z 5 ›y/›x – ›u/›y is relative vorticity (Eliassen and
Kleinschmidt 1957). Negative absolute vorticity in the
Northern Hemisphere, h 5 f 1 z , 0, is a useful
criterion for inertial instability. Absolute vorticity is a fac-
tor in Ertel’s potential vorticity [PV5 (1/r)(›u/›z)(z1 f )]
and in equivalent potential vorticity [EPV5(1/r)(›ue/›z)(z1 f ), where ue is equivalent potential
temperature]. Rowe and Hitchman (2015) showed that
regions where h, PV, and EPV are negative coincide al-
most exactly in the uppermost troposphere.
The distribution of absolute angular momentum can
be used to visualize regions of inertial instability and of
zonal jet intensification. From the reference frame of
Earth’s rotation axis, absolute angular momentum per
unit mass is given by m5 a cosu(u1Va cosu), where
a is Earth’s radius, u is latitude, V is the angular fre-
quency of Earth’s rotation, and u is zonal wind speed.
The gradient of angular momentum is related to abso-
lute vorticity in the Northern Hemisphere by
21
a cosu›m
›y5 f 2
1
cosu›
›y(u cosu) . (3)
The zonal flow is inertially unstable if (3) is negative,
corresponding to a situation where angular momentum
increases toward the rotation axis and absolute vorticity
is negative.
Consider the implications of conservation of angular
momentum in the absence of a zonal pressure gradient
force: dm/dt5 0. A poleward displacement dy from
latitude 1 to latitude 2, with an initial zonal wind speed
of u1, will yield a new zonal wind speed of
u25Va
�cos2u
12 cos2u
2
cosu2
�1
cosu1
cosu2
u1. (4)
(Sample curves of constant angular momentum are
shown in Fig. 6.) Near 458N, a meridional displacement
of 18 5 111 km will yield a zonal wind speed increase of
;11.6m s21. From (2a), a region of neutral inertial in-
stability is characterized by f 2 ›u/›y5 0, implying a
zonal speed increase of du 5 fdy ’ 11.5m s21 for a 18displacement. This illustrates that curves of neutral in-
ertial stability are also curves of constant angular
momentum.
In the absence of a zonal pressure gradient force, one
may conclude that zonal wind speed will increase at
about 11m s21 per 18 of latitude in the midlatitudes. If
the region is inertially unstable, poleward displacement
will advect weaker zonal winds, reducing the rate of
increase expected from angular momentum conserva-
tion. That is, subgeostrophic zonal flow is required for
poleward acceleration because of inertial instability. If it
is inertially stable, stronger zonal winds will be advected
poleward so that the rate of increase is greater than
angular momentum conserving. A zonal pressure gra-
dient force can radically alter the outcome. A quanti-
tative analysis of the momentum budget along a parcel
trajectory within an inertially unstable region is given in
section 4.
The ageostrophic component of the wind represents
the portion of the flow that is not in geostrophic balance:
ua 5 u2 ug and ya 5 y2 yg. Inmost midlatitude cyclones
the ageostrophic wind is important in the evolution of
temperature and vorticity fields (Holton 2006). Angell
(1962) examined trajectory configurations through re-
gions of inertial instability and found evidence that large
regions of ageostrophic flows associated with inertial
instability are precursors for changes in pressure pat-
terns. He also showed that large deviations in the geo-
strophic flow occur in and downstream from regions of
inertial instability. The distribution of negative absolute
vorticity will be compared with the distribution of
ageostrophic zonal flow. From the arguments above, one
would expect that ua , 0 and ya . 0 would result from
poleward displacement in an inertially unstable flow.
JUNE 2016 ROWE AND H I TCHMAN 2301
Inertial instability leads to spatial variations in accel-
erations, hence enhanced regions of divergence and
convergence and radiation of gravity waves. The atmo-
sphere tends to restore inertial stability and geostrophic
balance by generating gravity waves that radiate away
and adjust the flow (Rossby 1938; Cahn 1945; Blumen
1972; Van Tuyl and Young 1982; Koch andDorian 1988,
Rowe and Hitchman 2015). Zhang et al. (2000) and
McCann (2001) provide overviews of other measures
of imbalance. Here, in addition to ageostrophic zonal
winds, divergence fields and their relationship with re-
gions of inertial instability will be shown.
Finally, a measure of the importance of the accelera-
tion term relative to theCoriolis term in (1) is provided by
the Rossby number (Ro,u = jdu/dtj/ jfyj,Ro,y = jdy/dtj/ jfuj).If the pressure gradient force is closely balanced by the
Coriolis term, then Ro is very small. The importance of
ageostrophic motions and acceleration increases with
increasing Ro. Values of Ro are calculated separately for
the zonal and meridional momentum equations along a
trajectory as part of the momentum budget analysis.
3. Simulations and analysis methods
The two case studies aremodeledwithUWNMS (Tripoli
1992a,b; Pokrandt et al. 1996; Jascourt 1997; Mecikalski
and Tripoli 1998), initialized with 2.58 European Centre for
Medium-Range Weather Forecasts (ECMWF) data. The
resolution for both cases is 20km 3 20km 3 300m, with
a grid volume of 152 3 152 3 60 points. The top of the
model is set to 16km, with a 1500-mRayleigh sponge layer.
The side boundary conditions for UWNMS were updated
using ECMWF data as the interior domain evolves. Both
simulations were initialized ;24h before the jet intensifi-
cations began and continued for 48h. Vis5D was used to
view the time and 3D structure of each midlatitude cyclone
and the associated dynamics in UWNMS.
The model domain for each case is a square with sides
of length 3020km. The center point of the domain is
located at 408N, 958W, extending from 26.48 to 53.68Nand from 112.88 to 77.158W. The period 0000 UTC
5 February–0000 UTC 7 February 2008 was simulated
for case 1, which focuses on the region extending from
the central Mississippi valley through the Great Lakes
to southern portions of Ontario and Quebec. The pe-
riod 0000 UTC 22 April–0000 UTC 24 April 2005 was
simulated for case 2, which focuses on a region includ-
ing the Ohio valley, eastern Great Lakes, and southern
Ontario.
Jet intensification events and associated poleward
surges are explored by examining sequences of meridi-
onal sections of wind speed, absolute angular momentum,
and negative EPV. Sections and plan views of equivalent
potential temperature, divergence, and ageostrophic wind
will be studied in conjunction with regions of negative
EPV and wind speed maxima. Isosurfaces of absolute
momentum and negative EPV (looking from east to
west), together with plan views at the level of maximum
wind speed will be shown. Additional analysis for case 1
includes a detailed momentum budget along a trajectory
in the inertially unstable poleward surge. This allows for a
comparison between angular momentum–conserving
contours (plotted as zonal speed versus latitude) and the
evolution of wind speed along this trajectory in the
UWNMS. For plotting purposes, angular momentum di-
vided by a cosu (ms21) is shown.
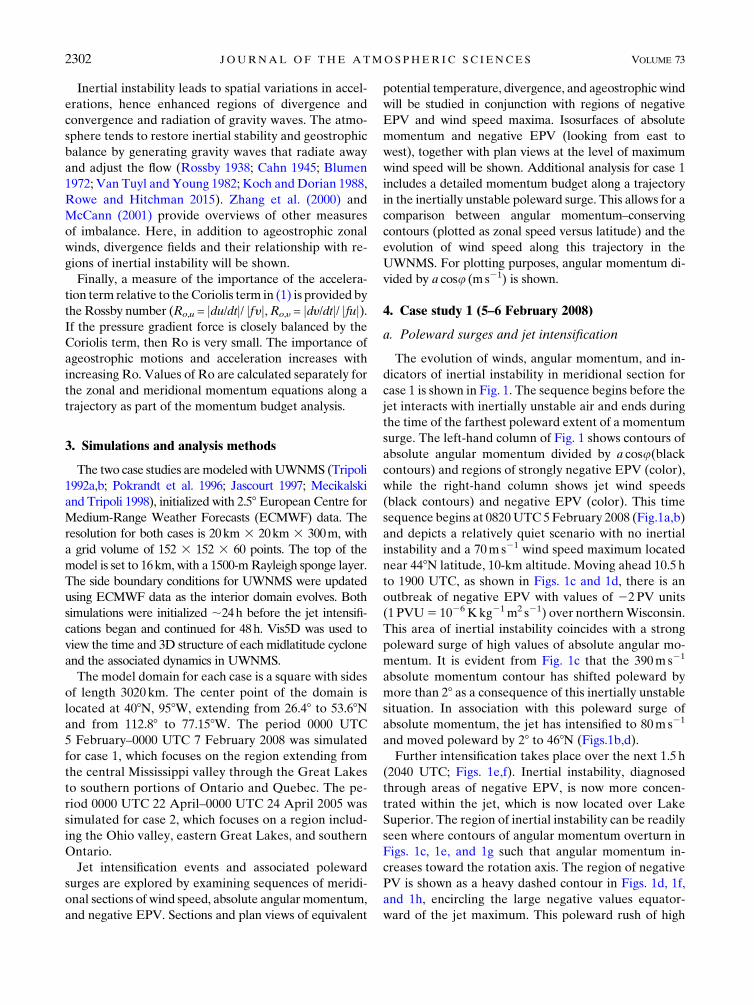
4. Case study 1 (5–6 February 2008)
a. Poleward surges and jet intensification
The evolution of winds, angular momentum, and in-
dicators of inertial instability in meridional section for
case 1 is shown in Fig. 1. The sequence begins before the
jet interacts with inertially unstable air and ends during
the time of the farthest poleward extent of a momentum
surge. The left-hand column of Fig. 1 shows contours of
absolute angular momentum divided by a cosu(blackcontours) and regions of strongly negative EPV (color),
while the right-hand column shows jet wind speeds
(black contours) and negative EPV (color). This time
sequence begins at 0820UTC 5 February 2008 (Fig.1a,b)
and depicts a relatively quiet scenario with no inertial
instability and a 70m s21 wind speed maximum located
near 448N latitude, 10-km altitude. Moving ahead 10.5 h
to 1900 UTC, as shown in Figs. 1c and 1d, there is an
outbreak of negative EPV with values of 22PV units
(1PVU5 1026 Kkg21m2 s21) over northernWisconsin.
This area of inertial instability coincides with a strong
poleward surge of high values of absolute angular mo-
mentum. It is evident from Fig. 1c that the 390ms21
absolute momentum contour has shifted poleward by
more than 28 as a consequence of this inertially unstablesituation. In association with this poleward surge of
absolute momentum, the jet has intensified to 80ms21
and moved poleward by 28 to 468N (Figs.1b,d).
Further intensification takes place over the next 1.5 h
(2040 UTC; Figs. 1e,f). Inertial instability, diagnosed
through areas of negative EPV, is now more concen-
trated within the jet, which is now located over Lake
Superior. The region of inertial instability can be readily
seen where contours of angular momentum overturn in
Figs. 1c, 1e, and 1g such that angular momentum in-
creases toward the rotation axis. The region of negative
PV is shown as a heavy dashed contour in Figs. 1d, 1f,
and 1h, encircling the large negative values equator-
ward of the jet maximum. This poleward rush of high
2302 JOURNAL OF THE ATMOSPHER IC SC IENCES VOLUME 73
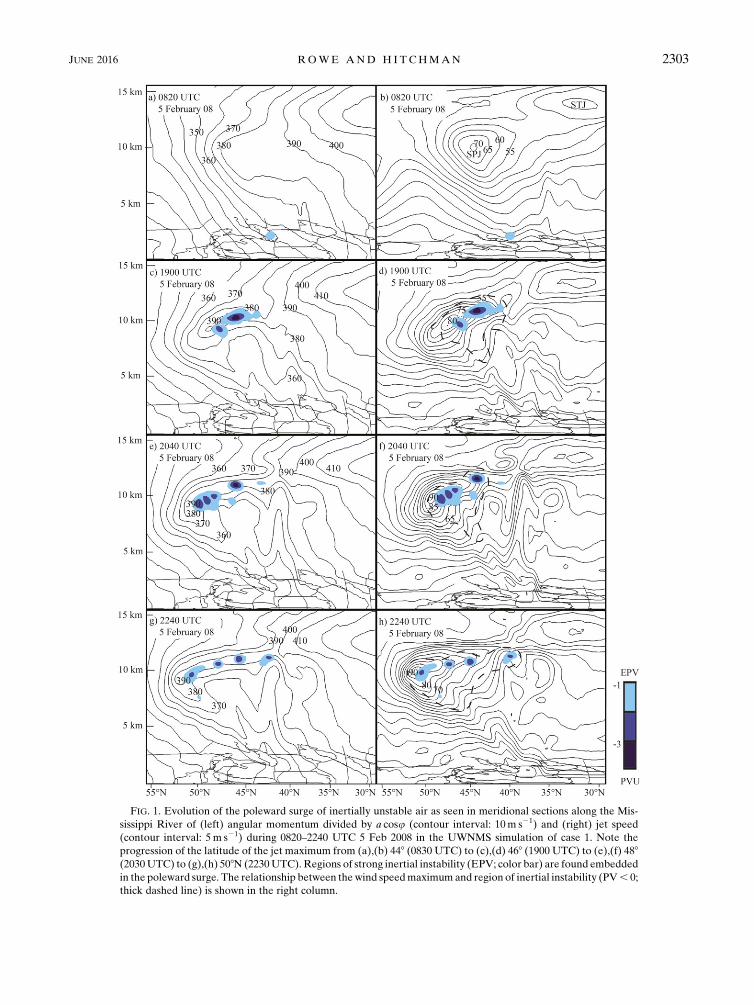
FIG. 1. Evolution of the poleward surge of inertially unstable air as seen in meridional sections along the Mis-
sissippi River of (left) angular momentum divided by a cosu (contour interval: 10m s21) and (right) jet speed
(contour interval: 5 m s21) during 0820–2240 UTC 5 Feb 2008 in the UWNMS simulation of case 1. Note the
progression of the latitude of the jet maximum from (a),(b) 448 (0830 UTC) to (c),(d) 468 (1900 UTC) to (e),(f) 488(2030UTC) to (g),(h) 508N (2230UTC). Regions of strong inertial instability (EPV; color bar) are found embedded
in the poleward surge. The relationship between the wind speedmaximum and region of inertial instability (PV, 0;
thick dashed line) is shown in the right column.
JUNE 2016 ROWE AND H I TCHMAN 2303

momentum air further intensifies the jet. Figure 1f
shows this intensification and poleward surge as jet wind
speeds reach 90ms21 at 488N. This inertially unstable
poleward surge has intensified wind speeds by 10ms21 in
only 1.5h, and the jet has been displaced another 28poleward during this time (Fig. 1f).
Figures 1g and 1h reveal a continued inertially unstable
poleward surge. The vault of low angular momentum on
the equatorward side of the jet in Figs. 1c, 1e, and 1g is
produced by convective transport of air having had more
recent contact with the ground, creating stronger hori-
zontal wind variations and inertially unstable conditions
and facilitating a poleward surge. This is similar to the
conclusions reached by Schumacher et al. (2010; cf. their
Fig. 17), where negative vorticity near the edge of a
convective cell was attributed to low-momentum air be-
ing transported upward into juxtaposition with faster-
moving air.Another salient aspect of the overall structure
of the poleward surge is the vertically narrow region of
high-angular-momentum air just above the jet maximum,
which becomes more pronounced as the jet pushes 28farther poleward by 2240 UTC (Figs. 1g,h).
Over 14h, the subpolar westerly jet moved poleward by
68 latitude and increased in speed by ;20ms21, in asso-
ciation with an inertially unstable poleward momentum
surge. Supplemental movie 1 shows the evolution of the
jet and its poleward surge for the 48-h simulation. In this
sequence, poleward and upward-moving streams of air
with EPV , 22PVU are highlighted in dark blue, ab-
solute momentum–conserving contours are shown in
black, and the 60ms21 jet isosurface is shown in trans-
parent white. Assuming a poleward displacement of 68, ifangular momentumwere conserved, one would expect an
increase of ;66ms21 (section 2). Pure conservation of
angular momentum does not consider the effects of the
zonal pressure gradient force on wind speed upon pole-
ward displacement. A more detailed analysis of the mo-
mentum budget is given in the next subsection.
We next focus on the period of rapid intensification and
the relationship between isosurfaces of angular momen-
tum and negative EPV. Figure 2 shows the 350ms21 an-
gularmomentum isosurface (divided by a cosu) colored bywind speed, together with isosurfaces of negative EPV in
green, as viewed from the east. The 350ms21 angular
momentum surface is indicated in blue for wind speeds
below 50ms21, while red indicates wind speeds above
60ms21. The time sequence, which starts at 2000 UTC
5 February 2008 and ends at 0330 UTC 6 February 2008,
suggests that, as the anomalous areas of negative EPV
(22-PVU green isosurfaces) move poleward, a distinct
increase in jet wind speed (red shading) occurs, along
with a poleward displacement of this isosurface of angular
momentum. At 2000 UTC (Fig. 2a), the region of inertial
instability is close to the 350ms21 angular momentum
isosurface (cf. Figs. 1e,f), with a layer of highly negative
EPV approaching the 350ms21 isosurface on the equa-
torward side (green isosurface). At this time, wind speeds
on the 350ms21 isosurface do not yet exceed 50ms21.
Three hours later, at 2300 UTC (Fig. 2b), the
350ms21 isosurface is bulging poleward as the22-PVU
FIG. 2. Evolution of the poleward momentum surge from
(a) 2000 UTC 5 Feb to (b) 2300 UTC 5 Feb to (c) 0330 UTC 6 Feb
2008, as seen from the east. Poleward deformation of the 350m s21
angular momentum isosurface (divided by a cosu and shaded by
wind speed; blue indicates ,50m s21; red indicates .62m s21)
coincides with a poleward surge of inertially unstable air, the core
of which exceeds 22 PVU (green isosurface).
2304 JOURNAL OF THE ATMOSPHER IC SC IENCES VOLUME 73
regions approach this isosurface, consistent with the
change in position of the 350m s21 momentum contour
from Fig. 1e to Fig. 1g. In association with this inertially
unstable poleward surge, the 65ms21 jet is now evident on
this surface of momentum (red in Fig. 2b). By 0330 UTC
6 February 2008 (Fig. 2c), the region of high angular
momentum and high wind speed has continued to grow
and expand poleward in the northeastern corner of the
domain. This poleward bulge of the 350ms21 contour is
also evident in supplemental movie 1.
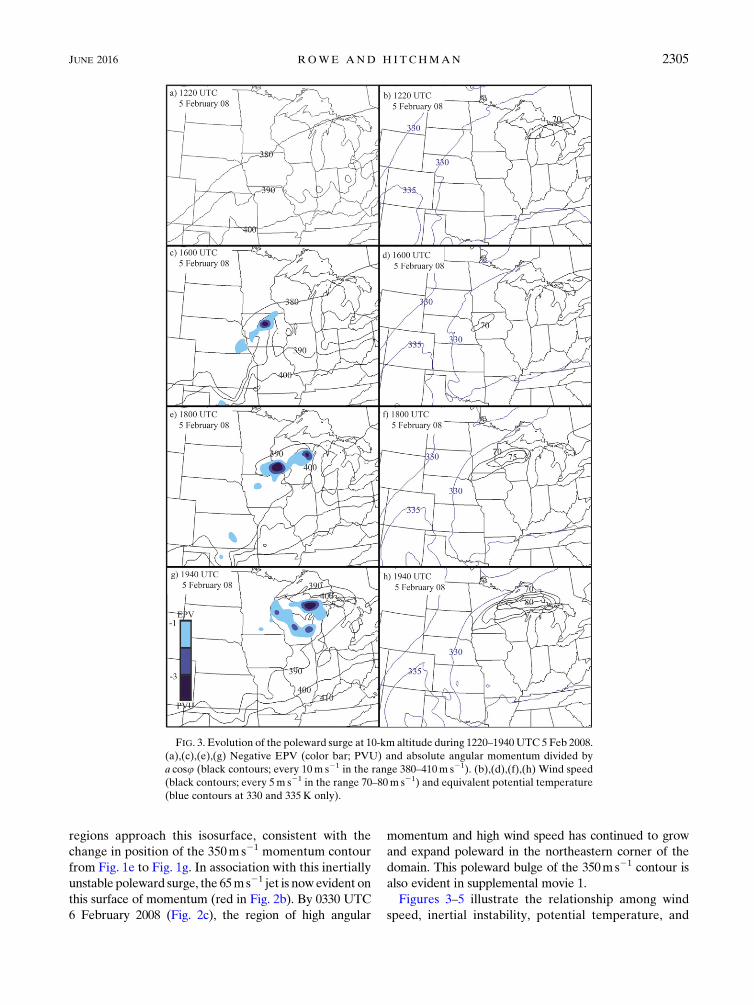
Figures 3–5 illustrate the relationship among wind
speed, inertial instability, potential temperature, and
FIG. 3. Evolution of the poleward surge at 10-km altitude during 1220–1940UTC 5 Feb 2008.
(a),(c),(e),(g) Negative EPV (color bar; PVU) and absolute angular momentum divided by
a cosu (black contours; every 10m s21 in the range 380–410m s21). (b),(d),(f),(h) Wind speed
(black contours; every 5m s21 in the range 70–80m s21) and equivalent potential temperature
(blue contours at 330 and 335K only).
JUNE 2016 ROWE AND H I TCHMAN 2305
ageostrophic wind. Figure 3 shows plan views at 10 km
of angular momentum and strongly negative EPV
(left), together with ue and jet speed (right) during
1220–1940 UTC 5 February 2008. At 1220 UTC
(Figs. 3a,b), there are no regions of strong inertial
instability, and a small 70m s21 jet core is found over
northern Lake Michigan and northern Lake Huron.
During the poleward surge, note the strong spatial
correlation between the region of negative EPV and
wind speed (Figs. 3c–h). The highest jet wind speeds in
Fig. 3d appear over Iowa near the head of the pole-
ward surge of inertially unstable air and then
strengthen as the jet streak moves northeastward
through Wisconsin (Fig. 3f) to the Upper Peninsula of
Michigan (Fig. 3h). This supports the hypothesis that
poleward-moving, inertially unstable air displaces the
FIG. 4. As in Fig. 3, but focusing on the Great Lakes region near the level of the subpolar jet maximum (10 km), at
2040 UTC 5 Feb 2008. The region of inertial instability (EPV , 0 PVU) is highlighted with a thick dashed line.
FIG. 5. Meridional sections of negative absolute vorticity (dashed black contours; interval: 10 3 1025 s21), and
ageostrophic zonal wind (solid blue contours; interval: 10m s21) along the path of the parcel trajectory shown in
Fig. 6 are shown for (a) 1540, (b) 1840, and (c) 2140 UTC 5 Feb and (d) 0040 UTC 6 Feb 2008.
2306 JOURNAL OF THE ATMOSPHER IC SC IENCES VOLUME 73
westerly jet maximum poleward relative to where it
would be in the absence of inertial instability.
By 2040 UTC, the poleward surge reached Lake Su-
perior, with jet speeds increasing to 90m s21 (Fig. 4b).
The inertially unstable region (thick dashed line) encloses
an air mass with normalized momentum values exceeding
380ms21 and regions of negative EPV exceeding23PVU
(Fig. 4a). The inertially unstable region encompasses the
jet speed maximum and the equatorward side of the jet
(Fig. 4b). Values of ue are fairly uniform near 330K
(Fig. 4b). This horizontal view of the structure of a jet streak
lying at the poleward edge of an inertially unstable region
complements the meridional sections in Figs. 1 and 2.
Convective updrafts that create the inertially unstable
regions in the upper troposphere exhibit a distinctive
relationship between negative absolute vorticity and
subgeostrophic zonal flow. The collocation of negative
absolute vorticity and negative ageostrophic zonal wind,
calculated as ua 5 u 2 ug, is shown in a sequence of
latitude–altitude sections in Fig. 5, with locations and
times corresponding to the trajectory shown in Figs. 6
and 7. In each of the four panels, negative ageostrophic
zonal flow coincides with regions of negative absolute
vorticity. The ageostrophic zonal component of the wind
is in the range from 210 to 230ms21 in the strongly
inertially unstable regions where absolute vorticity is
in the range from 210 to 230 3 1025 s21. This is in
agreement with the discussion of Lagrangian changes
along the path following (1). In an inertially unstable
region, poleward motion in strong positive meridional
wind shear will simply advect lower zonal wind values
poleward, reducing the zonal flow relative to geo-
strophic values, ensuring subgeostrophic zonal flow.
b. Lagrangian momentum budget and conservationof angular momentum
To investigate how inertial instability leads to pole-
ward surges and jet flare-ups, a specific air parcel is
chosen, which maintained absolute vorticity values less
than283 1025 s21 along a trajectory that arrived at the
most poleward location during the surge at 0140 UTC
6 February 2008. The meridional profile of zonal wind
speed, trajectory, and the 28 3 1025 s21 absolute vor-
ticity isosurface at the ending time of the trajectory are
shown in Fig. 6, while charts of pressure, meridional, and
zonal wind speeds at altitudes corresponding to the
trajectory are shown in Fig. 7.
The solid curves in Fig. 6a illustrate how the speed
of air parcels increases under latitudinal displace-
ment, given the assumptions in section 2: conserva-
tion of angular momentum in an inviscid environment
with no zonal pressure gradient force. The starting
latitude is 348N with an initial range of zonal wind
speeds. Asterisks in Fig. 6b labeled with altitude (km)
are superimposed on the trajectory to indicate the
hourly position of the air parcel during this 13-h pe-
riod. The small zonal displacement between the tra-
jectory and the instantaneous negative PV streamer
(Fig. 6b) indicates that the storm is slowly evolving
during this time.
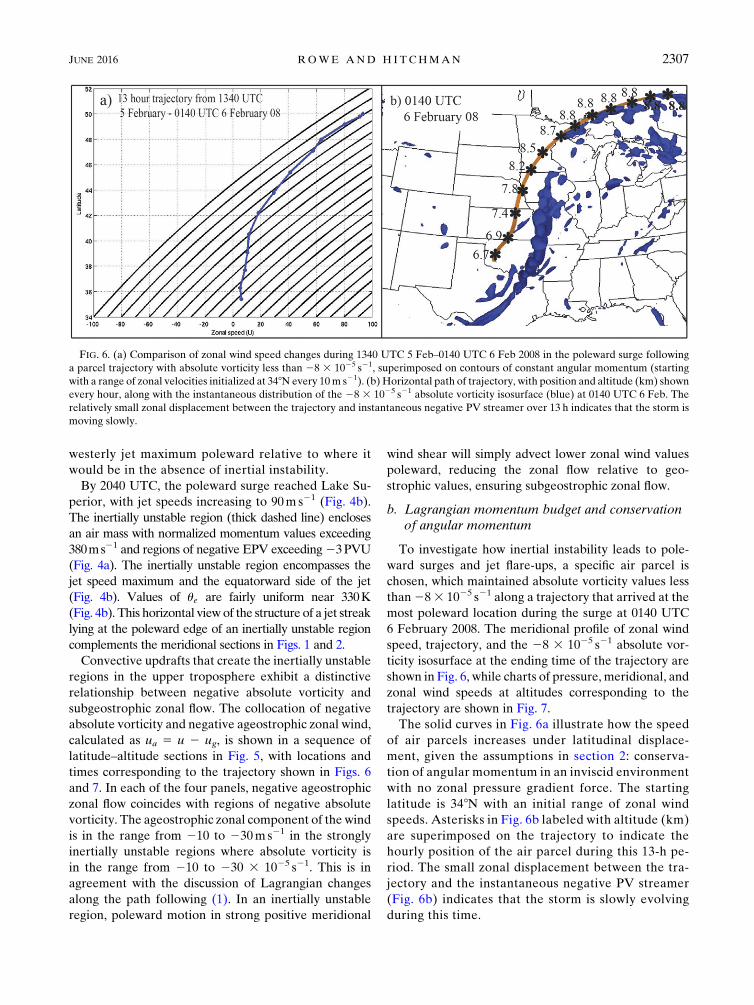
FIG. 6. (a) Comparison of zonal wind speed changes during 1340 UTC 5 Feb–0140 UTC 6 Feb 2008 in the poleward surge following
a parcel trajectory with absolute vorticity less than 28 3 1025 s21, superimposed on contours of constant angular momentum (starting
with a range of zonal velocities initialized at 348N every 10m s21). (b) Horizontal path of trajectory, with position and altitude (km) shown
every hour, along with the instantaneous distribution of the 28 3 1025 s21 absolute vorticity isosurface (blue) at 0140 UTC 6 Feb. The
relatively small zonal displacement between the trajectory and instantaneous negative PV streamer over 13 h indicates that the storm is
moving slowly.
JUNE 2016 ROWE AND H I TCHMAN 2307
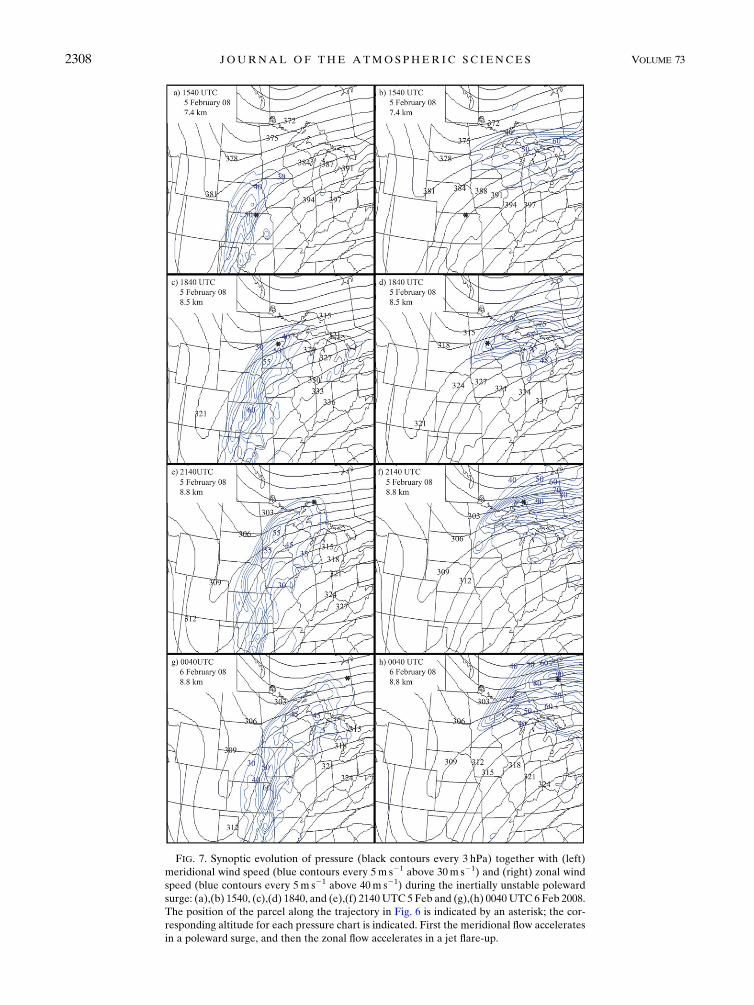
FIG. 7. Synoptic evolution of pressure (black contours every 3 hPa) together with (left)
meridional wind speed (blue contours every 5m s21 above 30m s21) and (right) zonal wind
speed (blue contours every 5m s21 above 40m s21) during the inertially unstable poleward
surge: (a),(b) 1540, (c),(d) 1840, and (e),(f) 2140UTC 5 Feb and (g),(h) 0040UTC 6 Feb 2008.
The position of the parcel along the trajectory in Fig. 6 is indicated by an asterisk; the cor-
responding altitude for each pressure chart is indicated. First the meridional flow accelerates
in a poleward surge, and then the zonal flow accelerates in a jet flare-up.
2308 JOURNAL OF THE ATMOSPHER IC SC IENCES VOLUME 73
The trajectory of this air parcel began several hours
earlier in the boundary layer over Texas (not shown), with
convective transport to 6.7-km altitude by 1340 UTC,
the first of the plotted locations in Fig. 6. Over the next
3h, the parcel ascended with a vertical motion w ;10 cms21, diminishing to ;2 cms21 over the next 3h,
with nearly level flow at 8.8km for the remainder of the
trajectory. This suggests that vertical advection of zonal
momentum, 2w›u/›z, would be a significant component
of an Eulerian momentum budget. However, by con-
sidering acceleration following the motion [see (1)], in-
dividual advection terms need not be calculated. During
the 13-h trajectory from 35.58 to 508N, this parcel’s zonal
speed increased from 6 to 91ms21, a gain of 85ms21.
This may be compared with an expected increase of
;160ms21 from conservation of angular momentum for
this 14.58 latitudinal displacement. The first half of the
trajectory occurred in the presence of weak zonal flow
and an accelerating meridional flow, consistent with a
strong westward zonal pressure gradient force and a
strong northward pressure gradient force.
The solid curves in Fig. 6a correspond to inertially
neutral flow, where f 5 ›u/›y. Perhaps counterintuitively,
under conditions of inertial instability the meridional flow
accelerates, but f 2 ›u/›y, 0, so the meridional increase
of zonalwind uponmeridional displacement is expected to
lag behind the angular momentum–conserving profiles.
That is, zonal flow acceleration is reduced by inertial in-
stability in poleward displacement! Conversely, in con-
ditions of strong inertial stability, f 2 ›u/›y. 0, so the
meridional increase of zonal wind would exceed that of
angular momentum–conserving profiles. It is also clear in
this situation that the zonal pressure gradient force acted
to reduce the gain of zonal wind speed during northward
displacement, relative to angular momentum–conserving
flow in the first half of the trajectory.
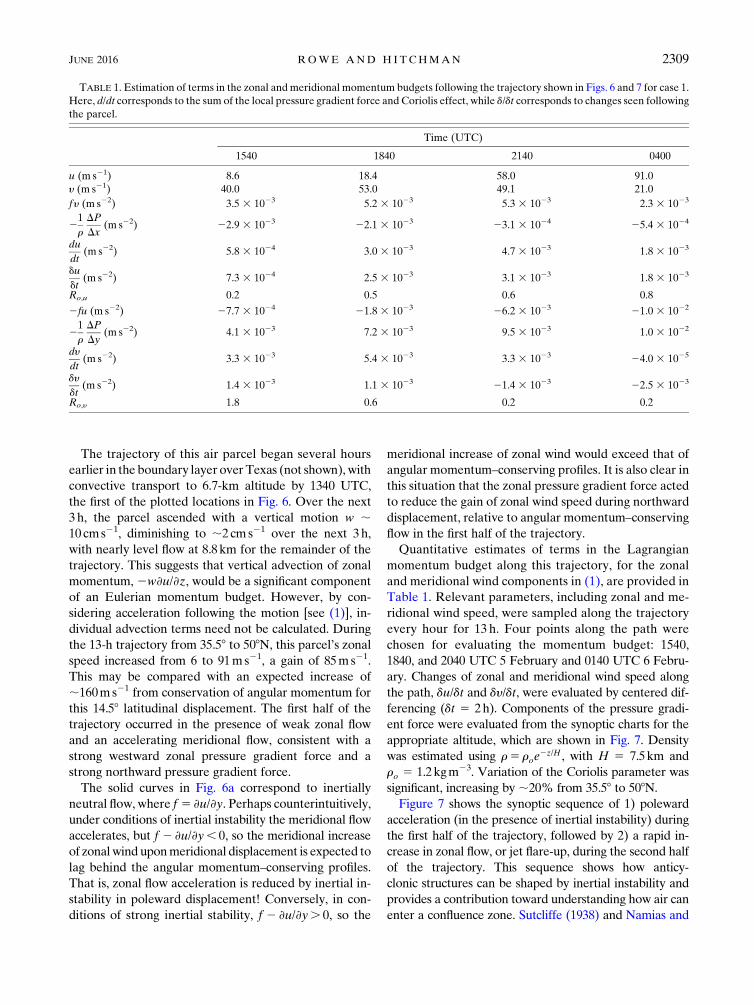
Quantitative estimates of terms in the Lagrangian
momentum budget along this trajectory, for the zonal
and meridional wind components in (1), are provided in
Table 1. Relevant parameters, including zonal and me-
ridional wind speed, were sampled along the trajectory
every hour for 13 h. Four points along the path were
chosen for evaluating the momentum budget: 1540,
1840, and 2040 UTC 5 February and 0140 UTC 6 Febru-
ary. Changes of zonal and meridional wind speed along
the path, du/dt and dy/dt, were evaluated by centered dif-
ferencing (dt 5 2h). Components of the pressure gradi-
ent force were evaluated from the synoptic charts for the
appropriate altitude, which are shown in Fig. 7. Density
was estimated using r5 roe2z/H , with H 5 7.5km and
ro 5 1.2kgm23. Variation of the Coriolis parameter was
significant, increasing by ;20% from 35.58 to 508N.
Figure 7 shows the synoptic sequence of 1) poleward
acceleration (in the presence of inertial instability) during
the first half of the trajectory, followed by 2) a rapid in-
crease in zonal flow, or jet flare-up, during the second half
of the trajectory. This sequence shows how anticy-
clonic structures can be shaped by inertial instability and
provides a contribution toward understanding how air can
enter a confluence zone. Sutcliffe (1938) and Namias and
TABLE 1. Estimation of terms in the zonal andmeridional momentum budgets following the trajectory shown in Figs. 6 and 7 for case 1.
Here, d/dt corresponds to the sum of the local pressure gradient force and Coriolis effect, while d/dt corresponds to changes seen following
the parcel.
Time (UTC)
1540 1840 2140 0400
u (m s21) 8.6 18.4 58.0 91.0
y (m s21) 40.0 53.0 49.1 21.0
fy (m s22) 3.5 3 1023 5.2 3 1023 5.3 3 1023 2.3 3 1023
21
r
DP
Dx(m s22) 22.9 3 1023 22.1 3 1023 23.1 3 1024 25.4 3 1024
du
dt(m s22) 5.8 3 1024 3.0 3 1023 4.7 3 1023 1.8 3 1023
du
dt(m s22) 7.3 3 1024 2.5 3 1023 3.1 3 1023 1.8 3 1023
Ro,u 0.2 0.5 0.6 0.8
2fu (m s22) 27.7 3 1024 21.8 3 1023 26.2 3 1023 21.0 3 1022
21
r
DP
Dy(m s22) 4.1 3 1023 7.2 3 1023 9.5 3 1023 1.0 3 1022
dy
dt(m s22) 3.3 3 1023 5.4 3 1023 3.3 3 1023 24.0 3 1025
dy
dt(m s22) 1.4 3 1023 1.1 3 1023 21.4 3 1023 22.5 3 1023
Ro,y 1.8 0.6 0.2 0.2
JUNE 2016 ROWE AND H I TCHMAN 2309
Clapp (1949) argued that confluence in the upper tro-
posphere requires flow toward lower pressure with
acceleration into the confluence region. Inertial insta-
bility associated with convection equatorward of the jet
entrance region specifically promotes this process.
In the first half of the trajectory, the meridional wind
accelerates to ;53m s21 (Table 1) because of the im-
balance of a strong poleward pressure gradient force
versus a small Coriolis term. This is because of weak
zonal flow imposed by convective updrafts and is a
synoptic signature of inertial instability (Fig. 7). Dur-
ing these 13h, the zonal wind speed increases from
;9 to ;91m s21, with much more rapid increase in
the second half of the trajectory (Table 1). The sum
f y2 (1/r)(›p/›x)5 du/dt agrees reasonably well with
estimates of acceleration along the path du/dt (Table 1).
The general trend of dy/dt with time along the tra-
jectory agrees with the general trend in the sum
2f y1 (1/r)(›p/›y)5 dy/dt, with poleward acceleration
at the first quarter of the trajectory, followed by deceler-
ation and a maximum meridional speed during mid-
trajectory, as depicted in Fig. 7. But there are significant
discrepancies between the observed and theoretical esti-
mates of meridional wind acceleration. This may be due
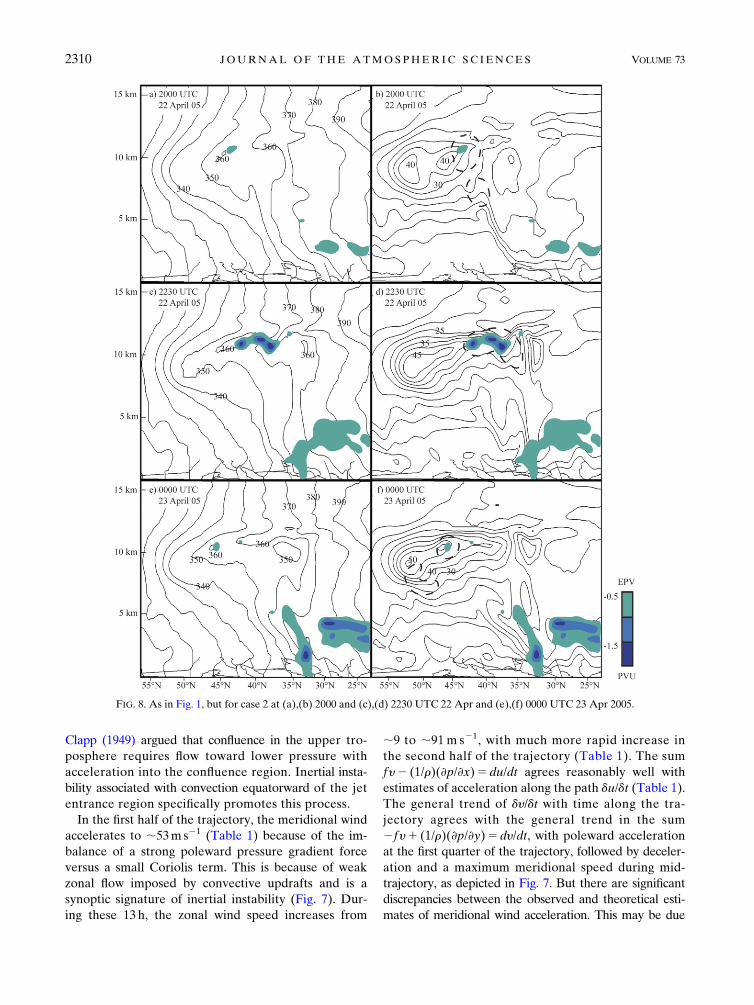
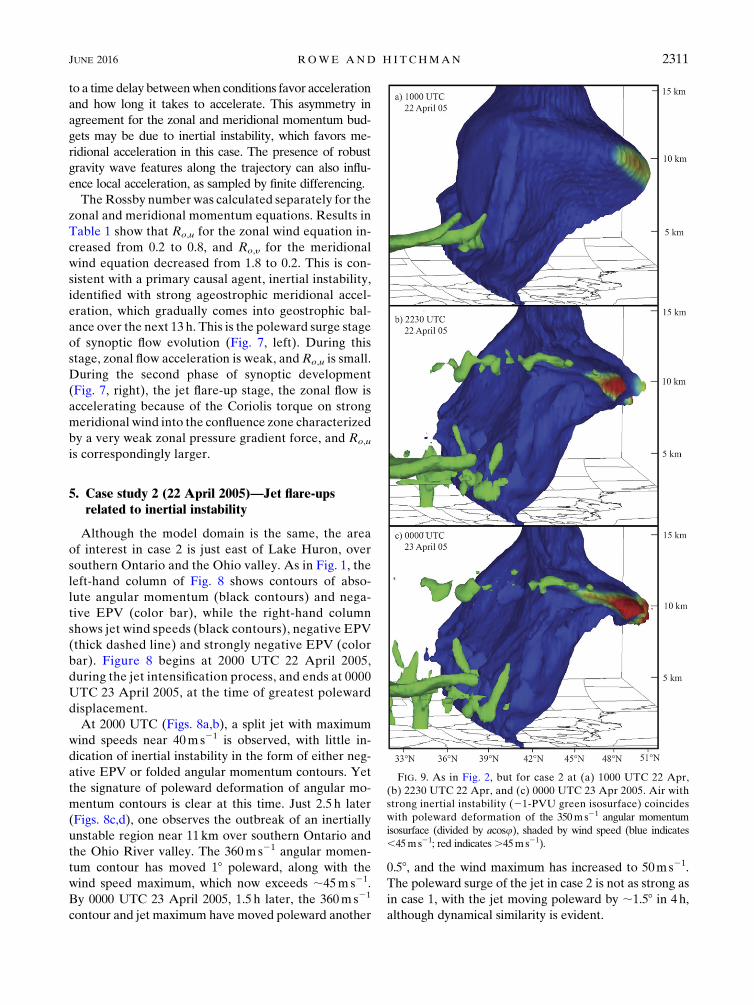
FIG. 8. As in Fig. 1, but for case 2 at (a),(b) 2000 and (c),(d) 2230 UTC 22 Apr and (e),(f) 0000 UTC 23 Apr 2005.
2310 JOURNAL OF THE ATMOSPHER IC SC IENCES VOLUME 73
to a time delay betweenwhen conditions favor acceleration
and how long it takes to accelerate. This asymmetry in
agreement for the zonal and meridional momentum bud-
gets may be due to inertial instability, which favors me-
ridional acceleration in this case. The presence of robust
gravity wave features along the trajectory can also influ-
ence local acceleration, as sampled by finite differencing.
The Rossby number was calculated separately for the
zonal and meridional momentum equations. Results in
Table 1 show that Ro,u for the zonal wind equation in-
creased from 0.2 to 0.8, and Ro,y for the meridional
wind equation decreased from 1.8 to 0.2. This is con-
sistent with a primary causal agent, inertial instability,
identified with strong ageostrophic meridional accel-
eration, which gradually comes into geostrophic bal-
ance over the next 13 h. This is the poleward surge stage
of synoptic flow evolution (Fig. 7, left). During this
stage, zonal flow acceleration is weak, and Ro,u is small.
During the second phase of synoptic development
(Fig. 7, right), the jet flare-up stage, the zonal flow is
accelerating because of the Coriolis torque on strong
meridional wind into the confluence zone characterized
by a very weak zonal pressure gradient force, and Ro,u
is correspondingly larger.
5. Case study 2 (22 April 2005)—Jet flare-upsrelated to inertial instability
Although the model domain is the same, the area
of interest in case 2 is just east of Lake Huron, over
southern Ontario and the Ohio valley. As in Fig. 1, the
left-hand column of Fig. 8 shows contours of abso-
lute angular momentum (black contours) and nega-
tive EPV (color bar), while the right-hand column
shows jet wind speeds (black contours), negative EPV
(thick dashed line) and strongly negative EPV (color
bar). Figure 8 begins at 2000 UTC 22 April 2005,
during the jet intensification process, and ends at 0000
UTC 23 April 2005, at the time of greatest poleward
displacement.
At 2000 UTC (Figs. 8a,b), a split jet with maximum
wind speeds near 40ms21 is observed, with little in-
dication of inertial instability in the form of either neg-
ative EPV or folded angular momentum contours. Yet
the signature of poleward deformation of angular mo-
mentum contours is clear at this time. Just 2.5 h later
(Figs. 8c,d), one observes the outbreak of an inertially
unstable region near 11 km over southern Ontario and
the Ohio River valley. The 360ms21 angular momen-
tum contour has moved 18 poleward, along with the
wind speed maximum, which now exceeds ;45m s21.
By 0000 UTC 23 April 2005, 1.5 h later, the 360ms21
contour and jet maximum have moved poleward another
0.58, and the wind maximum has increased to 50ms21.
The poleward surge of the jet in case 2 is not as strong as
in case 1, with the jet moving poleward by ;1.58 in 4h,
although dynamical similarity is evident.
FIG. 9. As in Fig. 2, but for case 2 at (a) 1000 UTC 22 Apr,
(b) 2230 UTC 22 Apr, and (c) 0000 UTC 23 Apr 2005. Air with
strong inertial instability (21-PVU green isosurface) coincides
with poleward deformation of the 350ms21 angular momentum
isosurface (divided by acosu), shaded by wind speed (blue indicates
,45ms21; red indicates.45ms21).
JUNE 2016 ROWE AND H I TCHMAN 2311
As in Fig. 2, Fig. 9 displays jet intensification for case 2 as
depicted by the 350ms21 isosurface of angular momen-
tum and the21-PVU isosurface of EPV (viewed from the
east), but with a threshold of 45ms21 for red shading of
the angular momentum surface. At 1000 UTC 22 April
2005 (Fig. 9a), 10h before the sequence shown in Fig. 8,
regions of negative EPV (green isosurfaces) are found
only in the warm moist lower troposphere along the cold
front. Areas of inertial instability break out in the upper
troposphere ;10.5h later (Figs. 9b, 8c,d) in association
with a poleward surge in the UTLS. The shape of the
poleward-intruding angular momentum surface has nar-
rowed, while the jet speed has increased beyond
45m s21. Another 1.5 h later, Figs. 9c, 6e, and 6f depict
continued intensification, as the poleward extension
of the angular momentum surface becomes even more
pronounced in association with the poleward motion
of inertially unstable air, and the region of high wind
speed expands on the 350m s21 isosurface.
There is clear dynamical commonality between these
two cases, characterized by a coincidence of inertial
instability, poleward extension of angular momentum
contours, and wind speed increase. There is also a
commonality of jet flare-up behavior, which is now
highlighted for case 2. Case 2 illustrates that jet ac-
celerations can occur in association with moderate
regions of inertial instability and that poleward mo-
mentum surges can occur at smaller spatial scales than
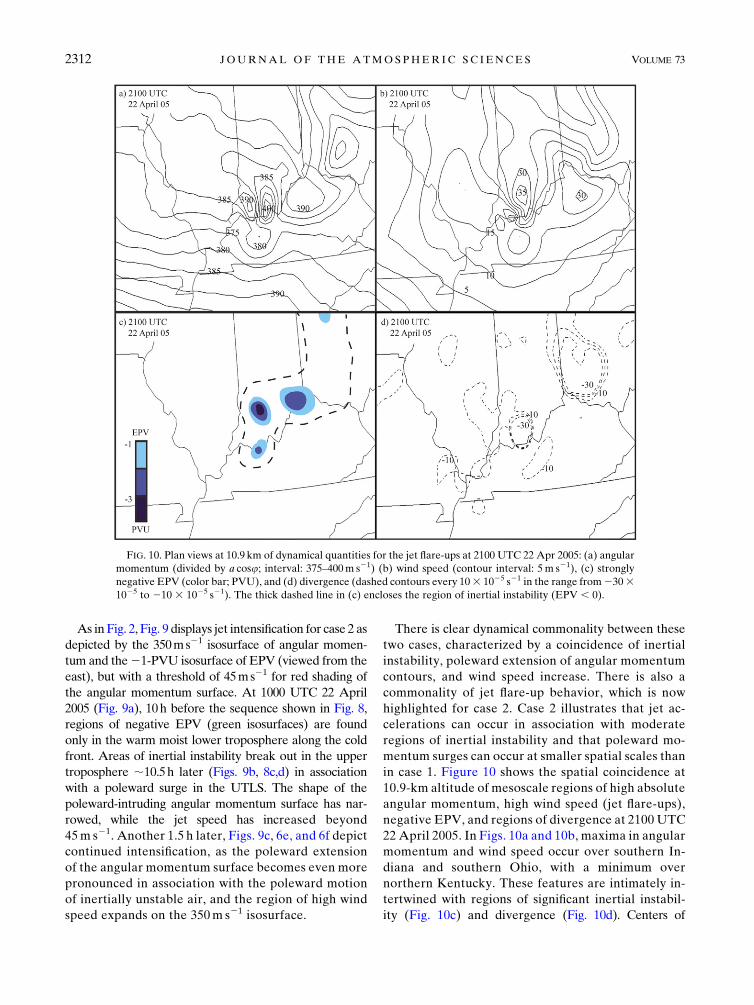
in case 1. Figure 10 shows the spatial coincidence at
10.9-km altitude of mesoscale regions of high absolute
angular momentum, high wind speed (jet flare-ups),
negative EPV, and regions of divergence at 2100 UTC
22 April 2005. In Figs. 10a and 10b, maxima in angular
momentum and wind speed occur over southern In-
diana and southern Ohio, with a minimum over
northern Kentucky. These features are intimately in-
tertwined with regions of significant inertial instabil-
ity (Fig. 10c) and divergence (Fig. 10d). Centers of
FIG. 10. Plan views at 10.9 km of dynamical quantities for the jet flare-ups at 2100 UTC 22 Apr 2005: (a) angular
momentum (divided by a cosu; interval: 375–400m s21) (b) wind speed (contour interval: 5 m s21), (c) strongly
negative EPV (color bar; PVU), and (d) divergence (dashed contours every 103 1025 s21 in the range from23031025 to 210 3 1025 s21). The thick dashed line in (c) encloses the region of inertial instability (EPV , 0).
2312 JOURNAL OF THE ATMOSPHER IC SC IENCES VOLUME 73
horizontal convergence (Fig. 10d) are found just down-
stream of regions of strong inertial instability (Fig.
10c) and near the total wind speed maxima (Figs.
10a,b). This is consistent with signatures expected from
inertial instability, where poleward acceleration gives rise
to a momentum surge and convergence just poleward of
the region of inertial instability.
Supplemental movie 2 highlights these jet flare-ups for
the 48-h simulation, as seen from the southeast looking
to the northwest over the Tennessee Valley region. In
this sequence, upward- and poleward-moving streams of
air with EPV , 0 are shown in light gray while an iso-
surface of absolute momentum is shown in blue, with
speeds exceeding 32ms21 shown in red. Note how the
inertially unstable air interacts with the isosurface of
momentum, resulting in several small, localized wind
speed maxima.
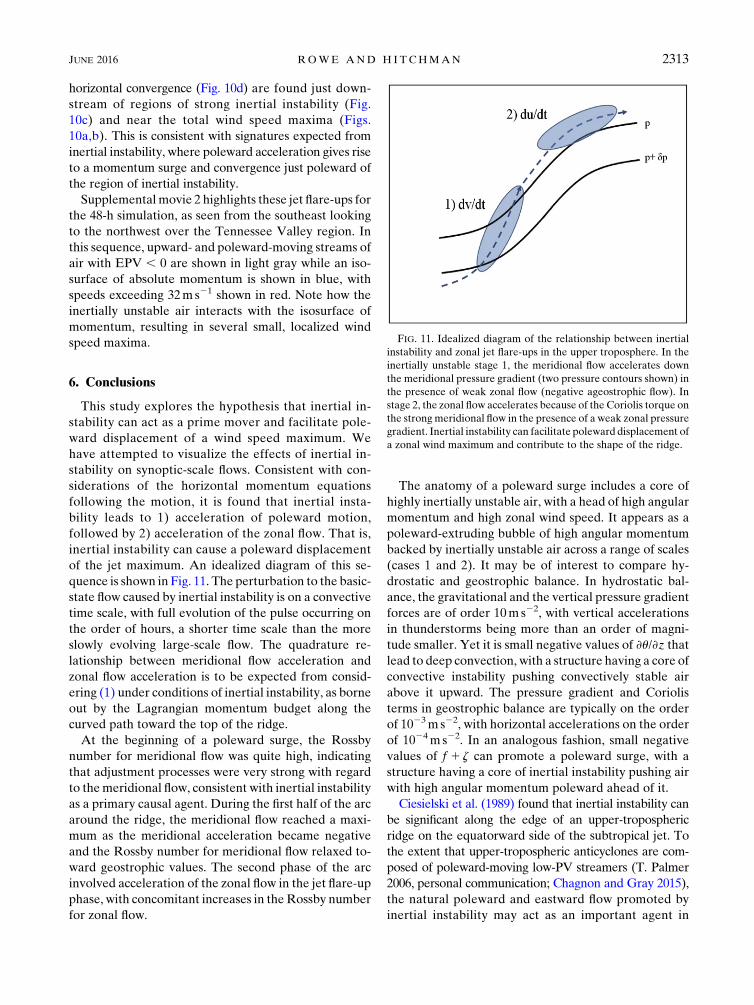
6. Conclusions
This study explores the hypothesis that inertial in-
stability can act as a prime mover and facilitate pole-
ward displacement of a wind speed maximum. We
have attempted to visualize the effects of inertial in-
stability on synoptic-scale flows. Consistent with con-
siderations of the horizontal momentum equations
following the motion, it is found that inertial insta-
bility leads to 1) acceleration of poleward motion,
followed by 2) acceleration of the zonal flow. That is,
inertial instability can cause a poleward displacement
of the jet maximum. An idealized diagram of this se-
quence is shown in Fig. 11. The perturbation to the basic-
state flow caused by inertial instability is on a convective
time scale, with full evolution of the pulse occurring on
the order of hours, a shorter time scale than the more
slowly evolving large-scale flow. The quadrature re-
lationship between meridional flow acceleration and
zonal flow acceleration is to be expected from consid-
ering (1) under conditions of inertial instability, as borne
out by the Lagrangian momentum budget along the
curved path toward the top of the ridge.
At the beginning of a poleward surge, the Rossby
number for meridional flow was quite high, indicating
that adjustment processes were very strong with regard
to themeridional flow, consistent with inertial instability
as a primary causal agent. During the first half of the arc
around the ridge, the meridional flow reached a maxi-
mum as the meridional acceleration became negative
and the Rossby number for meridional flow relaxed to-
ward geostrophic values. The second phase of the arc
involved acceleration of the zonal flow in the jet flare-up
phase, with concomitant increases in theRossby number
for zonal flow.
The anatomy of a poleward surge includes a core of
highly inertially unstable air, with a head of high angular
momentum and high zonal wind speed. It appears as a
poleward-extruding bubble of high angular momentum
backed by inertially unstable air across a range of scales
(cases 1 and 2). It may be of interest to compare hy-
drostatic and geostrophic balance. In hydrostatic bal-
ance, the gravitational and the vertical pressure gradient
forces are of order 10ms22, with vertical accelerations
in thunderstorms being more than an order of magni-
tude smaller. Yet it is small negative values of ›u/›z that
lead to deep convection, with a structure having a core of
convective instability pushing convectively stable air
above it upward. The pressure gradient and Coriolis
terms in geostrophic balance are typically on the order
of 1023m s22, with horizontal accelerations on the order
of 1024m s22. In an analogous fashion, small negative
values of f 1 z can promote a poleward surge, with a
structure having a core of inertial instability pushing air
with high angular momentum poleward ahead of it.
Ciesielski et al. (1989) found that inertial instability can
be significant along the edge of an upper-tropospheric
ridge on the equatorward side of the subtropical jet. To
the extent that upper-tropospheric anticyclones are com-
posed of poleward-moving low-PV streamers (T. Palmer
2006, personal communication; Chagnon and Gray 2015),
the natural poleward and eastward flow promoted by
inertial instability may act as an important agent in
FIG. 11. Idealized diagram of the relationship between inertial
instability and zonal jet flare-ups in the upper troposphere. In the
inertially unstable stage 1, the meridional flow accelerates down
the meridional pressure gradient (two pressure contours shown) in
the presence of weak zonal flow (negative ageostrophic flow). In
stage 2, the zonal flow accelerates because of the Coriolis torque on
the strong meridional flow in the presence of a weak zonal pressure
gradient. Inertial instability can facilitate poleward displacement of
a zonal wind maximum and contribute to the shape of the ridge.
JUNE 2016 ROWE AND H I TCHMAN 2313
creating and maintaining the shape of a ridge. It will be
of interest to further explore the effects of inertial in-
stability on the evolution of the wind and mass fields
and on the excitation of gravity waves in developing
midlatitude cyclones.
Acknowledgments. We are grateful for support from
NASA Grant NNX10AG57G and NSF Grants AGS-
1256215 and AGS-1555851. We thank Greg Tripoli for
helpful conversations and Pete Pokrandt and Kuniaki
Inoue for lending their computing expertise. We would
also like to acknowledge helpful reviews from Harald
Richter and an anonymous reviewer.
REFERENCES
Angell, J. K., 1962: The influence of inertial instability upon
transosonde trajectories and some forecast implications.Mon.
Wea. Rev., 90, 245–251, doi:10.1175/1520-0493(1962)090,0245:
TIOIIU.2.0.CO;2.
Blanchard, D. O., W. R. Cotton, and J. M. Brown, 1998: Me-
soscale circulation growth under conditions of weak in-
ertial instability. Mon. Wea. Rev., 126, 118–140, doi:10.1175/
1520-0493(1998)126,0118:MCGUCO.2.0.CO;2.
Blumen, W., 1972: Geostrophic adjustment. Rev. Geophys., 10,
485–528, doi:10.1029/RG010i002p00485.
Cahn, A. J., 1945: An investigation of the free oscillations of a
simple current system. J. Meteor., 2, 113–119, doi:10.1175/
1520-0469(1945)002,0113:AIOTFO.2.0.CO;2.
Chagnon, J. M., and S. L. Gray, 2015: A diabatically generated
potential vorticity structure near the extratropical tropopause
in three simulated extratropical cyclones. Mon. Wea. Rev.,
143, 2337–2347, doi:10.1175/MWR-D-14-00092.1.
Ciesielski, P. E., D. E. Stevens, R. H. Johnson, and K. R. Dean, 1989:
Observational evidence for asymmetric inertial instability.
J. Atmos. Sci., 46, 817–831, doi:10.1175/1520-0469(1989)046,0817:
OEFAII.2.0.CO;2.
Dunkerton, T. J., 1981: On the inertial stability of the equatorial
middle atmosphere. J. Atmos. Sci., 38, 2354–2364, doi:10.1175/
1520-0469(1981)038,2354:OTISFT.2.0.CO;2.
Eliassen, A., 1951: Slow thermally or frictionally controlled meridi-
onal circulation in a circular vortex.Astrophys. Norv., 5, 19–60.——, 1959: On the formation of fronts in the atmosphere.TheRossby
Memorial Volume, Rockefeller Institute Press, 277–287.
——, and E. Kleinschmidt, 1957: Handbuch der Physik. Vol. 48,
Springer-Verlag, 154 pp.
Emanuel, K. A., 1979: Inertial instability andmesoscale convective
systems. Part I: Linear theory of inertial instability in rotating
viscous fluids. J. Atmos. Sci., 36, 2425–2449, doi:10.1175/
1520-0469(1979)036,2425:IIAMCS.2.0.CO;2.
——, 1982: Inertial instability and mesoscale convective systems.
Part II: Symmetric CISK in a baroclinic flow. J. Atmos.
Sci., 39, 1080–1097, doi:10.1175/1520-0469(1982)039,1080:
IIAMCS.2.0.CO;2.
Fritsch, J. M., and R. A. Maddox, 1981: Convectively driven me-
soscale pressure systems aloft. Part I: Observations. J. Appl.
Meteor., 20, 9–19, doi:10.1175/1520-0450(1981)020,0009:
CDMWSA.2.0.CO;2.
Fritts, D. C., L. Yuan, M. H. Hitchman, L. Coy, E. Kudeki, and
R. F.Woodman, 1992:Dynamics of the equatorialmesosphere
observed using the Jicamarca MST radar during June and
August 1987. J. Atmos. Sci., 49, 2353–2371, doi:10.1175/
1520-0469(1992)049,2353:DOTEMO.2.0.CO;2.
Hayashi, H., M. Shiotani, and J. C. Gille, 1998: Vertically
stacked temperature disturbances near the equatorial stra-
topause as seen in cryogenic limb array etalon spectrometer
data. J. Geophys. Res., 103, 19 469–19 483, doi:10.1029/
98JD01730.
Hitchman, M. H., C. B. Leovy, J. C. Gille, and P. L. Bailey, 1987:
Quasi-stationary zonally asymmetric circulations in the
equatorial middle atmosphere. J. Atmos. Sci., 44, 2219–2236,
doi:10.1175/1520-0469(1987)044,2219:QSZACI.2.0.CO;2.
Holton, J. R., 2006: An Introduction to Dynamic Meteorology.
Academic Press, 535 pp.
Jascourt, S., 1997: Convective organizing and upscale development
processes explored through idealized numerical experiments.
Ph.D. dissertation, Dept. of Atmospheric and Oceanic Sci-
ences, University of Wisconsin–Madison, 267 pp.
Keyser, D. A., and D. R. Johnson, 1984: Effects of diabatic heating
on the ageostrophic circulation of an upper tropospheric
jet streak. Mon. Wea. Rev., 112, 1709–1724, doi:10.1175/
1520-0493(1984)112,1709:EODHOT.2.0.CO;2.
Koch, S. E., and P. B. Dorian, 1988: A mesoscale gravity wave event
observed during CCOPE. Part III: Wave environment and
probable source mechanisms. Mon. Wea. Rev., 116, 2570–2592,
doi:10.1175/1520-0493(1988)116,2570:AMGWEO.2.0.CO;2.
Kocin, P. J., W. Uccellini, andR. A. Peterson, 1986: Rapid evolution
of a jet streak circulation in a pre-convective environment.
Meteor. Atmos. Phys., 35, 103–138, doi:10.1007/BF01026169.
Maddox, R. A., 1980: Mesoscale convective complexes. Bull. Amer.
Meteor. Soc., 61, 1374–1387, doi:10.1175/1520-0477(1980)061,1374:
MCC.2.0.CO;2.
——, 1983: Large-scale meteorological conditions associated
with midlatitude convective complexes. Mon. Wea. Rev.,
111, 1475–1493, doi:10.1175/1520-0493(1983)111,1475:
LSMCAW.2.0.CO;2.
McCann, D.W., 2001: Gravity waves, unbalanced flow, and aircraft
clear air turbulence. Natl. Wea. Dig., 25 (1–2), 3–14.
Mecikalski, J. R., and G. J. Tripoli, 1998: Inertial available
kinetic energy and the dynamics of tropical plume for-
mation. Mon. Wea. Rev., 126, 2200–2216, doi:10.1175/
1520-0493(1998)126,2200:IAKEAT.2.0.CO;2.
——, and ——, 2003: Influence of upper-tropospheric inertial in-
stability on the convective transport of momentum. Quart.
J. Roy. Meteor. Soc., 129, 1537–1563, doi:10.1256/qj.00.08.
Namias, J., and P. F. Clapp, 1949: Confluence theory of the high
tropospheric jet stream. J. Meteor., 6, 330–336, doi:10.1175/
1520-0469(1949)006,0330:CTOTHT.2.0.CO;2.
Ninomiya, K., 1971: Mesoscale modification of synoptic situations
from thunderstorm development as revealed by ATS III and
aerological data. J. Appl. Meteor., 10, 1103–1121, doi:10.1175/
1520-0450(1971)010,1103:MMOSSF.2.0.CO;2.
Palmén, E., and C. W. Newton, 1969: Atmospheric Circulation Sys-
tems: Their Structure and Physical Interpretation. International
Geophysics Series, Vol. 13, Academic Press, 603 pp.
Pokrandt, P. J., G. J. Tripoli, and D. D. Houghton, 1996: Pro-
cesses leading to the formation of mesoscale waves in the
midwest cyclone of 15 December 1987. Mon. Wea. Rev.,
124, 2726–2752, doi:10.1175/1520-0493(1996)124,2726:
PLTTFO.2.0.CO;2.
Rossby, C.-G., 1938: Solenoidal circulations resulting from lateral
mixing. Eos, Trans. Amer. Geophys. Union, 19, 159–162,
doi:10.1029/TR019i001p00159.
2314 JOURNAL OF THE ATMOSPHER IC SC IENCES VOLUME 73
Rowe, S. M., and M. H. Hitchman, 2015: On the role of inertial
instability in stratosphere–troposphere exchange in mid-
latitude cyclones. J. Atmos. Sci., 72, 2131–2151, doi:10.1175/
JAS-D-14-0210.1.
Schumacher, R. S., D.M. Schultz, and J. A. Knox, 2010: Convective
snowbands downstream of the Rocky Mountains in an envi-
ronment with conditional, dry symmetric, and inertial in-
stabilities. Mon. Wea. Rev., 138, 4416–4438, doi:10.1175/
2010MWR3334.1.
Shapiro, M. A., 1981: Frontogenesis and geostrophically forced
secondary circulations in the vicinity of jet stream–frontal
zone systems. J. Atmos. Sci., 38, 954–973, doi:10.1175/
1520-0469(1981)038,0954:FAGFSC.2.0.CO;2.
Sutcliffe, R. C., 1938: On development in the field of barometric
pressure.Quart. J. Roy.Meteor. Soc., 64, 495–504, doi:10.1002/qj.49706427614.
Tripoli, G. J., 1992a: An explicit three-dimensional nonhydrostatic
numerical simulation of a tropical cyclone. Meteor. Atmos.
Phys., 49, 229–254, doi:10.1007/BF01025409.
——, 1992b: A nonhydrostatic numerical model designed to simulate
scale interaction. Mon. Wea. Rev., 120, 1342–1359, doi:10.1175/
1520-0493(1992)120,1342:ANMMDT.2.0.CO;2.
Uccellini, L. W., and D. R. Johnson, 1979: The coupling of upper
and lower jet streaks and implications for the development of
severe convective storms. Mon. Wea. Rev., 107, 682–703,
doi:10.1175/1520-0493(1979)107,0682:TCOUAL.2.0.CO;2.
Van Tuyl, A. H., and J. A. Young, 1982: Numerical simulation of a
nonlinear jet streak adjustment.Mon.Wea. Rev., 110, 2038–2054,doi:10.1175/1520-0493(1982)110,2038:NSONJS.2.0.CO;2.
Zhang, F., S. E. Koch, C. A. Davis, and C. L. Kaplan, 2000: A sur-
vey of unbalanced flow diagnostics and their application. Adv.
Atmos. Sci., 17, 165–183, doi:10.1007/s00376-000-0001-1.
JUNE 2016 ROWE AND H I TCHMAN 2315


![Inertial Navigation Systems - Indico [Home]indico.ictp.it/event/a12180/session/23/contribution/14/material/0/... · Inertial Navigation Systems. Inertial Navigation Systems ... •](https://img.pdfslide.us/doc/110x75/5a94bdc87f8b9a451b8c1652/inertial-navigation-systems-indico-home-navigation-systems-inertial-navigation.jpg)