Embed Size (px)
Citation preview
On the relationship between cosmic rays, solaractivity and powerful earthquakes.
Kovalyov, M. (corresponding author)1 and Kovalyov, S.
1 email: [email protected]
Abstract. In this paper we analyze the correlation of cosmic rays intensity to increases in seismic
activity. We also show that high-magnitude earthquakes appear in group. As a prequel, we discuss
in §1 naive visualization of the solar-cosmic ray interplay.
Key words: Powerful earthquakes, volcanic eruptions, solar activity, solar spots, cosmic rays.
§1. Naive visualization of the solar-cosmic ray interplay.
Earthquakes and volcanic eruptions have inspired fear since the very first days of man’ presence
on Earth. To the same time date first attempts to predict them based on whatever our ancestors
could see around: Sun, Moon, stars, weather, etc. and whatever they could not see: gods, deities,
etc. Attempts to predict seismic activity still persists, mostly based on solar and lunar behavior.
There are numerous publications on the existence of correlation between the phases of the Moon
and solar cycles and earthquakes and volcanic eruptions on Earth; many believe in it, their work
is numerous and can be found by typing "Solar cycles earthquakes", "Moon phases earthquakes",
"New Full Moon volcanic eruptions" or a similar expression into an Internet search engine. Others
completely deny the existence of any such correlation, an good example is a recent paper [10],
according to which solar-terrestrial triggering of earthquakes is insignificant. Which camp is right?
Mostly likely each is somewhat right and somewhat wrong. Given the complexity of the events
contributing to seismic activity and our rather limited knowledge of them, it is rather naive to
claim that one single event may cause seismic activity. Most likely, seismic activity is caused by a
combination of factors, somewhat similarly to vehicular accidents usually caused by a combination
of factors such as road conditions, weather, driver’s condition, etc. Sometimes one or two factors
1
arX
iv:1
403.
5728
v2 [
phys
ics.
gen-
ph]
10
Feb
2015
2
may dominate others, in which case the correlation is more visible; however, when many factors
are involved, the correlation between the cause and result is barely seen. Just quoted article [10]
shows lack of outright statistical correlation between the solar activity and earthquakes, but an
outright statistical correlation should not even be expected. Drawing a conclusion from lack of a
simple statistical correlation of the number and power of earthquakes with a single factor like the
sunspot number is like drawing a conclusion about traffic accidents from lack of a direct statistical
correlation of traffic accidents with a single factor like drunk drivers: not all traffic accidents
are caused by drunk drivers, and many drunk drivers do not cause accidents. Yet we all know
how dangerous drunk drivers are, but we also know that accidents are caused not only by drunk
drivers but also by drivers on medication, tired drivers, drunk pedestrians, slippery roads, thick
fog, mechanical failures, improper maintenance, defective parts, etc. What the article attests to
is the complexity of seismic activity and its causes and how difficult it might be to claim a single
factor as a cause of seismic activity.
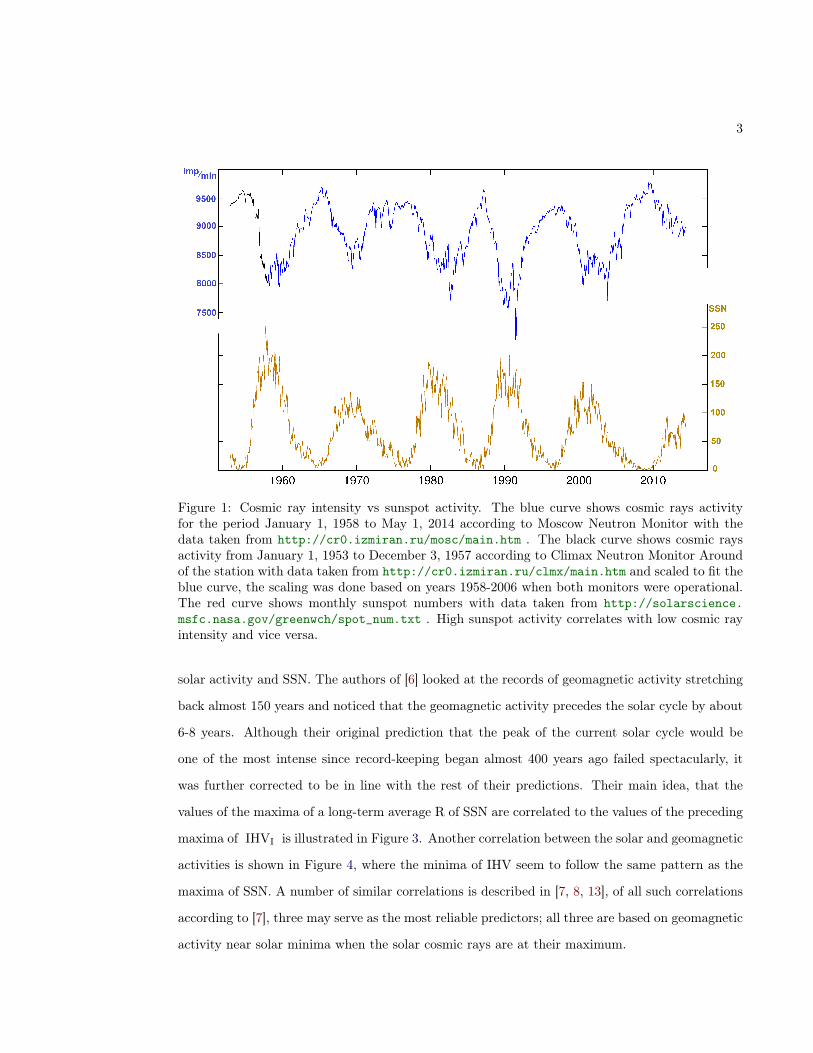
This article describes authors’ observation that the seismic activity seems to show better
correlation with cosmic rays, as measured by cosmic ray intensity and abbreviated by CRI, rather
than with solar activity as measured by sunspot numbers and abbreviated by SSN. The two are
correlated as shown in 1; high SSN correlates with low CRI, Cosmic rays are comprised of the
extra-solar cosmic rays originating outside of the Solar System and the solar cosmic rays produced
by the Sun. Near Earth CRI is known to be modulated by cyclical solar activity with the average
cycle of about 10.85 -10.975 years long1. We shall refer to such cycles as primary solar cycles. The
physical mechanism of the solar activity is unknown but is currently believed to be solely of purely
solar origin, with several theories attempting to explain it. Cosmic rays actually are not rays at
all but particles, 90% of which are protons, 9% are alpha particles.
A bit more careful analysis of Figure 1 shows that the maxima/minima of CRI lag the
minima/maxima of SSN by a few months. The time lag, explained in Figure 2, further further
confirms the current paradigm that the solar activity modulates CRI.
Recent work [6], however, suggests that not only SSN modulates CRI but also CRI affects1The first number 10.85 is obtained by taking the time of 238.75 years between the first recorded maximum of solaractivity in June 1761 and the last recorded maximum of solar activity in March, 2000 and dividing it by the number22 of solar cycles between them; the second number 10.975 is obtained by taking the time of about 252 years and5 months or 252.416667 years between the beginning of the first recorded solar cycle in August 1755 and the lastrecorded solar cycle in January 2008 and dividing it by the number 23 of solar cycles between them.
3
Figure 1: Cosmic ray intensity vs sunspot activity. The blue curve shows cosmic rays activityfor the period January 1, 1958 to May 1, 2014 according to Moscow Neutron Monitor with thedata taken from http://cr0.izmiran.ru/mosc/main.htm . The black curve shows cosmic raysactivity from January 1, 1953 to December 3, 1957 according to Climax Neutron Monitor Aroundof the station with data taken from http://cr0.izmiran.ru/clmx/main.htm and scaled to fit theblue curve, the scaling was done based on years 1958-2006 when both monitors were operational.The red curve shows monthly sunspot numbers with data taken from http://solarscience.msfc.nasa.gov/greenwch/spot_num.txt . High sunspot activity correlates with low cosmic rayintensity and vice versa.
solar activity and SSN. The authors of [6] looked at the records of geomagnetic activity stretching
back almost 150 years and noticed that the geomagnetic activity precedes the solar cycle by about
6-8 years. Although their original prediction that the peak of the current solar cycle would be
one of the most intense since record-keeping began almost 400 years ago failed spectacularly, it
was further corrected to be in line with the rest of their predictions. Their main idea, that the
values of the maxima of a long-term average R of SSN are correlated to the values of the preceding
maxima of IHVI is illustrated in Figure 3. Another correlation between the solar and geomagnetic
activities is shown in Figure 4, where the minima of IHV seem to follow the same pattern as the
maxima of SSN. A number of similar correlations is described in [7, 8, 13], of all such correlations
according to [7], three may serve as the most reliable predictors; all three are based on geomagnetic
activity near solar minima when the solar cosmic rays are at their maximum.
4
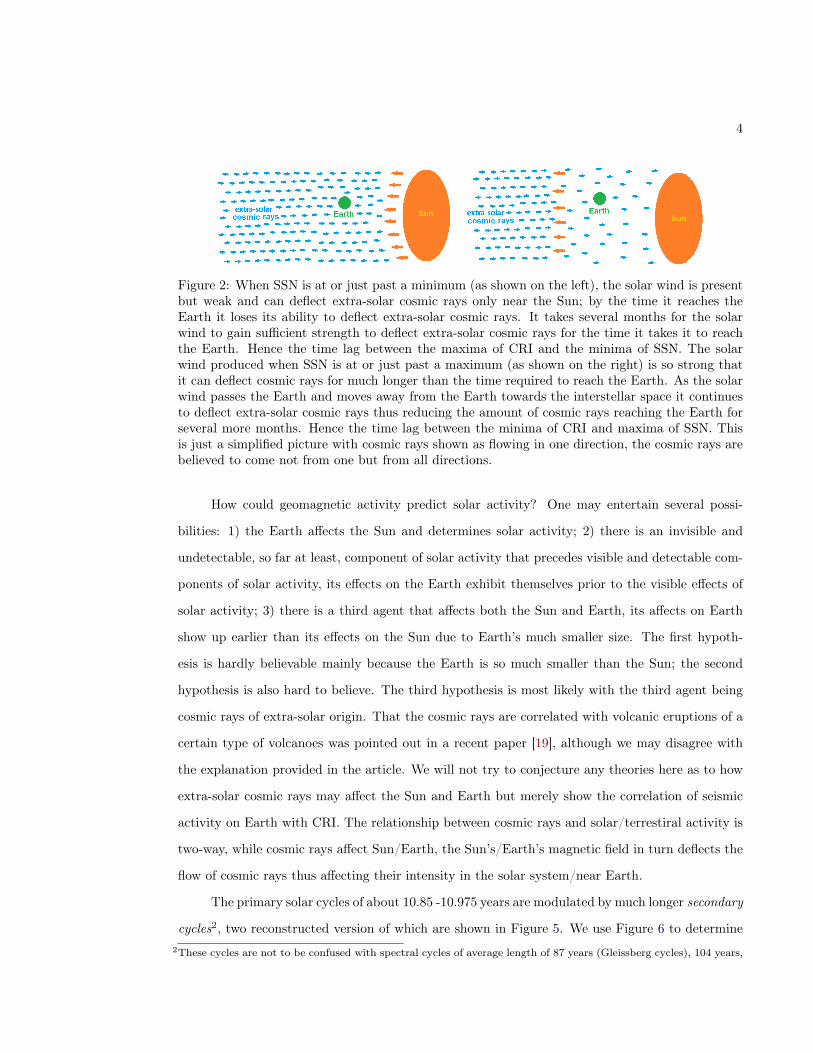
Figure 2: When SSN is at or just past a minimum (as shown on the left), the solar wind is presentbut weak and can deflect extra-solar cosmic rays only near the Sun; by the time it reaches theEarth it loses its ability to deflect extra-solar cosmic rays. It takes several months for the solarwind to gain sufficient strength to deflect extra-solar cosmic rays for the time it takes it to reachthe Earth. Hence the time lag between the maxima of CRI and the minima of SSN. The solarwind produced when SSN is at or just past a maximum (as shown on the right) is so strong thatit can deflect cosmic rays for much longer than the time required to reach the Earth. As the solarwind passes the Earth and moves away from the Earth towards the interstellar space it continuesto deflect extra-solar cosmic rays thus reducing the amount of cosmic rays reaching the Earth forseveral more months. Hence the time lag between the minima of CRI and maxima of SSN. Thisis just a simplified picture with cosmic rays shown as flowing in one direction, the cosmic rays arebelieved to come not from one but from all directions.
How could geomagnetic activity predict solar activity? One may entertain several possi-
bilities: 1) the Earth affects the Sun and determines solar activity; 2) there is an invisible and
undetectable, so far at least, component of solar activity that precedes visible and detectable com-
ponents of solar activity, its effects on the Earth exhibit themselves prior to the visible effects of
solar activity; 3) there is a third agent that affects both the Sun and Earth, its affects on Earth
show up earlier than its effects on the Sun due to Earth’s much smaller size. The first hypoth-
esis is hardly believable mainly because the Earth is so much smaller than the Sun; the second
hypothesis is also hard to believe. The third hypothesis is most likely with the third agent being
cosmic rays of extra-solar origin. That the cosmic rays are correlated with volcanic eruptions of a
certain type of volcanoes was pointed out in a recent paper [19], although we may disagree with
the explanation provided in the article. We will not try to conjecture any theories here as to how
extra-solar cosmic rays may affect the Sun and Earth but merely show the correlation of seismic
activity on Earth with CRI. The relationship between cosmic rays and solar/terrestiral activity is
two-way, while cosmic rays affect Sun/Earth, the Sun’s/Earth’s magnetic field in turn deflects the
flow of cosmic rays thus affecting their intensity in the solar system/near Earth.
The primary solar cycles of about 10.85 -10.975 years are modulated by much longer secondary
cycles2, two reconstructed version of which are shown in Figure 5. We use Figure 6 to determine2These cycles are not to be confused with spectral cycles of average length of 87 years (Gleissberg cycles), 104 years,
5
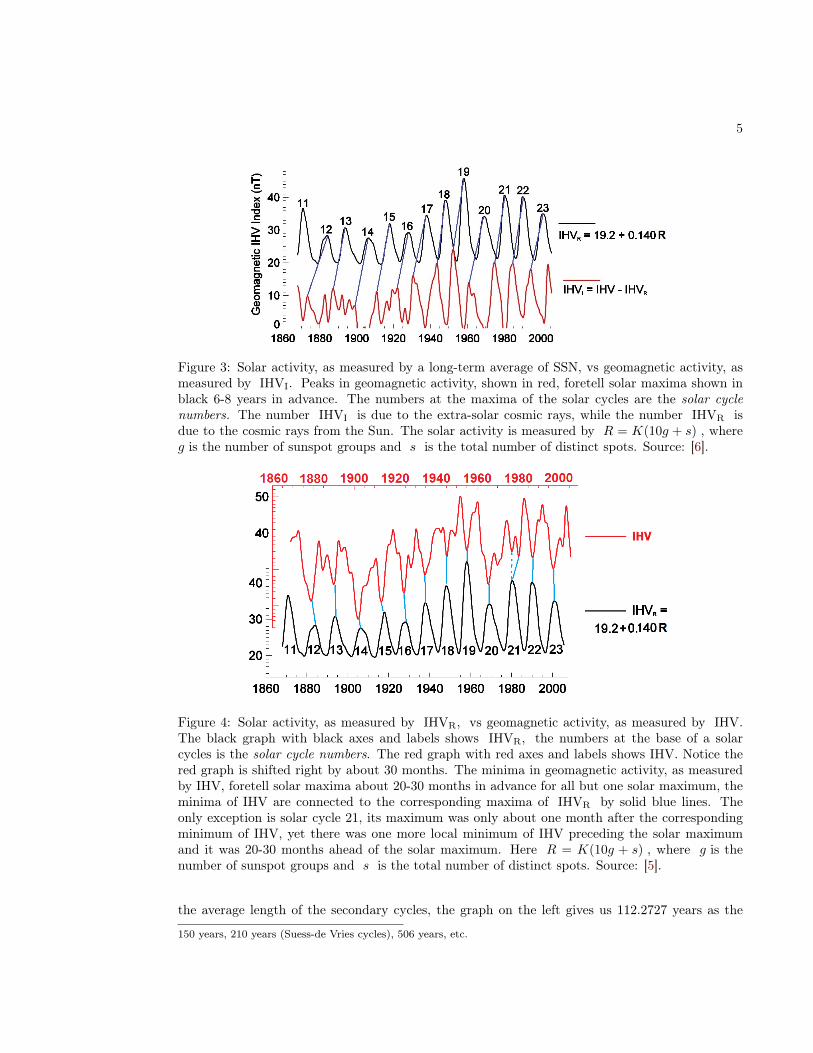
Figure 3: Solar activity, as measured by a long-term average of SSN, vs geomagnetic activity, asmeasured by IHVI. Peaks in geomagnetic activity, shown in red, foretell solar maxima shown inblack 6-8 years in advance. The numbers at the maxima of the solar cycles are the solar cyclenumbers. The number IHVI is due to the extra-solar cosmic rays, while the number IHVR isdue to the cosmic rays from the Sun. The solar activity is measured by R = K(10g + s) , whereg is the number of sunspot groups and s is the total number of distinct spots. Source: [6].
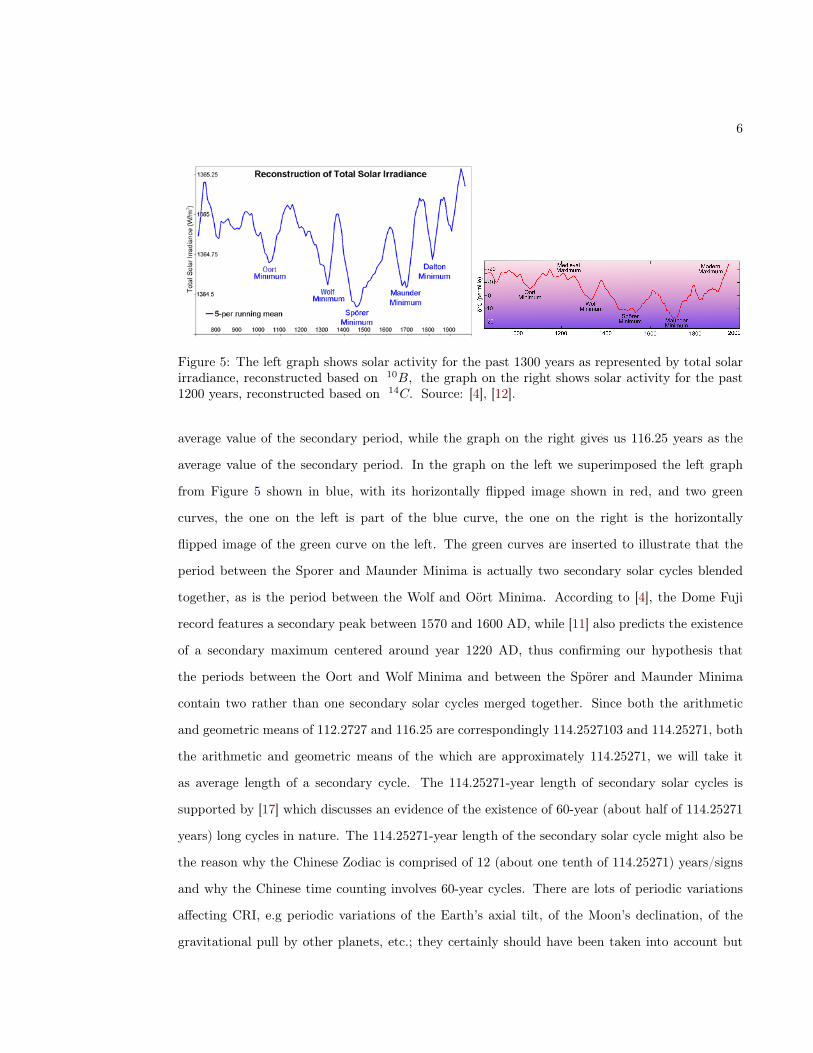
Figure 4: Solar activity, as measured by IHVR, vs geomagnetic activity, as measured by IHV.The black graph with black axes and labels shows IHVR, the numbers at the base of a solarcycles is the solar cycle numbers. The red graph with red axes and labels shows IHV. Notice thered graph is shifted right by about 30 months. The minima in geomagnetic activity, as measuredby IHV, foretell solar maxima about 20-30 months in advance for all but one solar maximum, theminima of IHV are connected to the corresponding maxima of IHVR by solid blue lines. Theonly exception is solar cycle 21, its maximum was only about one month after the correspondingminimum of IHV, yet there was one more local minimum of IHV preceding the solar maximumand it was 20-30 months ahead of the solar maximum. Here R = K(10g + s) , where g is thenumber of sunspot groups and s is the total number of distinct spots. Source: [5].
the average length of the secondary cycles, the graph on the left gives us 112.2727 years as the
150 years, 210 years (Suess-de Vries cycles), 506 years, etc.
6
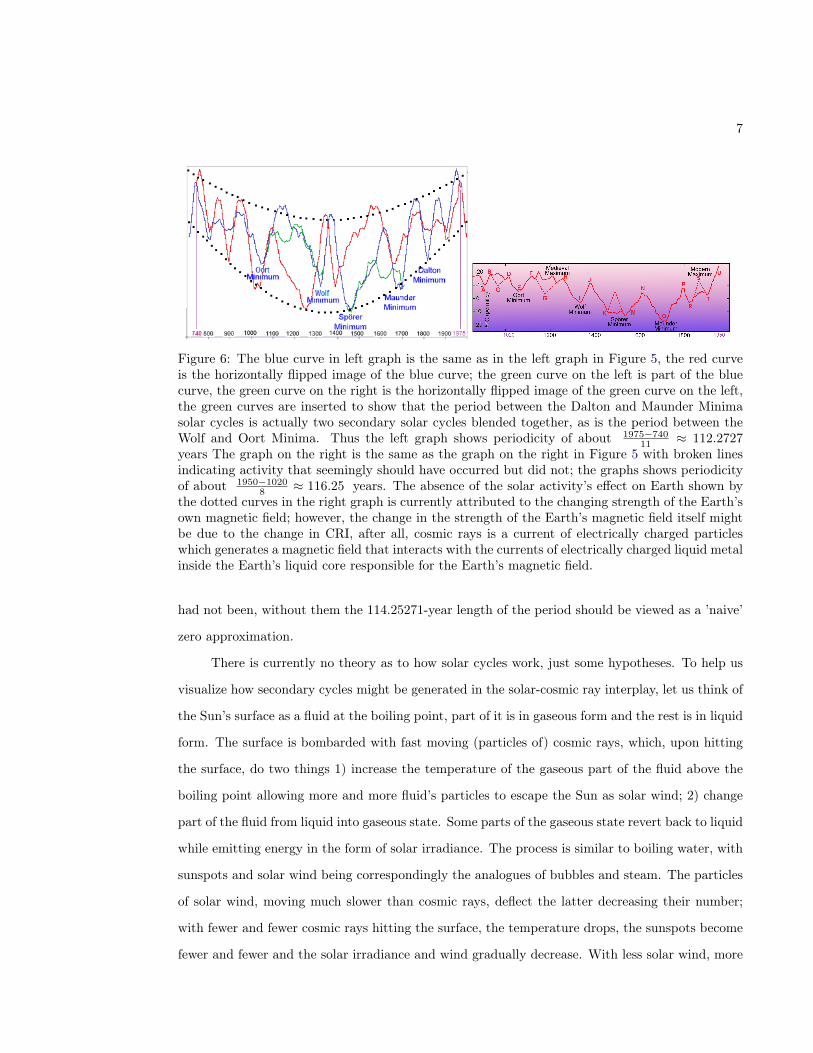
Figure 5: The left graph shows solar activity for the past 1300 years as represented by total solarirradiance, reconstructed based on 10B, the graph on the right shows solar activity for the past1200 years, reconstructed based on 14C. Source: [4], [12].
average value of the secondary period, while the graph on the right gives us 116.25 years as the
average value of the secondary period. In the graph on the left we superimposed the left graph
from Figure 5 shown in blue, with its horizontally flipped image shown in red, and two green
curves, the one on the left is part of the blue curve, the one on the right is the horizontally
flipped image of the green curve on the left. The green curves are inserted to illustrate that the
period between the Sporer and Maunder Minima is actually two secondary solar cycles blended
together, as is the period between the Wolf and Oört Minima. According to [4], the Dome Fuji
record features a secondary peak between 1570 and 1600 AD, while [11] also predicts the existence
of a secondary maximum centered around year 1220 AD, thus confirming our hypothesis that
the periods between the Oort and Wolf Minima and between the Spörer and Maunder Minima
contain two rather than one secondary solar cycles merged together. Since both the arithmetic
and geometric means of 112.2727 and 116.25 are correspondingly 114.2527103 and 114.25271, both
the arithmetic and geometric means of the which are approximately 114.25271, we will take it
as average length of a secondary cycle. The 114.25271-year length of secondary solar cycles is
supported by [17] which discusses an evidence of the existence of 60-year (about half of 114.25271
years) long cycles in nature. The 114.25271-year length of the secondary solar cycle might also be
the reason why the Chinese Zodiac is comprised of 12 (about one tenth of 114.25271) years/signs
and why the Chinese time counting involves 60-year cycles. There are lots of periodic variations
affecting CRI, e.g periodic variations of the Earth’s axial tilt, of the Moon’s declination, of the
gravitational pull by other planets, etc.; they certainly should have been taken into account but
7
Figure 6: The blue curve in left graph is the same as in the left graph in Figure 5, the red curveis the horizontally flipped image of the blue curve; the green curve on the left is part of the bluecurve, the green curve on the right is the horizontally flipped image of the green curve on the left,the green curves are inserted to show that the period between the Dalton and Maunder Minimasolar cycles is actually two secondary solar cycles blended together, as is the period between theWolf and Oort Minima. Thus the left graph shows periodicity of about 1975−740
11 ≈ 112.2727years The graph on the right is the same as the graph on the right in Figure 5 with broken linesindicating activity that seemingly should have occurred but did not; the graphs shows periodicityof about 1950−1020
8 ≈ 116.25 years. The absence of the solar activity’s effect on Earth shown bythe dotted curves in the right graph is currently attributed to the changing strength of the Earth’sown magnetic field; however, the change in the strength of the Earth’s magnetic field itself mightbe due to the change in CRI, after all, cosmic rays is a current of electrically charged particleswhich generates a magnetic field that interacts with the currents of electrically charged liquid metalinside the Earth’s liquid core responsible for the Earth’s magnetic field.
had not been, without them the 114.25271-year length of the period should be viewed as a ’naive’
zero approximation.
There is currently no theory as to how solar cycles work, just some hypotheses. To help us
visualize how secondary cycles might be generated in the solar-cosmic ray interplay, let us think of
the Sun’s surface as a fluid at the boiling point, part of it is in gaseous form and the rest is in liquid
form. The surface is bombarded with fast moving (particles of) cosmic rays, which, upon hitting
the surface, do two things 1) increase the temperature of the gaseous part of the fluid above the
boiling point allowing more and more fluid’s particles to escape the Sun as solar wind; 2) change
part of the fluid from liquid into gaseous state. Some parts of the gaseous state revert back to liquid
while emitting energy in the form of solar irradiance. The process is similar to boiling water, with
sunspots and solar wind being correspondingly the analogues of bubbles and steam. The particles
of solar wind, moving much slower than cosmic rays, deflect the latter decreasing their number;
with fewer and fewer cosmic rays hitting the surface, the temperature drops, the sunspots become
fewer and fewer and the solar irradiance and wind gradually decrease. With less solar wind, more
8
and more cosmic rays hit the surface raising its temperature again and the cycle repeats itself. If,
for whatever reason, the intensity of cosmic rays drastically increases, the gaseous portion of the
fluid may steam out leaving it smaller than its average size; a more sizable portion of the energy
of the cosmic rays then goes to the heat of vaporization required to turn some of the liquid into
the gaseous state; the solar irradiance and solar wind decrease as do the sunspots numbers. We
shall call this phase of solar activity a steam-out period. Once more liquid is changed into gaseous
state, the solar output in the form of solar wind and solar irradiance increases, as does the number
of sunspots. The steam-out may occur over several cycles with the gaseous portion of the fluid
getting smaller and smaller with each consecutive cycle until it reaches its climax, from where the
size of the gaseous portion begins to increase again. Figures 5-6 indicate the steam-out period
between the Wolf and Maunder Minima, climaxing at the time of Spörer Minimum, it followed the
Medieval Maximum when large amount of the gaseous portion of the fluid must have evaporated
from the surface of the Sun. We would like to repeat that the current paragraph is not a scientific
theory or even a hypothesis, it is merely a way to help us visualize the solar-cosmic ray interplay;
a proper model must be taken into account not only thermodynamic but also electromagnetic
aspects of solar plasma as well as the motion of plasma within the Sun. Having said that, some
kind of phase transition in solar plasma in response to changes in cosmic rays flow is most likely
a large contributor to secondary, and possibly even primary, solar cycles.
The interaction of cosmic rays with the Earth is not just two-way but rather three-way: 1)
cosmic rays affect the Earth directly in a variety of ways; 2) cosmic rays affect the Earth indirectly
by affecting solar activity; 3) the changes in the Earth’s magnetic field, some due to the flow of
plasma in the liquid core also responsible for seismic activity on Earth, affect the cosmic ray flow
near Earth. Thus the correlations between CRI and seismic activity described in the next section
may have occurred through either one of these channels or a combination of either two or even all
three of them.
Where does the period of 114.25271 years come form? It is not clear; most likely, it is the
average period of motion of the source(s) of cosmic rays, or at least, an important component of
cosmic rays. The thought that a significant part of cosmic rays comes from a single source may
appear contrary to the observation of cosmic rays coming from all directions. Yet it is not. Just like
on a cloudy and foggy day the sunlight coming from the Sun appears to arrive from all directions
9
due to scattering by clouds and fog; cosmic rays coming from a single source may appear to be
coming from all directions due to scattering by interstellar and galactic gases, electromagnetic and
gravitational fields, and, in no small part, the solar wind. The presence of a small anisotropy in
cosmic rays flow is discussed in [1, 2]. If we are correct, then the events on Earth are strongly
influenced by events very far, perhaps thousands of light years, away.
§2. Cosmic rays and seismic activity on Earth.
Let us start by looking at earthquakes of magnitude > 7.8 since 1900, these are the most powerful
earthquakes, crème de la crème of natural disasters. The cut-off point 7.8 for the magnitude
was selected to have sufficiently many earthquakes to draw conclusions yet not too many to be
overwhelmed.
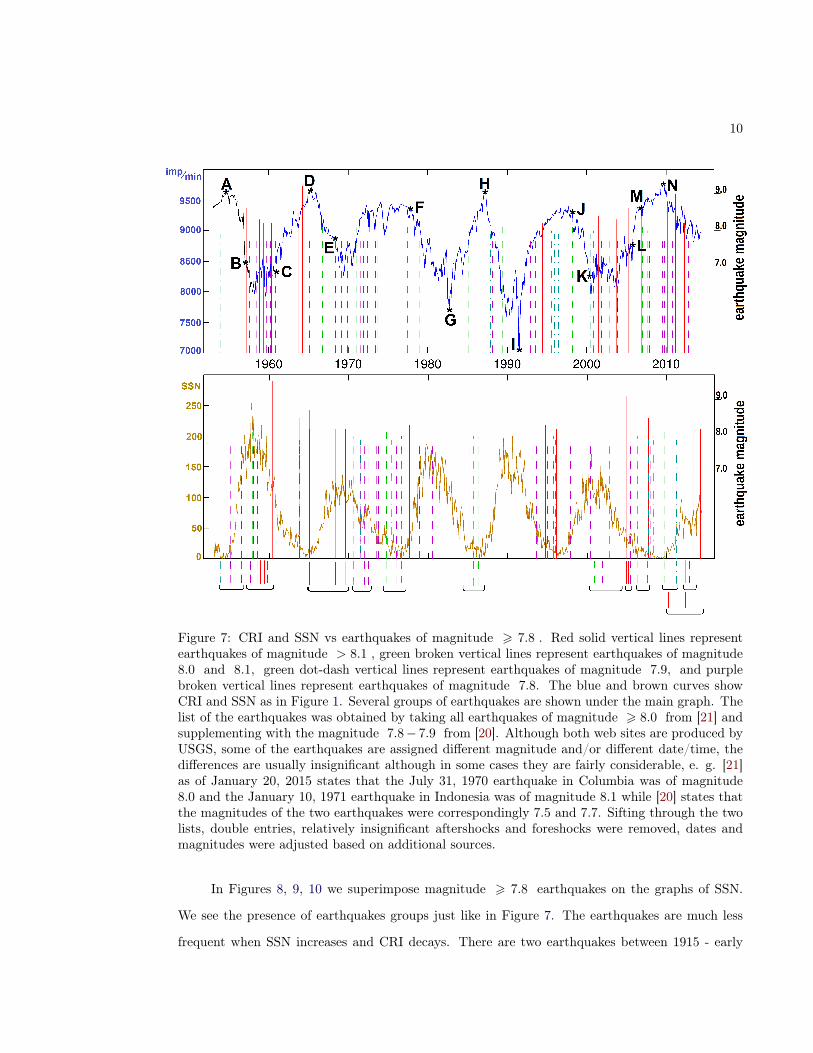
In Figure 7 earthquakes of magnitude > 7.8 from 1958 to 2010 are superimposed on the
graphs of CRI and SSN from Figure 1. One may notice that:
1. The powerful earthquakes are much less frequent when the CRI decreases sharply over a
prolonged period of time, i.e between A and B, D and E, F and G, H and I. There is only one
earthquake between D and E; there are only three earthquakes between F and G; there are only
three earthquakes between H and I. Even the short-lived decrease between points J and K saw
only one powerful earthquake.
3. Of the six CRI cycles, only two, between points C and E and between points H and I had
triangular shape, both cycles had a significantly smaller number of powerful earthquakes. The
average rate of change between points C and D, D and E, and H and I was larger than average.
4. The density of powerful earthquakes is the highest during time intervals when the average rate
of increase is relatively small, that is between points B and C, between points E and F, between
points K and L and past point N. Notice between points E and F the minimum almost instantly
turned to a maximum and past point N the maximum almost instantly turned to a minimum.
4. High magnitude earthquake often appear in almost periodic groups, the higher is the density of
earthquakes the more groups appear.
There are no reliable CRI records for the period 1900-1953, however there are reliable records
of SSN which may be used as a proxy for CRI while keeping in mind that CRI may lag SSN by
up to 18 months.
10
Figure 7: CRI and SSN vs earthquakes of magnitude > 7.8 . Red solid vertical lines representearthquakes of magnitude > 8.1 , green broken vertical lines represent earthquakes of magnitude8.0 and 8.1, green dot-dash vertical lines represent earthquakes of magnitude 7.9, and purplebroken vertical lines represent earthquakes of magnitude 7.8. The blue and brown curves showCRI and SSN as in Figure 1. Several groups of earthquakes are shown under the main graph. Thelist of the earthquakes was obtained by taking all earthquakes of magnitude > 8.0 from [21] andsupplementing with the magnitude 7.8− 7.9 from [20]. Although both web sites are produced byUSGS, some of the earthquakes are assigned different magnitude and/or different date/time, thedifferences are usually insignificant although in some cases they are fairly considerable, e. g. [21]as of January 20, 2015 states that the July 31, 1970 earthquake in Columbia was of magnitude8.0 and the January 10, 1971 earthquake in Indonesia was of magnitude 8.1 while [20] states thatthe magnitudes of the two earthquakes were correspondingly 7.5 and 7.7. Sifting through the twolists, double entries, relatively insignificant aftershocks and foreshocks were removed, dates andmagnitudes were adjusted based on additional sources.
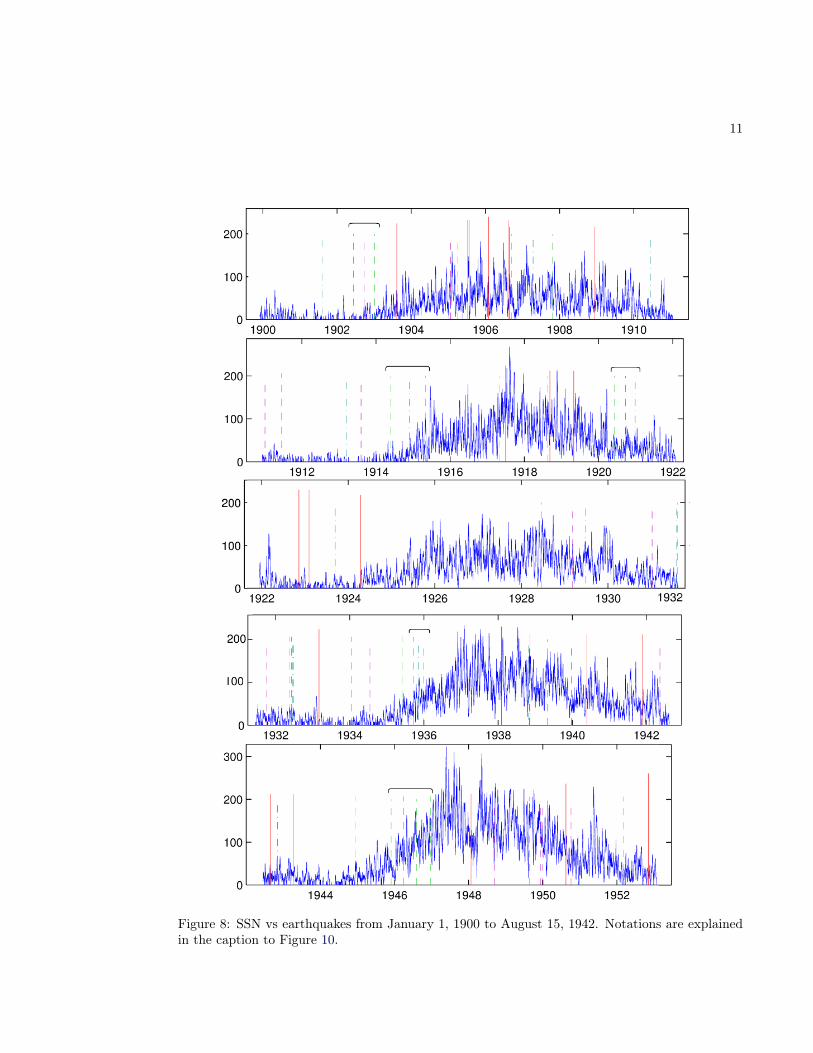
In Figures 8, 9, 10 we superimpose magnitude > 7.8 earthquakes on the graphs of SSN.
We see the presence of earthquakes groups just like in Figure 7. The earthquakes are much less
frequent when SSN increases and CRI decays. There are two earthquakes between 1915 - early
11
Figure 8: SSN vs earthquakes from January 1, 1900 to August 15, 1942. Notations are explainedin the caption to Figure 10.
12
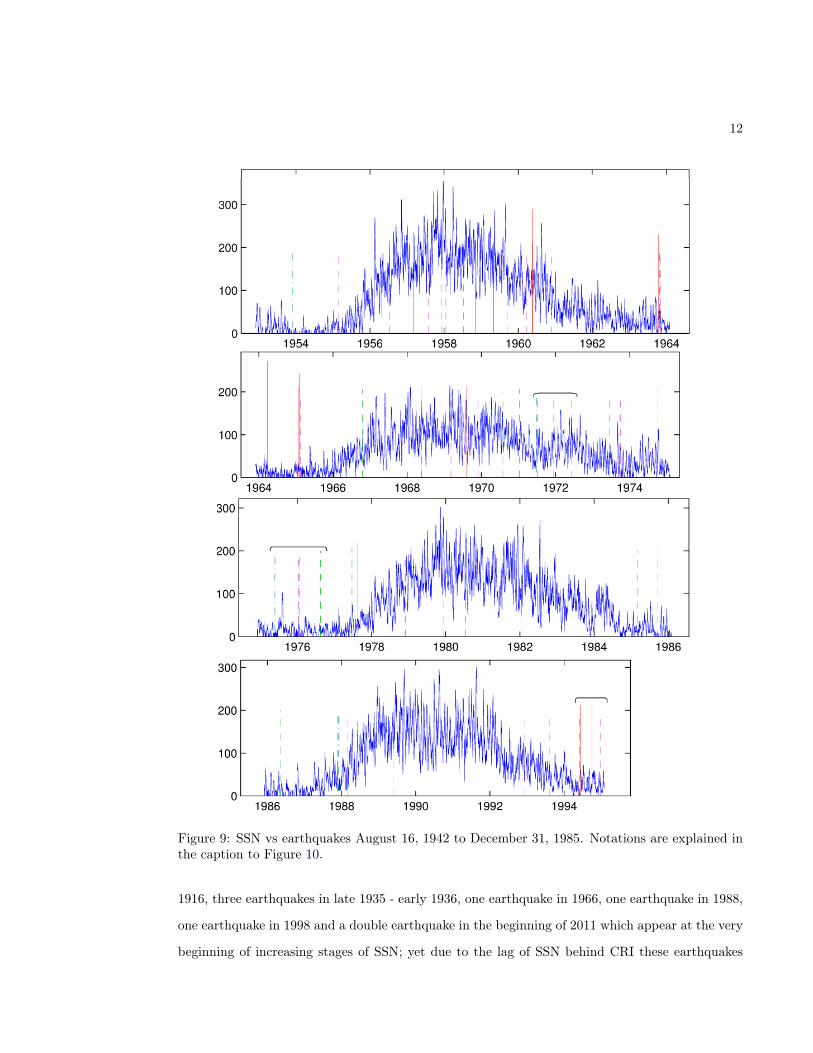
Figure 9: SSN vs earthquakes August 16, 1942 to December 31, 1985. Notations are explained inthe caption to Figure 10.
1916, three earthquakes in late 1935 - early 1936, one earthquake in 1966, one earthquake in 1988,
one earthquake in 1998 and a double earthquake in the beginning of 2011 which appear at the very
beginning of increasing stages of SSN; yet due to the lag of SSN behind CRI these earthquakes
13
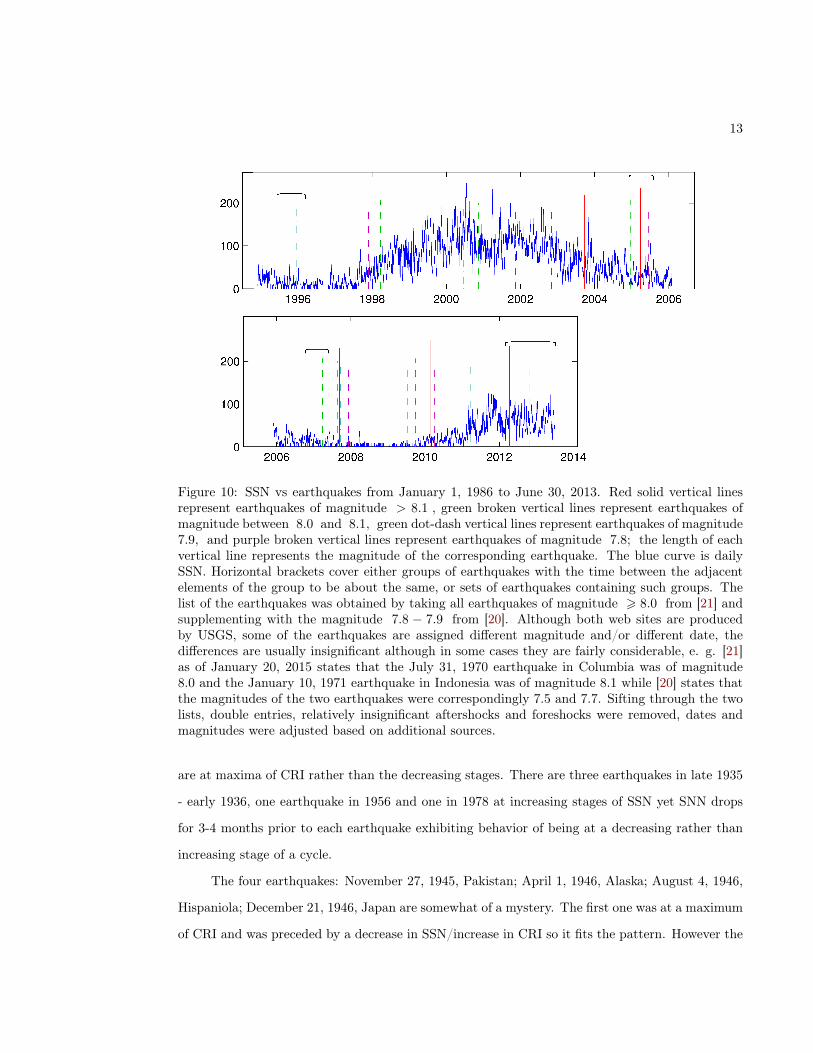
Figure 10: SSN vs earthquakes from January 1, 1986 to June 30, 2013. Red solid vertical linesrepresent earthquakes of magnitude > 8.1 , green broken vertical lines represent earthquakes ofmagnitude between 8.0 and 8.1, green dot-dash vertical lines represent earthquakes of magnitude7.9, and purple broken vertical lines represent earthquakes of magnitude 7.8; the length of eachvertical line represents the magnitude of the corresponding earthquake. The blue curve is dailySSN. Horizontal brackets cover either groups of earthquakes with the time between the adjacentelements of the group to be about the same, or sets of earthquakes containing such groups. Thelist of the earthquakes was obtained by taking all earthquakes of magnitude > 8.0 from [21] andsupplementing with the magnitude 7.8 − 7.9 from [20]. Although both web sites are producedby USGS, some of the earthquakes are assigned different magnitude and/or different date, thedifferences are usually insignificant although in some cases they are fairly considerable, e. g. [21]as of January 20, 2015 states that the July 31, 1970 earthquake in Columbia was of magnitude8.0 and the January 10, 1971 earthquake in Indonesia was of magnitude 8.1 while [20] states thatthe magnitudes of the two earthquakes were correspondingly 7.5 and 7.7. Sifting through the twolists, double entries, relatively insignificant aftershocks and foreshocks were removed, dates andmagnitudes were adjusted based on additional sources.
are at maxima of CRI rather than the decreasing stages. There are three earthquakes in late 1935
- early 1936, one earthquake in 1956 and one in 1978 at increasing stages of SSN yet SNN drops
for 3-4 months prior to each earthquake exhibiting behavior of being at a decreasing rather than
increasing stage of a cycle.
The four earthquakes: November 27, 1945, Pakistan; April 1, 1946, Alaska; August 4, 1946,
Hispaniola; December 21, 1946, Japan are somewhat of a mystery. The first one was at a maximum
of CRI and was preceded by a decrease in SSN/increase in CRI so it fits the pattern. However the
14
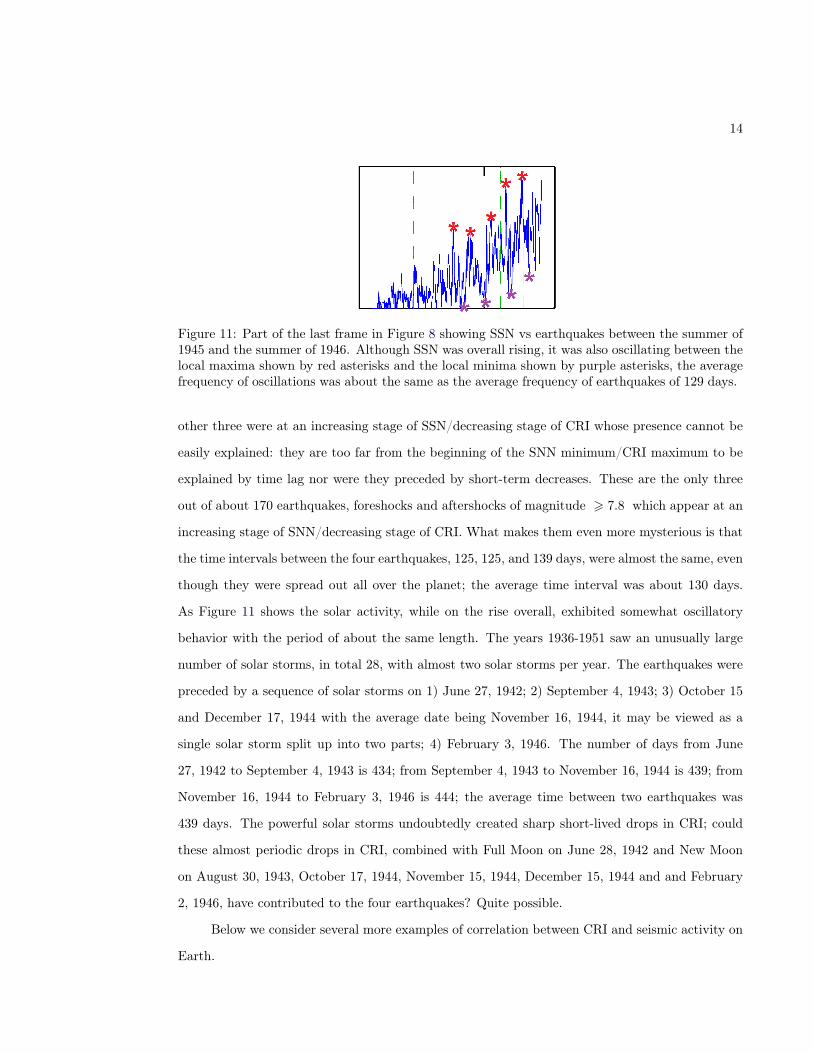
Figure 11: Part of the last frame in Figure 8 showing SSN vs earthquakes between the summer of1945 and the summer of 1946. Although SSN was overall rising, it was also oscillating between thelocal maxima shown by red asterisks and the local minima shown by purple asterisks, the averagefrequency of oscillations was about the same as the average frequency of earthquakes of 129 days.
other three were at an increasing stage of SSN/decreasing stage of CRI whose presence cannot be
easily explained: they are too far from the beginning of the SNN minimum/CRI maximum to be
explained by time lag nor were they preceded by short-term decreases. These are the only three
out of about 170 earthquakes, foreshocks and aftershocks of magnitude > 7.8 which appear at an
increasing stage of SNN/decreasing stage of CRI. What makes them even more mysterious is that
the time intervals between the four earthquakes, 125, 125, and 139 days, were almost the same, even
though they were spread out all over the planet; the average time interval was about 130 days.
As Figure 11 shows the solar activity, while on the rise overall, exhibited somewhat oscillatory
behavior with the period of about the same length. The years 1936-1951 saw an unusually large
number of solar storms, in total 28, with almost two solar storms per year. The earthquakes were
preceded by a sequence of solar storms on 1) June 27, 1942; 2) September 4, 1943; 3) October 15
and December 17, 1944 with the average date being November 16, 1944, it may be viewed as a
single solar storm split up into two parts; 4) February 3, 1946. The number of days from June
27, 1942 to September 4, 1943 is 434; from September 4, 1943 to November 16, 1944 is 439; from
November 16, 1944 to February 3, 1946 is 444; the average time between two earthquakes was
439 days. The powerful solar storms undoubtedly created sharp short-lived drops in CRI; could
these almost periodic drops in CRI, combined with Full Moon on June 28, 1942 and New Moon
on August 30, 1943, October 17, 1944, November 15, 1944, December 15, 1944 and and February
2, 1946, have contributed to the four earthquakes? Quite possible.
Below we consider several more examples of correlation between CRI and seismic activity on
Earth.
15
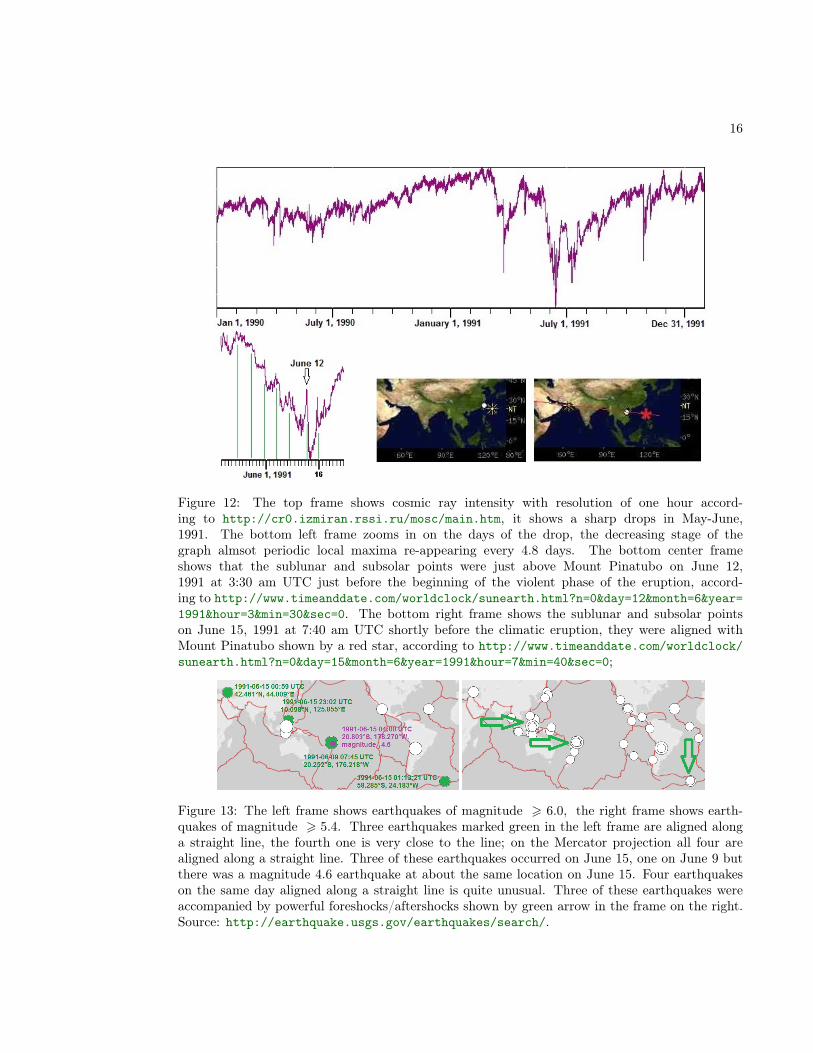
Example 1: three short-lived drastic drops in CRI. Figure 7 shows the drastic short-lived
drop in CRI in May 25 - June 23, 1991, its bottom on June 13, 1991 is marked by I. It coincided
with a cataclysmic eruption of Mount Pinatubo at 15.1417oN, 120.35oE in mid-June, 1991 after
500 years of dormancy, the second most powerful eruption of the 20th century; the violent phase of
the eruption started on June 12 and achieved its climax on June 15. The same day of June 15 saw
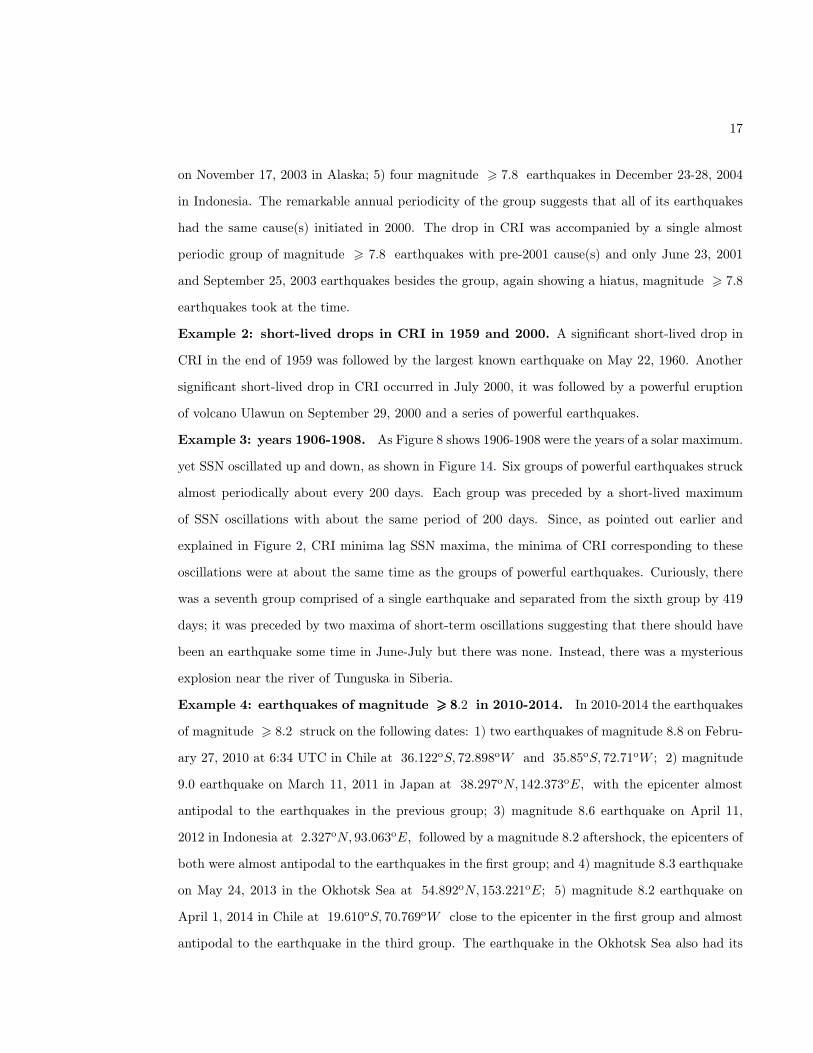
another remarkable event of four earthquakes along a single line, as shown in Figure 13. Just two
days earlier on June 13, CRI hit its lowest point ever, the Moon was New and at perigee. There
was a major solar storm on in the first week of June, 1991 and, according to [16], a major solar
flare on June 15, which, undoubtedly, contributed to the drop in CRI; yet the drop in CRI began
on May 24, more than a week prior to the solar activity and thus could not have resulted from solar
activity alone. Most likely, the drop in CRI contributed to the increase in solar activity which, in
turn, exacerbated the drop in CRI. The short-lived jump in CRI on June 12 shown in Figure 12
coincided with typhoon Yunya which developed from a mild tropical disturbance on the same day.
The events were preceded by smaller drop in CRI in March - April and a succession of earthquakes
in March 15 - April 2, 1991. Yet, as Figure 7 shows, there were no powerful earthquakes for a
considerable time period before and after the drop in CRI. A powerful magnitude 7.8 earthquake on
July 16, 1990 close to the site of Mount Pinatubo indicates that there was already seismic activity
in the region prior to the eruption, the drop in CRI, combined with the increased gravitational
pull due to New Moon, might have been the "last straw" leading to the eruption.
The second most drastic short-lived drop in CRI occurred in July 11-20, 1982, its bottom
is marked by G. preceded by a somewhat slower drop in CRI in May-June, 1982. It was only 1-2
months away from three powerful eruptions in March 29 - April 4 of volcano El Chichón in Mexico
at 17.36o, 93.23oW after about 600 years of dormancy, although there are some debates about an
eruption around 1850. As Figure 7 shows, again the drop in CRI was accompanied by a long-term
hiatus of powerful earthquakes.
The third largest drop in CRI was between October 27, 2003 and November 5, 2003, its
bottom is between K and L. It was amidst of a periodic group of earthquakes of magnitude > 7.8 3:
1) three earthquakes in November 16-17, 2000 in Papua New Guinea; 2) a double earthquake on
November 14, 2001 in China; 3) an earthquake on November 3, 2002 in Alaska; 4) an earthquake3USGS seems to have recently revised its data with some of these earthquakes’ magnitude changed a bit.
16
Figure 12: The top frame shows cosmic ray intensity with resolution of one hour accord-ing to http://cr0.izmiran.rssi.ru/mosc/main.htm, it shows a sharp drops in May-June,1991. The bottom left frame zooms in on the days of the drop, the decreasing stage of thegraph almsot periodic local maxima re-appearing every 4.8 days. The bottom center frameshows that the sublunar and subsolar points were just above Mount Pinatubo on June 12,1991 at 3:30 am UTC just before the beginning of the violent phase of the eruption, accord-ing to http://www.timeanddate.com/worldclock/sunearth.html?n=0&day=12&month=6&year=1991&hour=3&min=30&sec=0. The bottom right frame shows the sublunar and subsolar pointson June 15, 1991 at 7:40 am UTC shortly before the climatic eruption, they were aligned withMount Pinatubo shown by a red star, according to http://www.timeanddate.com/worldclock/sunearth.html?n=0&day=15&month=6&year=1991&hour=7&min=40&sec=0;
Figure 13: The left frame shows earthquakes of magnitude > 6.0, the right frame shows earth-quakes of magnitude > 5.4. Three earthquakes marked green in the left frame are aligned alonga straight line, the fourth one is very close to the line; on the Mercator projection all four arealigned along a straight line. Three of these earthquakes occurred on June 15, one on June 9 butthere was a magnitude 4.6 earthquake at about the same location on June 15. Four earthquakeson the same day aligned along a straight line is quite unusual. Three of these earthquakes wereaccompanied by powerful foreshocks/aftershocks shown by green arrow in the frame on the right.Source: http://earthquake.usgs.gov/earthquakes/search/.
17
on November 17, 2003 in Alaska; 5) four magnitude > 7.8 earthquakes in December 23-28, 2004
in Indonesia. The remarkable annual periodicity of the group suggests that all of its earthquakes
had the same cause(s) initiated in 2000. The drop in CRI was accompanied by a single almost
periodic group of magnitude > 7.8 earthquakes with pre-2001 cause(s) and only June 23, 2001
and September 25, 2003 earthquakes besides the group, again showing a hiatus, magnitude > 7.8
earthquakes took at the time.
Example 2: short-lived drops in CRI in 1959 and 2000. A significant short-lived drop in
CRI in the end of 1959 was followed by the largest known earthquake on May 22, 1960. Another
significant short-lived drop in CRI occurred in July 2000, it was followed by a powerful eruption
of volcano Ulawun on September 29, 2000 and a series of powerful earthquakes.
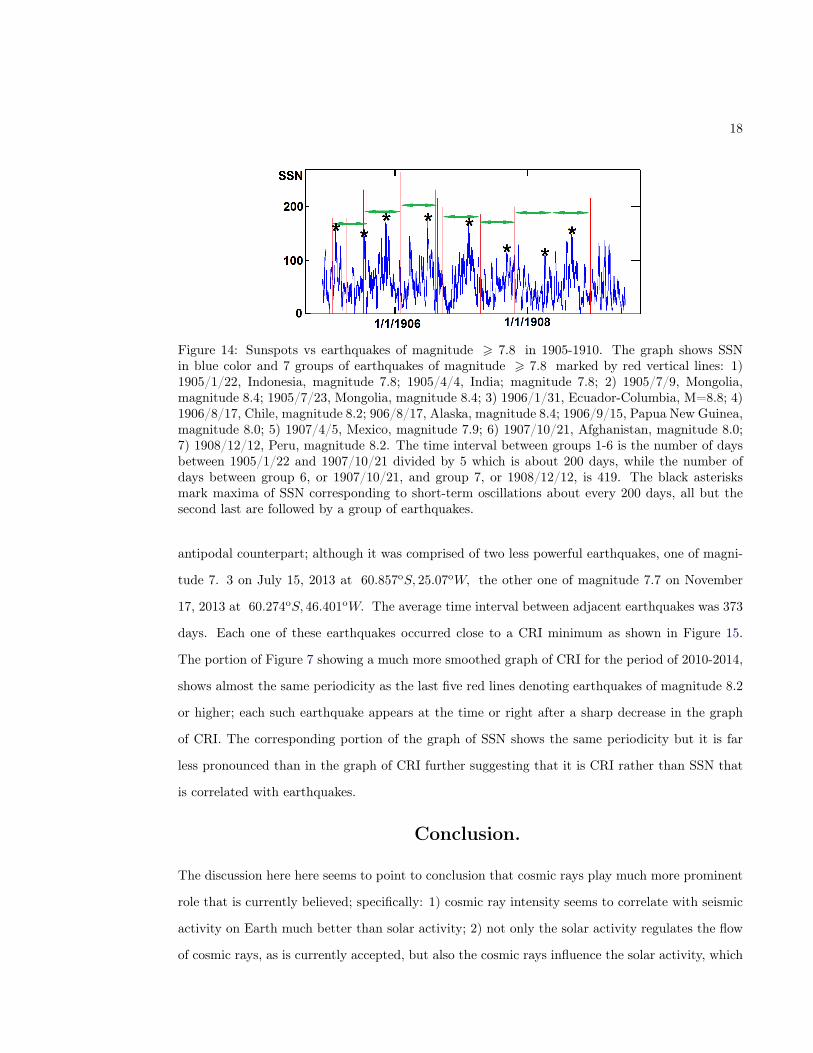
Example 3: years 1906-1908. As Figure 8 shows 1906-1908 were the years of a solar maximum.
yet SSN oscillated up and down, as shown in Figure 14. Six groups of powerful earthquakes struck
almost periodically about every 200 days. Each group was preceded by a short-lived maximum
of SSN oscillations with about the same period of 200 days. Since, as pointed out earlier and
explained in Figure 2, CRI minima lag SSN maxima, the minima of CRI corresponding to these
oscillations were at about the same time as the groups of powerful earthquakes. Curiously, there
was a seventh group comprised of a single earthquake and separated from the sixth group by 419
days; it was preceded by two maxima of short-term oscillations suggesting that there should have
been an earthquake some time in June-July but there was none. Instead, there was a mysterious
explosion near the river of Tunguska in Siberia.
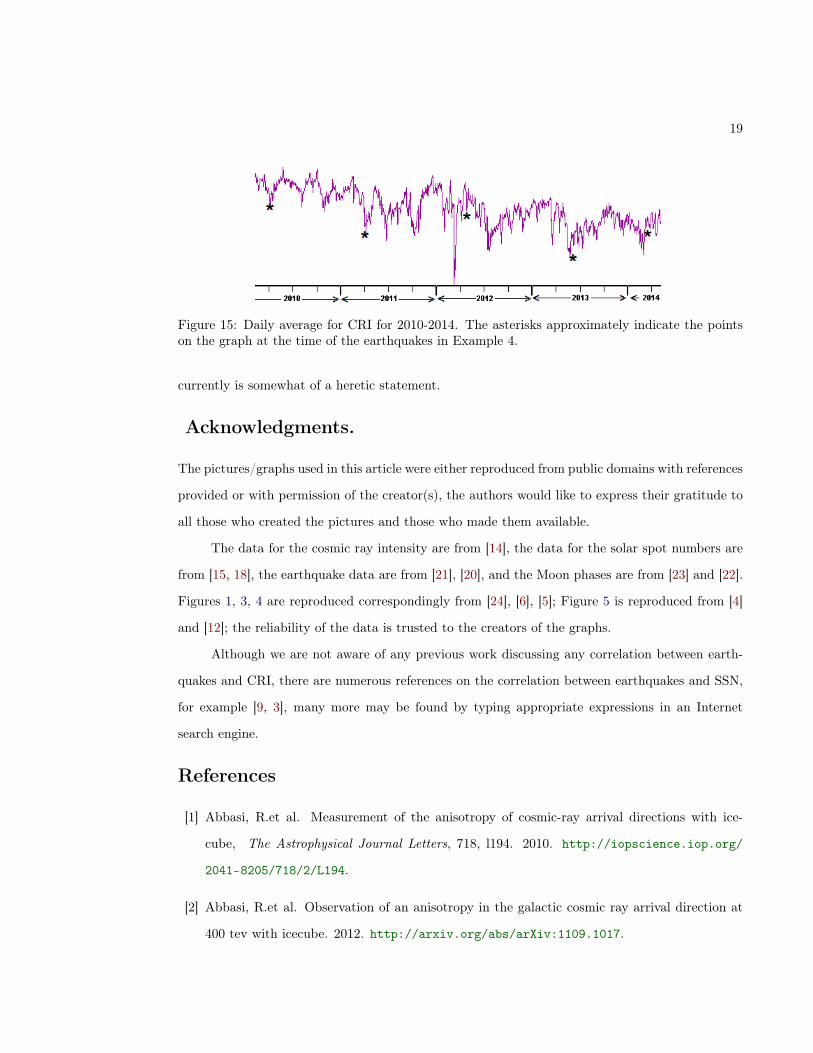
Example 4: earthquakes of magnitude >>> 888.2 in 2010-2014. In 2010-2014 the earthquakes
of magnitude > 8.2 struck on the following dates: 1) two earthquakes of magnitude 8.8 on Febru-
ary 27, 2010 at 6:34 UTC in Chile at 36.122oS, 72.898oW and 35.85oS, 72.71oW ; 2) magnitude
9.0 earthquake on March 11, 2011 in Japan at 38.297oN, 142.373oE, with the epicenter almost
antipodal to the earthquakes in the previous group; 3) magnitude 8.6 earthquake on April 11,
2012 in Indonesia at 2.327oN, 93.063oE, followed by a magnitude 8.2 aftershock, the epicenters of
both were almost antipodal to the earthquakes in the first group; and 4) magnitude 8.3 earthquake
on May 24, 2013 in the Okhotsk Sea at 54.892oN, 153.221oE; 5) magnitude 8.2 earthquake on
April 1, 2014 in Chile at 19.610oS, 70.769oW close to the epicenter in the first group and almost
antipodal to the earthquake in the third group. The earthquake in the Okhotsk Sea also had its
18
Figure 14: Sunspots vs earthquakes of magnitude > 7.8 in 1905-1910. The graph shows SSNin blue color and 7 groups of earthquakes of magnitude > 7.8 marked by red vertical lines: 1)1905/1/22, Indonesia, magnitude 7.8; 1905/4/4, India; magnitude 7.8; 2) 1905/7/9, Mongolia,magnitude 8.4; 1905/7/23, Mongolia, magnitude 8.4; 3) 1906/1/31, Ecuador-Columbia, M=8.8; 4)1906/8/17, Chile, magnitude 8.2; 906/8/17, Alaska, magnitude 8.4; 1906/9/15, Papua New Guinea,magnitude 8.0; 5) 1907/4/5, Mexico, magnitude 7.9; 6) 1907/10/21, Afghanistan, magnitude 8.0;7) 1908/12/12, Peru, magnitude 8.2. The time interval between groups 1-6 is the number of daysbetween 1905/1/22 and 1907/10/21 divided by 5 which is about 200 days, while the number ofdays between group 6, or 1907/10/21, and group 7, or 1908/12/12, is 419. The black asterisksmark maxima of SSN corresponding to short-term oscillations about every 200 days, all but thesecond last are followed by a group of earthquakes.
antipodal counterpart; although it was comprised of two less powerful earthquakes, one of magni-
tude 7. 3 on July 15, 2013 at 60.857oS, 25.07oW, the other one of magnitude 7.7 on November
17, 2013 at 60.274oS, 46.401oW. The average time interval between adjacent earthquakes was 373
days. Each one of these earthquakes occurred close to a CRI minimum as shown in Figure 15.
The portion of Figure 7 showing a much more smoothed graph of CRI for the period of 2010-2014,
shows almost the same periodicity as the last five red lines denoting earthquakes of magnitude 8.2
or higher; each such earthquake appears at the time or right after a sharp decrease in the graph
of CRI. The corresponding portion of the graph of SSN shows the same periodicity but it is far
less pronounced than in the graph of CRI further suggesting that it is CRI rather than SSN that
is correlated with earthquakes.
Conclusion.
The discussion here here seems to point to conclusion that cosmic rays play much more prominent
role that is currently believed; specifically: 1) cosmic ray intensity seems to correlate with seismic
activity on Earth much better than solar activity; 2) not only the solar activity regulates the flow
of cosmic rays, as is currently accepted, but also the cosmic rays influence the solar activity, which
19
Figure 15: Daily average for CRI for 2010-2014. The asterisks approximately indicate the pointson the graph at the time of the earthquakes in Example 4.
currently is somewhat of a heretic statement.
Acknowledgments.
The pictures/graphs used in this article were either reproduced from public domains with references
provided or with permission of the creator(s), the authors would like to express their gratitude to
all those who created the pictures and those who made them available.
The data for the cosmic ray intensity are from [14], the data for the solar spot numbers are
from [15, 18], the earthquake data are from [21], [20], and the Moon phases are from [23] and [22].
Figures 1, 3, 4 are reproduced correspondingly from [24], [6], [5]; Figure 5 is reproduced from [4]
and [12]; the reliability of the data is trusted to the creators of the graphs.
Although we are not aware of any previous work discussing any correlation between earth-
quakes and CRI, there are numerous references on the correlation between earthquakes and SSN,
for example [9, 3], many more may be found by typing appropriate expressions in an Internet
search engine.
References
[1] Abbasi, R.et al. Measurement of the anisotropy of cosmic-ray arrival directions with ice-
cube, The Astrophysical Journal Letters, 718, l194. 2010. http://iopscience.iop.org/
2041-8205/718/2/L194.
[2] Abbasi, R.et al. Observation of an anisotropy in the galactic cosmic ray arrival direction at
400 tev with icecube. 2012. http://arxiv.org/abs/arXiv:1109.1017.
20
[3] Anagnostopoulos, G., Papandreou, A. Space conditions during a month of a sequence of six
M>6.8 earthquakes ending with the tsunami of 26 December 2004, Natural Hazards and Earth
System Sciences,Vol. 12, pp. 1551-1559, doi:10.5194/nhess-12-1551-2012. 2012.
[4] Delaygue, G., Bard, E. An Antarctic view of Beryllium-10 and solar activity for the past
millennium, Climate Dynamics, Volume 36, Issue 11-12, pp. 2201-2218. 2011. The graph
itself is available from http://www.skepticalscience.com/print.php?n=395.
[5] Hathaway, D., and Wilson, R. Geomagnetic activity indicates large amplitude
for sunspot cycle 24, a slide. 2006. http://www.google.ca/url?sa=t&rct=j&q=
&esrc=s&source=web&cd=1&ved=0CB0QFjAA&url=http%3A%2F%2Fscience.nasa.gov%
2Fmedia%2Fmedialibrary%2F2006%2F12%2F21%2F21dec_cycle24_resources%2F2006AGU.
ppt&ei=sq3YVMKaOIiU8QX90YH4AQ&usg=AFQjCNHNWyIg-tz5R9yazyWdjHcFsriYMg&bvm=bv.
85464276,d.dGc.
[6] Hathaway, D., and Wilson, R. Geomagnetic activity indicates large amplitude for sunspot
cycle 24, Geophysical Research Letters, 33/11. 2006. Review of the article is provided in
http://science.nasa.gov/science-news/science-at-nasa/2006/21dec_cycle24/.
[7] Hathaway, D., Wilson, R. Recent geomagnetic activity indicates small amplitude for sun-spot
cycle 24. Preprint, 2009.
[8] Hathaway, D., Wilson, R., Reichmann, E. A synthesis of solar cycle prediction techniques.
Journal of Geophysical Research, 104/A10, pp. 22375-22388, 1999.
[9] Huzaimy, J., and Yumoto, K. Possible correlation between solar activity and global seismic-
ity,Proceedings of 2011 IEEE International Conference on Space Science and Communica-
tions, Penang, Malaysia, pp. 138 - 141. 2011.
[10] Love, J., Thomas, J.,. Insignificant solar-terrestrial triggering of earthquakes. Geophysical
Research Letters, Vol. 40/6, pp. 1165-1170, 2013.
[11] McCracken, K., McDonald, F., Beer, J., Raisbeck, G., Yiou, F. A phenomenological study of
the long term cosmic ray modulation, 850-1958 AD. Journal of Geophysical Research: Space
Physics, 109/A12, 2004.
21
[12] McInnes, L. Solar activity events in 14C . As of 2014. http://en.wikipedia.org/wiki/
File:Carbon14_with_activity_labels.svg.
[13] NASA. Solar Cycle Prediction. As of 2014. http://solarscience.msfc.nasa.gov/
predict.shtml .
[14] NOAA’s National Geophysical Data Center (NGDC). Cosmic Ray Intensity Data. As of
2014. ftp://ftp.ngdc.noaa.gov/STP/SOLAR_DATA/COSMIC_RAYS/, folder "Monthly_Data",
file "moscow.tab" .
[15] NOAA’s National Geophysical Data Center (NGDC). Sunspot numbers. As
of 2014. ftp://ftp.ngdc.noaa.gov/STP/space-weather/solar-data/solar-indices/
sunspot-numbers/international/ .
[16] Rastogi, R.,Pathan,B., Rao,D., Sastry, S.,Sastri, J. Solar flare effects on the geomagnetic
elements during normal and counter electrojet periods. Earth, Planets, Space; Vol. 5, pp.
947-957, 1999.
[17] Scafetta, N. Empirical evidence for a celestial origin of the climate oscillations. Journal of
Atmospheric and Solar-Terrestrial Physics, 72, pp. 951-970, 2010.
[18] SILSO data/image, Royal Observatory of Belgium, Brussels. Sunspot numbers. As of 2014.
http://www.sidc.be/silso/datafiles .
[19] Toshikazu Ebisuzakia, Hiroko Miyaharab, Ryuho Kataokaa, Tatsuhiko Satoc, Yasuhiro
Ishimined. Explosive volcanic eruptions triggered by cosmic rays: Volcano as a bubble cham-
ber. Gondwana Research, vol. 19/4, pp. 1054-1061, 2011.
[20] US Geological Survey. Earthquake Archive Search and URL Builder. 2013. http:
//earthquake.usgs.gov/earthquakes/search/.
[21] US Geological Survey. Magnitude 8 and Greater Earthquakes Since 1900. As of
2014. http://earthquake.usgs.gov/earthquakes/eqarchives/year/mag8/magnitude8_
1900_date.php.

22
[22] Web site. Lunar Perigee and Apogee Calculator. 0000. This web site is preferred for de-
termining perigee and apogee and is used for this purpose throughout the article. http:
//www.fourmilab.ch/earthview/pacalc.html.
[23] Web site. Moon Phases. 0000. This web site is preferred for determining Moon phases and is
used for this purpose throughout the article. To obtain the dates of the full and new Moon in a
given month in a certain year, go to the website and replace "2000" with the year needed, and
"january" with the month needed. http://www.calendar-12.com/moon_calendar/2000/
january.
[24] Website. Solar activity. As of 2014. http://www.climate4you.com/Sun.htm.