Embed Size (px)
Citation preview
On the Political Economy of Felon Disenfranchisement
Arpita GhoshUniversity of Leicester
James RockeyUniversity of Leicester
7th February 2019
Abstract: Nearly 6.1 million U.S. citizens are politically disenfranchised because of a priorfelony conviction, and these citizens tend disproportionately to be black. Specifically,more than 7.4% of the adult African-American population is disenfranchised comparedto 1.8% of other Americans. This paper investigates the political consequences of thislarge racial disparity in disenfranchisement rates. To obtain the first causal estimates ofthe effects of felon disenfranchisement (FD), we build a new database that catalogs theannual state changes in disenfranchisement law. We show that these changes are drivenby lengthy, uncertain, and complicated court cases which are outside of the control ofindividual state legislatures. We use a difference in difference strategy to analyze theimpact of these changes in felon disenfranchisement laws. Our results suggest that FDlegislation is associated with a 3 percentage point reduction in the likelihood of voting,allowing for a range of race-specific effects of demographic and geographic characteristics.This number is larger than would be implied purely by the mechanical effect due to thechange in the number of eligible voters suggesting that FD also reduces turnout amongstthose eligible to vote. Next, we show that relaxations in FD laws increase the number ofBlack U.S. Representatives. Finally, we show that relaxations also lead to an increase instate policy liberalism.Keywords: Felon Disenfranchisement, Elections, RaceJEL-Codes: D72, H7, J15, K16
Ghosh: [email protected], Rockey: [email protected]
Introduction
Nearly 6.1 million U.S. citizens are politically disenfranchised because of a prior felonyconviction, and these citizens tend disproportionately to be black.1 Specifically, more than7.4% of the adult African-American population is disenfranchised compared to 1.8% ofother Americans (Bureau of Justice Statistics, 2014). This paper investigates the politicalconsequences of felon disenfranchisement (henceforth, FD) laws in light of this large racialdisparity in disenfranchisement rates. We show that such laws reduce turnout by African-Americans, reduce the number of Black representatives, and shift implemented policies tothe right.
We do this in three ways, designed to capture the three aspects of democracy Lincolnhighlighted in the Gettysberg Address; “government of the people”, “government by thepeople”, and “government for the people”. Firstly, we study how FD affects engagementwith the political process and specifically the turnout rates of Blacks and non-Blacks. Weshow that restoring the vote to those previously convicted of a Felony (but who havecompleted their sentence) increases the percentage of African-Americans voting by around6%. This is a substantial number as it implies that the increase in the number of African-Americans voting is almost equal to the increase in the franchise. Given, turnout ratesamongst those most likely to be convicted of a felony are normally around half of that in theoverall population, this is particularly surprising. We argue, and provide evidence that thissuggests, in line with the argument of Burch (2013) that FD has an affect on engagementwith the political process beyond the mechanical affect on the franchise.
Secondly, in the spirit of “of the people” we study whether FD affects the racialcomposition of the set of elected representatives. That is, does FD limit the numberof Black politicians? We find, analyzing elections to the US house that FD limits the numberof Black representatives.
Third, in a competitive democracy, changes in the franchise ought to affect theequilibrium policy as long as people are not disenfranchised entirely at random. Theremainder of the paper thus shows how changes in FD laws alters the implemented statepolicy.
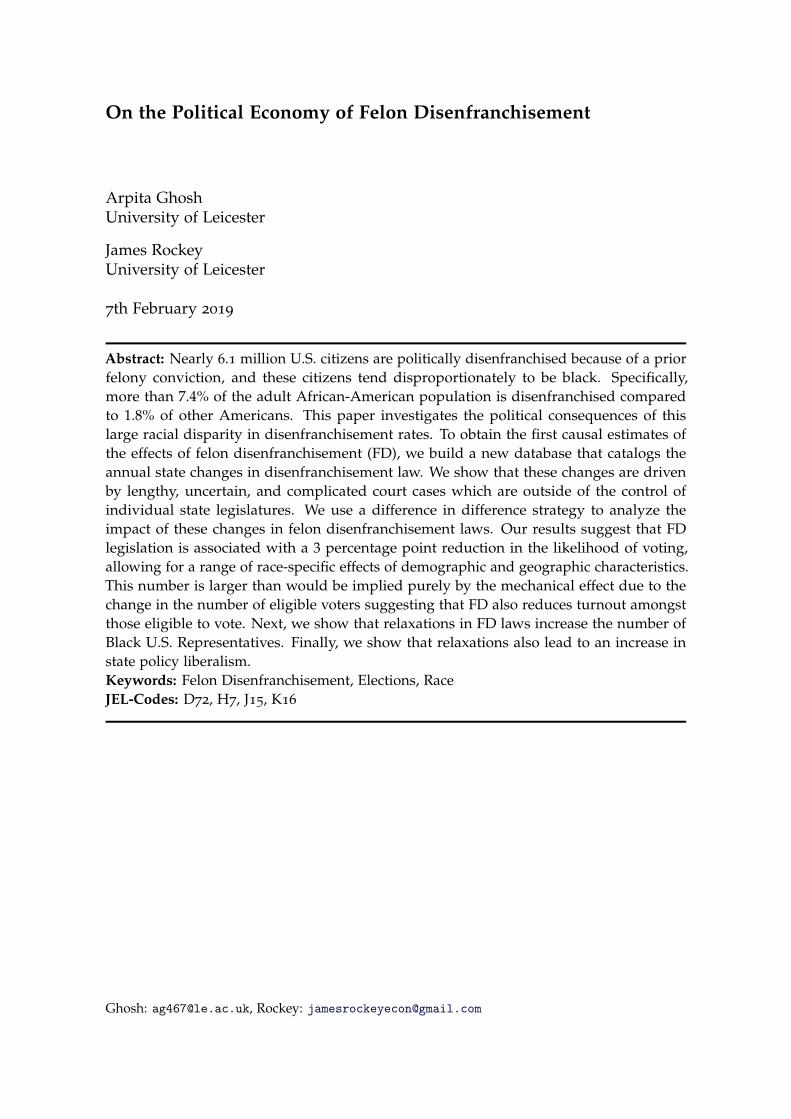
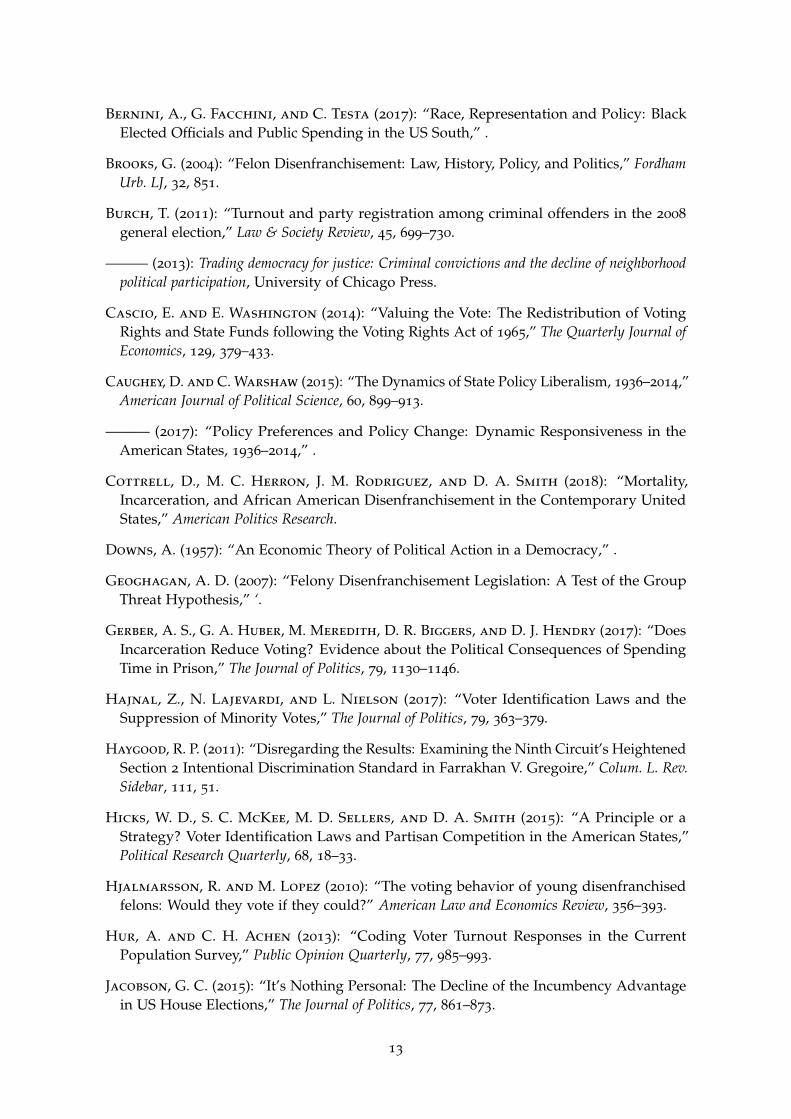
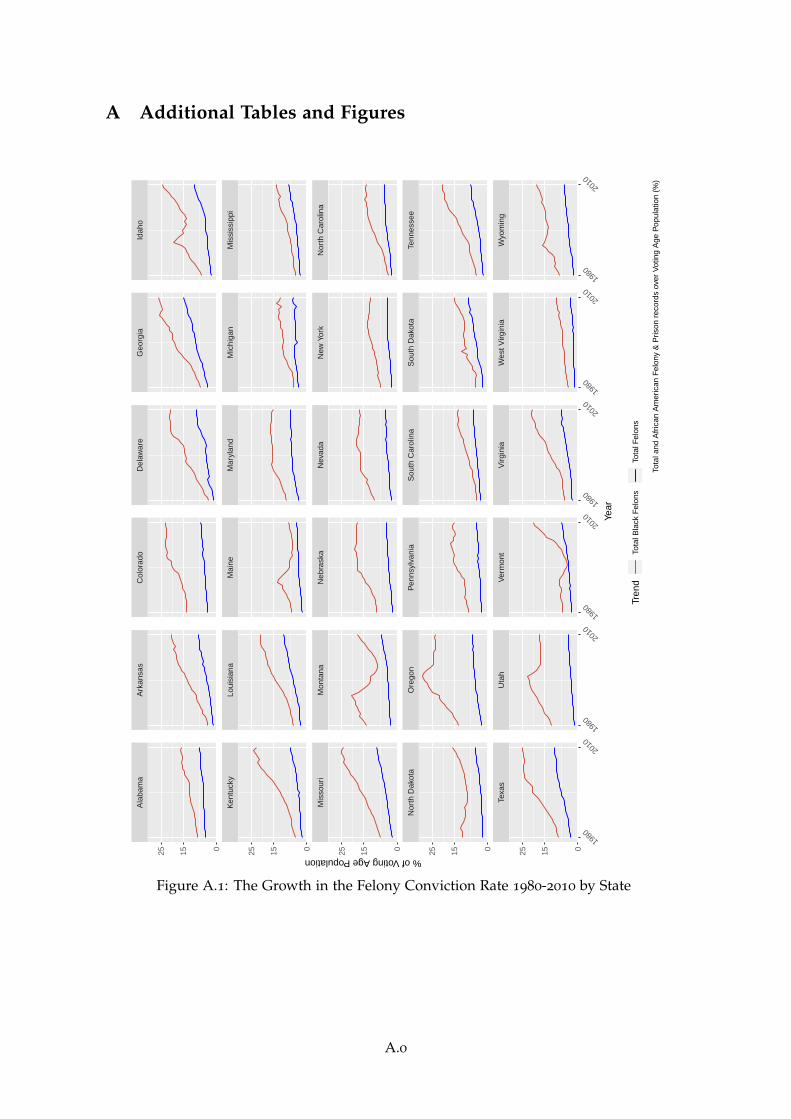
FD has a long history in the US, Kentucky introduced the first criminal disenfran-chisement laws in 1792, and have been a feature of US Politics ever since.2 Behrenset al. (2003) argue that expansion of such laws was a response to the passage of the 14thAmendment. Yet, the impact of these restrictions was limited by the relatively low rate offelony convictions. However, as Figure 1 shows this has grown substantially in the last 40
years, the period we study. Moreover, as can be seen in the figure, this growth has beendisproportionately concentrated on African-Americans. These changes have coincided withsubstantial changes to FD laws, with states both imposing news restrictions and in othercases eliminating existing ones. Thus, at the state level, there have been substantial changesin the racial composition of the enfranchised population due to the combination of thegrowth in incarceration rates and changes in FD laws.
This paper studies the political consequences of these changes and as such builds ontwo prominent bodies of work, legal, political, and sociological scholarship on FD andresearch in Economics studying the political and economic causal effects of the VotingRights Act and other changes in vote suppression.
An important literature in political science and sociology has studied the causes
1Uggen, Larson, and Shannon (2016).2See Keyssar (2000), a full history is provided in Appendix B.
1
of FD (Behrens et al., 2003, Manza and Uggen, 2008). Others have highlighted thedisproportionate consequences for African-American communities (Alexander, 2012, Benteleand O’brien, 2013) and traced the complex and subtle channels through which FDdamages Black political empowerment and engagement beyond its mechanical effecton the franchise (Burch, 2013). These findings of this more recent research is in contrastto prior findings by Economists and others that argued that since turnout rates are lowamong those most likely to be convicted of crimes the aggregate effects of FD should belimited (see, Hjalmarsson and Lopez, 2010). One reason for this highlighted by Burch(2013) and Cottrell et al. (2018) is that the geographic distribution of disenfranchisementis extremely uneven. Cottrell et al. (2018) show that even though at the national levelAfrican-Americans are disenfranchised at the rate of 13.2%, in some legislative districtsthey are disenfranchised at the rate of 20% to 40% as voting is primarily a local activity.Other recent research (Gerber et al., 2017) uses administrative data for Pennsylvania todisentangle the effects of incarceration per se on voting and the demographic characteristicsof those incarcerated. Meredith and Morse (2017), using data for Alabama, show that thecommon requirement that ex-felons pay outstanding financial obligations, particularly finesand fees, before they are re-enfranchised serves to limit re-enfranchisement.
Much of this work emphasises the role of mass incarceration in driving the growth of FD.Temin (2017) attempts to synthesize recent insights and scholarship from Law, Criminology,and Economics research using a simple model. He shows that the non-linear relationshipbetween crime and incarceration suggested by these books predicts multiple equilibriaand characterizes the growth in incarceration as the convergence from a low- to a high-incarceration equilibrium. He attributes this, in part, and particularly the concentrationof the effects of this change on Black communities, to Nixon’s Southern Strategy and theAbuse of Drugs Act (1986). This uneven impact and growth is documented by Shannon et al.(2017).
Our analysis of how changes in the franchise affect political outcomes is closely related tothe important literature studying the consequences of the 1965 Voting Rights Act (henceforth,VRA), particularly Cascio and Washington (2014). They use a triple differences design thatshows that in counties where the VRA led to the removal of voter literacy requirements ledto increases in Black turnout, and state transfers. This is relevant for this paper as it providedirect evidence of how disenfranchisement impacts policy and consequently incomes andpoverty. Thus, the removal of the ballot due to FD may be expected to have similaroutcomes. The high stakes nature of this racial politics is made clear by Washington (2006)who shows that a Black (Democratic) candidate increases both White and Black turnout andshe concludes that fear of the (presumably liberal) policies of the Black candidate motivatesWhite turnout in opposition. In light of this Bernini et al. (2017) highlight that anotherimportant consequence of the VRA was to increase the number of Black representativesand that this increased the provision of local public goods. The only other paper we areaware of that studies the political consequences of FD is Klumpp et al. (2017) who assessthe consequences of FD by asking whether the identity of the US House majority partywould have been altered by eliminating FD, finding the answer to be negative. The aim ofthis paper is to assess a broader range of political and economic outcomes following Cascioand Washington (2014) and Burch (2013) amongst others.
Other recent work has studied other forms of vote suppression. Hajnal et al. (2017) showthat recent increases in voter identification requirements have tended to differentially affectminority groups and ‘skew democracy towards those on the political right’. Hicks et al. (2015)argue that such requirements tend to be introduced by Republicans-controlled legislatures
2
in electorally competitive states.This paper is organized as follows. The next section explains the institutional
background and our data. Section 3 outlines our empirical approach and presents resultsfor how FD affects turnout. Sections 4 and 5 then provide results for how FD impacts thenumber of Black representatives and state policy. Section 6 briefly concludes.
2 Institutional Background and Data
2.1 An Overview of Felon Disenfranchisement
In this section we provide more detail about FD, the different forms of disenfranchisement,and the process through which these laws have previously changed and how this underpinsour identification strategy.
FD is a departure from universal suffrage and incarnates a view that those who havecommitted serious crimes are, for one reason or another, unworthy of the vote. Thereasoning behind disenfranchising the felons who have already served their sentences hasincluded a range of rationales from philosophical and legal arguments to more emotiveappeals such as preserving “the purity of the ballot box” (Washington v. State, 75 Ala. 582,585 (1884)).3
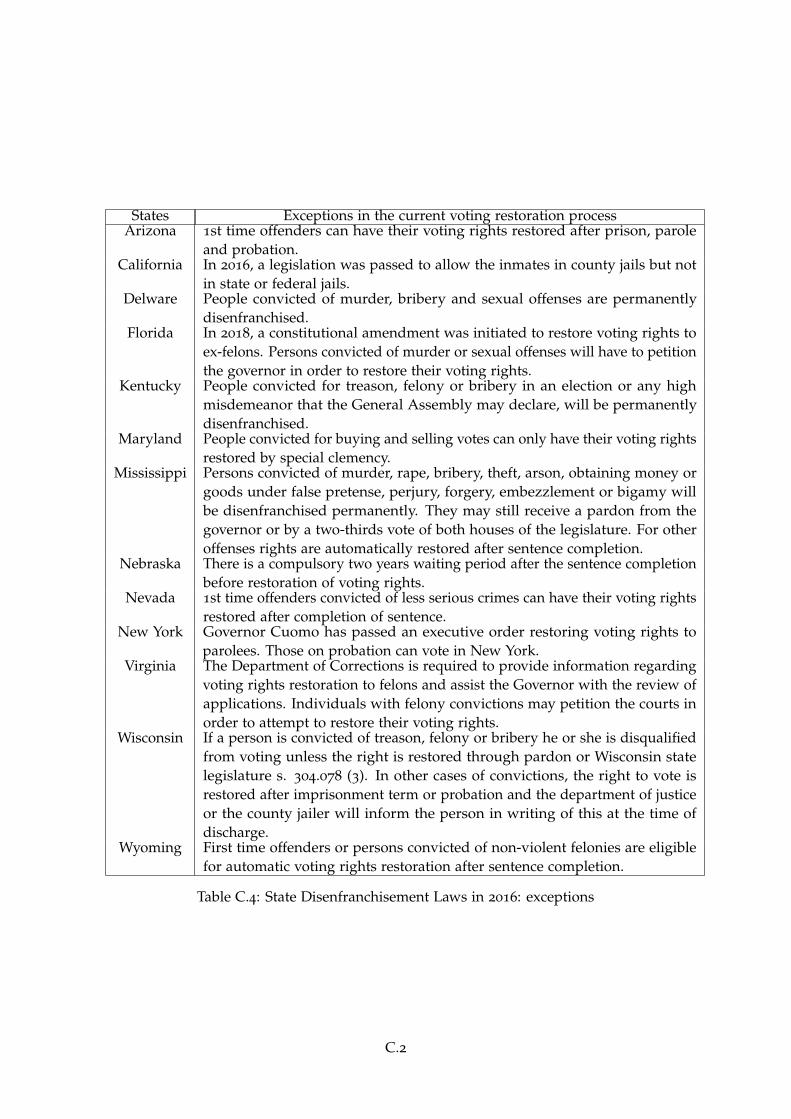
In practice it refers to a spectrum of voting restrictions. At one end is the withdrawalof the franchise from all those currently or ever convicted of a felony. At the other, isthe absence of any restrictions on either those currently serving a sentence or those whohave previously done so. Vermont and Maine are the only two states without restrictionsas of 2016, while around ten states only re-enfranchise convicted felons in exceptionalcircumstances, if at all, through the granting of special clemency following an individualappeal.4 Most states are between these two extremes. The key respect in which they differis how the vote may be re-obtained. Namely, whether the process is automatic or requires aspecial application. There are then two further dimensions of difference. One is the timingof the restoration of the vote. That is, whether felons are eligible to be re-enfranchised oncethey are no-longer incarcerated, or if the vote may only be restored after Prison, Parole, andProbation have all been completed. The second concerns whether a felon is required tosettle outstanding debts and court fines before they maybe re-enfranchised. This is oftenat least burdensome if not infeasible, and can limit re-enfranchisement (see, Meredith andMorse, 2017).
The substantial growth in the number of those convicted of felonies shown in Figure 1,and of those incarcerated, has transformed this from what might have been once seen as alegal and constitutional nicety to an important practical determinant of the extent of thefranchise. On the other hand, from a practical perspective, some have argued that low ratesof political engagement and turnout amongst ex-felons mean that the consequences aremore limited than a focus on headcount might suggest. Hjalmarsson and Lopez (2010)analyze two national surveys and find that criminals and non-criminals have significantly
3The purpose of this paper is to offer a positive analysis of the consequences of FD, and thus we do not askwhether FD is ‘right’. But, there is a very large sociological and legal literature which offers more normativeperspectives. This has taken a variety of approaches including constitutional law (Karlan, 2003, Haygood, 2011),social contract theory (Schall, 2006, Brooks, 2004), group threat theories (Geoghagan, 2007, Behrens et al., 2003),and theories of political party affiliations (Meredith and Morse, 2014, Klumpp et al., 2017), etc.
4These commonly have to be made to the governor, but the details vary from state to state. For example, inArizona a Judge may grant re-enfranchisement, and in Alabama appeals are made to the Board of Pardons andParoles.
3
different voter registration and turn out rates, only 26% of ever incarcerated criminals havevoted in 2004 Presidential elections. Burch (2011) estimates the voter registration, turnout,and party registration in the 2008 general election for men with felony convictions in Florida,Georgia, Michigan, Missouri, and North Carolina. They find, similarly to Hjalmarsson andLopez (2010), an average rate of 22.2%. People captured and convicted for their first offenseafter the election voted at similarly low rates.
Yet, Burch (2013) inter alia has argued that such a static analysis ignores the spillovereffects of concentrations of disenfranchisement and documents how these in terms ofdiminished local community political activity and engagement. Thus, changes in FD lawsmay be expected to have an effect beyond any direct computation of the change in thefranchise multiplied by the average propensity to vote of those re-enfranchised.
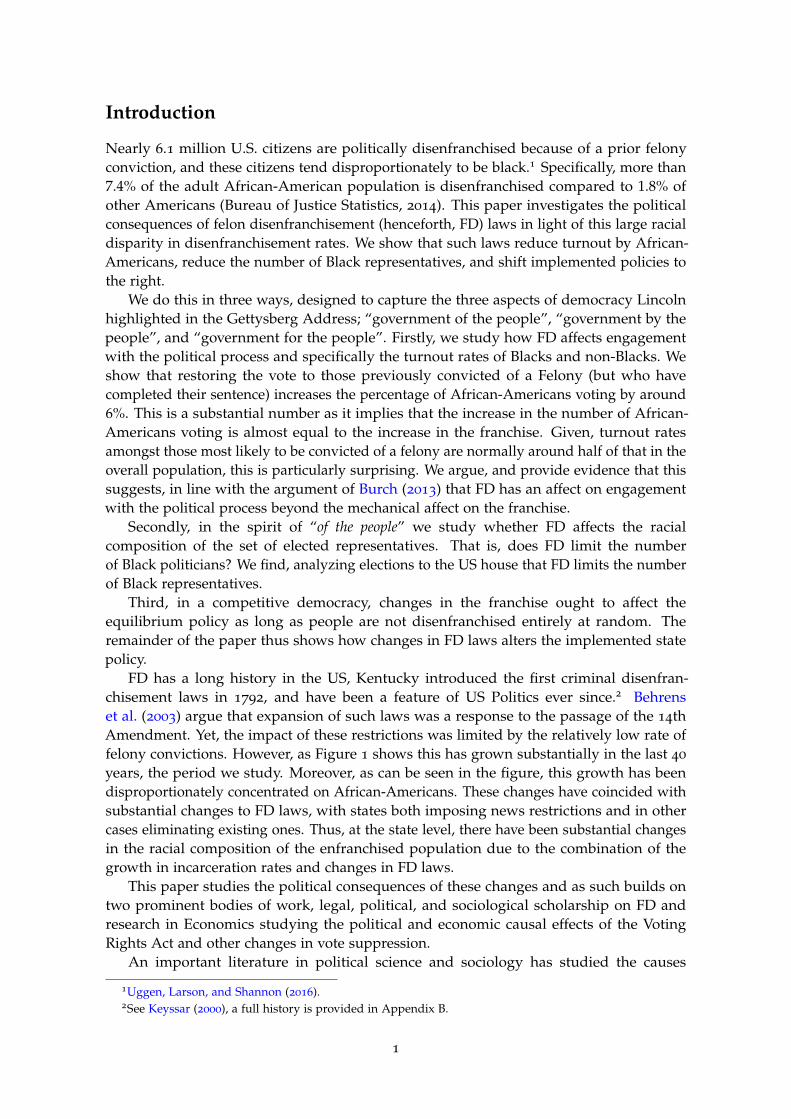
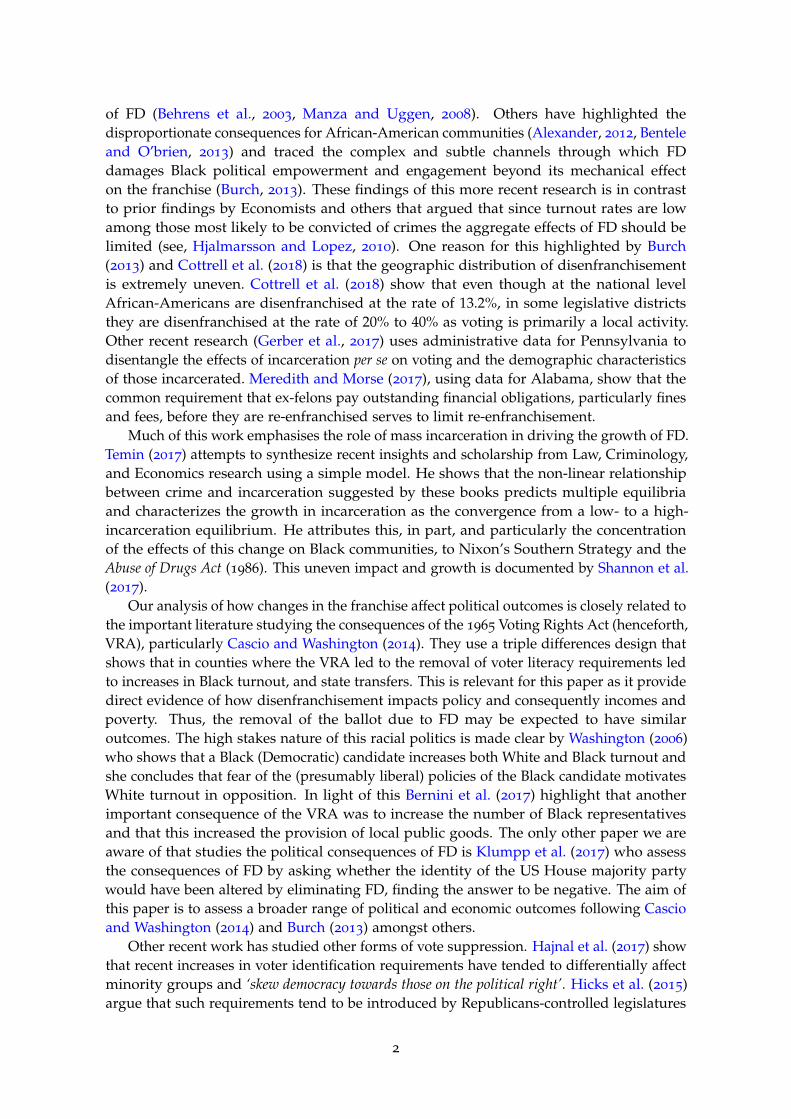
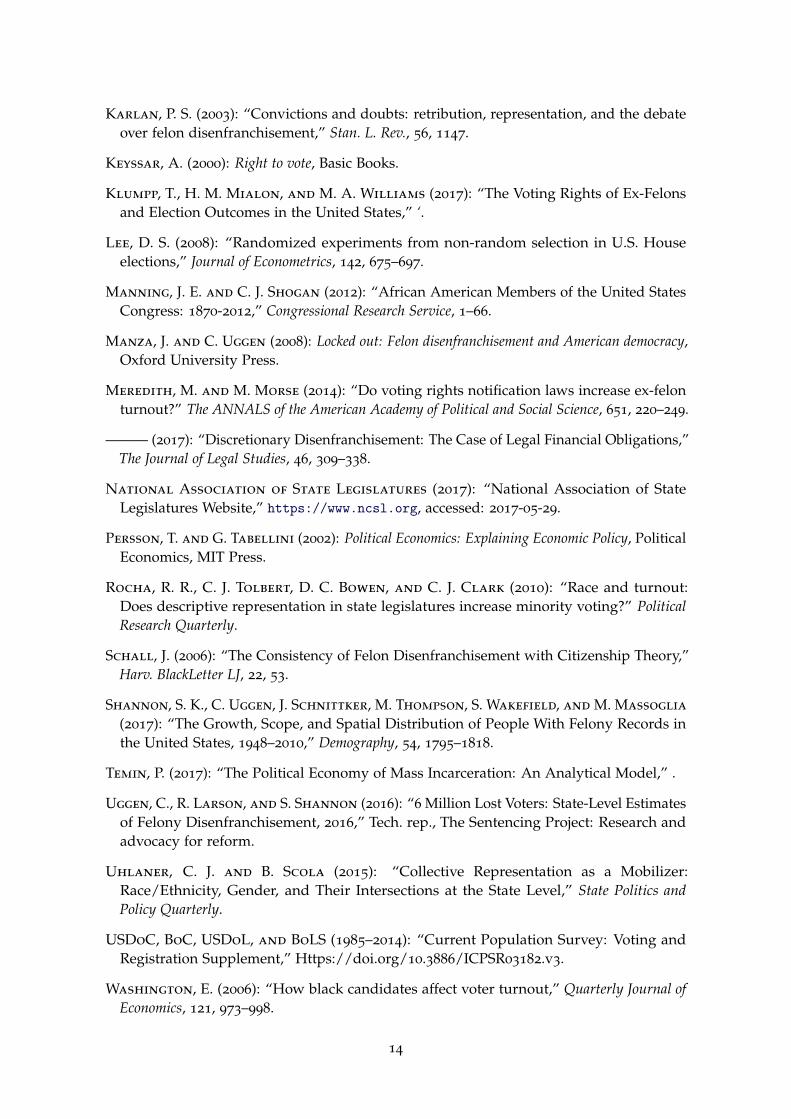
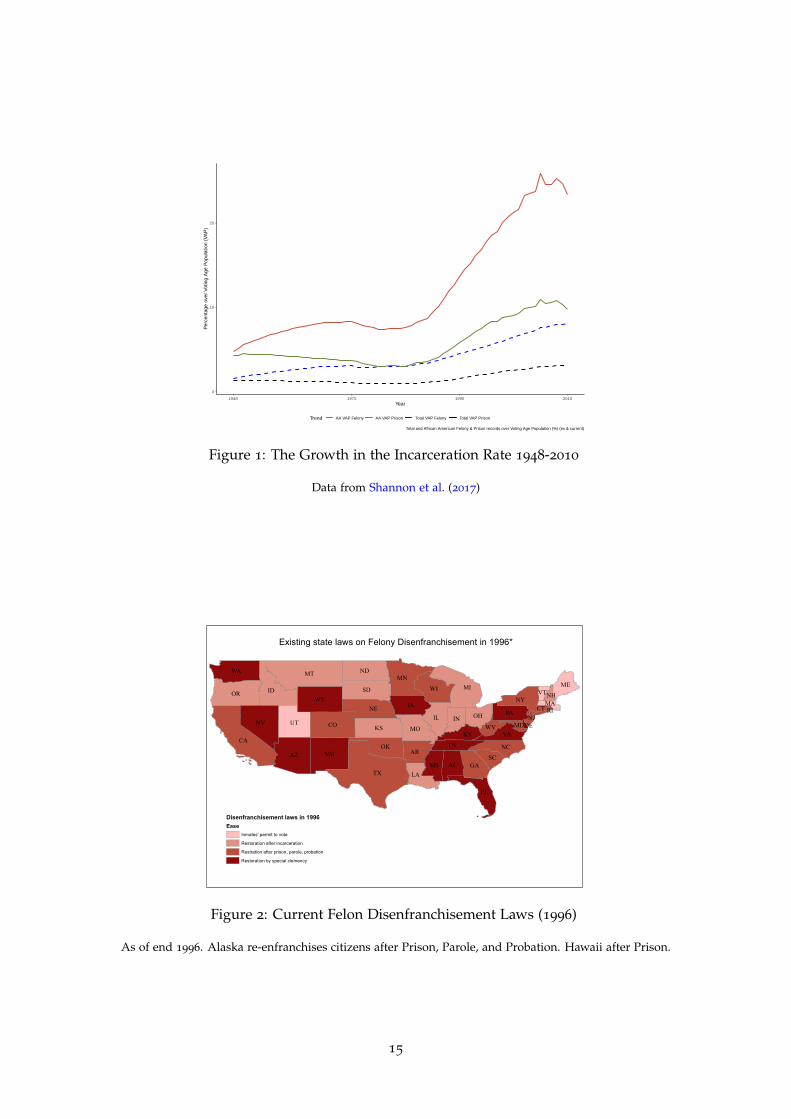
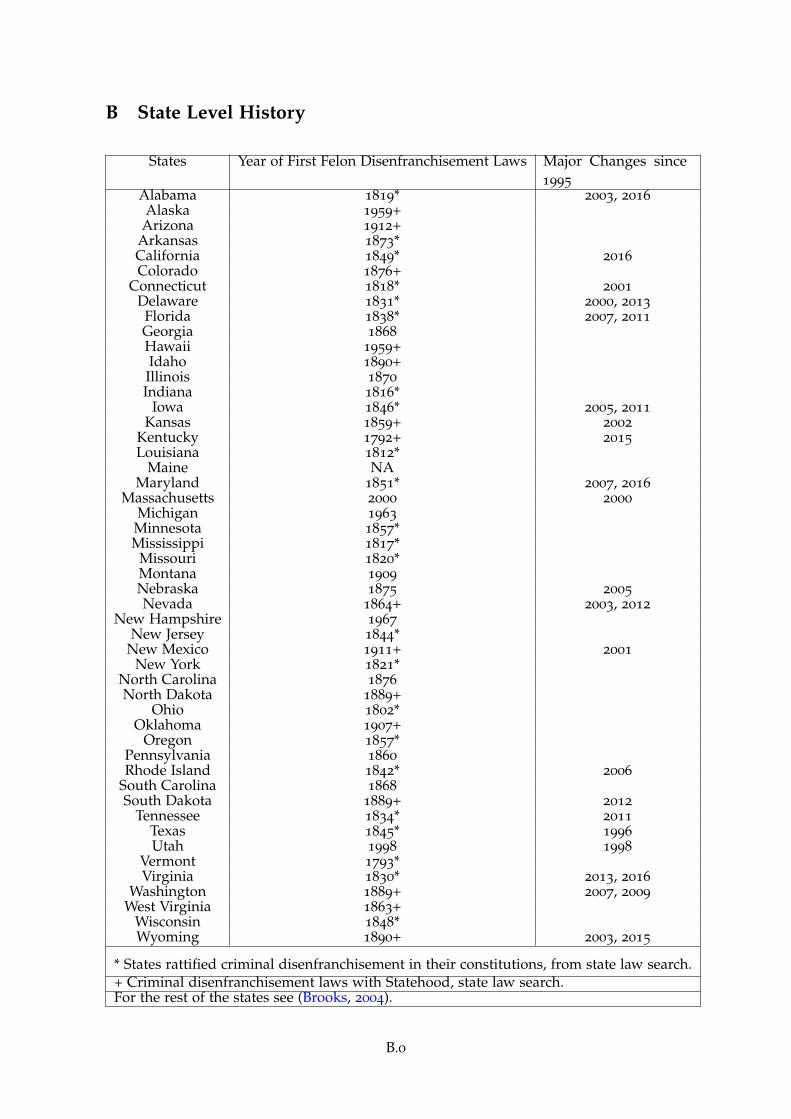
By the Articles of Confederation in 1777, states retained complete control over suffragerules and in 1792, Kentucky established the first criminal disenfranchisement laws in theU.S. Almost all states followed suit, see Appendix B for details. In the 20th century therewere relatively few substantive changes, and none between 1978 and 1995. Since then, therehave been a number of changes in state FD laws, the effects of which we study in thispaper. Figures 2 and 3 show the cumulative impact of changes over the period. Lookingat Figure 2 we see first of all that there is substantial variation in FD laws across states,and that this variation does not follow an obvious pattern. That is, it is not the case thatFD laws coincide with the Deep South, or only those states with large African-Americanpopulations. Moreover, when we compare the pattern with that around 20 years later inFigure 3 we see that, similarly, while there are a number of changes there is no obviouspattern in which states have changed their FD laws. For example, both Washington andTennessee have relaxed their FD laws, as have Pennsylvania and New Mexico. While, SouthDakota and Louisiana have introduced more restrictive laws.
Despite the number of changes the process through which they take place is often bothlong and uncertain. Given that FD laws are often part of state constitutions a constitutionalamendment is required to alter them. Given supermajority or referenda requirements thisis often unfeasible. Consequently, changes in the relevant law often depend on revisions ofwhat is meant by FD and how it is administered, which are then typically the subject ofprotracted court cases often culminating in a ruling by a state supreme court.5 Similarly,when governors have chosen to alter the process through which their powers of clemencyare applied this has itself been the subject of litigation.6 Elsewhere, referenda have beennecessary (e.g Texas). This is because not only does a law need to it often has dependedupon a combination of legislation, Appendix D provides brief histories for a number ofrecent cases as examples.
2.2 Data
2.2.1 Felon Disenfranchisement Laws
States started to adjust their FD legislation from 1995, with no substantive changes in thepreceding 20 years. We hand coded all relevant legislation since 1996, and these changesare summarized in Appendix B. Changes for the period 2001–2016 are already collected bythe NCSL.7 Data for the period 1996–2001 were obtained by keyword searches on the NCSL
5For example, the cases of Pennsylvania or Virginia described in Appendix D.6For example, the case of Iowa described in Appendix D.7http://www.ncsl.org/research/elections-and-campaigns/elections-legislation-databases-description.
aspx
4
website, individual state legislature websites, and the LexisNexis database using a broadrange of terms such as "felon", "Felony voting", "felon voting rights", "enfranchisement", etc.Following the approach of the Sentencing Project (2014) laws were coded into three binaryvariables:
1. Automatic Restoration of voting rights of felons after prison.
2. Extension of voting rights to felons convicted in certain offenses or when they are onparole or probation.
3. Restriction of felon’s voting rights.
Given that changes in these only ever affect subsequent elections, our coding reflects thisand so a change in the law in December 2000 would be coded as affecting the November2002 elections, other things equal. In a number of states there have been several changes inthe law, and the coding scheme captures these as separate changes.
Our main variable of interest will be Enfranchisement ∈ {0, 1, 2}. Which is defined as:
Enfranchisement = 2× Restoration + Extension (1)
This captures the idea of FD as a spectrum ranging from restoration only by special clemencyto full and automatic voting rights. We treat Restriction as the base category as it is mutuallyexclusive from the other two. (1) treats Restoration as twice as large a change in the law asExtension. This is designed to capture, in a minimal way, the substantial difference betweenautomatically giving the vote to the entire eligible population and extension conditional onappeal and other requirements. The results are robust to treating the two as equivalent.Combining Restriction and Restoration like this, as well as easing inference, also reduces howmuch we are asking of our data. We also report results for the three variables separately tounderstand better the differential impacts of different types of changes in FD laws.
2.2.2 Outcome Data
Following the literature we focus on the effects of FD on African-Americans. Thus, weignore all other racial and ethnic distinctions. The estimated effects of FD on African-Americans is then in comparison to all other Americans and not just non-Hispanic Whites.We argue this approach is to be preferred since the estimates will capture the particularaffects of FD on African-American communities. Moreover, given that FD may alsodisproportionately affect, for example, Hispanic-Americans, compared to non-HispanicWhites, our estimates of the overall impact of FD on racial and ethnic minorities will bestatistically and conceptually conservative given they will only be based on the differencein experience between African-Americans and all others.
We consider three outcome measures, Turnout Rates, the number of African-AmericanU.S. Representatives, and implemented state policies. Analyzing racial and otherdemographic differences in turnout rates, requires individual voting records combined withdemographic data for a representative sample of the U.S. population. We use the Votingand Registration Supplement data from the Current Population Survey (USDoC et al.,1985–2014), described by Hur and Achen (2013) as ‘the gold standard amongst turnoutstudies’. These data provides the voting decision of the U.S. population by their race andethnic groups at state and county level.8
8One issue is how to treat non-responses. The CPS recommending coding these as not-voting, we follow the
5
As a measure of how FD affects the number of black elected officials and representativeswe use demographic data on members of the U.S. House of Representatives from threesources Manning and Shogan (2012), Amer (2008), and National Association of StateLegislatures (2017)). It would be interesting to study whether FD affects the racialcomposition of those holding state-level office but such data, to the best of our knowledge,are not readily available.
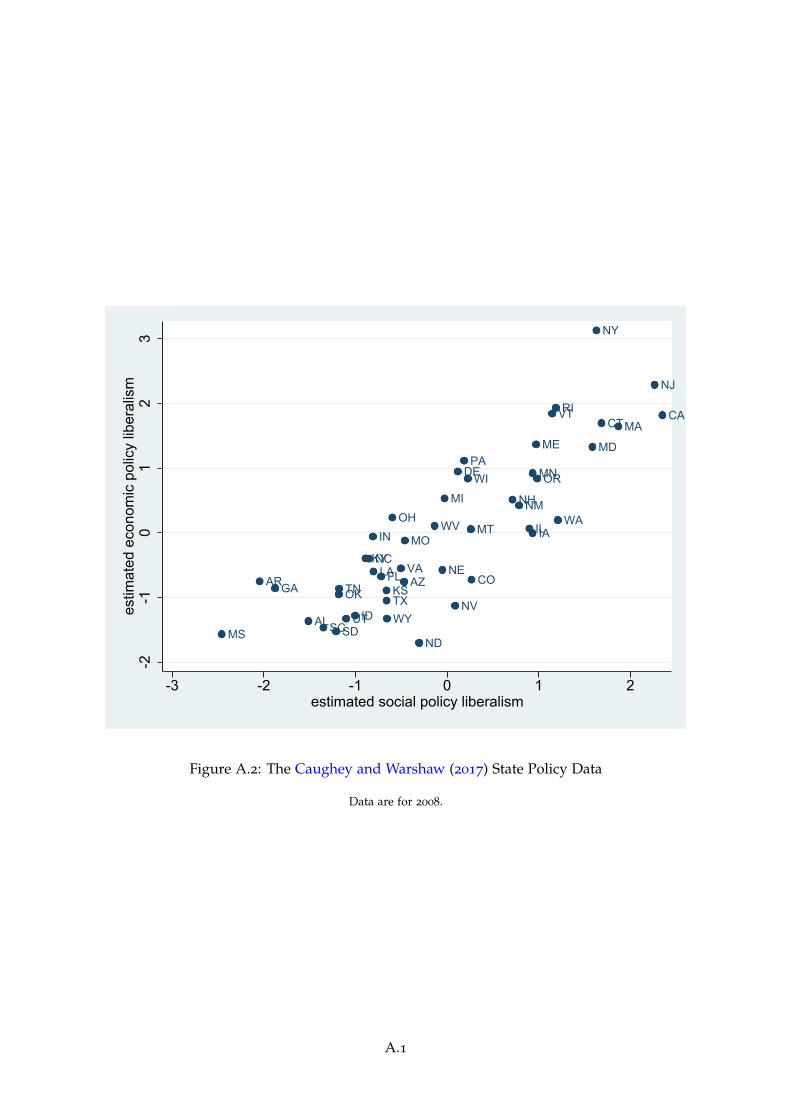
Finally, to measure how the change in the electorate caused by FD affects policy weuse the state policy liberalism data from Caughey and Warshaw (2015), and Caughey andWarshaw (2017). This is based on a dynamic latent variable model which provides estimatesof overall state policy liberalism (and economic and social policy liberalism) based on 148
individual policy areas that are comparable across elections and states. These are the onlydata to capture both the cross-sectional and time-series variation in state-policy.
3 Turnout
In this section we begin by introducing our identification strategy and regressionspecification. We then discuss results analyzing the decision to vote at the individuallevel. We show that even allowing for a range of demographic trends that there is an effectof FD laws on the likelihood of African-Americans voting but not for remainder of the U.S.population. To allow for a broader range of unobservable characteristics we analyze theeffects on cohorts defined by state, county, sex, age, and race to show that when comparingwithin cohort, FD has larger effects in states and counties with a greater proportion ofAfrican-Americans. We then present Interactive Fixed Effects (IFE) estimates that show thatthe effect of FD on African-American political participation is robust to allowing for timevarying effects of state unobservable characteristics.
3.1 Identification
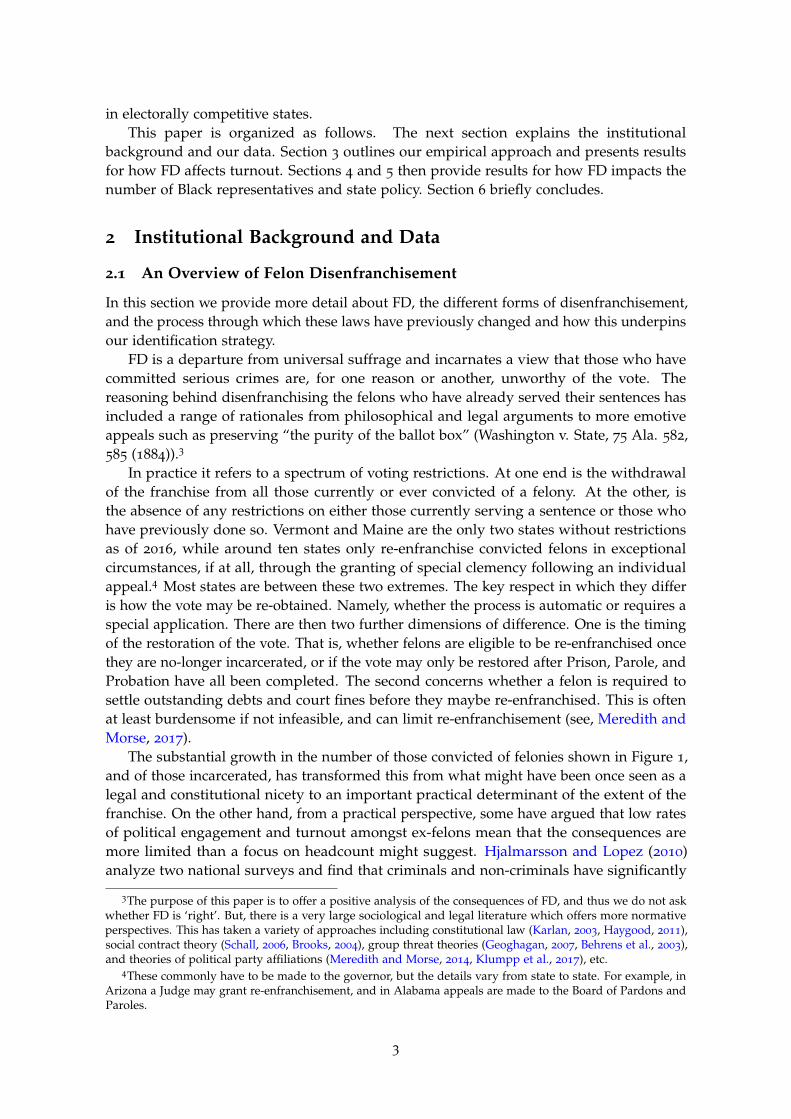
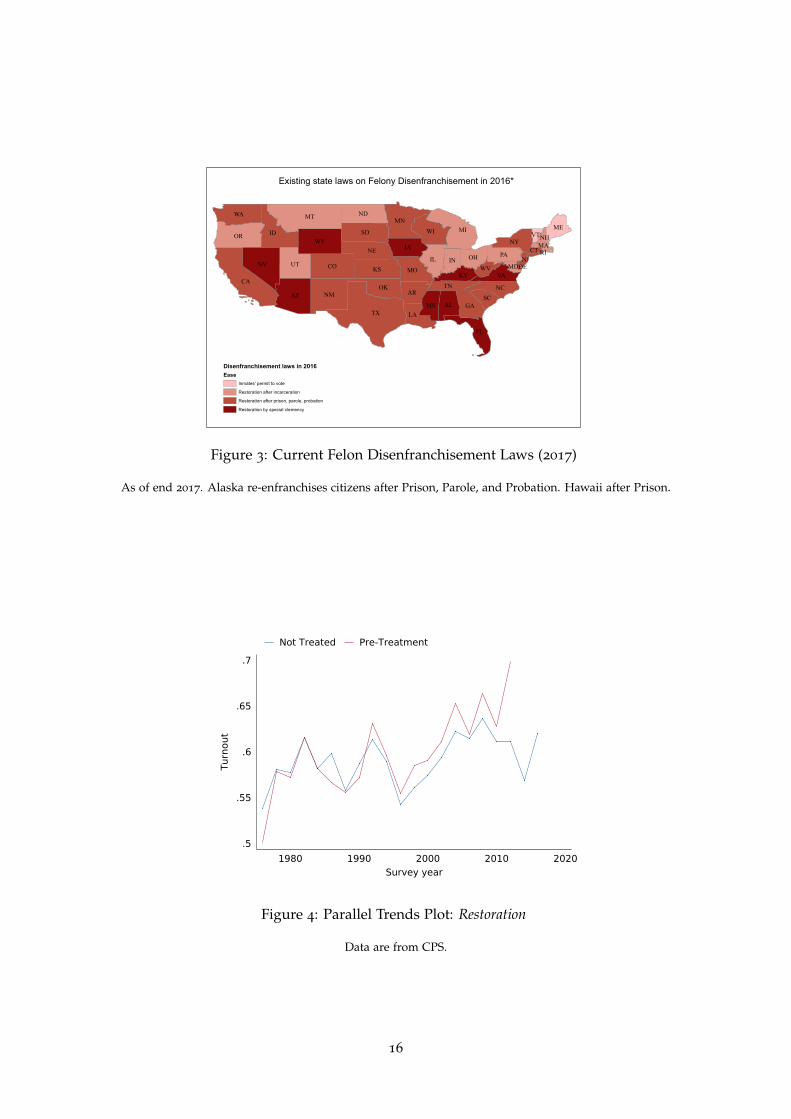
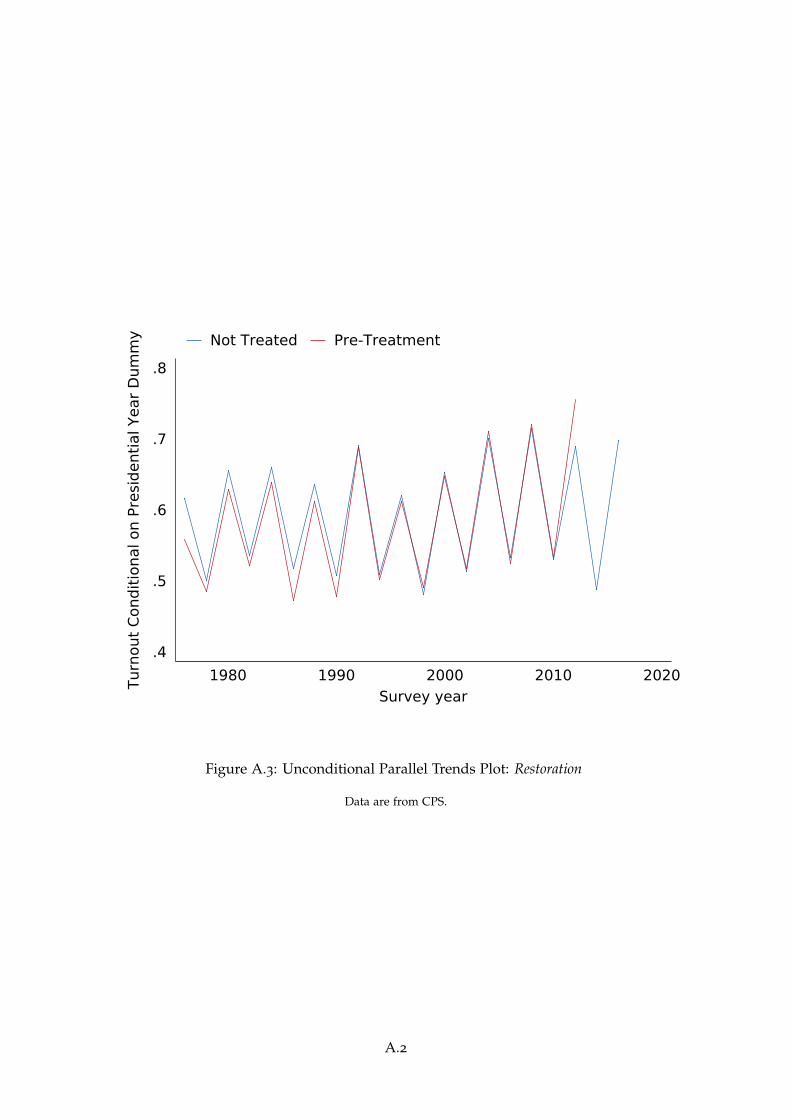
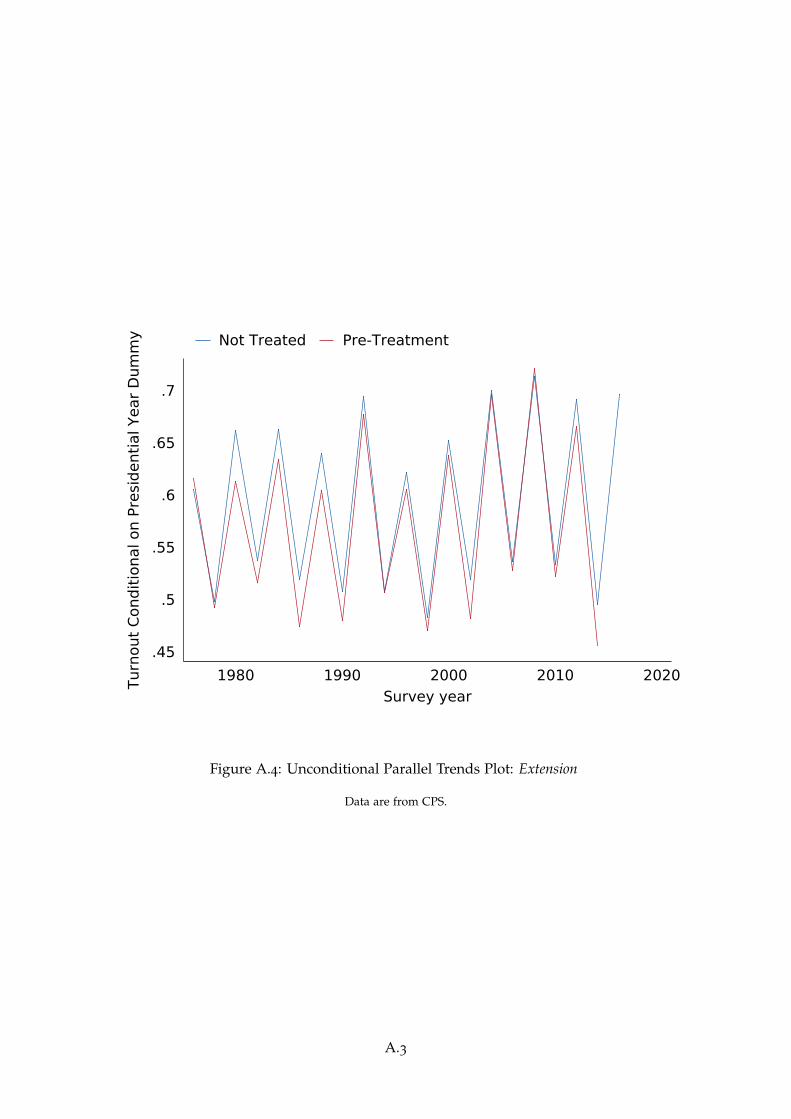
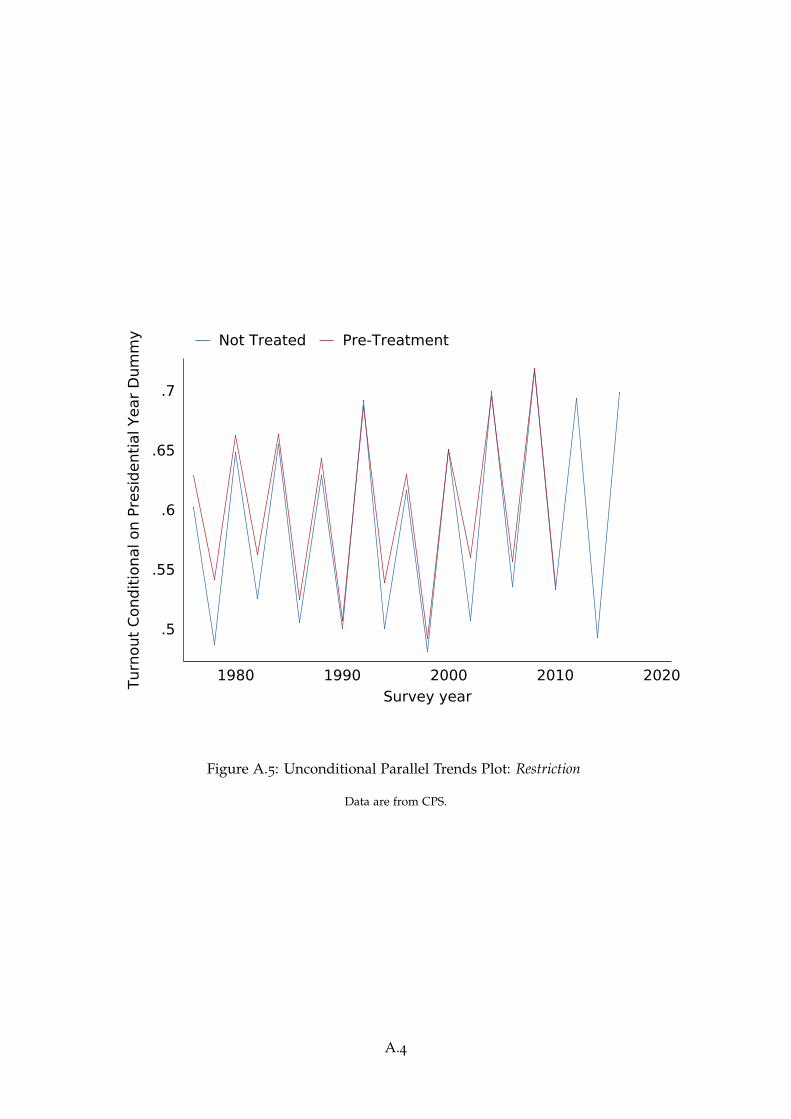
We will estimate the Average Treatment Effect of a change in Felon Disenfranchisementlaws on the probability of voting with regression based difference-in-differences strategy.Following, Angrist and Pischke (2009) we use a linear probability model. This requires theusual assumptions of parallel trends, SUTVA, and ignorability. The SUTVA assumptionseems reasonable here, given as discussed above that electoral law is delegated to states andhas in many cases been determined by state supreme court rulings and referenda which itis hard to see depending on other states’ laws. We demonstrate that the ‘parallel-trends’assumption is met graphically below in Figures 4-6. For clarity, we report results conditionalon a presidential election year dummy, unconditional results are in Figures A.3-A.5 in theAppendix. We note, that the pre-treatment series naturally has relatively few observationsat the end of the period and thus we observe some divergence between the series at thispoint. For the same reason the pre-treatment series finishes before the not-treated series.
In our context, ignorability requires that the likely consequences of FD are notsystematically different in states that enact it to those that do not. One way in whichthis might be violated is if in states with larger populations of ex-felons the decision tore-enfranchise them was more electorally consequential and thus can be expected to be thesubject of a more concerted campaign to do so. We note that equally, in the spirit of Becker
recommendations of Hur and Achen (2013) and drop non-responses and refusals. We code the small numberof "don’t knows" as not having voted.
6
(1983), those who are likely to lose out through such a re-enfranchisement are likely tooppose it more energetically. Moreover, as the examples discussed above make clear beyondbringing a test-case (which needs only to be funded) or exerting pressure on their electedrepresentatives (which may be expected to be balanced out), it is not obvious what influencethe public may have. Of course, some states constitutions may make the change in such alaw easier, and there is a clear increase in the number of states re-enfranchising felons overtime. Thus, we argue that the changes in FD laws are conditionally random controlling forthese differences.
We control for these in three ways. Firstly, with the conventional two-way fixed-effectsmodel including state (or county) and year fixed effects. Such that our difference-in-difference estimator will be:
Yist = τ1Enfranchisementst + τ2Blacki × Enfranchisementst + X′itβ + λs + Ft + εit (2)
Where, Yit ∈ {0, 1} is whether individual i voted, Xit is a vector of observablecharacteristics of the individual as well as time-varying state-level observables, λs arestate (or county) fixed effects, and Ft election-year fixed-effects.
Second, we study the effects of FD within demographic groups. As the CPS is not a panelwe cannot ask the natural question of whether, within individuals, the probability of votingincreases following a relaxation of FD restrictions. In lieu of such an analysis we insteademploy a pseudo-panel type approach. We define cohorts for each combination of state, sex,year of birth, and race (African-American or not), which are chosen on the basis that theycapture key demographic differences whilst also being plausibly exogenous to the effects ofFD. We then re-estimate (2) replacing the state fixed-effects with cohort fixed-effects suchthat τ1 and τ2 now measures the effect on people of within each cohort. This means that weare now able to capture the reality that for many reasons including differences in history,geography, and economic structure we should expect different impacts on different groupsof Americans in different states.
Third, we generalize this approach using the IFE estimator of Bai (2009). Unlike theconventional two-way fixed-effect estimator, the Bai (2009) IFE estimator no longer restrictsthe effect of time-invariant state characteristics and the stochastic time trend to be separateand additive. Rather, the overall impact in a given year will depend on the interaction ofthe time effect with the unobserved state characteristics. For example, nationally African-American turnout has been increasing over time, but there is pronounced variation acrossstates in this trend. In the absence of other controls, the conventional two-way fixedestimator predicts the African-American turnout rate as Yit = λi + Ft, where λi will be theaverage turnout rate representatives in state i over the sample, and Ft will be the averageturnout in year t across all states. Clearly, however we might expect, for example, thatturnout rates will grow more in States with large African-American populations thanothers. Or we might expect that turnout might grow more in states with historically lowturnout rates. More subtly, we might expect that the turnout rate in a given state will reflectthe interaction of the national trend with the demographic characteristics and geographicdistribution of the African-American population in that state. And so on. The conventionalapproach is to include various time trends, as indeed we do. But, since the IFE estimatorexplicitly allows for there to be unobserved differences across states the impact of which willvary over time (in an unrestricted way), it improves on this by parsimoniously capturing allof these possibilities and others.
7
Yist = τ1Enfranchisementst + τ2Blacki × Enfranchisementst + X′itβ + λ′sFt + εit (3)
Here, λs and Ft are now r dimensional vectors capturing the unobserved state characteristicsand time effects respectively. That is the unobserved characteristics of states may haveseveral dimensions which impact on turnout of different individuals differently over time.r can be chosen via cross-validation, thus improving efficiency.
3.2 Results
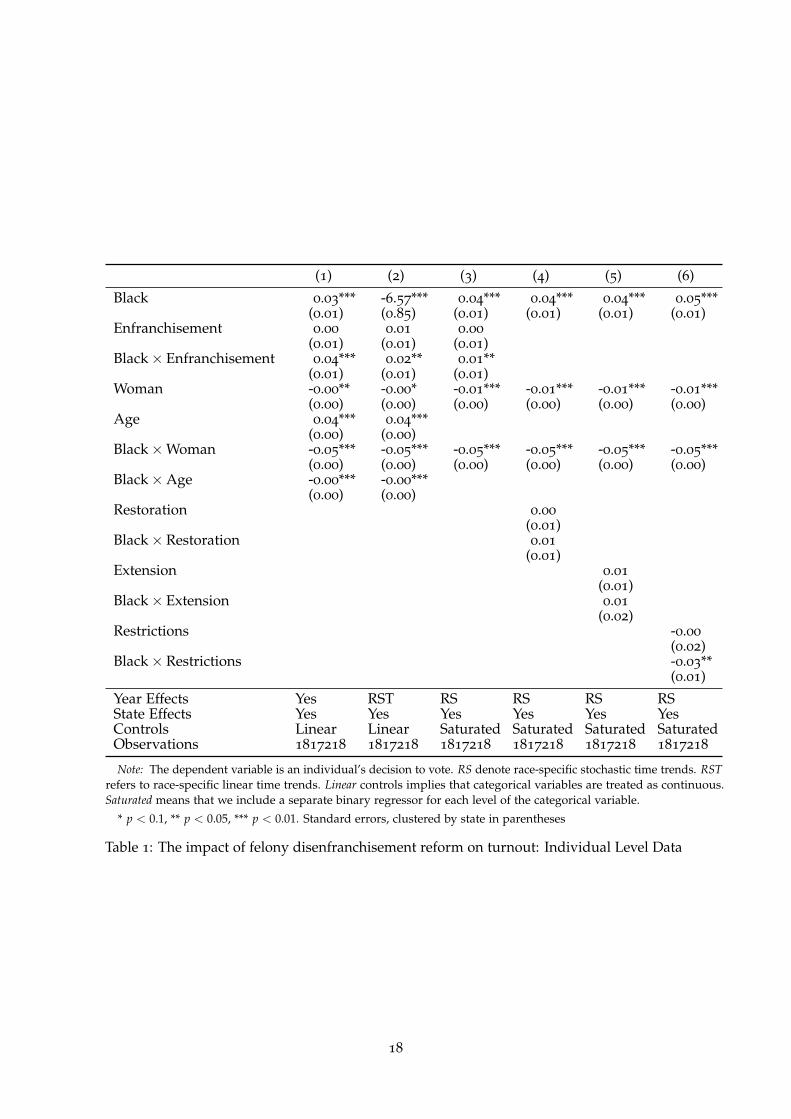
We begin by estimating (2), and results are reported in Table 1. Looking first at column (1)we see that controlling for everything else, Black Citizens are around 3% more likely tovote. This is unsurprising given similar aggregate turnout rates and the well documentedeffects of income and education on turnout rates.9 The coefficient on Enfranchisement,τ1
is a precise zero and suggests that relaxing FD laws doesn’t alter overall turnout amongstnon-Blacks. On the other hand, τ2 is statistically significant at the 1% level and suggeststhat African-Americans are, all else equal, 4% more likely to vote if FD laws are relaxed.
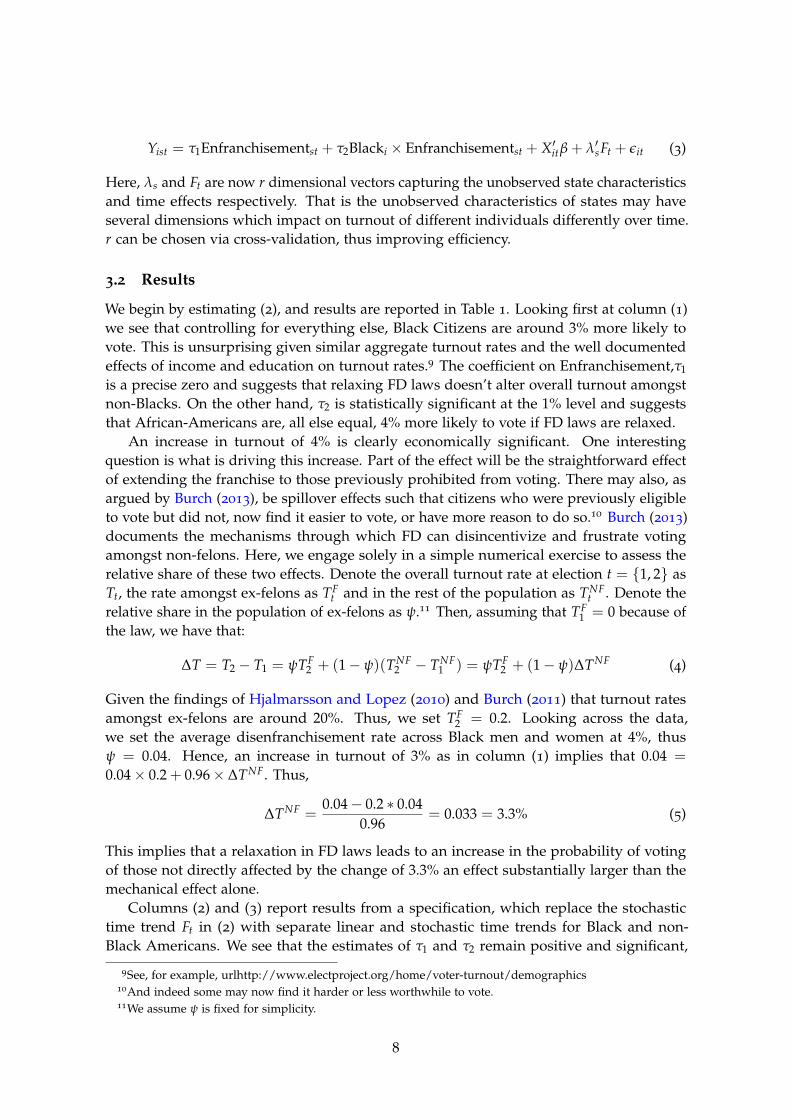
An increase in turnout of 4% is clearly economically significant. One interestingquestion is what is driving this increase. Part of the effect will be the straightforward effectof extending the franchise to those previously prohibited from voting. There may also, asargued by Burch (2013), be spillover effects such that citizens who were previously eligibleto vote but did not, now find it easier to vote, or have more reason to do so.10 Burch (2013)documents the mechanisms through which FD can disincentivize and frustrate votingamongst non-felons. Here, we engage solely in a simple numerical exercise to assess therelative share of these two effects. Denote the overall turnout rate at election t = {1, 2} asTt, the rate amongst ex-felons as TF
t and in the rest of the population as TNFt . Denote the
relative share in the population of ex-felons as ψ.11 Then, assuming that TF1 = 0 because of
the law, we have that:
∆T = T2 − T1 = ψTF2 + (1− ψ)(TNF
2 − TNF1 ) = ψTF
2 + (1− ψ)∆TNF (4)
Given the findings of Hjalmarsson and Lopez (2010) and Burch (2011) that turnout ratesamongst ex-felons are around 20%. Thus, we set TF
2 = 0.2. Looking across the data,we set the average disenfranchisement rate across Black men and women at 4%, thusψ = 0.04. Hence, an increase in turnout of 3% as in column (1) implies that 0.04 =
0.04× 0.2 + 0.96× ∆TNF. Thus,
∆TNF =0.04− 0.2 ∗ 0.04
0.96= 0.033 = 3.3% (5)
This implies that a relaxation in FD laws leads to an increase in the probability of votingof those not directly affected by the change of 3.3% an effect substantially larger than themechanical effect alone.
Columns (2) and (3) report results from a specification, which replace the stochastictime trend Ft in (2) with separate linear and stochastic time trends for Black and non-Black Americans. We see that the estimates of τ1 and τ2 remain positive and significant,
9See, for example, urlhttp://www.electproject.org/home/voter-turnout/demographics10And indeed some may now find it harder or less worthwhile to vote.11We assume ψ is fixed for simplicity.
8
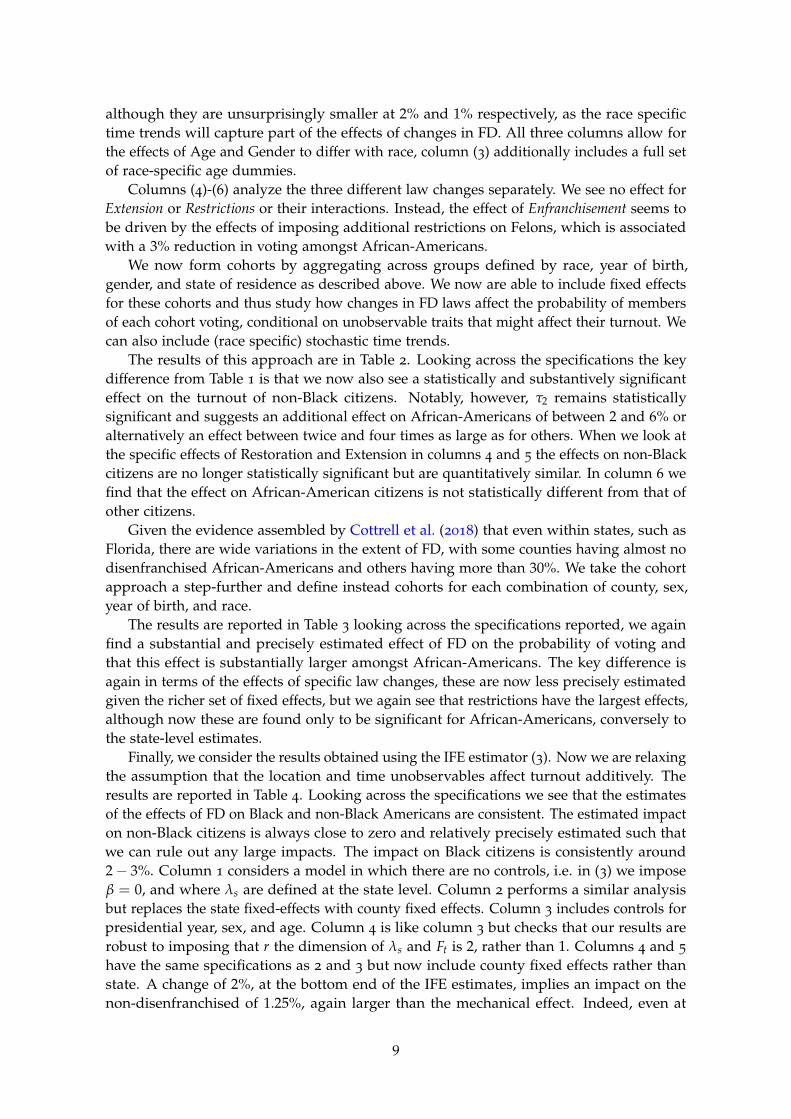
although they are unsurprisingly smaller at 2% and 1% respectively, as the race specifictime trends will capture part of the effects of changes in FD. All three columns allow forthe effects of Age and Gender to differ with race, column (3) additionally includes a full setof race-specific age dummies.
Columns (4)-(6) analyze the three different law changes separately. We see no effect forExtension or Restrictions or their interactions. Instead, the effect of Enfranchisement seems tobe driven by the effects of imposing additional restrictions on Felons, which is associatedwith a 3% reduction in voting amongst African-Americans.
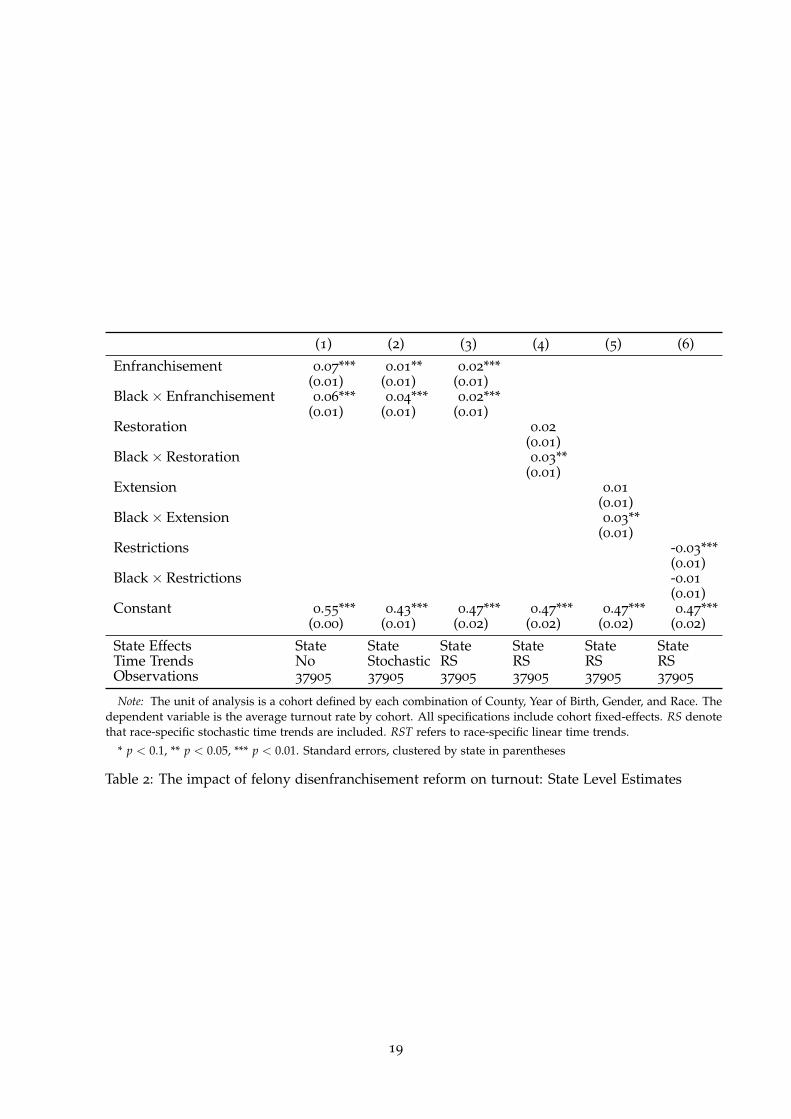
We now form cohorts by aggregating across groups defined by race, year of birth,gender, and state of residence as described above. We now are able to include fixed effectsfor these cohorts and thus study how changes in FD laws affect the probability of membersof each cohort voting, conditional on unobservable traits that might affect their turnout. Wecan also include (race specific) stochastic time trends.
The results of this approach are in Table 2. Looking across the specifications the keydifference from Table 1 is that we now also see a statistically and substantively significanteffect on the turnout of non-Black citizens. Notably, however, τ2 remains statisticallysignificant and suggests an additional effect on African-Americans of between 2 and 6% oralternatively an effect between twice and four times as large as for others. When we look atthe specific effects of Restoration and Extension in columns 4 and 5 the effects on non-Blackcitizens are no longer statistically significant but are quantitatively similar. In column 6 wefind that the effect on African-American citizens is not statistically different from that ofother citizens.
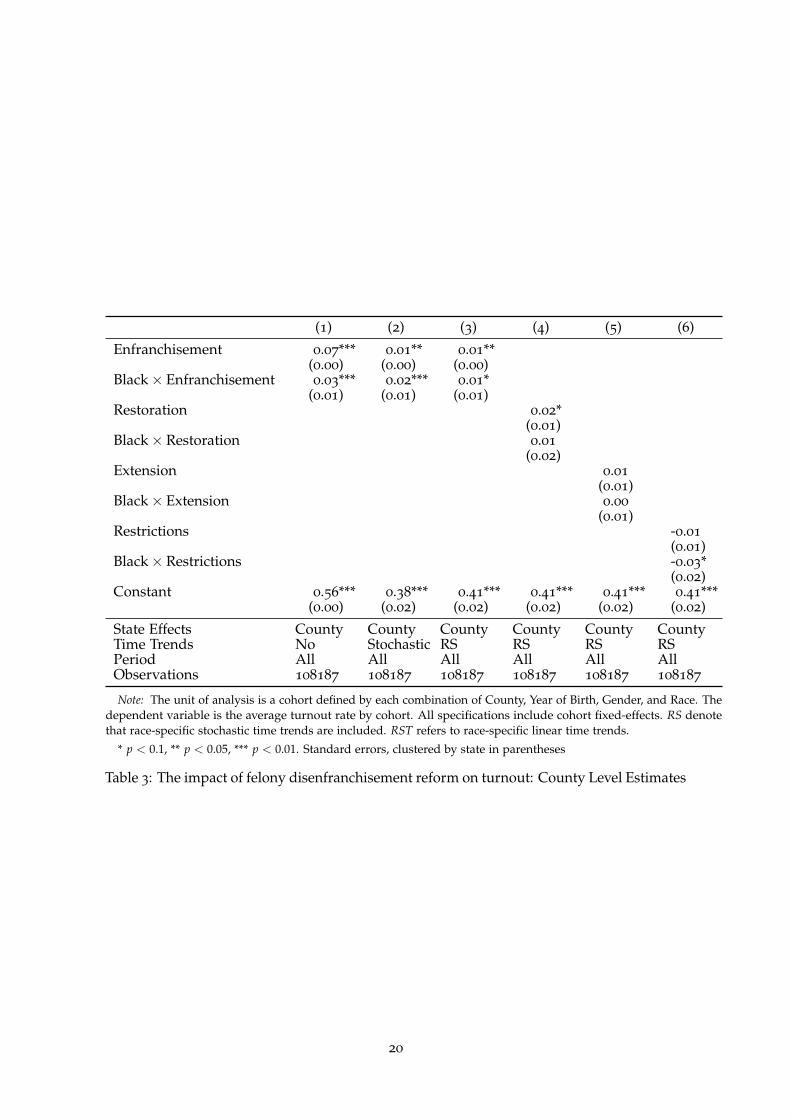
Given the evidence assembled by Cottrell et al. (2018) that even within states, such asFlorida, there are wide variations in the extent of FD, with some counties having almost nodisenfranchised African-Americans and others having more than 30%. We take the cohortapproach a step-further and define instead cohorts for each combination of county, sex,year of birth, and race.
The results are reported in Table 3 looking across the specifications reported, we againfind a substantial and precisely estimated effect of FD on the probability of voting andthat this effect is substantially larger amongst African-Americans. The key difference isagain in terms of the effects of specific law changes, these are now less precisely estimatedgiven the richer set of fixed effects, but we again see that restrictions have the largest effects,although now these are found only to be significant for African-Americans, conversely tothe state-level estimates.
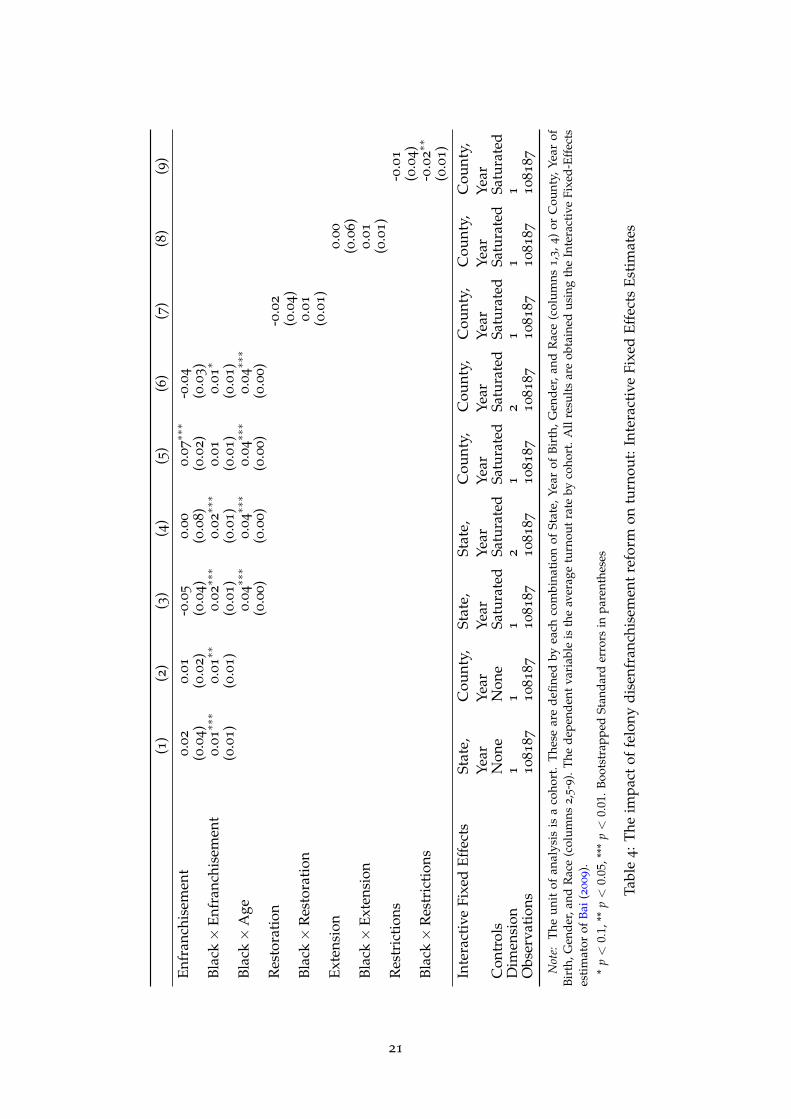
Finally, we consider the results obtained using the IFE estimator (3). Now we are relaxingthe assumption that the location and time unobservables affect turnout additively. Theresults are reported in Table 4. Looking across the specifications we see that the estimatesof the effects of FD on Black and non-Black Americans are consistent. The estimated impacton non-Black citizens is always close to zero and relatively precisely estimated such thatwe can rule out any large impacts. The impact on Black citizens is consistently around2− 3%. Column 1 considers a model in which there are no controls, i.e. in (3) we imposeβ = 0, and where λs are defined at the state level. Column 2 performs a similar analysisbut replaces the state fixed-effects with county fixed effects. Column 3 includes controls forpresidential year, sex, and age. Column 4 is like column 3 but checks that our results arerobust to imposing that r the dimension of λs and Ft is 2, rather than 1. Columns 4 and 5
have the same specifications as 2 and 3 but now include county fixed effects rather thanstate. A change of 2%, at the bottom end of the IFE estimates, implies an impact on thenon-disenfranchised of 1.25%, again larger than the mechanical effect. Indeed, even at
9

the lower end of all of our estimates at 1% the impact is still positive albeit no longer aseconomically significant at only 0.2%.
The estimates of the effects of the individual laws in columns 7–9 continue to be lessprecisely estimated, but while there are changes in the pattern of which variables arestatistically significant the substantive pattern remain similar.
Overall, we may reach two conclusions. First, FD has a disproportionate impact onAfrican-American communities and, secondly, that this effect is in excess of any mechanicaleffect due to the re-enfranchisement of offenders.
4 Representation
We now ask whether FD limits the number of African-American representatives? That is,whether the disproportionate reduction in the number of African-Americans in the electoratedue to FD, limits government “of the people”. We focus on elections to U.S. Representative.This reflects, to the best of our knowledge, a lack of systematic demographic informationon those elected to state legislatures covering our period.12 It is also preferable given thatthe voting laws are the prerogative of individual states and so we eliminate concerns ofsimultaneity in which a decrease in the number of African-American representatives mayaffect state FD policy. Necessarily, our analysis is now at the state level, rather than at theindividual or county level.
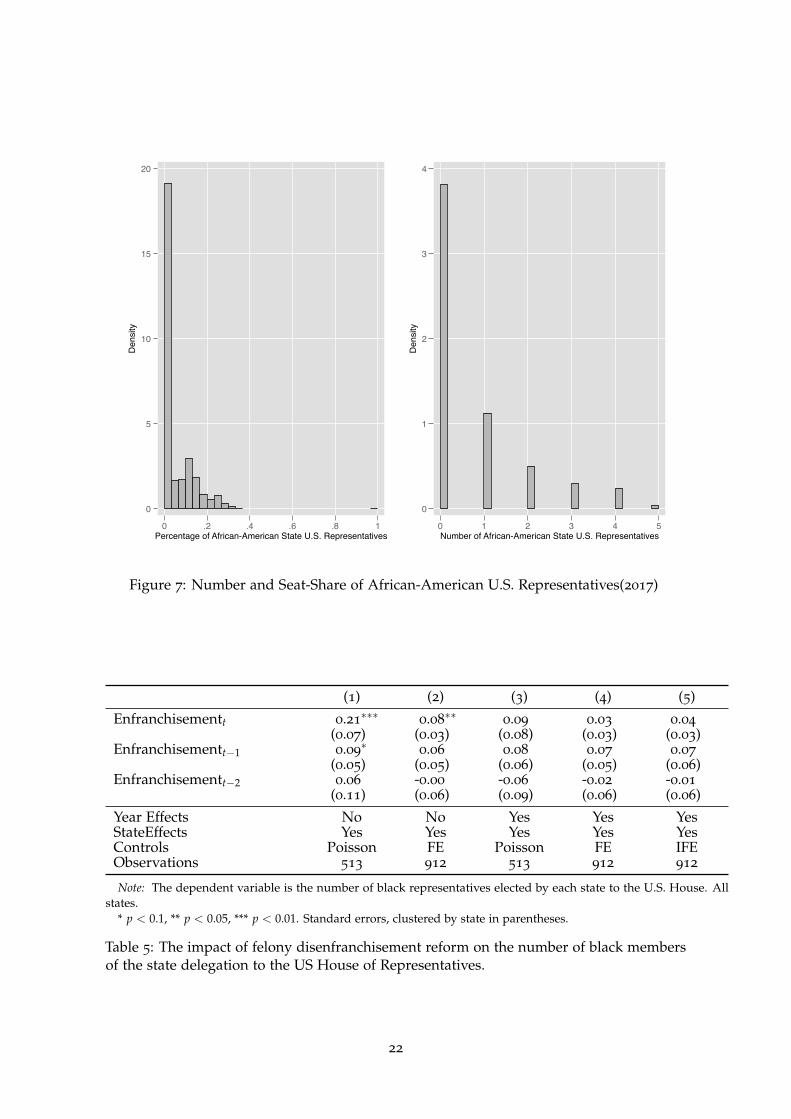
We begin by documenting the key fact that the number of African-American U.S.Representatives is very small, both in absolute terms and in comparison to the shareof African-Americans in the US population. Figure 7 makes this clear, we can see thatat nearly two-thirds of state-year pairs no African-American representative was elected.Similarly, with the notable the case of Delaware which has elected an African-American asits single representative, we can see that the distribution of the share of African-Americanrepresentatives is further to the left than would be expected if representatives’ demographicsmirrored those of the broader population, with a mean of just under 5%. This contrastswith a share of the population of around 12%.
Given that U.S. Representative is a senior political position and that organizing acampaign may take time we may expect that the effect of a change in FD laws not to happenimmediately. We thus augment our previous specification to include lagged law changes.As our outcome measure is now solely at the state level, we exclude the interaction term.Thus, we now estimate
Yit =2
∑k=0
τkEnfranchisements,t−k + X′itβ + λs + Ft + εit. (6)
Where Yit is the Total Number of African-American U.S. Representatives Elected. Theresults are presented in Table 5. Given that Yit is a count variable we estimate (Fixed-Effect)Poisson regressions, reported in columns 1 and 3. For comparison with the results obtainedusing the IFE estimator reported in columns 5, we also report analogous OLS-FE estimatesin columns 2 and 4. To avoid the ‘bad control’ problem the only control included inX is a dummy for presidential election years. Columns 1 and 2 exclude the year fixed-effects Ft while Columns 3 and 4 include them. First, looking across specifications we
12While previous work, such as Rocha et al. (2010) and Uhlaner and Scola (2015) has analyzed elections tostate legislatures their data cover only a limited period and we have found no exact source of data for all statesfor the entire period.
10
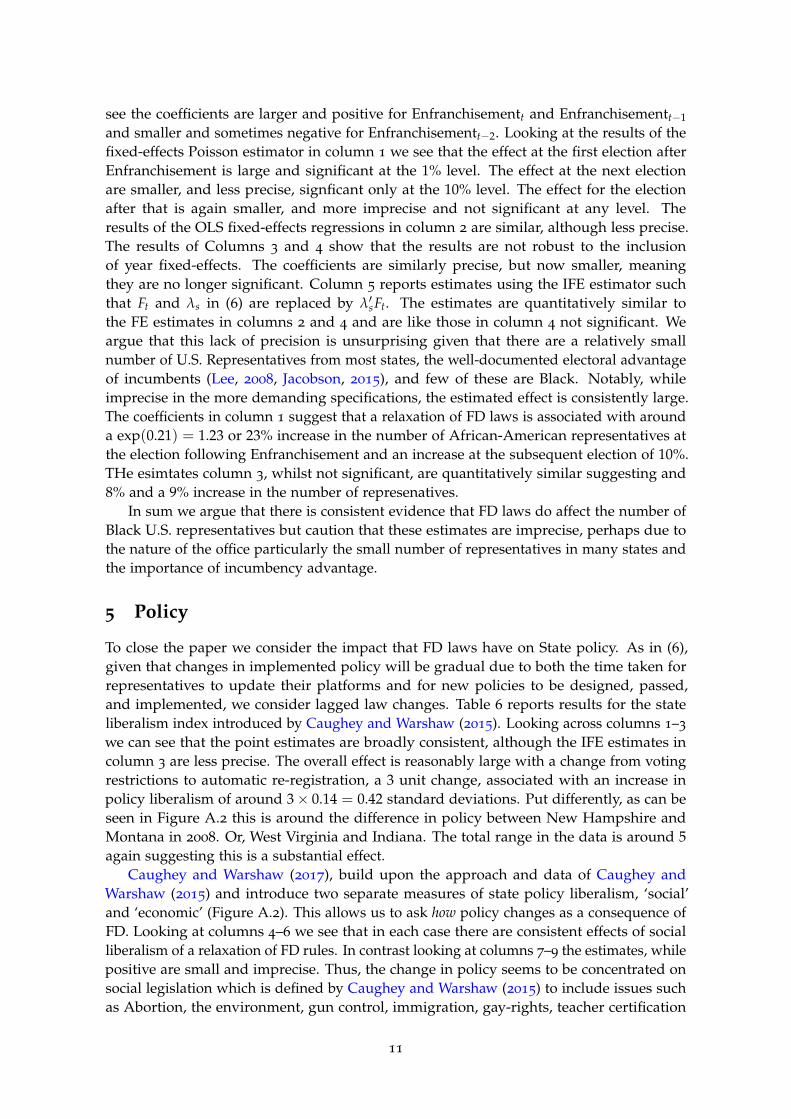
see the coefficients are larger and positive for Enfranchisementt and Enfranchisementt−1
and smaller and sometimes negative for Enfranchisementt−2. Looking at the results of thefixed-effects Poisson estimator in column 1 we see that the effect at the first election afterEnfranchisement is large and significant at the 1% level. The effect at the next electionare smaller, and less precise, signficant only at the 10% level. The effect for the electionafter that is again smaller, and more imprecise and not significant at any level. Theresults of the OLS fixed-effects regressions in column 2 are similar, although less precise.The results of Columns 3 and 4 show that the results are not robust to the inclusionof year fixed-effects. The coefficients are similarly precise, but now smaller, meaningthey are no longer significant. Column 5 reports estimates using the IFE estimator suchthat Ft and λs in (6) are replaced by λ′sFt. The estimates are quantitatively similar tothe FE estimates in columns 2 and 4 and are like those in column 4 not significant. Weargue that this lack of precision is unsurprising given that there are a relatively smallnumber of U.S. Representatives from most states, the well-documented electoral advantageof incumbents (Lee, 2008, Jacobson, 2015), and few of these are Black. Notably, whileimprecise in the more demanding specifications, the estimated effect is consistently large.The coefficients in column 1 suggest that a relaxation of FD laws is associated with arounda exp(0.21) = 1.23 or 23% increase in the number of African-American representatives atthe election following Enfranchisement and an increase at the subsequent election of 10%.THe esimtates column 3, whilst not significant, are quantitatively similar suggesting and8% and a 9% increase in the number of represenatives.
In sum we argue that there is consistent evidence that FD laws do affect the number ofBlack U.S. representatives but caution that these estimates are imprecise, perhaps due tothe nature of the office particularly the small number of representatives in many states andthe importance of incumbency advantage.
5 Policy
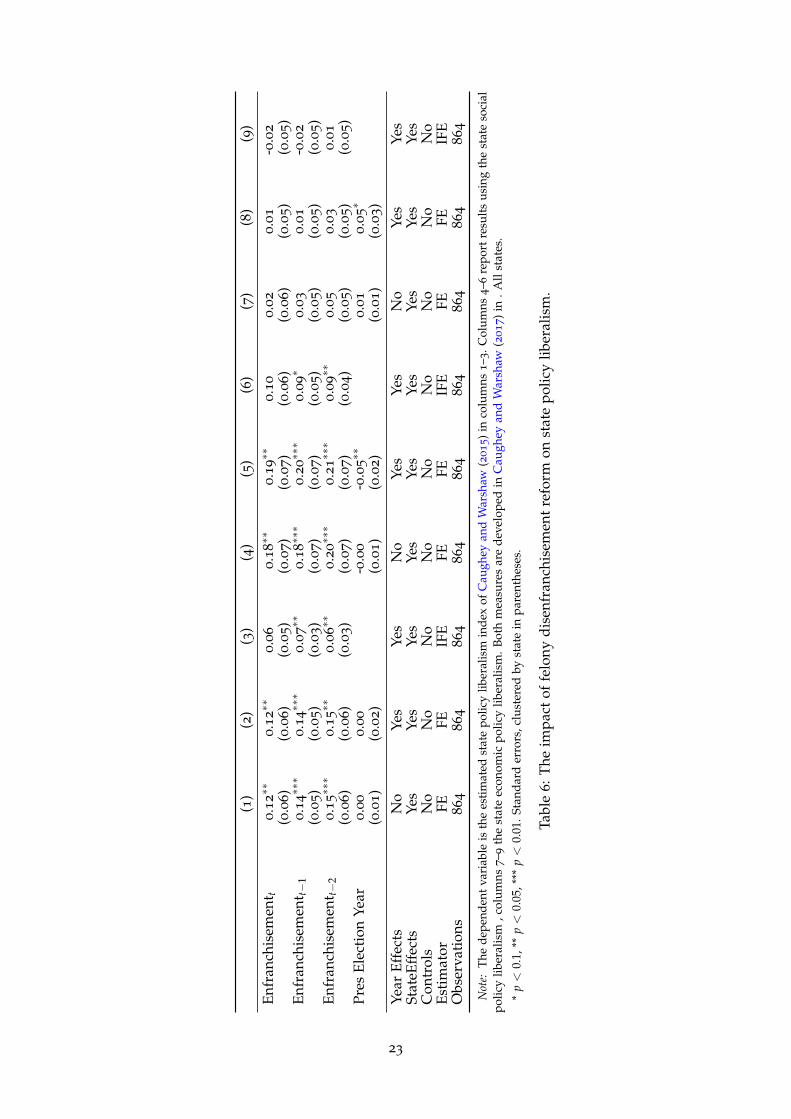
To close the paper we consider the impact that FD laws have on State policy. As in (6),given that changes in implemented policy will be gradual due to both the time taken forrepresentatives to update their platforms and for new policies to be designed, passed,and implemented, we consider lagged law changes. Table 6 reports results for the stateliberalism index introduced by Caughey and Warshaw (2015). Looking across columns 1–3
we can see that the point estimates are broadly consistent, although the IFE estimates incolumn 3 are less precise. The overall effect is reasonably large with a change from votingrestrictions to automatic re-registration, a 3 unit change, associated with an increase inpolicy liberalism of around 3× 0.14 = 0.42 standard deviations. Put differently, as can beseen in Figure A.2 this is around the difference in policy between New Hampshire andMontana in 2008. Or, West Virginia and Indiana. The total range in the data is around 5again suggesting this is a substantial effect.
Caughey and Warshaw (2017), build upon the approach and data of Caughey andWarshaw (2015) and introduce two separate measures of state policy liberalism, ‘social’and ‘economic’ (Figure A.2). This allows us to ask how policy changes as a consequence ofFD. Looking at columns 4–6 we see that in each case there are consistent effects of socialliberalism of a relaxation of FD rules. In contrast looking at columns 7–9 the estimates, whilepositive are small and imprecise. Thus, the change in policy seems to be concentrated onsocial legislation which is defined by Caughey and Warshaw (2015) to include issues suchas Abortion, the environment, gun control, immigration, gay-rights, teacher certification
11
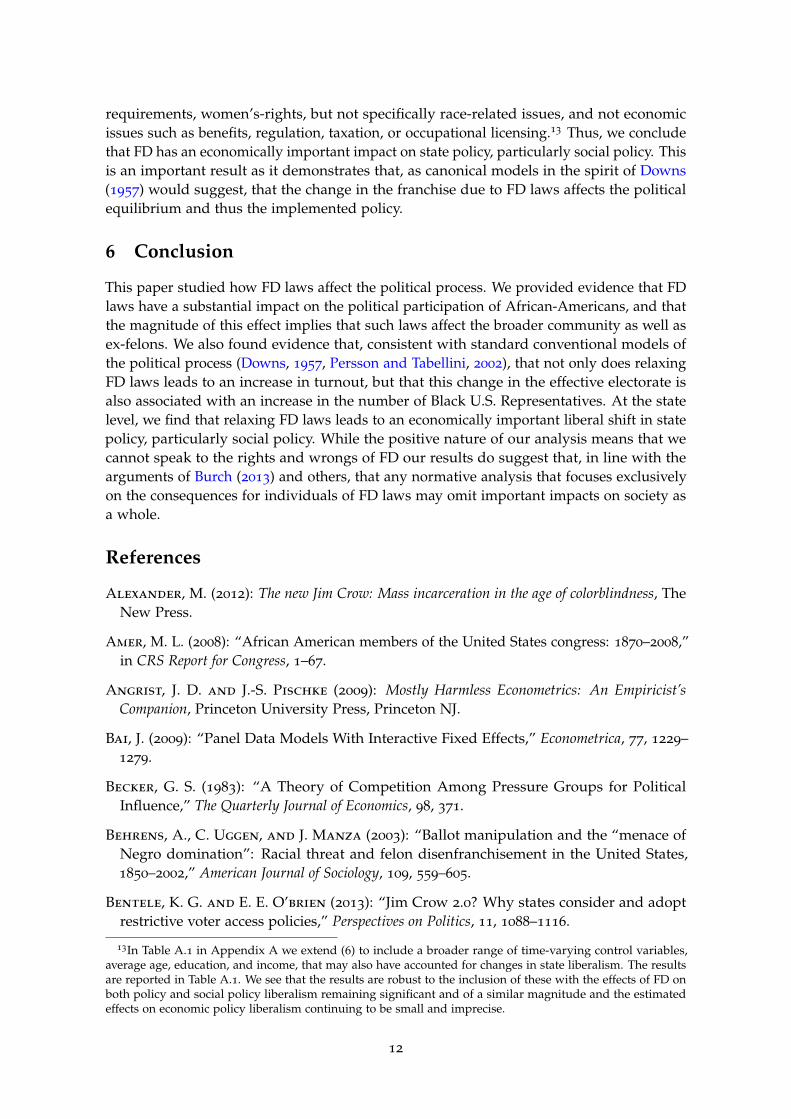
requirements, women’s-rights, but not specifically race-related issues, and not economicissues such as benefits, regulation, taxation, or occupational licensing.13 Thus, we concludethat FD has an economically important impact on state policy, particularly social policy. Thisis an important result as it demonstrates that, as canonical models in the spirit of Downs(1957) would suggest, that the change in the franchise due to FD laws affects the politicalequilibrium and thus the implemented policy.
6 Conclusion
This paper studied how FD laws affect the political process. We provided evidence that FDlaws have a substantial impact on the political participation of African-Americans, and thatthe magnitude of this effect implies that such laws affect the broader community as well asex-felons. We also found evidence that, consistent with standard conventional models ofthe political process (Downs, 1957, Persson and Tabellini, 2002), that not only does relaxingFD laws leads to an increase in turnout, but that this change in the effective electorate isalso associated with an increase in the number of Black U.S. Representatives. At the statelevel, we find that relaxing FD laws leads to an economically important liberal shift in statepolicy, particularly social policy. While the positive nature of our analysis means that wecannot speak to the rights and wrongs of FD our results do suggest that, in line with thearguments of Burch (2013) and others, that any normative analysis that focuses exclusivelyon the consequences for individuals of FD laws may omit important impacts on society asa whole.
References
Alexander, M. (2012): The new Jim Crow: Mass incarceration in the age of colorblindness, TheNew Press.
Amer, M. L. (2008): “African American members of the United States congress: 1870–2008,”in CRS Report for Congress, 1–67.
Angrist, J. D. and J.-S. Pischke (2009): Mostly Harmless Econometrics: An Empiricist’sCompanion, Princeton University Press, Princeton NJ.
Bai, J. (2009): “Panel Data Models With Interactive Fixed Effects,” Econometrica, 77, 1229–1279.
Becker, G. S. (1983): “A Theory of Competition Among Pressure Groups for PoliticalInfluence,” The Quarterly Journal of Economics, 98, 371.
Behrens, A., C. Uggen, and J. Manza (2003): “Ballot manipulation and the “menace ofNegro domination”: Racial threat and felon disenfranchisement in the United States,1850–2002,” American Journal of Sociology, 109, 559–605.
Bentele, K. G. and E. E. O’brien (2013): “Jim Crow 2.0? Why states consider and adoptrestrictive voter access policies,” Perspectives on Politics, 11, 1088–1116.
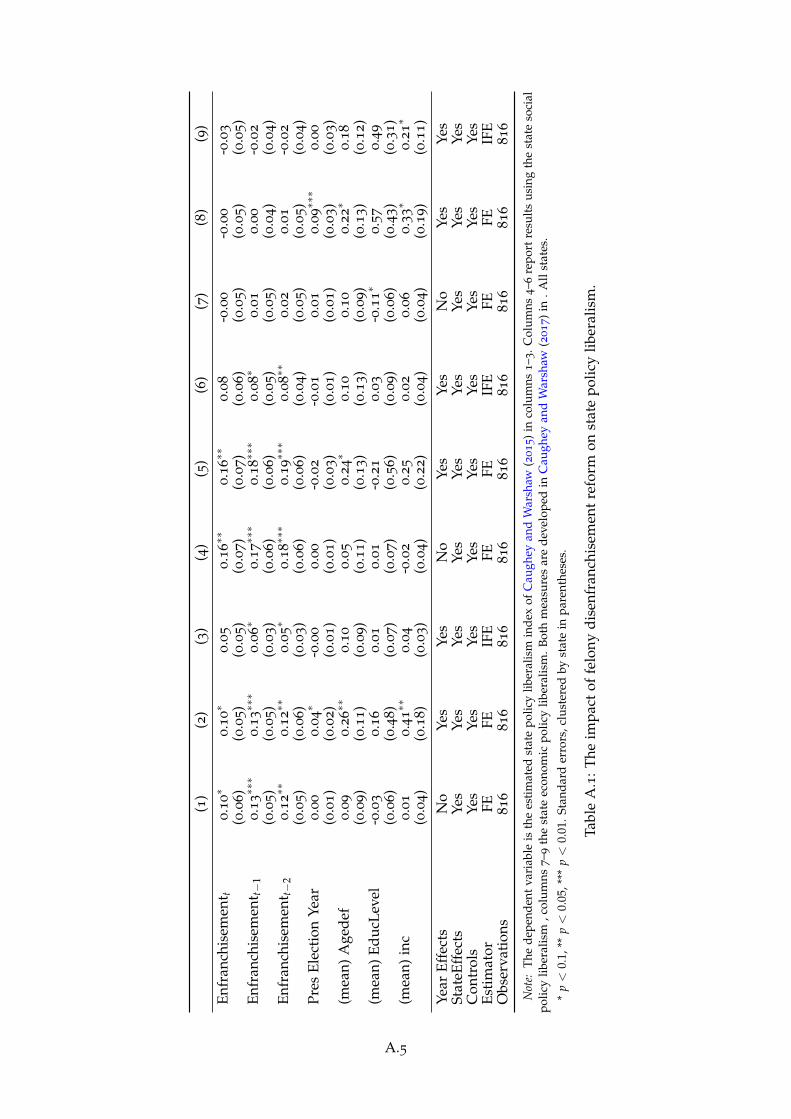
13In Table A.1 in Appendix A we extend (6) to include a broader range of time-varying control variables,average age, education, and income, that may also have accounted for changes in state liberalism. The resultsare reported in Table A.1. We see that the results are robust to the inclusion of these with the effects of FD onboth policy and social policy liberalism remaining significant and of a similar magnitude and the estimatedeffects on economic policy liberalism continuing to be small and imprecise.
12
Bernini, A., G. Facchini, and C. Testa (2017): “Race, Representation and Policy: BlackElected Officials and Public Spending in the US South,” .
Brooks, G. (2004): “Felon Disenfranchisement: Law, History, Policy, and Politics,” FordhamUrb. LJ, 32, 851.
Burch, T. (2011): “Turnout and party registration among criminal offenders in the 2008
general election,” Law & Society Review, 45, 699–730.
——— (2013): Trading democracy for justice: Criminal convictions and the decline of neighborhoodpolitical participation, University of Chicago Press.
Cascio, E. and E. Washington (2014): “Valuing the Vote: The Redistribution of VotingRights and State Funds following the Voting Rights Act of 1965,” The Quarterly Journal ofEconomics, 129, 379–433.
Caughey, D. and C. Warshaw (2015): “The Dynamics of State Policy Liberalism, 1936–2014,”American Journal of Political Science, 60, 899–913.
——— (2017): “Policy Preferences and Policy Change: Dynamic Responsiveness in theAmerican States, 1936–2014,” .
Cottrell, D., M. C. Herron, J. M. Rodriguez, and D. A. Smith (2018): “Mortality,Incarceration, and African American Disenfranchisement in the Contemporary UnitedStates,” American Politics Research.
Downs, A. (1957): “An Economic Theory of Political Action in a Democracy,” .
Geoghagan, A. D. (2007): “Felony Disenfranchisement Legislation: A Test of the GroupThreat Hypothesis,” ‘.
Gerber, A. S., G. A. Huber, M. Meredith, D. R. Biggers, and D. J. Hendry (2017): “DoesIncarceration Reduce Voting? Evidence about the Political Consequences of SpendingTime in Prison,” The Journal of Politics, 79, 1130–1146.
Hajnal, Z., N. Lajevardi, and L. Nielson (2017): “Voter Identification Laws and theSuppression of Minority Votes,” The Journal of Politics, 79, 363–379.
Haygood, R. P. (2011): “Disregarding the Results: Examining the Ninth Circuit’s HeightenedSection 2 Intentional Discrimination Standard in Farrakhan V. Gregoire,” Colum. L. Rev.Sidebar, 111, 51.
Hicks, W. D., S. C. McKee, M. D. Sellers, and D. A. Smith (2015): “A Principle or aStrategy? Voter Identification Laws and Partisan Competition in the American States,”Political Research Quarterly, 68, 18–33.
Hjalmarsson, R. and M. Lopez (2010): “The voting behavior of young disenfranchisedfelons: Would they vote if they could?” American Law and Economics Review, 356–393.
Hur, A. and C. H. Achen (2013): “Coding Voter Turnout Responses in the CurrentPopulation Survey,” Public Opinion Quarterly, 77, 985–993.
Jacobson, G. C. (2015): “It’s Nothing Personal: The Decline of the Incumbency Advantagein US House Elections,” The Journal of Politics, 77, 861–873.
13
Karlan, P. S. (2003): “Convictions and doubts: retribution, representation, and the debateover felon disenfranchisement,” Stan. L. Rev., 56, 1147.
Keyssar, A. (2000): Right to vote, Basic Books.
Klumpp, T., H. M. Mialon, and M. A. Williams (2017): “The Voting Rights of Ex-Felonsand Election Outcomes in the United States,” ‘.
Lee, D. S. (2008): “Randomized experiments from non-random selection in U.S. Houseelections,” Journal of Econometrics, 142, 675–697.
Manning, J. E. and C. J. Shogan (2012): “African American Members of the United StatesCongress: 1870-2012,” Congressional Research Service, 1–66.
Manza, J. and C. Uggen (2008): Locked out: Felon disenfranchisement and American democracy,Oxford University Press.
Meredith, M. and M. Morse (2014): “Do voting rights notification laws increase ex-felonturnout?” The ANNALS of the American Academy of Political and Social Science, 651, 220–249.
——— (2017): “Discretionary Disenfranchisement: The Case of Legal Financial Obligations,”The Journal of Legal Studies, 46, 309–338.
National Association of State Legislatures (2017): “National Association of StateLegislatures Website,” https://www.ncsl.org, accessed: 2017-05-29.
Persson, T. and G. Tabellini (2002): Political Economics: Explaining Economic Policy, PoliticalEconomics, MIT Press.
Rocha, R. R., C. J. Tolbert, D. C. Bowen, and C. J. Clark (2010): “Race and turnout:Does descriptive representation in state legislatures increase minority voting?” PoliticalResearch Quarterly.
Schall, J. (2006): “The Consistency of Felon Disenfranchisement with Citizenship Theory,”Harv. BlackLetter LJ, 22, 53.
Shannon, S. K., C. Uggen, J. Schnittker, M. Thompson, S. Wakefield, and M. Massoglia
(2017): “The Growth, Scope, and Spatial Distribution of People With Felony Records inthe United States, 1948–2010,” Demography, 54, 1795–1818.
Temin, P. (2017): “The Political Economy of Mass Incarceration: An Analytical Model,” .
Uggen, C., R. Larson, and S. Shannon (2016): “6 Million Lost Voters: State-Level Estimatesof Felony Disenfranchisement, 2016,” Tech. rep., The Sentencing Project: Research andadvocacy for reform.
Uhlaner, C. J. and B. Scola (2015): “Collective Representation as a Mobilizer:Race/Ethnicity, Gender, and Their Intersections at the State Level,” State Politics andPolicy Quarterly.
USDoC, BoC, USDoL, and BoLS (1985–2014): “Current Population Survey: Voting andRegistration Supplement,” Https://doi.org/10.3886/ICPSR03182.v3.
Washington, E. (2006): “How black candidates affect voter turnout,” Quarterly Journal ofEconomics, 121, 973–998.
14
0
10
20
1948 1970 1990 2010Year
Per
cent
age
over
Vot
ing
Age
Pop
ulat
ion
(VA
P)
Trend AA VAP Felony AA VAP Prison Total VAP Felony Total VAP Prison
Total and African American Felony & Prison records over Voting Age Population (%) (ex & current)
Figure 1: The Growth in the Incarceration Rate 1948-2010
Data from Shannon et al. (2017)
TX
CA
MTMIID
AZ
NV
OR
CO
NM
SD
UT KSIL
WY
MN
NE
ND
WI
IA
WA
FL
OK
MO
NYPA
GA
NC
ALAR
LA
IN
VA
OH
MS
TNKY
ME
SC
WVNJ
VT
MD
NHMACT
DE
RI
Disenfranchisement laws in 1996Ease
Inmates' permit to voteRestoration after incarcerationRestration after prison, parole, probationRestoration by special clemency
Existing state laws on Felony Disenfranchisement in 1996*
Figure 2: Current Felon Disenfranchisement Laws (1996)
As of end 1996. Alaska re-enfranchises citizens after Prison, Parole, and Probation. Hawaii after Prison.
15
TX
CA
MTMIID
AZ
NV
OR
CO
NM
SD
UT KS
WY
IL
MN
NE
ND
WI
IA
WA
FL
OK
MO
NYPA
GA
NC
ALAR
LA
IN
VA
OH
MS
TNKY
ME
SC
WVNJ
VT
MD
NHMACT
DERI
Disenfranchisement laws in 2016Ease
Inmates' permit to voteRestoration after incarcerationRestoration after prison, parole, probationRestoration by special clemency
Existing state laws on Felony Disenfranchisement in 2016*
Figure 3: Current Felon Disenfranchisement Laws (2017)
As of end 2017. Alaska re-enfranchises citizens after Prison, Parole, and Probation. Hawaii after Prison.
.5
.55
.6
.65
.7
Turn
out
1980 1990 2000 2010 2020Survey year
Not Treated Pre-Treatment
Figure 4: Parallel Trends Plot: Restoration
Data are from CPS.
16

.5
.55
.6
.65
.7
Turn
out
1980 1990 2000 2010 2020Survey year
Not Treated Pre-Treatment
Figure 5: Parallel Trends Plot: Extension
Data are from CPS.
.5
.55
.6
.65
Turn
out
1980 1990 2000 2010 2020Survey year
Not Treated Pre-Treatment
Figure 6: Parallel Trends Plot: Restriction
Data are from CPS.
17
(1) (2) (3) (4) (5) (6)
Black 0.03*** -6.57*** 0.04*** 0.04*** 0.04*** 0.05***(0.01) (0.85) (0.01) (0.01) (0.01) (0.01)
Enfranchisement 0.00 0.01 0.00
(0.01) (0.01) (0.01)Black× Enfranchisement 0.04*** 0.02** 0.01**
(0.01) (0.01) (0.01)Woman -0.00** -0.00* -0.01*** -0.01*** -0.01*** -0.01***
(0.00) (0.00) (0.00) (0.00) (0.00) (0.00)Age 0.04*** 0.04***
(0.00) (0.00)Black×Woman -0.05*** -0.05*** -0.05*** -0.05*** -0.05*** -0.05***
(0.00) (0.00) (0.00) (0.00) (0.00) (0.00)Black×Age -0.00*** -0.00***
(0.00) (0.00)Restoration 0.00
(0.01)Black× Restoration 0.01
(0.01)Extension 0.01
(0.01)Black× Extension 0.01
(0.02)Restrictions -0.00
(0.02)Black× Restrictions -0.03**
(0.01)
Year Effects Yes RST RS RS RS RSState Effects Yes Yes Yes Yes Yes YesControls Linear Linear Saturated Saturated Saturated SaturatedObservations 1817218 1817218 1817218 1817218 1817218 1817218
Note: The dependent variable is an individual’s decision to vote. RS denote race-specific stochastic time trends. RSTrefers to race-specific linear time trends. Linear controls implies that categorical variables are treated as continuous.Saturated means that we include a separate binary regressor for each level of the categorical variable.
* p < 0.1, ** p < 0.05, *** p < 0.01. Standard errors, clustered by state in parentheses
Table 1: The impact of felony disenfranchisement reform on turnout: Individual Level Data
18
(1) (2) (3) (4) (5) (6)
Enfranchisement 0.07*** 0.01** 0.02***(0.01) (0.01) (0.01)
Black× Enfranchisement 0.06*** 0.04*** 0.02***(0.01) (0.01) (0.01)
Restoration 0.02
(0.01)Black× Restoration 0.03**
(0.01)Extension 0.01
(0.01)Black× Extension 0.03**
(0.01)Restrictions -0.03***
(0.01)Black× Restrictions -0.01
(0.01)Constant 0.55*** 0.43*** 0.47*** 0.47*** 0.47*** 0.47***
(0.00) (0.01) (0.02) (0.02) (0.02) (0.02)
State Effects State State State State State StateTime Trends No Stochastic RS RS RS RSObservations 37905 37905 37905 37905 37905 37905
Note: The unit of analysis is a cohort defined by each combination of County, Year of Birth, Gender, and Race. Thedependent variable is the average turnout rate by cohort. All specifications include cohort fixed-effects. RS denotethat race-specific stochastic time trends are included. RST refers to race-specific linear time trends.
* p < 0.1, ** p < 0.05, *** p < 0.01. Standard errors, clustered by state in parentheses
Table 2: The impact of felony disenfranchisement reform on turnout: State Level Estimates
19
(1) (2) (3) (4) (5) (6)
Enfranchisement 0.07*** 0.01** 0.01**(0.00) (0.00) (0.00)
Black× Enfranchisement 0.03*** 0.02*** 0.01*(0.01) (0.01) (0.01)
Restoration 0.02*(0.01)
Black× Restoration 0.01
(0.02)Extension 0.01
(0.01)Black× Extension 0.00
(0.01)Restrictions -0.01
(0.01)Black× Restrictions -0.03*
(0.02)Constant 0.56*** 0.38*** 0.41*** 0.41*** 0.41*** 0.41***
(0.00) (0.02) (0.02) (0.02) (0.02) (0.02)
State Effects County County County County County CountyTime Trends No Stochastic RS RS RS RSPeriod All All All All All AllObservations 108187 108187 108187 108187 108187 108187
Note: The unit of analysis is a cohort defined by each combination of County, Year of Birth, Gender, and Race. Thedependent variable is the average turnout rate by cohort. All specifications include cohort fixed-effects. RS denotethat race-specific stochastic time trends are included. RST refers to race-specific linear time trends.
* p < 0.1, ** p < 0.05, *** p < 0.01. Standard errors, clustered by state in parentheses
Table 3: The impact of felony disenfranchisement reform on turnout: County Level Estimates
20
(1)
(2)
(3)
(4)
(5)
(6)
(7)
(8)
(9)
Enfr
anch
isem
ent
0.0
20.0
1-0
.05
0.0
00.0
7∗∗∗
-0.0
4
(0.0
4)
(0.0
2)
(0.0
4)
(0.0
8)
(0.0
2)
(0.0
3)
Blac
k×
Enfr
anch
isem
ent
0.0
1∗∗∗
0.0
1∗∗
0.0
2∗∗∗
0.0
2∗∗∗
0.0
10.0
1∗
(0.0
1)
(0.0
1)
(0.0
1)
(0.0
1)
(0.0
1)
(0.0
1)
Blac
k×
Age
0.0
4∗∗∗
0.0
4∗∗∗
0.0
4∗∗∗
0.0
4∗∗∗
(0.0
0)
(0.0
0)
(0.0
0)
(0.0
0)
Res
tora
tion
-0.0
2
(0.0
4)
Blac
k×
Res
tora
tion
0.0
1
(0.0
1)
Exte
nsio
n0
.00
(0.0
6)
Blac
k×
Exte
nsio
n0
.01
(0.0
1)
Res
tric
tion
s-0
.01
(0.0
4)
Blac
k×
Res
tric
tion
s-0
.02∗∗
(0.0
1)
Inte
ract
ive
Fixe
dEf
fect
sSt
ate,
Year
Cou
nty,
Year
Stat
e,Ye
arSt
ate,
Year
Cou
nty,
Year
Cou
nty,
Year
Cou
nty,
Year
Cou
nty,
Year
Cou
nty,
Year
Con
trol
sN
one
Non
eSa
tura
ted
Satu
rate
dSa
tura
ted
Satu
rate
dSa
tura
ted
Satu
rate
dSa
tura
ted
Dim
ensi
on1
11
21
21
11
Obs
erva
tion
s108187
108187
108187
108187
108187
108187
108187
108187
108187
Not
e:T
heu
nit
ofan
alys
isis
aco
hort
.T
hese
are
defi
ned
byea
chco
mbi
nati
onof
Stat
e,Ye
arof
Bir
th,G
end
er,a
ndR
ace
(col
um
ns1,3
,4)
orC
ount
y,Ye
arof
Birt
h,G
ende
r,an
dR
ace
(col
umns
2,5
-9).
The
depe
nden
tva
riab
leis
the
aver
age
turn
out
rate
byco
hort
.A
llre
sult
sar
eob
tain
edus
ing
the
Inte
ract
ive
Fixe
d-Ef
fect
ses
tim
ator
ofBa
i(2
00
9).
*p<
0.1,
**p<
0.05
,***
p<
0.01
.Boo
tstr
appe
dSt
anda
rder
rors
inpa
rent
hese
s
Tabl
e4:T
heim
pact
offe
lony
dise
nfra
nchi
sem
ent
refo
rmon
turn
out:
Inte
ract
ive
Fixe
dEf
fect
sEs
tim
ates
21
0
5
10
15
20
Den
sity
0 .2 .4 .6 .8 1Percentage of African-American State U.S. Representatives
0
1
2
3
4
Den
sity
0 1 2 3 4 5Number of African-American State U.S. Representatives
Figure 7: Number and Seat-Share of African-American U.S. Representatives(2017)
(1) (2) (3) (4) (5)
Enfranchisementt 0.21∗∗∗
0.08∗∗
0.09 0.03 0.04
(0.07) (0.03) (0.08) (0.03) (0.03)Enfranchisementt−1 0.09
∗0.06 0.08 0.07 0.07
(0.05) (0.05) (0.06) (0.05) (0.06)Enfranchisementt−2 0.06 -0.00 -0.06 -0.02 -0.01
(0.11) (0.06) (0.09) (0.06) (0.06)
Year Effects No No Yes Yes YesStateEffects Yes Yes Yes Yes YesControls Poisson FE Poisson FE IFEObservations 513 912 513 912 912
Note: The dependent variable is the number of black representatives elected by each state to the U.S. House. Allstates.
* p < 0.1, ** p < 0.05, *** p < 0.01. Standard errors, clustered by state in parentheses.
Table 5: The impact of felony disenfranchisement reform on the number of black membersof the state delegation to the US House of Representatives.
22
(1)
(2)
(3)
(4)
(5)
(6)
(7)
(8)
(9)
Enfr
anch
isem
ent t
0.1
2∗∗
0.1
2∗∗
0.0
60.1
8∗∗
0.1
9∗∗
0.1
00
.02
0.0
1-0
.02
(0.0
6)
(0.0
6)
(0.0
5)
(0.0
7)
(0.0
7)
(0.0
6)
(0.0
6)
(0.0
5)
(0.0
5)
Enfr
anch
isem
ent t−
10.1
4∗∗∗
0.1
4∗∗∗
0.0
7∗∗
0.1
8∗∗∗
0.2
0∗∗∗
0.0
9∗
0.0
30
.01
-0.0
2
(0.0
5)
(0.0
5)
(0.0
3)
(0.0
7)
(0.0
7)
(0.0
5)
(0.0
5)
(0.0
5)
(0.0
5)
Enfr
anch
isem
ent t−
20.1
5∗∗∗
0.1
5∗∗
0.0
6∗∗
0.2
0∗∗∗
0.2
1∗∗∗
0.0
9∗∗
0.0
50
.03
0.0
1
(0.0
6)
(0.0
6)
(0.0
3)
(0.0
7)
(0.0
7)
(0.0
4)
(0.0
5)
(0.0
5)
(0.0
5)
Pres
Elec
tion
Year
0.0
00.0
0-0
.00
-0.0
5∗∗
0.0
10
.05∗
(0.0
1)
(0.0
2)
(0.0
1)
(0.0
2)
(0.0
1)
(0.0
3)
Year
Effe
cts
No
Yes
Yes
No
Yes
Yes
No
Yes
Yes
Stat
eEff
ects
Yes
Yes
Yes
Yes
Yes
Yes
Yes
Yes
Yes
Con
trol
sN
oN
oN
oN
oN
oN
oN
oN
oN
oEs
tim
ator
FEFE
IFE
FEFE
IFE
FEFE
IFE
Obs
erva
tion
s864
864
864
864
864
864
864
864
864
Not
e:Th
ede
pend
entv
aria
ble
isth
ees
timat
edst
ate
polic
ylib
eral
ism
inde
xof
Cau
ghey
and
War
shaw
(20
15)
inco
lum
ns1
–3.C
olum
ns4
–6re
port
resu
ltsus
ing
the
stat
eso
cial
polic
ylib
eral
ism
,col
umns
7–9
the
stat
eec
onom
icpo
licy
liber
alis
m.B
oth
mea
sure
sar
ede
velo
ped
inC
augh
eyan
dW
arsh
aw(2
01
7)
in.A
llst
ates
.
*p<
0.1,
**p<
0.05
,***
p<
0.01
.Sta
ndar
der
rors
,clu
ster
edby
stat
ein
pare
nthe
ses.
Tabl
e6:T
heim
pact
offe
lony
dise
nfra
nchi
sem
ent
refo
rmon
stat
epo
licy
liber
alis
m.
23
A Additional Tables and Figures
Texa
sU
tah
Ver
mon
tV
irgin
iaW
est V
irgin
iaW
yom
ing
Nor
th D
akot
aO
rego
nP
enns
ylva
nia
Sou
th C
arol
ina
Sou
th D
akot
aTe
nnes
see
Mis
sour
iM
onta
naN
ebra
ska
Nev
ada
New
Yor
kN
orth
Car
olin
a
Ken
tuck
yLo
uisi
ana
Mai
neM
aryl
and
Mic
higa
nM
issi
ssip
pi
Ala
bam
aA
rkan
sas
Col
orad
oD
elaw
are
Geo
rgia
Idah
o
1980
2010
1980
2010
1980
2010
1980
2010
1980
2010
1980
2010
01525 01525 01525 01525 01525
Year
% of Voting Age Population
Tren
dTo
tal B
lack
Fel
ons
Tota
l Fel
ons
Tota
l and
Afr
ican
Am
eric
an F
elon
y &
Pris
on r
ecor
ds o
ver
Vot
ing
Age
Pop
ulat
ion
(%)
Figure A.1: The Growth in the Felony Conviction Rate 1980-2010 by State
A.0
AL
AR AZ
CA
CO
CT
DE
FLGA
IA
ID
ILIN
KS
KYLA
MA
MDME
MI
MN
MO
MS
MT
NC
ND
NE
NH
NJ
NM
NV
NY
OH
OK
ORPA
RI
SCSD
TNTX
UT
VA
VT
WA
WI
WV
WY
-2-1
01
23
estim
ated
eco
nom
ic p
olic
y lib
eral
ism
-3 -2 -1 0 1 2estimated social policy liberalism
Figure A.2: The Caughey and Warshaw (2017) State Policy Data
Data are for 2008.
A.1
.4
.5
.6
.7
.8
Turn
out C
ondi
tiona
l on
Pres
iden
tial Y
ear D
umm
y
1980 1990 2000 2010 2020Survey year
Not Treated Pre-Treatment
Figure A.3: Unconditional Parallel Trends Plot: Restoration
Data are from CPS.
A.2
.45
.5
.55
.6
.65
.7
Turn
out C
ondi
tiona
l on
Pres
iden
tial Y
ear D
umm
y
1980 1990 2000 2010 2020Survey year
Not Treated Pre-Treatment
Figure A.4: Unconditional Parallel Trends Plot: Extension
Data are from CPS.
A.3
.5
.55
.6
.65
.7
Turn
out C
ondi
tiona
l on
Pres
iden
tial Y
ear D
umm
y
1980 1990 2000 2010 2020Survey year
Not Treated Pre-Treatment
Figure A.5: Unconditional Parallel Trends Plot: Restriction
Data are from CPS.
A.4
(1)
(2)
(3)
(4)
(5)
(6)
(7)
(8)
(9)
Enfr
anch
isem
ent t
0.1
0∗
0.1
0∗
0.0
50.1
6∗∗
0.1
6∗∗
0.0
8-0
.00
-0.0
0-0
.03
(0.0
6)
(0.0
5)
(0.0
5)
(0.0
7)
(0.0
7)
(0.0
6)
(0.0
5)
(0.0
5)
(0.0
5)
Enfr
anch
isem
ent t−
10.1
3∗∗∗
0.1
3∗∗∗
0.0
6∗
0.1
7∗∗∗
0.1
8∗∗∗
0.0
8∗
0.0
10
.00
-0.0
2
(0.0
5)
(0.0
5)
(0.0
3)
(0.0
6)
(0.0
6)
(0.0
5)
(0.0
5)
(0.0
4)
(0.0
4)
Enfr
anch
isem
ent t−
20.1
2∗∗
0.1
2∗∗
0.0
5∗
0.1
8∗∗∗
0.1
9∗∗∗
0.0
8∗∗
0.0
20
.01
-0.0
2
(0.0
5)
(0.0
6)
(0.0
3)
(0.0
6)
(0.0
6)
(0.0
4)
(0.0
5)
(0.0
5)
(0.0
4)
Pres
Elec
tion
Year
0.0
00.0
4∗
-0.0
00
.00
-0.0
2-0
.01
0.0
10
.09∗∗∗
0.0
0
(0.0
1)
(0.0
2)
(0.0
1)
(0.0
1)
(0.0
3)
(0.0
1)
(0.0
1)
(0.0
3)
(0.0
3)
(mea
n)A
gede
f0.0
90.2
6∗∗
0.1
00
.05
0.2
4∗
0.1
00.1
00
.22∗
0.1
8
(0.0
9)
(0.1
1)
(0.0
9)
(0.1
1)
(0.1
3)
(0.1
3)
(0.0
9)
(0.1
3)
(0.1
2)
(mea
n)Ed
ucLe
vel
-0.0
30.1
60.0
10
.01
-0.2
10
.03
-0.1
1∗
0.5
70
.49
(0.0
6)
(0.4
8)
(0.0
7)
(0.0
7)
(0.5
6)
(0.0
9)
(0.0
6)
(0.4
3)
(0.3
1)
(mea
n)in
c0.0
10
.41∗∗
0.0
4-0
.02
0.2
50
.02
0.0
60.3
3∗
0.2
1∗
(0.0
4)
(0.1
8)
(0.0
3)
(0.0
4)
(0.2
2)
(0.0
4)
(0.0
4)
(0.1
9)
(0.1
1)
Year
Effe
cts
No
Yes
Yes
No
Yes
Yes
No
Yes
Yes
Stat
eEff
ects
Yes
Yes
Yes
Yes
Yes
Yes
Yes
Yes
Yes
Con
trol
sYe
sYe
sYe
sYe
sYe
sYe
sYe
sYe
sYe
sEs
tim
ator
FEFE
IFE
FEFE
IFE
FEFE
IFE
Obs
erva
tion
s816
816
816
816
816
816
816
816
816
Not
e:Th
ede
pend
entv
aria
ble
isth
ees
timat
edst
ate
polic
ylib
eral
ism
inde
xof
Cau
ghey
and
War
shaw
(20
15)
inco
lum
ns1
–3.C
olum
ns4
–6re
port
resu
ltsus
ing
the
stat
eso
cial
polic
ylib
eral
ism
,col
umns
7–9
the
stat
eec
onom
icpo
licy
liber
alis
m.B
oth
mea
sure
sar
ede
velo
ped
inC
augh
eyan
dW
arsh
aw(2
01
7)
in.A
llst
ates
.
*p<
0.1,
**p<
0.05
,***
p<
0.01
.Sta
ndar
der
rors
,clu
ster
edby
stat
ein
pare
nthe
ses.
Tabl
eA
.1:T
heim
pact
offe
lony
dise
nfra
nchi
sem
ent
refo
rmon
stat
epo
licy
liber
alis
m.
A.5
B State Level History
States Year of First Felon Disenfranchisement Laws Major Changes since1995
Alabama 1819* 2003, 2016
Alaska 1959+Arizona 1912+
Arkansas 1873*California 1849* 2016
Colorado 1876+Connecticut 1818* 2001
Delaware 1831* 2000, 2013
Florida 1838* 2007, 2011
Georgia 1868
Hawaii 1959+Idaho 1890+Illinois 1870
Indiana 1816*Iowa 1846* 2005, 2011
Kansas 1859+ 2002
Kentucky 1792+ 2015
Louisiana 1812*Maine NA
Maryland 1851* 2007, 2016
Massachusetts 2000 2000
Michigan 1963
Minnesota 1857*Mississippi 1817*
Missouri 1820*Montana 1909
Nebraska 1875 2005
Nevada 1864+ 2003, 2012
New Hampshire 1967
New Jersey 1844*New Mexico 1911+ 2001
New York 1821*North Carolina 1876
North Dakota 1889+Ohio 1802*
Oklahoma 1907+Oregon 1857*
Pennsylvania 1860
Rhode Island 1842* 2006
South Carolina 1868
South Dakota 1889+ 2012
Tennessee 1834* 2011
Texas 1845* 1996
Utah 1998 1998
Vermont 1793*Virginia 1830* 2013, 2016
Washington 1889+ 2007, 2009
West Virginia 1863+Wisconsin 1848*Wyoming 1890+ 2003, 2015
* States rattified criminal disenfranchisement in their constitutions, from state law search.+ Criminal disenfranchisement laws with Statehood, state law search.For the rest of the states see (Brooks, 2004).
B.0

C State Disenfranchisement Laws
Inmates’ Permitto Vote
Voting RestorationAfter Incarceration
Voting Restorationafter Prison, Parole &Probation
Voting Restoration bySpecial Clemency
Maine District of Columbia Alaska AlabamaMassachusetts Hawaii Arkansas Arizona*
Utah* Idaho California* DelawareVermont Illinois Colorado* Florida
Indiana Connecticut* IowaKansas Georgia Kentucky
Louisiana Minnesota Maryland*Michigan Nebraska* Mississippi*Missouri* New Jersey Nevada*Montana New York* New Mexico
New Hampshire North Carolina* Pennsylvania*North Dakota Oklahoma* Tennessee
Ohio Rhode Island VirginiaOregon South Carolina Washington
South Dakota Texas* WyomingWest Virginia
Wisconsin* Exceptions are listed Table C.2.
Table C.1: State Disenfranchisement Laws in 1996
C.0

States Exceptions in the current voting restoration processArizona 1st time offenders can have their voting rights restored automatically after
prison, parole and probation.California State law not clear on probationers’ rights to vote.Colorado State law not clear on probationers’ rights to vote.
Connecticut Proof of discharge is needed in order to restore voting rights.Maryland 1st time offenders can have their voting rights restored automatically after
prison, parole and probation.Mississippi Right to vote may also be restored by legislature or by administrative
procedure for certain veterans.Missouri The existing law applies except for election crimes.Nebraska Certificate of unconditional discharge is needed for voting rights restoration.Nevada Administrative process or court order can also restore voting rights to ex-
felons.New York State law not clear on probationers’ rights to vote.
North Carolina Certificate of unconditional discharge is needed for voting rights restoration.Oklahoma The existing law applies after a waiting period of equal length of the sentence.
Pennsylvania In 1995, an amendment to the Pennsylvania Voter Registration Act deniedvoting rights to the incarcerated felons within 5 years of release from prisonbut no such restrictions were imposed on felons who were registered to voteat the time they were sent to prison.
Texas 2 years waiting period is mandatory and a discharge certificate is needed inorder to restore voting rights.
Utah The existing law applies except for election crimes and treason.
Table C.2: State Disenfranchisement Laws in 1996: exceptions
Inmates’ Permitto Vote
Voting RestorationAfter Incarceration
Voting Restorationafter Prison, Parole &Probation
Voting Restoration bySpecial Clemency
Maine District of Columbia Alaska AlabamaVermont Hawaii Arkansas Arizona*
Illinois California* Florida*Indiana Colorado Iowa
Maryland* Connecticut Kentucky*Massachusetts Delaware* Mississippi*
Michigan Georgia Nevada*Montana Idaho Tennessee
New Hampshire Kansas Virginia*North Dakota Louisiana Wyoming*
Ohio MinnesotaOregon Missouri
Pennsylvania Nebraska*Rhode Island New Jersey
Utah New MexicoNew York*
North CarolinaOklahoma
South CarolinaSouth Dakota
TexasWashington
West VirginiaWisconsin*
* Exceptions are listed Table C.4.
Table C.3: State Disenfranchisement Laws in 2016
C.1
States Exceptions in the current voting restoration processArizona 1st time offenders can have their voting rights restored after prison, parole
and probation.California In 2016, a legislation was passed to allow the inmates in county jails but not
in state or federal jails.Delware People convicted of murder, bribery and sexual offenses are permanently
disenfranchised.Florida In 2018, a constitutional amendment was initiated to restore voting rights to
ex-felons. Persons convicted of murder or sexual offenses will have to petitionthe governor in order to restore their voting rights.
Kentucky People convicted for treason, felony or bribery in an election or any highmisdemeanor that the General Assembly may declare, will be permanentlydisenfranchised.
Maryland People convicted for buying and selling votes can only have their voting rightsrestored by special clemency.
Mississippi Persons convicted of murder, rape, bribery, theft, arson, obtaining money orgoods under false pretense, perjury, forgery, embezzlement or bigamy willbe disenfranchised permanently. They may still receive a pardon from thegovernor or by a two-thirds vote of both houses of the legislature. For otheroffenses rights are automatically restored after sentence completion.
Nebraska There is a compulsory two years waiting period after the sentence completionbefore restoration of voting rights.
Nevada 1st time offenders convicted of less serious crimes can have their voting rightsrestored after completion of sentence.
New York Governor Cuomo has passed an executive order restoring voting rights toparolees. Those on probation can vote in New York.
Virginia The Department of Corrections is required to provide information regardingvoting rights restoration to felons and assist the Governor with the review ofapplications. Individuals with felony convictions may petition the courts inorder to attempt to restore their voting rights.
Wisconsin If a person is convicted of treason, felony or bribery he or she is disqualifiedfrom voting unless the right is restored through pardon or Wisconsin statelegislature s. 304.078 (3). In other cases of convictions, the right to vote isrestored after imprisonment term or probation and the department of justiceor the county jailer will inform the person in writing of this at the time ofdischarge.
Wyoming First time offenders or persons convicted of non-violent felonies are eligiblefor automatic voting rights restoration after sentence completion.
Table C.4: State Disenfranchisement Laws in 2016: exceptions
C.2
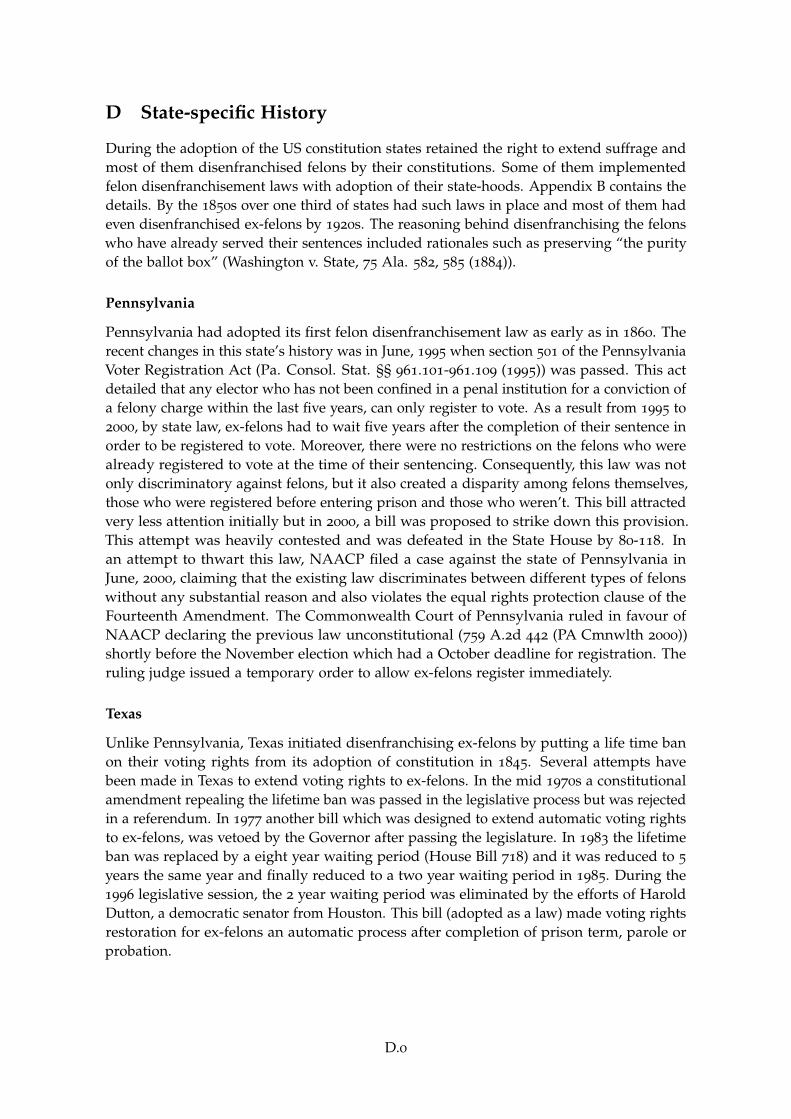
D State-specific History
During the adoption of the US constitution states retained the right to extend suffrage andmost of them disenfranchised felons by their constitutions. Some of them implementedfelon disenfranchisement laws with adoption of their state-hoods. Appendix B contains thedetails. By the 1850s over one third of states had such laws in place and most of them hadeven disenfranchised ex-felons by 1920s. The reasoning behind disenfranchising the felonswho have already served their sentences included rationales such as preserving “the purityof the ballot box” (Washington v. State, 75 Ala. 582, 585 (1884)).
Pennsylvania
Pennsylvania had adopted its first felon disenfranchisement law as early as in 1860. Therecent changes in this state’s history was in June, 1995 when section 501 of the PennsylvaniaVoter Registration Act (Pa. Consol. Stat. §§ 961.101-961.109 (1995)) was passed. This actdetailed that any elector who has not been confined in a penal institution for a conviction ofa felony charge within the last five years, can only register to vote. As a result from 1995 to2000, by state law, ex-felons had to wait five years after the completion of their sentence inorder to be registered to vote. Moreover, there were no restrictions on the felons who werealready registered to vote at the time of their sentencing. Consequently, this law was notonly discriminatory against felons, but it also created a disparity among felons themselves,those who were registered before entering prison and those who weren’t. This bill attractedvery less attention initially but in 2000, a bill was proposed to strike down this provision.This attempt was heavily contested and was defeated in the State House by 80-118. Inan attempt to thwart this law, NAACP filed a case against the state of Pennsylvania inJune, 2000, claiming that the existing law discriminates between different types of felonswithout any substantial reason and also violates the equal rights protection clause of theFourteenth Amendment. The Commonwealth Court of Pennsylvania ruled in favour ofNAACP declaring the previous law unconstitutional (759 A.2d 442 (PA Cmnwlth 2000))shortly before the November election which had a October deadline for registration. Theruling judge issued a temporary order to allow ex-felons register immediately.
Texas
Unlike Pennsylvania, Texas initiated disenfranchising ex-felons by putting a life time banon their voting rights from its adoption of constitution in 1845. Several attempts havebeen made in Texas to extend voting rights to ex-felons. In the mid 1970s a constitutionalamendment repealing the lifetime ban was passed in the legislative process but was rejectedin a referendum. In 1977 another bill which was designed to extend automatic voting rightsto ex-felons, was vetoed by the Governor after passing the legislature. In 1983 the lifetimeban was replaced by a eight year waiting period (House Bill 718) and it was reduced to 5
years the same year and finally reduced to a two year waiting period in 1985. During the1996 legislative session, the 2 year waiting period was eliminated by the efforts of HaroldDutton, a democratic senator from Houston. This bill (adopted as a law) made voting rightsrestoration for ex-felons an automatic process after completion of prison term, parole orprobation.
D.0
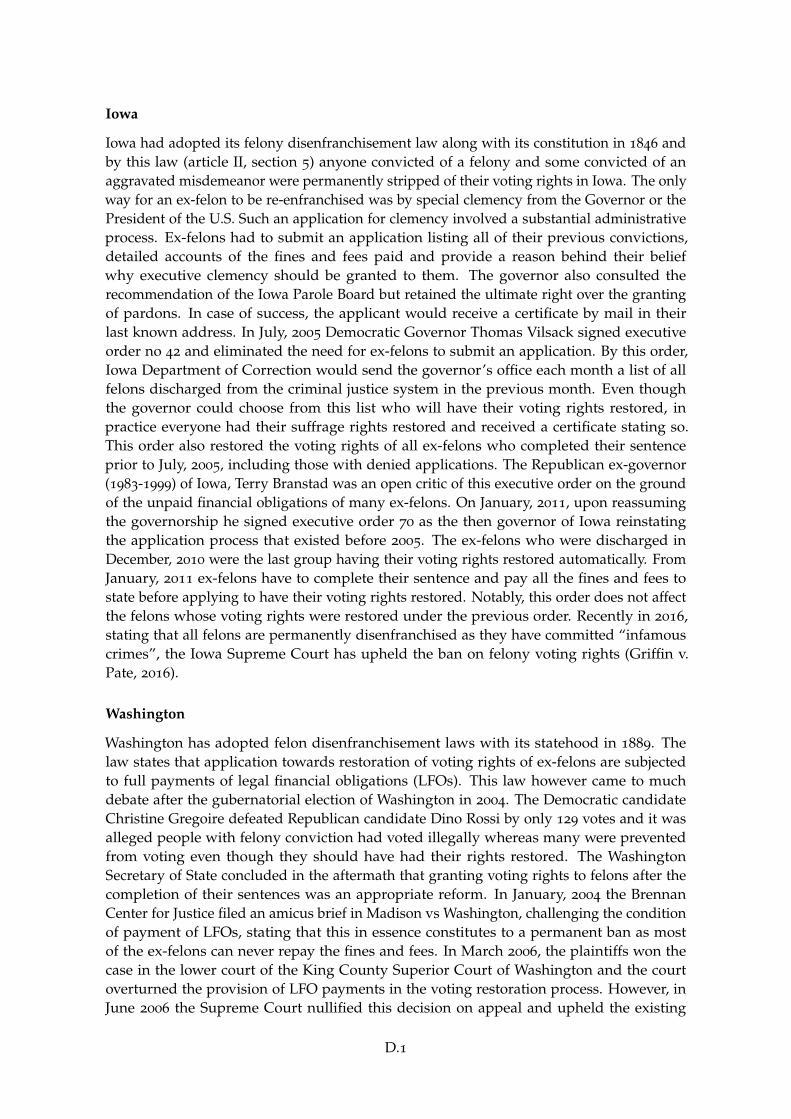
Iowa
Iowa had adopted its felony disenfranchisement law along with its constitution in 1846 andby this law (article II, section 5) anyone convicted of a felony and some convicted of anaggravated misdemeanor were permanently stripped of their voting rights in Iowa. The onlyway for an ex-felon to be re-enfranchised was by special clemency from the Governor or thePresident of the U.S. Such an application for clemency involved a substantial administrativeprocess. Ex-felons had to submit an application listing all of their previous convictions,detailed accounts of the fines and fees paid and provide a reason behind their beliefwhy executive clemency should be granted to them. The governor also consulted therecommendation of the Iowa Parole Board but retained the ultimate right over the grantingof pardons. In case of success, the applicant would receive a certificate by mail in theirlast known address. In July, 2005 Democratic Governor Thomas Vilsack signed executiveorder no 42 and eliminated the need for ex-felons to submit an application. By this order,Iowa Department of Correction would send the governor’s office each month a list of allfelons discharged from the criminal justice system in the previous month. Even thoughthe governor could choose from this list who will have their voting rights restored, inpractice everyone had their suffrage rights restored and received a certificate stating so.This order also restored the voting rights of all ex-felons who completed their sentenceprior to July, 2005, including those with denied applications. The Republican ex-governor(1983-1999) of Iowa, Terry Branstad was an open critic of this executive order on the groundof the unpaid financial obligations of many ex-felons. On January, 2011, upon reassumingthe governorship he signed executive order 70 as the then governor of Iowa reinstatingthe application process that existed before 2005. The ex-felons who were discharged inDecember, 2010 were the last group having their voting rights restored automatically. FromJanuary, 2011 ex-felons have to complete their sentence and pay all the fines and fees tostate before applying to have their voting rights restored. Notably, this order does not affectthe felons whose voting rights were restored under the previous order. Recently in 2016,stating that all felons are permanently disenfranchised as they have committed “infamouscrimes”, the Iowa Supreme Court has upheld the ban on felony voting rights (Griffin v.Pate, 2016).
Washington
Washington has adopted felon disenfranchisement laws with its statehood in 1889. Thelaw states that application towards restoration of voting rights of ex-felons are subjectedto full payments of legal financial obligations (LFOs). This law however came to muchdebate after the gubernatorial election of Washington in 2004. The Democratic candidateChristine Gregoire defeated Republican candidate Dino Rossi by only 129 votes and it wasalleged people with felony conviction had voted illegally whereas many were preventedfrom voting even though they should have had their rights restored. The WashingtonSecretary of State concluded in the aftermath that granting voting rights to felons after thecompletion of their sentences was an appropriate reform. In January, 2004 the BrennanCenter for Justice filed an amicus brief in Madison vs Washington, challenging the conditionof payment of LFOs, stating that this in essence constitutes to a permanent ban as mostof the ex-felons can never repay the fines and fees. In March 2006, the plaintiffs won thecase in the lower court of the King County Superior Court of Washington and the courtoverturned the provision of LFO payments in the voting restoration process. However, inJune 2006 the Supreme Court nullified this decision on appeal and upheld the existing
D.1
law. In April 2009 House Bill 1517 which allowed ex-felons to regain their voting rightsupon completion of their sentences, including prison, parole and probation, passed theWashington State House and Senate. This bill allowed for voting rights restoration withoutrequiring the ex-felons to pay their LFOSs. Governor Gregoire signed the bill in May 2009
and in July 2009 it became effective as a law.
Virginia
The state that had seen the most debate regarding its felony disenfranchisement laws inthe last decade is probably Virginia. The constitution of Virginia (1830) states that anyonewho is convicted of a felony is denied their voting rights until the governor or any otherappropriate authority reinstates it through an application process. On June, 2014 GovernorTerry McAuliffe removed the application process regarding the voting rights restorationof ex-felons. Under the new rules, felons convicted of non-violent crimes (includingdrug crimes) can automatically regain their voting rights once they have completed theirsentences (prison, parole and probation), paid all court fees and are not the subject ofpending felony charges. In April, 2016 he signed an order restoring the voting rights toalmost 200,000 Virginian felons who have completed their incarceration term, parole orprobation, irrespective of their charges. This order was overruled by Virginia SupremeCourt three months later in a 4-3 decision with the conclusion that this executive order wasunconstitutional and restoration of voting rights should be an individual process. GovernorMcAuliffe subsequently continued to sign individual orders restoring the vote to ex-felons.
Subsequent to the period we study several other states have relaxed FD laws. In 2017,Wyoming enacted a House Bill (75) automatically restoring the voting rights of non-violentfelons. Alabama House Bill 282 created a list of felonies that disqualifies a person fromvoting in 2017. New York Governor Andrew Cuomo issued an executive order providingvoting rights to the parolees in 2018, whereas Colorado Senate Bill 150 of 2018 also gavesimilar rights to individuals on parole.
D.2


![[PPT]LOCKING UP THE VOTE: Felon Disenfranchisement …johnjay.jjay.cuny.edu/files/UggenManzaJune2006.ppt · Web viewThe Project What are the origins of voting restrictions on the](https://img.pdfslide.us/doc/110x75/5b2199337f8b9ad0448b4955/pptlocking-up-the-vote-felon-disenfranchisement-web-viewthe-project-what.jpg)