Embed Size (px)
Citation preview
RESEARCH Open Access
On the pitfalls of PTV in lung SBRT usingtype-B dose engine: an analysis of PTV andworst case scenario concepts for treatmentplan optimizationRonnie Wing King Leung1†, Mark Ka Heng Chan2,3*† , Chi-Leung Chiang4, Matthew Wong1 and Oliver Blanck3
Abstract
Background: PTV concept is presumed to introduce excessive and inconsistent GTV dose in lung stereotactic bodyradiotherapy (SBRT). That GTV median dose prescription (D50) and robust optimization are viable PTV–free solution(ICRU 91 report) to harmonize the GTV dose was investigated by comparisons with PTV–based SBRT plans.
Methods: Thirteen SBRT plans were optimized for 54 Gy / 3 fractions and prescribed (i) to 95% of the PTV (D95)expanded 5mm from the ITV on the averaged intensity project (AIP) CT, i.e., PTVITV, (ii) to D95 of PTV derived from thevan Herk (VH)‘s margin recipe on the mid–ventilation (MidV)–CT, i.e., PTVVH, (iii) to ITV D98 by worst case scenario (WCS)optimization on AIP,i.e., WCSITV and (iv) to GTV D98 by WCS using all 4DCT images, i.e., WCSGTV. These plans weresubsequently recalculated on all 4DCT images and deformably summed on the MidV–CT. The dose differencesbetween these plans were compared for the GTV and selected normal organs by the Friedman tests while thevariability was compared by the Levene’s tests. The phase–to–phase changes of GTV dose through the respiration wereassessed as an indirect measure of the possible increase of photon fluence owing to the type–B dose engine. Finally,all plans were renormalized to GTV D50 and all the dosimetric analyses were repeated to assess the relative influencesof the SBRT planning concept and prescription method on the variability of target dose.
(Continued on next page)
© The Author(s). 2020 Open Access This article is licensed under a Creative Commons Attribution 4.0 International License,which permits use, sharing, adaptation, distribution and reproduction in any medium or format, as long as you giveappropriate credit to the original author(s) and the source, provide a link to the Creative Commons licence, and indicate ifchanges were made. The images or other third party material in this article are included in the article's Creative Commonslicence, unless indicated otherwise in a credit line to the material. If material is not included in the article's Creative Commonslicence and your intended use is not permitted by statutory regulation or exceeds the permitted use, you will need to obtainpermission directly from the copyright holder. To view a copy of this licence, visit http://creativecommons.org/licenses/by/4.0/.The Creative Commons Public Domain Dedication waiver (http://creativecommons.org/publicdomain/zero/1.0/) applies to thedata made available in this article, unless otherwise stated in a credit line to the data.
* Correspondence: [email protected]†Ronnie Wing Kin Leung and Mark Ka Heng Chan are Co-first authors withequal contribution.2Department of Radiotherapy, West German Cancer Center, UniversityHospital Essen, University of Duisburg-Essen, Hufelandstraße 55, 45147 Essen,Germany3Department of Radiotherapy, University Hospital Essen, Kiel Campus, 24105Kiel, GermanyFull list of author information is available at the end of the article
Leung et al. Radiation Oncology (2020) 15:130 https://doi.org/10.1186/s13014-020-01573-9
(Continued from previous page)
Results: By coverage prescriptions (i) to (iv), significantly smaller chest wall volume receiving ≥30 Gy (CWV30) andnormal lung ≥20 Gy (NLV20Gy) were achieved by WCSITV and WCSGTV compared to PTVITV and PTVVH (p > 0.05). Theseplans differed significantly in the recalculated and summed GTV D2, D50 and D98 (p < 0.05). The inter–patient variabilityof all GTV dose parameters is however equal between these plans (Levene’s tests; p > 0.05). Renormalizing these plansto GTV D50 reduces their differences in GTV D2, and D98 to insignificant level (p > 0.05) and their inter–patient variabilityof all GTV dose parameters. None of these plans showed significant differences in GTV D2, D50 and D98 betweenrespiratory phases, nor their inter–phase variability is significant.
Conclusion: Inconsistent GTV dose is not unique to PTV concept but occurs to other PTV–free concept in lung SBRT.GTV D50 renormalization effectively harmonizes the target dose among patients and SBRT concepts of geometricuncertainty management.
IntroductionStereotactic body radiotherapy (SBRT) for non–smallcell lung carcinomas (NSCLC) is typically delivered infree breathing condition. To limit the negative impactof respiration–induced organ motion and setup errorson its clinical benefits, passive motion management isoften pursued, using either the internal target volume(ITV) concept or the mid–ventilation (MidV) concept[1]. Alternatively, passive motion management canalso be realized by direct incorporation of the tumormotion into the four–dimensional (4D) optimizationframework [2].Regardless of the motion management techniques and
setup uncertainty, dose optimization and prescriptionare invariably performed with respect to the planningtarget volume (PTV) to ensure, for instances, 95 and99% PTV coverage by 100 and 90% of the prescriptiondose (i.e., PTV D95 = 100% and D99 = 90%). As suggestedby Lebredonchel et al. [3], when type–B and MonteCarlo (MC) dose algorithms that model lateral electronicequilibrium (LED) are directly used to optimize to PTVD95 a high flux of photon fluence would have to be de-posited in the low density lung tissue surrounding thegross tumor volume (GTV). As a consequence, increaseof dose in the lung may occur. Worse still, the GTVdose may experience increased variability only duringtreatment delivery as the tumor moves in and out of thehigh photon fluence zone over the breathing cycles. As aworkaround Lacornerie et al. [4] proposed to use type–A algorithm to optimize a homogeneous fluence forwhich the dose distribution is ultimately calculated andrenormalized to the desired prescription level using themore accurate type–B /MC algorithms. In fact, most ofthe major treatment planning systems (TPS) adaptstype–A dose engines to increase the speed of inverseoptimization for intensity–modulated (IMRT) or volu-metric modulated–arc radiotherapy (VMAT). Type–Bdose engine is only used at certain intermediate steps asa background dose, the so–called intermediate dose,during subsequent optimization to minimize the impact
of the dose prediction and optimization convergence er-rors [5–7].The latest published International Commission on
Radiation Units and Measurements (ICRU) report 91 [8]continues to recommend treatment dose prescriptionbased on PTV coverage (ICRU 91 coverage prescription)while acknowledging the increased variability of the in-ternal GTV dose for lung SBRT using an advanced dosecalculation engine. Potential solutions to improve theconsistency in the reported dose and hence treatmentoutcomes were discussed in the report using the GTVmedian dose D50 prescription and robust optimization(RO) but no further guidelines were provided. Followingup the ICRU report 91 recommendations eight ACROP(Advisory Committee on Radiation Oncology) contribut-ing centers have recently reported the variation of theirprescription practices, which led to large inter–institu-tional and for four centers even large intra–institutionalvariations of the GTV/ITV doses [9]. The ACROP furthermade five additional clarifications, one of them recom-mending a minimum GTV biological equivalent mean doseof 150Gy. Another preliminary study from one ACROPcenter also demonstrated superior inter–patient variabilityby prescription/renormalization to ITV D50 to prescriptionsby PTV and ITV D98 [10]. However, their results did notconcern geometric uncertainty of the GTV. Current studiessupporting the GTV median and mean dose optimizationand prescription were mostly based on real–time tumortracking SBRT where tumor motion was largely con-strained. More importantly, very few clinical outcomes haveever been published [11, 12]. The impact of respiration mo-tion on the variability of target dose is still unknown for theGTV D50 prescription/renormalization methods.Unlike for proton therapy where RO has been in routine
clinical practice [13], the clinical role of RO in photontherapy remains relatively undefined and exploratory.Since RO was introduced to the commercial TPS, therehave been a few studies of its clinical application to lungSBRT but mainly focusing on the dosimetric benefits andvalidating the degree of robustness in reality [14]. For two
Leung et al. Radiation Oncology (2020) 15:130 Page 2 of 16
example patient cases, Zhang et al. [15] showed that com-bining robust optimization with ITV − based prescriptionby D95 resulted in indistinguishable dose volume histo-grams (DHV) of the ITV obtained on multiple breathinginstances for a typical tumor motion of 1 cm. In anotherphantom study, Archibald−Heeren et al. modeled thetumor motion displacement as independent scenarios andperformed RO for the worst case scenario (WCS) [16].They similarly found relatively stable tumor doses for dis-placement up to 2 cm by optimizing and prescribing toGTV D99. However, the potential of RO to overcome thelimitations of PTV has never been explored for the me-dian dose D50 prescription.In the specific context of respiration–induced GTV dis-
placement, the present study aims to validate the hypotheses
1. that using type–B dose engine with the PTVconcept for dose optimization and prescriptionintroduces significant variability of target dose and
2. that RO (by the worst case method in this study)–based planning is a viable alternative to the PTVconcept in lung SBRT and,
3. that prescription by GTV median dose (D50) canminimize the inter–patient and inter–techniquevariability of the reported GTV dose.
For the first argument to be valid, we hypothesizedthat the GTV received significantly variable doses be-tween breathing phases. Two PTV–based optimizationadapting the ITV and MidV concepts were tested usingthe ICRU 91 coverage prescription method. To validatethe second argument, we repeated the assessment of thefirst argument for two WCS–based robustness optimization(hereafter called WCS optimization).The first approach isidentical to Liang et al. [14] that used the ITV concept formotion encompassing. The second approach deployed all4DCT images as independent breathing scenarios for ro-bustness optimization. Furthermore, the dosimetric robust-ness was assessed by comparing the relative number ofincidences that a certain target and OAR dose limit wasviolated in different respiratory phases. For argument 1 and2, the inter–patient variability of GTV dose resulting fromthe PTV– and WCS–optimized plans were also compared.To test the third argument, all PTV and WCS–optimizedplans that were prescribed by coverage according the ICRU91 recommendation were renormalized to the GTV mediandose D50 and the above analyses were repeated.Findings from this study are expected to provide im-
portant insight into the combination of SBRT planningconcept and prescription method that produces the opti-mal dosimetric quality and robustness in target andorgan dose during treatment, which will subsequentlyimprove the consistency in dose reporting and multi–center clinical outcome assessment.
Methods and materialsPatient selection and pre–treatment preparationFourteen consecutive patients with peripherally–locatedlung tumors who previously received SBRT were se-lected for this retrospective planning study.Helical four–dimensional computed tomography (4DCT)
scan of each patient was acquired in 2mm axial slices andbinned into ten datasets according to respiratory phase.Using all the phase– binned 4DCT datasets an average in-tensity projection (AIP) image dataset was also generatedon the RayStation (RaySearch Laboratories, Stockholm,Sweden; version 8a) treatment planning system (TPS).
Definition of target and normal organsThe GTV was firstly defined on one of the 4DCT datasetthat was closest to the mid–ventilation (MidV) phase(GTVMidV) [17]. It was then transformed to all otherphases according to the deformation vector fields (DVFs)derived from the anatomically constrained deformationalgorithm ANACONDA [18]. Finally, these GTVs fromdifferent phases were rigidly transferred onto the AIPimages to produce the internal target volume (ITV). Theabove process also applied to the definition of normalorgans.
Treatment planning strategies to motion encompassingPTV–based optimizationTwo margin–based approaches were studied by optimiz-ing to (i) the PTV expanded uniformly by 5 mm fromthe ITV, denoted as PTVITV, on the AIP images, and (ii)the PTV expanded from the GTVMidV by 2:5
Psetup þ β
ffiffiffiffiffiffiffiffiffiffiffiffiffiffiffiffiffiffiffiffiffiffiffiffiffiffiffiffiffiffiffiffiffiffiffiffiffiffiffiffiffiffiffiffiffiffiσsetup2 þ σmotion
2 þ σp2p
−βσp using the van Herk
(VH)‘s margin recipe [19], denoted as PTVVH, on theMidV CT. Σsetup and σsetup are the residual systemic andrandom errors in the tumor position including patientmotion and tumor baseline drift after the online 4Dcone beam computed tomography (4DCBCT) setup cor-rection (i.e., intrafractional positioning error), β = 0.52(at a mean prescription isodose line ~ 70%) and σp = 6.4,respectively. The motion amplitude of individual tumoris modeled as σmotion = 1/3 amplitude [19]. The GTVdisplacement due to respiration was implicitly accountedfor by the ITV and the MidV PTV concepts, respectively.Two partial volumetric–modulated arcs treatment
(VMAT) were created using the rayArc optimizationalgorithm. The rayArc optimization process uses atype–A pencil–beam dose engine. For all VMAToptimization, a type–B collapsed cone convolution–superposition (CCCS) dose engine was introduced atthe 15th iteration to calculate intermediate dose as abackground dose for subsequent optimization. At theend of the VMAT optimization a final dose was calcu-lated by CCCS. Each time further VMAT optimization
Leung et al. Radiation Oncology (2020) 15:130 Page 3 of 16
was pursued the final dose was taken to have the sameeffect as an intermediate dose. The final optimizeddose was prescribed to PTV D95 at 65–75% isodoseline in all cases. A total dose of 54 Gy for three frac-tions was prescribed in all cases. Dose–volume histo-gram (DVH) limits to different OARs were referencedfrom the Radiation Therapy Oncology Group (RTOG)0236 trial [20] and the German Society of RadiationOncology (DEGRO) guidelines [21].
Robustness optimizationIn RayStation, PTV–free planning can be realized by ro-bustness optimization (RO) based on the compositeworst case method [22]. The setup uncertainty is discre-tized into a set of scenarios whose actual number (ns)depends on the size of the error. Together with nominalscenario corresponding to the planning CT with no as-sumed error, the DVH objectives are optimized for theworst case scenario (WCS) in which a robust functionattaints its highest value. It is important to note that ROin RayStation does not treat the systematic and the ran-dom errors separately. Following ref. [23], the WCS canbe approximated only for the systematic error, with therandom error approximated as an additional systematiccontribution. Based on the same Σsetup with σsetup as inthe PTV recipe, the final WCS parameters were 3.4 mm(left-right), 5.3 mm (cranio-caudal) and 5.1 mm (antero-posterior) mm. The remaining organ motion of individ-ual patients was accounted for in two ways:iii) implicitly by the concept of ITV in a static geom-
etry on the AIP image.iv) explicitly by the WCS method in a dynamic geom-
etry that was realized by utilizing the 4DCT images ofall breathing phases.In the second WCS approach, each image set of the
4DCT composes one scenario where all the setup sce-narios are examined. The total number of scenarios tobe considered in the WCS optimization is then ns · ni,where ni is the number of 4DCT image sets. At each it-eration, minimax optimization was applied to one of allscenarios that attains the highest cost of the robust ob-ject function, i.e., the WCS. The resultant optimizedplan will be robust against not just setup error but alsobreathing–induced tumor motion and deformation in allten 4DCT images, hence completely margin–less. In thisstudy, robustness was imposed to all DVH objectives ofthe target and the OARs.The same two partial VMAT arcs as applied in the
PTV–based planning were optimized to the ITV and theGTV to achieve 99% prescription dose coverage (D99) inthe first and the second WCS approaches, denoted as (iii)WCSITV and (iv) WCSGTV, respectively. The same VMAToptimization process as in the PTV–optimization was
adapted regarding the dose engines for optimization andprescription.
Comparative analysis of PTV and WCS optimizations instatic geometryFirstly we assessed the naïve plan optimized accordingto (i) to (iv) without explicit simulation of the geometrictumor displacement due to respiration. The MidV–CTwas used as the common frame where all the dosimetricmetrics, including mean, near–minimum and near–max-imum dose in the GTV (GTV D50, D98 and D2), relativevolume of chest wall (CW) receiving 30 Gy (CWV30),relative volume of normal lung (NL) receiving 20 Gy(NLV20) and 5 Gy (NLV5) and the mean normal lungdose (MLD) were obtained. For this, all PTVITV andWCSITV plans that based their optimizations on the AIPimages were recalculated on the MidV–CT.Doses to GTV and OARs of the PTV and WCS opti-
mized plans were compared for their difference by Fried-man tests and their variance by Levene’s tests using theMatlab statistics toolbox v.2019b (Mathwork Inc. MA,USA). In cases where the Friedman’s tests return statis-tical significant at p–value < 0.05, post–hoc multiplecomparison tests were performed with adjusted p–valuesby Bonferroni’s correction.
Dosimetric variation / robustness of PTV and WCSoptimizations in breathing geometryAnalysis by individual respiratory phasesIf type–B dose engine does induce excessive fluence inthe low density PTV border one would expect the dosereceived by the GTV to be higher in other breathingphases than in the planning phase. As validation, allPTV and WCS–optimized plans were firstly recalculatedon every image set of the 4DCT. The resulting doses tothe GTV and organs–at–risk (OARs) in individualbreathing phases were statistically compared for theirdifference by Friedman tests and their variance byLevene’s tests separately for the PTV and WCS–opti-mized plans. The plan robustness was defined in thiscontext by the relative count of instances where thedoses to the GTV and OARs deviate from their respect-ive tolerance limits.
Analysis over all respiratory phasesFollowing the line of argument, if the PTV concept usingtype–B dose engine introduces excessive photon fluencethe GTV would eventually accumulate significant higherdose from multiple displaced positions in the respirationcycle. As the ultimate validation, the calculated doses inindividual 4DCT phase images were summed deform-ably according to DVFs back onto the reference MidV–CT for every plan. Such deformably accumulated dose isunequivocally referred to as summed dose throughout
Leung et al. Radiation Oncology (2020) 15:130 Page 4 of 16
the text. Similar to the evaluation in the static geometry,the summed doses to GTV and OARs were comparedamong all PTV and WCS–optimized plans on the refer-ence MidV–CT for their differences by Friedman testsand their variances by Levene’s tests.The overall plan robustness was defined in this context
as the dosimetric changes due to the motion effect fromstatic to dynamic geometry and was assessed separatelyfor different PTV and WCS WCS–optimized plans bythe Wilcoxon’s signed–ranked test.
Dosimetric implication of prescription by GTV mediandose D50
According to ICRU 91 report and other follow–up studies[1, 3, 16], GTV D50 prescription was further explored forits potential in mitigating the variability of GTV doseunder the circumstances of GTV displacement by respir-ation. For this, all final PTV and WCS–optimized planswere renormalized so that GTV D50 equals 54Gy on re-spective primary planning CT images. Dosimetric andstatistical analyses were then repeated as described above.
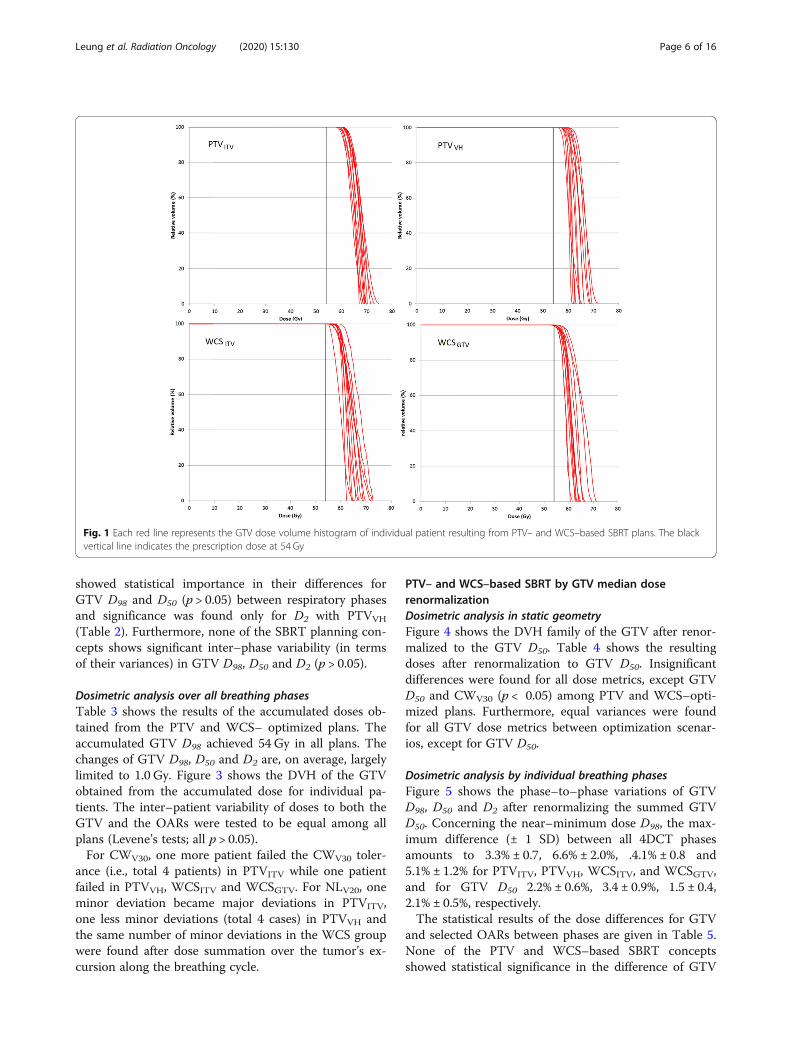
ResultsPTV– and WCS–based SBRT using ICRU 91 recommendedcoverage prescriptionDosimetric analysis in static geometryIn the condition where no tumor displacement is con-cerned, all PTV and WCS–optimized plans achieved thedose constraints following the RTOG 0236 and guide-lines on the reference mid–ventilation images, except forCW. In general, WCS–optimized plans produced lowerdoses than PTV–optimized plans not just in the OARSbut also in the GTV, as summarized in Table 1. Figure 1shows the DVH of the GTV obtained on the MidV–CTfor individual patients.
On individual patient basis, CWV30 was not met in 3cases by PTVITV and 1 case by PTVVH and WCSITVwhile it was met in all cases by WCSGTV. For NLV20,PTVITV resulted in 6 minor deviations (within 10–15%)and PTVVH showed 5 minor deviations according to theRTOG 0236 dose constraint. By contrast, there were 4and 2 minor deviations resulted from WCSITV andWCSGTV plans, respectively. The separation betweenPTV– and WCS–based SBRT plans is more pronouncedin NLV20 and between PTVITV, PTVVH and WCSGTV.We found that WCSGTV is able to reduce NLV5, on aver-age, by 6.1%, NLV20 by 17.9% and MLD by 12.5% com-paring to PTVITV.Figure 1 shows the inter–patient variability of the
GTV doses. Variances of each dose metrics between allPTV–based and WCS–based SBRT plans were statisti-cally tested (Levene’s tests) and were found significantfor neither the GTV (D98, D50 and D2; all p > 0.05) northe OARs (CWV30, NLV5 and NLV20).
Dosimetric analysis by individual breathing phasesRecalculating the PTV– and WCS–optimized plans onevery image set of the 4DCT found GTV D50 ≥ 54Gy inall cases. PTVITV produced D98 > 54 Gy in all patients.There are one PTVVH plan in one phase, two WCSITVplans in one phase and one WCSGTV plan in threephases showing D98 < 54 Gy towards principally the endinhalation. The maximum differences of D98 (± 1 stand-ard deviation; SD) between all 4DCT phases are 5.7% ±1.3, 11.4% ± 3.0, 6.5% ± 1.6 and 6.1% ± 1.5% for PTVITV,PTVVH, WCSITV, and WCSGTV, and for GTV D50
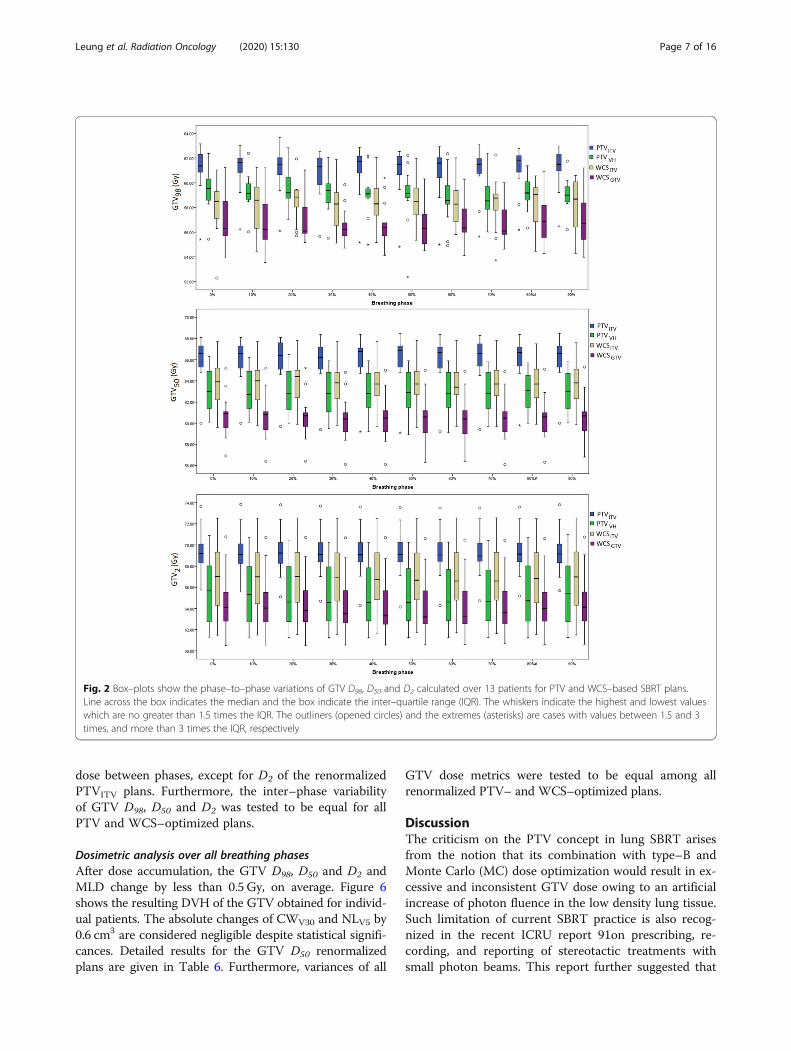
1.6% ± 0.5, 3.4% ± 0.8, 1.5% ± 0.4 and 2.1% ± 0.5%,respectively.Figure 2 shows the variations of GTV D98, D50 and D2
for the 13 cases across ten breathing phases. Over all pa-tients, none of the PTV and WCS–optimized plans
Table 1 Means and standard deviations of dose volume histogram (DVH) metrics in target and normal organs over 13 patients. Allplans were prescribed by coverage according to ICRU 91
PTVITV(i) PTVVH
(ii) WCSCITV(iii) WCSGTV
(iv) p-value< 0.05
GTV
D98 (Gy) 60.6 ± 1.8 (56.1–63.7) 59.6 ± 1.5 (57.0–62.3) 57.8 ± 1.7 (54.8–59.6) 56.4 ± 1.0 (55.2–58.6) (i)-(iii); (i)-(iv); (ii)-(iv)
D50 (Gy) 65.7 ± 2.2 (59.7–68.1) 63.1 ± 2.2 (60.0–66.5) 63.7 ± 2.2 (59.9–67.2) 60.5 ± 2.1 (56.4–64.8) (i)-(iv)
D2 (Gy) 69.3 ± 2.3 (65.1–76.3) 65.4 ± 3.0 (61.3–70.7) 67.2 ± 3.5 61.6–72.5) 64.3 ± 2.9 (60.5–70.7) (i)-(iv)
Chest Wall
V30Gy (cm3) 26.4 ± 16.5 (4.0–60.9) 19.3 ± 9.9 (1.0–38.1) 14.1 ± 8.7 (0.4–31.4) 12.4 ± 7.7 (0.0–29.5) (i)-(iii); (i)-(iv); (ii)-(iii); (ii)-(iv)
Lung
V5Gy (cm3) 18.1 ± 5.7 (3.3–14.0) 18.7 ± 5.0 (3.6–13.5) 18.1 ± 5.8 (3.1–13.4) 17.0 ± 5.6 (2.8–13.4) (i)-(iv); (ii)-(iv)
V20Gy (cm3) 8.4 ± 3.7 (9.1–31.3) 7.8 ± 3.3 (9.5–28.3) 7.4 ± 3.2 (8.3–30.7) 6.9 ± 3.3 (7.8–29.8) (i)-(iii); (i)-(iv); (ii)-(iii); (ii)-(iv)
MLD (Gy) 4.8 ± 1.7 (2.2–7.9) 4.7 ± 1.5 (2.3–7.2) 4.6 ± 1.6 (2.1–7.1) 4.2 ± 1.5 (1.9–7.1) (i)-(iv); (ii)-(iv)
Abbreviation: GTV gross tumor volume, Dx (Gy) Dose to x % of the GTV, where x = 98, 50 and 2 represent the near–minimum, median and near–maximum dose,respectively, VxGy(cm
3) volume receiving at least x Gy, MLD (Gy) mean normal lung dose; post–hoc pairwise comparisons showing p-values < 0.05 are indicatedwhen the Freidman’s tests were found statistical significant
Leung et al. Radiation Oncology (2020) 15:130 Page 5 of 16
showed statistical importance in their differences forGTV D98 and D50 (p > 0.05) between respiratory phasesand significance was found only for D2 with PTVVH
(Table 2). Furthermore, none of the SBRT planning con-cepts shows significant inter–phase variability (in termsof their variances) in GTV D98, D50 and D2 (p > 0.05).
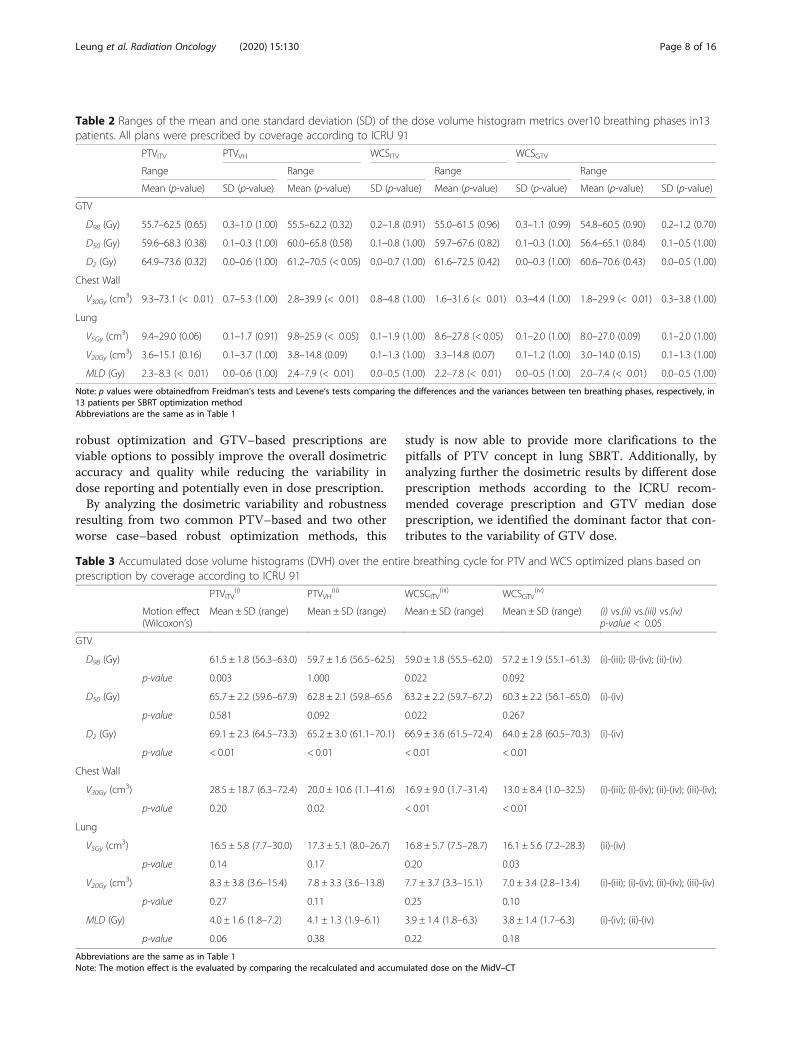
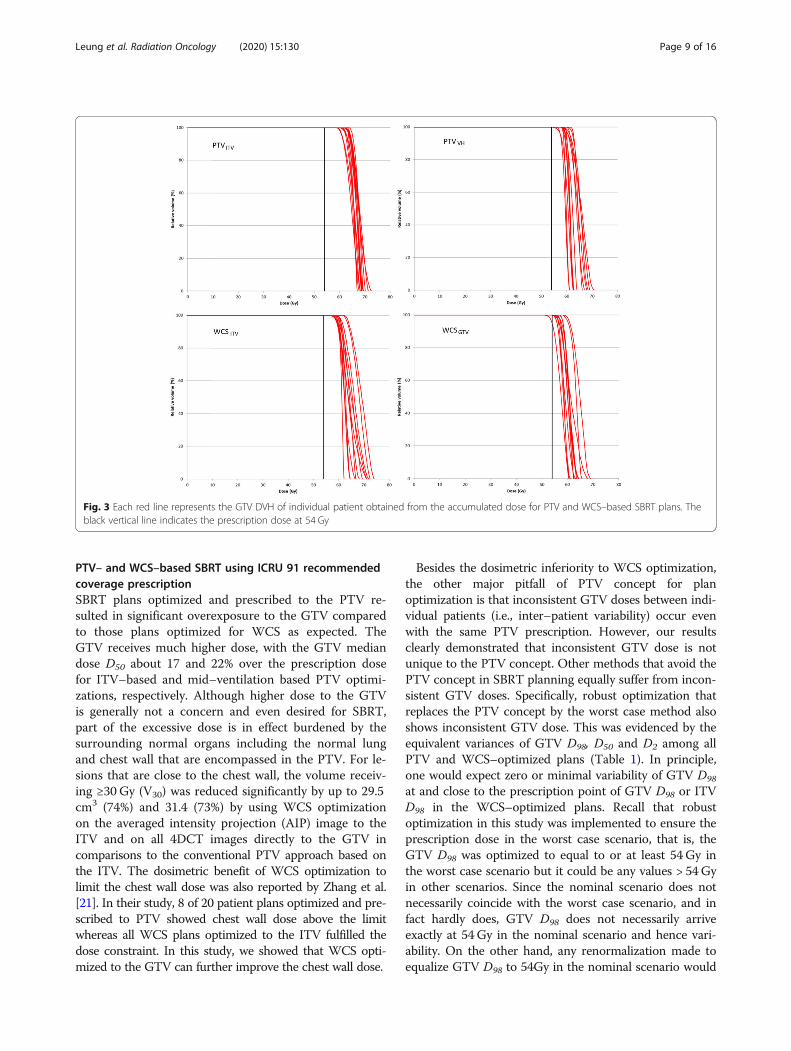
Dosimetric analysis over all breathing phasesTable 3 shows the results of the accumulated doses ob-tained from the PTV and WCS– optimized plans. Theaccumulated GTV D98 achieved 54 Gy in all plans. Thechanges of GTV D98, D50 and D2 are, on average, largelylimited to 1.0 Gy. Figure 3 shows the DVH of the GTVobtained from the accumulated dose for individual pa-tients. The inter–patient variability of doses to both theGTV and the OARs were tested to be equal among allplans (Levene’s tests; all p > 0.05).For CWV30, one more patient failed the CWV30 toler-
ance (i.e., total 4 patients) in PTVITV while one patientfailed in PTVVH, WCSITV and WCSGTV. For NLV20, oneminor deviation became major deviations in PTVITV,one less minor deviations (total 4 cases) in PTVVH andthe same number of minor deviations in the WCS groupwere found after dose summation over the tumor’s ex-cursion along the breathing cycle.
PTV– and WCS–based SBRT by GTV median doserenormalizationDosimetric analysis in static geometryFigure 4 shows the DVH family of the GTV after renor-malized to the GTV D50. Table 4 shows the resultingdoses after renormalization to GTV D50. Insignificantdifferences were found for all dose metrics, except GTVD50 and CWV30 (p < 0.05) among PTV and WCS–opti-mized plans. Furthermore, equal variances were foundfor all GTV dose metrics between optimization scenar-ios, except for GTV D50.
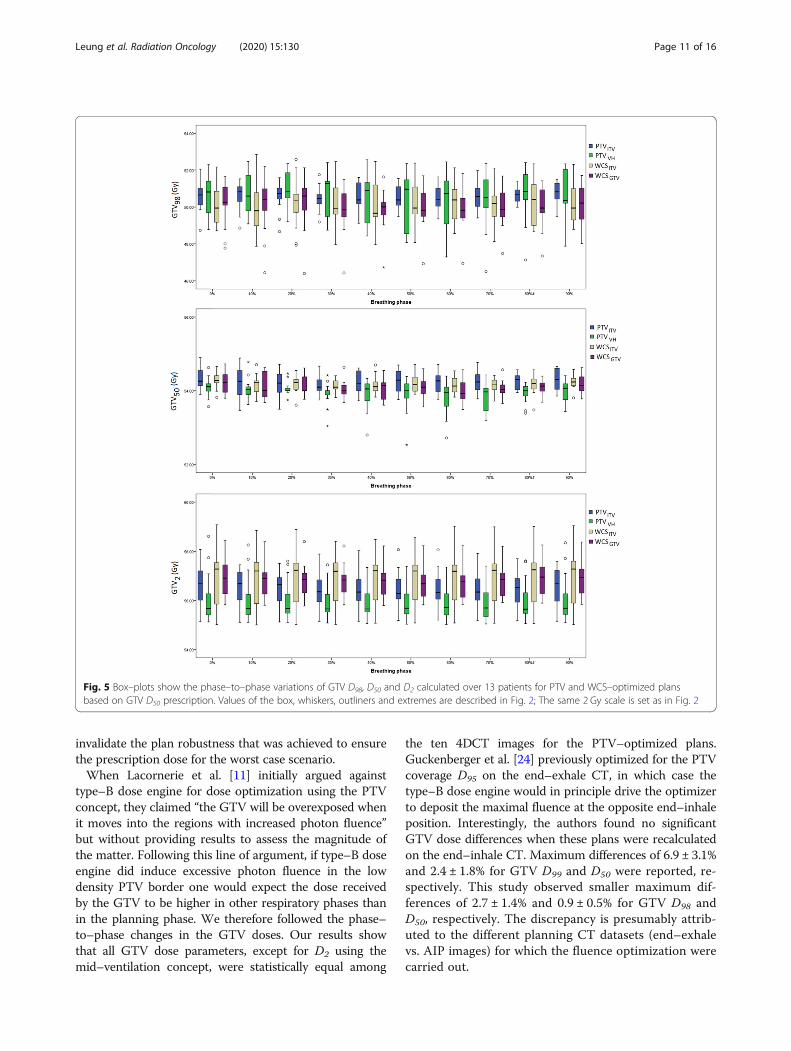
Dosimetric analysis by individual breathing phasesFigure 5 shows the phase–to–phase variations of GTVD98, D50 and D2 after renormalizing the summed GTVD50. Concerning the near–minimum dose D98, the max-imum difference (± 1 SD) between all 4DCT phasesamounts to 3.3% ± 0.7, 6.6% ± 2.0%, .4.1% ± 0.8 and5.1% ± 1.2% for PTVITV, PTVVH, WCSITV, and WCSGTV,and for GTV D50 2.2% ± 0.6%, 3.4 ± 0.9%, 1.5 ± 0.4,2.1% ± 0.5%, respectively.The statistical results of the dose differences for GTV
and selected OARs between phases are given in Table 5.None of the PTV and WCS–based SBRT conceptsshowed statistical significance in the difference of GTV
Fig. 1 Each red line represents the GTV dose volume histogram of individual patient resulting from PTV– and WCS–based SBRT plans. The blackvertical line indicates the prescription dose at 54 Gy
Leung et al. Radiation Oncology (2020) 15:130 Page 6 of 16
dose between phases, except for D2 of the renormalizedPTVITV plans. Furthermore, the inter–phase variabilityof GTV D98, D50 and D2 was tested to be equal for allPTV and WCS–optimized plans.
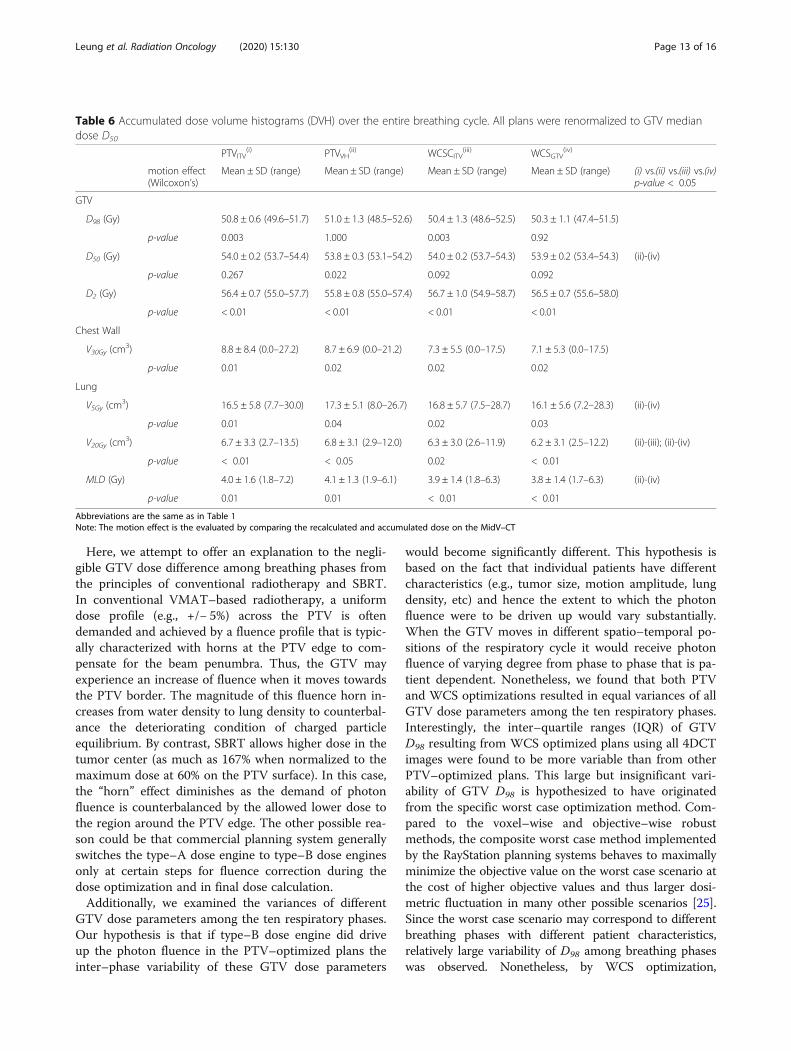
Dosimetric analysis over all breathing phasesAfter dose accumulation, the GTV D98, D50 and D2 andMLD change by less than 0.5 Gy, on average. Figure 6shows the resulting DVH of the GTV obtained for individ-ual patients. The absolute changes of CWV30 and NLV5 by0.6 cm3 are considered negligible despite statistical signifi-cances. Detailed results for the GTV D50 renormalizedplans are given in Table 6. Furthermore, variances of all
GTV dose metrics were tested to be equal among allrenormalized PTV– and WCS–optimized plans.
DiscussionThe criticism on the PTV concept in lung SBRT arisesfrom the notion that its combination with type–B andMonte Carlo (MC) dose optimization would result in ex-cessive and inconsistent GTV dose owing to an artificialincrease of photon fluence in the low density lung tissue.Such limitation of current SBRT practice is also recog-nized in the recent ICRU report 91on prescribing, re-cording, and reporting of stereotactic treatments withsmall photon beams. This report further suggested that
Fig. 2 Box–plots show the phase–to–phase variations of GTV D98, D50 and D2 calculated over 13 patients for PTV and WCS–based SBRT plans.Line across the box indicates the median and the box indicate the inter–quartile range (IQR). The whiskers indicate the highest and lowest valueswhich are no greater than 1.5 times the IQR. The outliners (opened circles) and the extremes (asterisks) are cases with values between 1.5 and 3times, and more than 3 times the IQR, respectively
Leung et al. Radiation Oncology (2020) 15:130 Page 7 of 16
robust optimization and GTV–based prescriptions areviable options to possibly improve the overall dosimetricaccuracy and quality while reducing the variability indose reporting and potentially even in dose prescription.By analyzing the dosimetric variability and robustness
resulting from two common PTV–based and two otherworse case–based robust optimization methods, this
study is now able to provide more clarifications to thepitfalls of PTV concept in lung SBRT. Additionally, byanalyzing further the dosimetric results by different doseprescription methods according to the ICRU recom-mended coverage prescription and GTV median doseprescription, we identified the dominant factor that con-tributes to the variability of GTV dose.
Table 2 Ranges of the mean and one standard deviation (SD) of the dose volume histogram metrics over10 breathing phases in13patients. All plans were prescribed by coverage according to ICRU 91
PTVITV PTVVH WCSITV WCSGTV
Range Range Range Range
Mean (p-value) SD (p-value) Mean (p-value) SD (p-value) Mean (p-value) SD (p-value) Mean (p-value) SD (p-value)
GTV
D98 (Gy) 55.7–62.5 (0.65) 0.3–1.0 (1.00) 55.5–62.2 (0.32) 0.2–1.8 (0.91) 55.0–61.5 (0.96) 0.3–1.1 (0.99) 54.8–60.5 (0.90) 0.2–1.2 (0.70)
D50 (Gy) 59.6–68.3 (0.38) 0.1–0.3 (1.00) 60.0–65.8 (0.58) 0.1–0.8 (1.00) 59.7–67.6 (0.82) 0.1–0.3 (1.00) 56.4–65.1 (0.84) 0.1–0.5 (1.00)
D2 (Gy) 64.9–73.6 (0.32) 0.0–0.6 (1.00) 61.2–70.5 (< 0.05) 0.0–0.7 (1.00) 61.6–72.5 (0.42) 0.0–0.3 (1.00) 60.6–70.6 (0.43) 0.0–0.5 (1.00)
Chest Wall
V30Gy (cm3) 9.3–73.1 (< 0.01) 0.7–5.3 (1.00) 2.8–39.9 (< 0.01) 0.8–4.8 (1.00) 1.6–31.6 (< 0.01) 0.3–4.4 (1.00) 1.8–29.9 (< 0.01) 0.3–3.8 (1.00)
Lung
V5Gy (cm3) 9.4–29.0 (0.06) 0.1–1.7 (0.91) 9.8–25.9 (< 0.05) 0.1–1.9 (1.00) 8.6–27.8 (< 0.05) 0.1–2.0 (1.00) 8.0–27.0 (0.09) 0.1–2.0 (1.00)
V20Gy (cm3) 3.6–15.1 (0.16) 0.1–3.7 (1.00) 3.8–14.8 (0.09) 0.1–1.3 (1.00) 3.3–14.8 (0.07) 0.1–1.2 (1.00) 3.0–14.0 (0.15) 0.1–1.3 (1.00)
MLD (Gy) 2.3–8.3 (< 0.01) 0.0–0.6 (1.00) 2.4–7.9 (< 0.01) 0.0–0.5 (1.00) 2.2–7.8 (< 0.01) 0.0–0.5 (1.00) 2.0–7.4 (< 0.01) 0.0–0.5 (1.00)
Note: p values were obtainedfrom Freidman’s tests and Levene’s tests comparing the differences and the variances between ten breathing phases, respectively, in13 patients per SBRT optimization methodAbbreviations are the same as in Table 1
Table 3 Accumulated dose volume histograms (DVH) over the entire breathing cycle for PTV and WCS optimized plans based onprescription by coverage according to ICRU 91
PTVITV(i) PTVVH
(ii) WCSCITV(iii) WCSGTV
(iv)
Motion effect(Wilcoxon’s)
Mean ± SD (range) Mean ± SD (range) Mean ± SD (range) Mean ± SD (range) (i) vs.(ii) vs.(iii) vs.(iv)p-value < 0.05
GTV
D98 (Gy) 61.5 ± 1.8 (56.3–63.0) 59.7 ± 1.6 (56.5–62.5) 59.0 ± 1.8 (55.5–62.0) 57.2 ± 1.9 (55.1–61.3) (i)-(iii); (i)-(iv); (ii)-(iv)
p-value 0.003 1.000 0.022 0.092
D50 (Gy) 65.7 ± 2.2 (59.6–67.9) 62.8 ± 2.1 (59.8–65.6 63.2 ± 2.2 (59.7–67.2) 60.3 ± 2.2 (56.1–65.0) (i)-(iv)
p-value 0.581 0.092 0.022 0.267
D2 (Gy) 69.1 ± 2.3 (64.5–73.3) 65.2 ± 3.0 (61.1–70.1) 66.9 ± 3.6 (61.5–72.4) 64.0 ± 2.8 (60.5–70.3) (i)-(iv)
p-value < 0.01 < 0.01 < 0.01 < 0.01
Chest Wall
V30Gy (cm3) 28.5 ± 18.7 (6.3–72.4) 20.0 ± 10.6 (1.1–41.6) 16.9 ± 9.0 (1.7–31.4) 13.0 ± 8.4 (1.0–32.5) (i)-(iii); (i)-(iv); (ii)-(iv); (iii)-(iv);
p-value 0.20 0.02 < 0.01 < 0.01
Lung
V5Gy (cm3) 16.5 ± 5.8 (7.7–30.0) 17.3 ± 5.1 (8.0–26.7) 16.8 ± 5.7 (7.5–28.7) 16.1 ± 5.6 (7.2–28.3) (ii)-(iv)
p-value 0.14 0.17 0.20 0.03
V20Gy (cm3) 8.3 ± 3.8 (3.6–15.4) 7.8 ± 3.3 (3.6–13.8) 7.7 ± 3.7 (3.3–15.1) 7.0 ± 3.4 (2.8–13.4) (i)-(iii); (i)-(iv); (ii)-(iv); (iii)-(iv)
p-value 0.27 0.11 0.25 0.10
MLD (Gy) 4.0 ± 1.6 (1.8–7.2) 4.1 ± 1.3 (1.9–6.1) 3.9 ± 1.4 (1.8–6.3) 3.8 ± 1.4 (1.7–6.3) (i)-(iv); (ii)-(iv)
p-value 0.06 0.38 0.22 0.18
Abbreviations are the same as in Table 1Note: The motion effect is the evaluated by comparing the recalculated and accumulated dose on the MidV–CT
Leung et al. Radiation Oncology (2020) 15:130 Page 8 of 16
PTV– and WCS–based SBRT using ICRU 91 recommendedcoverage prescriptionSBRT plans optimized and prescribed to the PTV re-sulted in significant overexposure to the GTV comparedto those plans optimized for WCS as expected. TheGTV receives much higher dose, with the GTV mediandose D50 about 17 and 22% over the prescription dosefor ITV–based and mid–ventilation based PTV optimi-zations, respectively. Although higher dose to the GTVis generally not a concern and even desired for SBRT,part of the excessive dose is in effect burdened by thesurrounding normal organs including the normal lungand chest wall that are encompassed in the PTV. For le-sions that are close to the chest wall, the volume receiv-ing ≥30 Gy (V30) was reduced significantly by up to 29.5cm3 (74%) and 31.4 (73%) by using WCS optimizationon the averaged intensity projection (AIP) image to theITV and on all 4DCT images directly to the GTV incomparisons to the conventional PTV approach based onthe ITV. The dosimetric benefit of WCS optimization tolimit the chest wall dose was also reported by Zhang et al.[21]. In their study, 8 of 20 patient plans optimized and pre-scribed to PTV showed chest wall dose above the limitwhereas all WCS plans optimized to the ITV fulfilled thedose constraint. In this study, we showed that WCS opti-mized to the GTV can further improve the chest wall dose.
Besides the dosimetric inferiority to WCS optimization,the other major pitfall of PTV concept for planoptimization is that inconsistent GTV doses between indi-vidual patients (i.e., inter–patient variability) occur evenwith the same PTV prescription. However, our resultsclearly demonstrated that inconsistent GTV dose is notunique to the PTV concept. Other methods that avoid thePTV concept in SBRT planning equally suffer from incon-sistent GTV doses. Specifically, robust optimization thatreplaces the PTV concept by the worst case method alsoshows inconsistent GTV dose. This was evidenced by theequivalent variances of GTV D98, D50 and D2 among allPTV and WCS–optimized plans (Table 1). In principle,one would expect zero or minimal variability of GTV D98
at and close to the prescription point of GTV D98 or ITVD98 in the WCS–optimized plans. Recall that robustoptimization in this study was implemented to ensure theprescription dose in the worst case scenario, that is, theGTV D98 was optimized to equal to or at least 54Gy inthe worst case scenario but it could be any values > 54Gyin other scenarios. Since the nominal scenario does notnecessarily coincide with the worst case scenario, and infact hardly does, GTV D98 does not necessarily arriveexactly at 54Gy in the nominal scenario and hence vari-ability. On the other hand, any renormalization made toequalize GTV D98 to 54Gy in the nominal scenario would
Fig. 3 Each red line represents the GTV DVH of individual patient obtained from the accumulated dose for PTV and WCS–based SBRT plans. Theblack vertical line indicates the prescription dose at 54 Gy
Leung et al. Radiation Oncology (2020) 15:130 Page 9 of 16
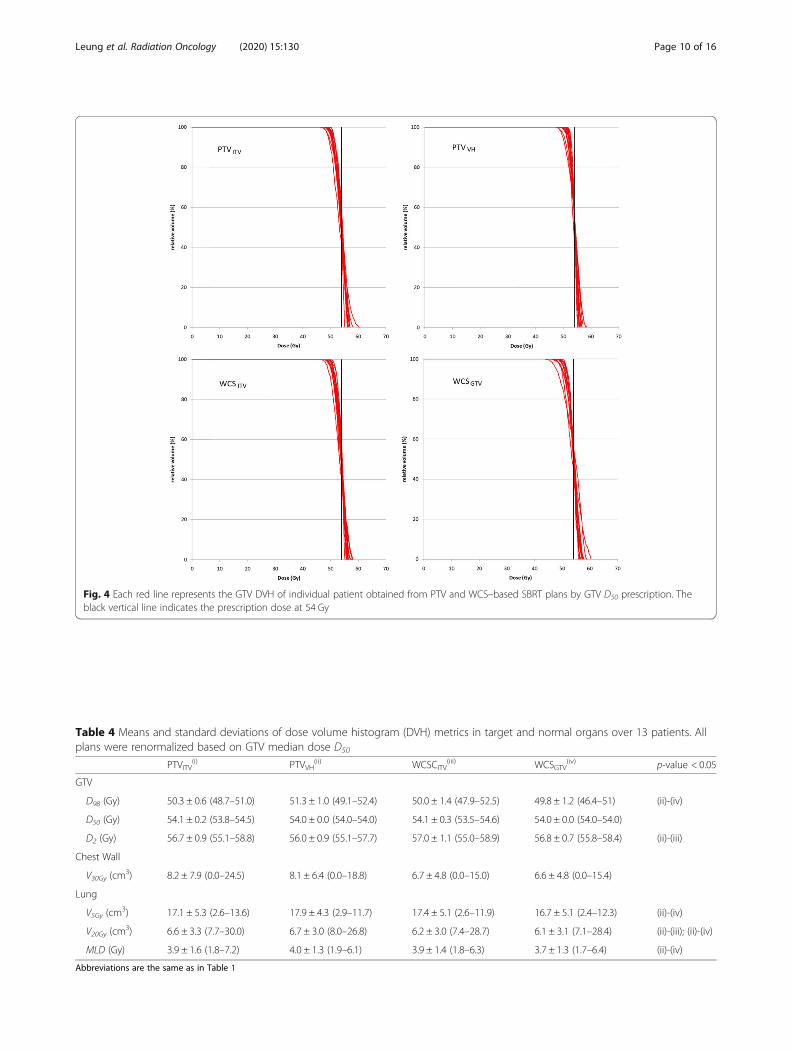
Fig. 4 Each red line represents the GTV DVH of individual patient obtained from PTV and WCS–based SBRT plans by GTV D50 prescription. Theblack vertical line indicates the prescription dose at 54 Gy
Table 4 Means and standard deviations of dose volume histogram (DVH) metrics in target and normal organs over 13 patients. Allplans were renormalized based on GTV median dose D50
PTVITV(i) PTVVH
(ii) WCSCITV(iii) WCSGTV
(iv) p-value < 0.05
GTV
D98 (Gy) 50.3 ± 0.6 (48.7–51.0) 51.3 ± 1.0 (49.1–52.4) 50.0 ± 1.4 (47.9–52.5) 49.8 ± 1.2 (46.4–51) (ii)-(iv)
D50 (Gy) 54.1 ± 0.2 (53.8–54.5) 54.0 ± 0.0 (54.0–54.0) 54.1 ± 0.3 (53.5–54.6) 54.0 ± 0.0 (54.0–54.0)
D2 (Gy) 56.7 ± 0.9 (55.1–58.8) 56.0 ± 0.9 (55.1–57.7) 57.0 ± 1.1 (55.0–58.9) 56.8 ± 0.7 (55.8–58.4) (ii)-(iii)
Chest Wall
V30Gy (cm3) 8.2 ± 7.9 (0.0–24.5) 8.1 ± 6.4 (0.0–18.8) 6.7 ± 4.8 (0.0–15.0) 6.6 ± 4.8 (0.0–15.4)
Lung
V5Gy (cm3) 17.1 ± 5.3 (2.6–13.6) 17.9 ± 4.3 (2.9–11.7) 17.4 ± 5.1 (2.6–11.9) 16.7 ± 5.1 (2.4–12.3) (ii)-(iv)
V20Gy (cm3) 6.6 ± 3.3 (7.7–30.0) 6.7 ± 3.0 (8.0–26.8) 6.2 ± 3.0 (7.4–28.7) 6.1 ± 3.1 (7.1–28.4) (ii)-(iii); (ii)-(iv)
MLD (Gy) 3.9 ± 1.6 (1.8–7.2) 4.0 ± 1.3 (1.9–6.1) 3.9 ± 1.4 (1.8–6.3) 3.7 ± 1.3 (1.7–6.4) (ii)-(iv)
Abbreviations are the same as in Table 1
Leung et al. Radiation Oncology (2020) 15:130 Page 10 of 16
invalidate the plan robustness that was achieved to ensurethe prescription dose for the worst case scenario.When Lacornerie et al. [11] initially argued against
type–B dose engine for dose optimization using the PTVconcept, they claimed “the GTV will be overexposed whenit moves into the regions with increased photon fluence”but without providing results to assess the magnitude ofthe matter. Following this line of argument, if type–B doseengine did induce excessive photon fluence in the lowdensity PTV border one would expect the dose receivedby the GTV to be higher in other respiratory phases thanin the planning phase. We therefore followed the phase–to–phase changes in the GTV doses. Our results showthat all GTV dose parameters, except for D2 using themid–ventilation concept, were statistically equal among
the ten 4DCT images for the PTV–optimized plans.Guckenberger et al. [24] previously optimized for the PTVcoverage D95 on the end–exhale CT, in which case thetype–B dose engine would in principle drive the optimizerto deposit the maximal fluence at the opposite end–inhaleposition. Interestingly, the authors found no significantGTV dose differences when these plans were recalculatedon the end–inhale CT. Maximum differences of 6.9 ± 3.1%and 2.4 ± 1.8% for GTV D99 and D50 were reported, re-spectively. This study observed smaller maximum dif-ferences of 2.7 ± 1.4% and 0.9 ± 0.5% for GTV D98 andD50, respectively. The discrepancy is presumably attrib-uted to the different planning CT datasets (end–exhalevs. AIP images) for which the fluence optimization werecarried out.
Fig. 5 Box–plots show the phase–to–phase variations of GTV D98, D50 and D2 calculated over 13 patients for PTV and WCS–optimized plansbased on GTV D50 prescription. Values of the box, whiskers, outliners and extremes are described in Fig. 2; The same 2 Gy scale is set as in Fig. 2
Leung et al. Radiation Oncology (2020) 15:130 Page 11 of 16
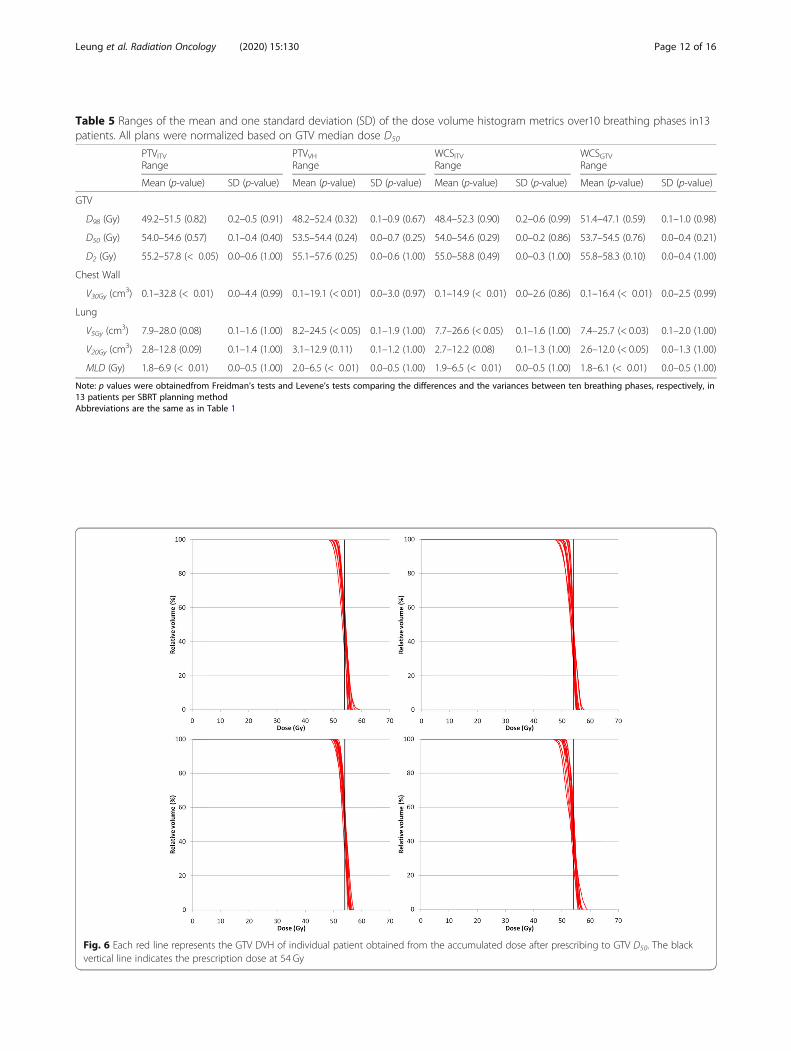
Table 5 Ranges of the mean and one standard deviation (SD) of the dose volume histogram metrics over10 breathing phases in13patients. All plans were normalized based on GTV median dose D50
PTVITV PTVVH WCSITV WCSGTVRange Range Range Range
Mean (p-value) SD (p-value) Mean (p-value) SD (p-value) Mean (p-value) SD (p-value) Mean (p-value) SD (p-value)
GTV
D98 (Gy) 49.2–51.5 (0.82) 0.2–0.5 (0.91) 48.2–52.4 (0.32) 0.1–0.9 (0.67) 48.4–52.3 (0.90) 0.2–0.6 (0.99) 51.4–47.1 (0.59) 0.1–1.0 (0.98)
D50 (Gy) 54.0–54.6 (0.57) 0.1–0.4 (0.40) 53.5–54.4 (0.24) 0.0–0.7 (0.25) 54.0–54.6 (0.29) 0.0–0.2 (0.86) 53.7–54.5 (0.76) 0.0–0.4 (0.21)
D2 (Gy) 55.2–57.8 (< 0.05) 0.0–0.6 (1.00) 55.1–57.6 (0.25) 0.0–0.6 (1.00) 55.0–58.8 (0.49) 0.0–0.3 (1.00) 55.8–58.3 (0.10) 0.0–0.4 (1.00)
Chest Wall
V30Gy (cm3) 0.1–32.8 (< 0.01) 0.0–4.4 (0.99) 0.1–19.1 (< 0.01) 0.0–3.0 (0.97) 0.1–14.9 (< 0.01) 0.0–2.6 (0.86) 0.1–16.4 (< 0.01) 0.0–2.5 (0.99)
Lung
V5Gy (cm3) 7.9–28.0 (0.08) 0.1–1.6 (1.00) 8.2–24.5 (< 0.05) 0.1–1.9 (1.00) 7.7–26.6 (< 0.05) 0.1–1.6 (1.00) 7.4–25.7 (< 0.03) 0.1–2.0 (1.00)
V20Gy (cm3) 2.8–12.8 (0.09) 0.1–1.4 (1.00) 3.1–12.9 (0.11) 0.1–1.2 (1.00) 2.7–12.2 (0.08) 0.1–1.3 (1.00) 2.6–12.0 (< 0.05) 0.0–1.3 (1.00)
MLD (Gy) 1.8–6.9 (< 0.01) 0.0–0.5 (1.00) 2.0–6.5 (< 0.01) 0.0–0.5 (1.00) 1.9–6.5 (< 0.01) 0.0–0.5 (1.00) 1.8–6.1 (< 0.01) 0.0–0.5 (1.00)
Note: p values were obtainedfrom Freidman’s tests and Levene’s tests comparing the differences and the variances between ten breathing phases, respectively, in13 patients per SBRT planning methodAbbreviations are the same as in Table 1
Fig. 6 Each red line represents the GTV DVH of individual patient obtained from the accumulated dose after prescribing to GTV D50. The blackvertical line indicates the prescription dose at 54 Gy
Leung et al. Radiation Oncology (2020) 15:130 Page 12 of 16
Here, we attempt to offer an explanation to the negli-gible GTV dose difference among breathing phases fromthe principles of conventional radiotherapy and SBRT.In conventional VMAT–based radiotherapy, a uniformdose profile (e.g., +/− 5%) across the PTV is oftendemanded and achieved by a fluence profile that is typic-ally characterized with horns at the PTV edge to com-pensate for the beam penumbra. Thus, the GTV mayexperience an increase of fluence when it moves towardsthe PTV border. The magnitude of this fluence horn in-creases from water density to lung density to counterbal-ance the deteriorating condition of charged particleequilibrium. By contrast, SBRT allows higher dose in thetumor center (as much as 167% when normalized to themaximum dose at 60% on the PTV surface). In this case,the “horn” effect diminishes as the demand of photonfluence is counterbalanced by the allowed lower dose tothe region around the PTV edge. The other possible rea-son could be that commercial planning system generallyswitches the type–A dose engine to type–B dose enginesonly at certain steps for fluence correction during thedose optimization and in final dose calculation.Additionally, we examined the variances of different
GTV dose parameters among the ten respiratory phases.Our hypothesis is that if type–B dose engine did driveup the photon fluence in the PTV–optimized plans theinter–phase variability of these GTV dose parameters
would become significantly different. This hypothesis isbased on the fact that individual patients have differentcharacteristics (e.g., tumor size, motion amplitude, lungdensity, etc) and hence the extent to which the photonfluence were to be driven up would vary substantially.When the GTV moves in different spatio–temporal po-sitions of the respiratory cycle it would receive photonfluence of varying degree from phase to phase that is pa-tient dependent. Nonetheless, we found that both PTVand WCS optimizations resulted in equal variances of allGTV dose parameters among the ten respiratory phases.Interestingly, the inter–quartile ranges (IQR) of GTVD98 resulting from WCS optimized plans using all 4DCTimages were found to be more variable than from otherPTV–optimized plans. This large but insignificant vari-ability of GTV D98 is hypothesized to have originatedfrom the specific worst case optimization method. Com-pared to the voxel–wise and objective–wise robustmethods, the composite worst case method implementedby the RayStation planning systems behaves to maximallyminimize the objective value on the worst case scenario atthe cost of higher objective values and thus larger dosi-metric fluctuation in many other possible scenarios [25].Since the worst case scenario may correspond to differentbreathing phases with different patient characteristics,relatively large variability of D98 among breathing phaseswas observed. Nonetheless, by WCS optimization,
Table 6 Accumulated dose volume histograms (DVH) over the entire breathing cycle. All plans were renormalized to GTV mediandose D50
PTVITV(i) PTVVH
(ii) WCSCITV(iii) WCSGTV
(iv)
motion effect(Wilcoxon’s)
Mean ± SD (range) Mean ± SD (range) Mean ± SD (range) Mean ± SD (range) (i) vs.(ii) vs.(iii) vs.(iv)p-value < 0.05
GTV
D98 (Gy) 50.8 ± 0.6 (49.6–51.7) 51.0 ± 1.3 (48.5–52.6) 50.4 ± 1.3 (48.6–52.5) 50.3 ± 1.1 (47.4–51.5)
p-value 0.003 1.000 0.003 0.92
D50 (Gy) 54.0 ± 0.2 (53.7–54.4) 53.8 ± 0.3 (53.1–54.2) 54.0 ± 0.2 (53.7–54.3) 53.9 ± 0.2 (53.4–54.3) (ii)-(iv)
p-value 0.267 0.022 0.092 0.092
D2 (Gy) 56.4 ± 0.7 (55.0–57.7) 55.8 ± 0.8 (55.0–57.4) 56.7 ± 1.0 (54.9–58.7) 56.5 ± 0.7 (55.6–58.0)
p-value < 0.01 < 0.01 < 0.01 < 0.01
Chest Wall
V30Gy (cm3) 8.8 ± 8.4 (0.0–27.2) 8.7 ± 6.9 (0.0–21.2) 7.3 ± 5.5 (0.0–17.5) 7.1 ± 5.3 (0.0–17.5)
p-value 0.01 0.02 0.02 0.02
Lung
V5Gy (cm3) 16.5 ± 5.8 (7.7–30.0) 17.3 ± 5.1 (8.0–26.7) 16.8 ± 5.7 (7.5–28.7) 16.1 ± 5.6 (7.2–28.3) (ii)-(iv)
p-value 0.01 0.04 0.02 0.03
V20Gy (cm3) 6.7 ± 3.3 (2.7–13.5) 6.8 ± 3.1 (2.9–12.0) 6.3 ± 3.0 (2.6–11.9) 6.2 ± 3.1 (2.5–12.2) (ii)-(iii); (ii)-(iv)
p-value < 0.01 < 0.05 0.02 < 0.01
MLD (Gy) 4.0 ± 1.6 (1.8–7.2) 4.1 ± 1.3 (1.9–6.1) 3.9 ± 1.4 (1.8–6.3) 3.8 ± 1.4 (1.7–6.3) (ii)-(iv)
p-value 0.01 0.01 < 0.01 < 0.01
Abbreviations are the same as in Table 1Note: The motion effect is the evaluated by comparing the recalculated and accumulated dose on the MidV–CT
Leung et al. Radiation Oncology (2020) 15:130 Page 13 of 16
particularly using all 4DCT images, the highest robustnesswas achieved to prevent the dose limits in the normal tis-sues from being exceeded when the target is displaced intodifferent respiratory positions.As the final validation, we compared the optimized
dose on a single CT and the recalculated doses summedover all 4DCT images. Such comparisons offer clarifica-tions to two important issues concerning the non–consistency of PTV concept in lung SBRT. Firstly, iftype–B dose engine induced excessive fluence in PTV–based optimization, the GTV would eventually accumu-late significant higher dose when it moved into differentbreathing phases. However, no clear indication of over-exposure to the GTV can be associated with PTV–basedoptimization (Table 3). The GTV D50 and D2 obtainedfrom PTV–optimized plans for the ITV and mid–venti-lation concepts changed by 0.3 Gy only after dose sum-mation and on the contrary decreased rather thanincreased. The significant increase of GTV D98 in thePTV–optimized plans based on the ITV concept doesnot appear to be related to the type–B dose engine be-cause it did not occur to the other PTV–optimized plansthat adopted the mid–ventilation concept. Instead, itwas presumably caused the systematic change in usingthe AIP images for dose optimization to the mid–venti-lation images for dose accumulation. For the rather ex-treme situation using the end–exhale CT for fluenceoptimization, neither did Guckenberger et al. [24] ob-serve serious problem of excessive build up of photonfluence at the opposite end–inhalation that caused a sig-nificant change in the overall GTV dose either. Moreinterestingly, the authors too found an increase ratherthan a decrease in the summed GTV dose (presumablyD95) by less than 1% or 0.7 Gy only. Among all GTVdose parameters, D50 appears to be the most robustagainst changes showing no statistical significance ex-cept for the ITV–based robust optimization. Based onthese results, we conclude that type–B dose engine, perse, does not significantly increase the GTV dose. Thesignificantly higher GTV dose in the PTV–optimizedplans than WCS optimized plans is rather a direct con-sequence of the prescription method.Secondly, equal variances of the GTV dose parameters
among the PTV and WCS–optimized plans are still ob-served after dose summation over the ten 4DCT images.The inter–patient variability (one standard deviation)changes only by 0.1 Gy after dose summation in all but theGTV D98 of the WCS–optimized plans (0.9 Gy). Thissimply means that the inconsistency of GTV dose cannotbe easily resolved by migrating from the PTV concept torobust optimization irrespective of the type–B dose engine[1, 14]. For the same reasoning, we would argue that usingtwo classes of dose engines, a type–A for fluenceoptimization followed by a type–B for subsequent dose
calculation and renormalization will not resolve the incon-sistent GTV dose either. We would further argue that PTVconcept, in its very design to account for geometric uncer-tainty, shall not be considered as a pitfall. Consistency ofclinical outcome report shall not be compromised providedthat the advanced dose engines are used to estimate and re-port the GTV dose parameters following the ESTROACROP recommended guidelines [11].
PTV– and WCS–based SBRT by GTV median doserenormalizationLebredonchel et al [14] suggested that prescribing basedon 50% mass of the PTV can somewhat stabilize variabilityof the target dose but they concluded further that movingaway from the PTV concept for prescription remains theonly solution if using type–B dose engine. They came tothis conclusion because the GTV median dose D50 differssubstantially with variable lung density and tumor sizewhen prescription is done to the PTV. However, this con-clusion is considered as partly true only because our re-sults already showed that other PTV–free concept by theworst case method does not stabilize the target doses ei-ther when the ICRU recommended prescription by cover-age (i.e., GTV D98 or ITV D98) was followed. Instead, theprescription method has the major impact on the variabil-ity of GTV dose. After renormalization based on GTVD50, the separations of the DVH families became muchpacked together for all plans optimized using differentconcepts (Fig. 4), as compared to those obtained from pre-scription by coverage (Fig. 1). The resulting SDs of D98
and D50 and D2 are limited to 1 Gy for PTV– and 1.4 Gyfor WCS–optimized plans, respectively. Focusing on theconcept of ITV as motion encompassing, Lang et al. simi-larly showed that the SDs of PTV D98 and D50 and ITVD98 of 38 patients are limited to 1.5 Gy after ITV D50
renormalization to 57Gy [18]. They also showed that theITV D50 renormalization is superior to renormalization byITV/PTV coverage D98 as it can reduce the variability ofPTV and ITV dose parameters among delivery techniques(dynamic conformal arc vs. VMAT). More importantly,the differences of GTV D98 and D50 and D2 among opti-mized plans based on the PTV concept and the WCSmethod (Table 4) were found to reduce markedly. Theseresults are still valid despite the variation of tumor pos-ition in the respiration cycle, with GTV D50 being the onlydose parameter that showed statistically significant differ-ence. However, the absolute difference of 0.2 Gy isdeemed clinically unimportant. Same as the results ofcoverage prescription, the median dose turned out to bethe most robust against uncertainty of tumor positionamong other GTV dose parameters.The effect of GTV D50 renormalization is also marked
at the phase to phase level (Fig. 5). The median of all GTVdose parameters became much closer among the plans
Leung et al. Radiation Oncology (2020) 15:130 Page 14 of 16
that adopted different concepts for setup and motioncompensation. Compared to the prescription by coveragemethod recommended by ICRU 91 report, the maximuminter–phase difference of GTV D98 was reduced by 2.4,4.8 and 2.4% and 1.0% for PTV optimization by the ITVand mid–ventilation concepts, and WCS optimization tothe ITV and GTV, respectively.In summary, when SBRT plans are directly prescribed
or renormalized to the GTV median dose D50
1. the consistency of GTV dose across the near–minimum, median, and near–maximum points issignificantly improved, i.e. reduced inter–patientvariability
2. harmonization of GTV dose is made possible forlung SBRT plans that adopt different concepts tohandle geometric uncertainty caused by respiratorymotion.
The first point simply implies that one can continue withthe PTV concept for dose planning. The second point im-plies that consistent GTV dose shall be ensured betweenSBRT centers employing either the PTV concept or theworst case scenario concept in dose planning, and differentdelivery techniques as indicated by Lang et al. [18].On the other hand, one may question the value of robust
optimization concerning its computational overheads, if byD50 GTV prescription alone can simply harmonize theGTV dose among optimization solutions. From the normaltissue dose perspective, our phase–by–phase analysis indi-cates that WCS optimization in general improved the dosi-metric robustness, resulting in the fewest number of dosedeviations from the OAR limits. Furthermore, lower NLV5and MLD (Table 3) during respiration were constantly ob-served in the WCS optimization group regardless of theprescription method. In particular, WCS optimization tothe GTV using all 4DCT images resulted in the lowest nor-mal tissue dose and highest robustness against deviation ofnormal tissue dose limit among all optimization methods.
Limitation of the studyThis study was designed by assuming the same amountof geometric uncertainties from tumor motion and pa-tient setup in the calculation of the PTV and in the def-inition of the WCS parameters. Nonetheless, our resultsconsidered exclusively the uncertainty of tumor positiondue to breathing motion. The validity of our results shallhold because uncertainty of respiratory motion, which isconsidered as systematic in our phase–to–phase analysisfor the GTV dose changes, is much greater than that ofsetup limited to millimeter accuracy with stereotacticimage guidance.The other limitation is the small number of patients
which may subject our results to bias. Only 2 out of 13
patients showed tumor motion more than 1 cm. It is un-clear whether our dosimetric results will remain un-changed if more patients with larger amplitude of tumormotion are included.We also acknowledge that the exact formulation of the
robustness optimization may have an influence on thedosimetric results [22]. Despite the numerous robustnessoptimization algorithms, there is only one commercialplanning system that makes robust optimization avail-able for clinical use. This study, like many other previousones, was based on the worst case scenario optimizationfrom the same planning system. Lastly, this study fo-cused on a certain type (convolution–superposition) andclass (type–B) of dose engine. Systematic difference be-tween Monte Carlo and type B dose engines is wellknown especially in cases where extreme electroncharged disequilibrium exists [26]. Further investigationwith Monte Carlo dose engine is warranted to generalizethe present findings.
ConclusionsThe pitfalls of PTV concept have no association withtype–B dose engine in lung SBRT. Inconsistent targetdose is not unique to the PTV concept but the worstcase method implemented in the robust optimization.Prescription by coverage, regardless to the PTV D95 orGTV D98 in common practice has the major impact onthe consistency of GTV dose. GTV median dose pre-scription or renormalization can effectively decrease theinter–patient and inter–optimization method (PTV andworst case scenario) variability of GTV dose.
AbbreviationsSBRT: Stereotactic body radiotherapy; 4DCT: Four dimensional computedtomography; AIP: Averaged intensity projection; MidV: Mid-ventilation;VH: van Herk’s margin recipe; RO: Robust optimization; WCS: Worst casescenario; GTV: Gross tumor volume; ITV: Internal target volume; PTV: Planningtarget volume; PTVITV: SBRT plan by PTV + ITV concept using AIP-CT;PTVVH: SBRT plan by PTV + VH concept using MidV-CT; WCSITV: SBRT plan byWCS + ITV concept using AIP-CT; WCSGTV: SBRT plan by WCS + GTV conceptusing 4DCT
AcknowledgementsWe acknowledge support by the Open Access Publication Fund of theUniversity of Duisburg-Essen.
Authors’ contributionsRL and MKHC conceived the study. RL and MW performed the treatmentplanning and the collection of dosimetric data for analysis. MKHC and OBperformed the data analysis and prepared the manuscript. CL reviewed andproof-read the manuscript. The author(s) read and approved the finalmanuscript.
FundingNot applicable.
Availability of data and materialsThe datasets related to patient information are not available. Other dataused and / or analyzed during the present study are available from thecorresponding author on reasonable request.
Leung et al. Radiation Oncology (2020) 15:130 Page 15 of 16
Ethics approval and consent to participateThis study was approved by an institutional review board (study reference:NTWC/CREC/17100).
Consent for publicationNot applicable.
Competing interestsThe authors declare no conflicts of interests.
Author details1Department of Clinical Oncology, TuenMun Hospital, Hong Kong, SAR,China. 2Department of Radiotherapy, West German Cancer Center, UniversityHospital Essen, University of Duisburg-Essen, Hufelandstraße 55, 45147 Essen,Germany. 3Department of Radiotherapy, University Hospital Essen, KielCampus, 24105 Kiel, Germany. 4Department of Clinical Oncology, TheUniversity of Hong Kong, Hong Kong, China.
Received: 20 March 2020 Accepted: 17 May 2020
References1. Guckenberger M, Andratschke N, Dieckmann K, Hoogeman MS, Hoyer M,
Hurkmans C, Tanadini-Lang S, Lartigau E, Méndez Romero A, Senan S,Verellen D. ESTRO ACROP consensus guideline on implementation andpractice of stereotactic body radiotherapy for peripherally located earlystage non-small cell lung cancer. Radiother Oncol. 2017;124:11–7.
2. Nohadani O, Seco J, Bortfeld T. Motion management with phase-adapted4D-optimization. Phys Med Biol. 2010;55:5189–202.
3. Lebredonchel S, Lacornerie T, Rault E, Wagner A, Reynaert N, Crop F. Aboutthe non-consistency of PTV-based prescription in lung. Phys Med. 2017;44:177–87.
4. Lacornerie T, Lisbona A, Mirabel X, Lartigau E, Reynaert N. GTV-basedprescription in SBRT for lung lesions using advanced dose calculationalgorithms. Radiat Oncol. 2014;9:223.
5. Li Y, Rodrigues A, Li T, Yuan L, Yin F-F, Wu QJ. Impact of dose calculationaccuracy during optimization on lung IMRT plan quality. J Appl Clin MedPhys. 2015;16:219–28.
6. Bzdusek K, Friberger H, Eriksson K, Hårdemark B, Robinson D, Kaus M.Development and evaluation of an efficient approach to volumetric arctherapy planning. Med Phys. 2009;36:2328–39.
7. Bokrantz R. Multicriteria optimization for volumetric-modulated arc therapyby decomposition into a fluence-based relaxation and a segment weight-based restriction. Med Phys. 2012;39:6712–25.
8. Seuntjens J, Lartigau EF, Cora S, Ding GX, Goetsch S, Nuyttens J, Roberge D.ICRU report 91. Prescribing, recording, and reporting of stereotactictreatments with small photon beams. J ICRU. 2014;4(2):1–160.
9. de Jong EEC, Guckenberger M, Andratschke N, Dieckmann K, HoogemanMS, Milder M, Møller DS, Nyeng TB, Tanadini-Lang S, Lartigau E, et al.Variation in current prescription practice of stereotactic body radiotherapyfor peripherally located early stage non-small cell lung cancer:recommendations for prescribing and recording according to the ACROPguideline and ICRU report 91. Radiother Oncol. 2019;142:217–23 .
10. Tanadini-Lang S, Wilke L, Karava K, Andratschke N, Ehrbar S, GuckenbergerM. Dose normalization in lung SBRT based on ICRU 91 and comparison toalterative normalization methods. Radiother Oncol. 2018;127:S1213–4.
11. Baumann R, Chan MKH, Pyschny F, Stera S, Malzkuhn B, Wurster S,Huttenlocher S, Szücs M, Imhoff D, Keller C, et al. Clinical results of meanGTV dose optimized robotic-guided stereotactic body radiation therapy forlung tumors. Front Oncol. 2018;8:171.
12. Bibault J-E, Mirabel X, Lacornerie T, Tresch E, Reynaert N, Lartigau E.Adapted prescription dose for Monte Carlo algorithm in lung SBRT: clinicaloutcome on 205 patients. PLoS One. 2015;10:e0133617.
13. Liu W, Schild SE, Chang JY, Liao Z, Chang Y-H, Wen Z, Shen J, Stoker JB,Ding X, Hu Y, et al. Exploratory study of 4D versus 3D robust optimization inintensity modulated proton therapy for lung cancer. Int J Radiat Oncol BiolPhys. 2016;95:523–33.
14. Liang X, Zheng D, Mamalui-Hunter M, Flampouri S, Hoppe BS, MendenhallN, Li Z. ITV-based robust optimization for VMAT planning of stereotacticbody radiation therapy of lung cancer. Pract Radiat Oncol. 2019;9:38–48.
15. Zhang X, Rong Y, Morrill S, Fang J, Narayanasamy G, Galhardo E, MaraboyinaS. Croft C, xia F, Penagaricano J: robust optimization in lung treatment plansaccounting for geometric uncertainty. J Appl Clin Med Phys. 2018;19:19–26.
16. Archibald-Heeren BR, Byrne MV, Hu Y, Cai M, Wang Y. Robust optimizationof VMAT for lung cancer: Dosimetric implications of motion compensationtechniques. J Appl Clin Med Phys. 2017;18:104–16.
17. Wolthaus JWH, Schneider C, Sonke J-J, van Herk M, Belderbos JSA, RossiMMG, Lebesque JV, Damen EMF. Mid-ventilation CT scan construction fromfour-dimensional respiration-correlated CT scans for radiotherapy planningof lung cancer patients. Int J Radiat Oncol Biol Phys. 2006;65:1560–71.
18. Weistrand O, Svensson S. The ANACONDA algorithm for deformable imageregistration in radiotherapy. Med Phys. 2015;42:40–53.
19. Wolthaus JWH, Sonke J-J, van Herk M, Belderbos JSA, Rossi MMG, LebesqueJV, Damen EMF. Comparison of different strategies to use four-dimensionalcomputed tomography in treatment planning for lung cancer patients. Int JRadiat Oncol Biol Phys. 2008;70:1229–38.
20. Xiao Y, Papiez L, Paulus R, Timmerman R, Straube WL, Bosch WR, Michalski J,Galvin JM. Dosimetric evaluation of heterogeneity corrections for RTOG0236: stereotactic body radiotherapy of inoperable stage I-II non-small-celllung cancer. Int J Radiat Oncol Biol Phys. 2009;73:1235–42.
21. Guckenberger M, Andratschke N, Alheit H, Holy R, Moustakis C, Nestle U,Sauer O. Deutschen Gesellschaft für R: definition of stereotactic bodyradiotherapy: principles and practice for the treatment of stage I non-smallcell lung cancer. Strahlenther Onkol. 2014;190:26–33.
22. Fredriksson A. A characterization of robust radiation therapy treatmentplanning methods—from expected value to worst case optimization. MedPhys. 2012;39:5169–81.
23. Korevaar EW, Habraken SJM, Scandurra D, Kierkels RGJ, Unipan M, EeninkMGC, Steenbakkers RJHM, Peeters SG, Zindler JD, Hoogeman M, LangendijkJA. Practical robustness evaluation in radiotherapy – a photon and proton-proof alternative to PTV-based plan evaluation. Radiother Oncol. 2019;141:267–74.
24. Guckenberger M, Wilbert J, Krieger T, Richter A, Baier K, Meyer J, Flentje M.Four-dimensional treatment planning for stereotactic body radiotherapy. IntJ Radiat Oncol Biol Phys. 2007;69:276–85.
25. Fredriksson A, Bokrantz R. A critical evaluation of worst case optimizationmethods for robust intensity-modulated proton therapy planning. MedPhys. 2014;41:081701.
26. Li J, Galvin J, Harrison A, Timmerman R, Yu Y, Xiao Y. Dosimetric verificationusing monte carlo calculations for tissue heterogeneity-corrected conformaltreatment plans following RTOG 0813 dosimetric criteria for lung cancerstereotactic body radiotherapy. Int J Radiat Oncol Biol Phys. 2012;84:508–13.
Publisher’s NoteSpringer Nature remains neutral with regard to jurisdictional claims inpublished maps and institutional affiliations.
Leung et al. Radiation Oncology (2020) 15:130 Page 16 of 16