Embed Size (px)
Citation preview
Colgate University Journal of the Sciences 115
ON THE ORIGIN OF GENOVESA BASALT,
GALAPAGOS, ECUADOR
DANIEL KORICH
Abstract The Galapagos Islands are believed to be the surface manifestation of a mantle plume or hotspot. However, the geochemical compositions of Galapagos basalts are inconsistent with deep, mantle-derived material, contradicting a typical hotspot model. Isotopic, trace, and major element data from the Galapagos Island suggest that at least two mantle sources have mixed to form the Galapagos platform. The Galapagos Plume, geographically centered on the western edge of the Galapagos Islands, and the Galapagos Spreading Center, an active mid-ocean ridge located 100 km to the north-east of the mantle plume, are believed to be the primary contributors of mantle material. The current geographic location of Genovesa between the Galapagos Spreading Center and the Galapagos Hotspot provides a unique opportunity to refine theories regarding the interaction of plumes and adjacent mid-ocean ridges. The geochemistry of a series of samples representing the entire subaeriel exposure of Genovesa, a small island on the northeast corner of the Galapagos platform, show a close resemblance to mid-ocean ridge basalt from the adjacent Galapagos Spreading Center, the depleted end member in the regional mixing system.
Introduction Although the Galapagos Islands are primarily associated with biology and Darwin's theory of
evolution, geologists are making significant progress understanding the inner structure of the Earth's mantle by studying in this region. The Galapagos Islands are believed to have formed from a mantle plume, also known as a hotspot, which has risen from the deep mantle up through the oceanic lithosphere. The geographic center of the Galapagos Hotspot if believed to be located below Fernandina Island (figure 1). Never the less, the geochemical compositions of Galapagos basalts are inconsistent with deep, mantle-derived material, contradicting the typical hotspot model. For this reason, an investigation into the chemical evolution of Galapagos basalts is essential for understanding the mechanics of mantle plumes, how mantle plumes interact with the upper mantle, and how the relationship between a mantle plume and the upper mantle has influenced the genesis of the Galapagos Islands. Typical hotspots, such as the source of the Hawaiian Islands, are believed to originate at the core mantle boundary, also known as D'', approximately 2900 km below the surface (Anderson et al., 1998). This region of the mantle is more primitive, that is, richer in incompatible elements than the depleted, shallow mantle. Incompatible elements are elements with large atomic radii but relatively low atomic mass. Deep mantle plumes originate as column of hot plastic rock, which then begin to melt as it ascends into the upper mantle (figure 2). The partial melt that is produced from a rising mantle plume is enriched in incompatible elements relative to its primitive source due to the low partition coefficients of the large ions. Therefore, hotspot lavas are compositionally distinct from other lavas due to enrichment in incompatible elements during the melt generation process. The typical Hawaiian-style hotspot model does not entirely explain the chemical compositions observed in Galapagos basalts. Depleted basalts are found in the central and northeast region of the Galapagos archipelago (Geist and White, 1988; White et al., 1993; Harpp, 1995). These lavas are compositionally similar to those produced at mid-ocean ridges, which are derived as partial melts of the depleted upper mantle. Enriched basalts more typical of a mantle plume are found in the northern, western, and southern parts of the archipelago (Geist and White, 1988; White et al., 1993; Harpp, 1995). The significant and anomalous geochemical variations observed in then Galapagos Islands suggest that a deep mantle plume may be interacting with one or more geochemically distinct mantle sources. A detailed investigation of the magmatic evolution of the northern island of Genovesa will provide greater understanding as to how the Galapagos hotspot interacts with other mantle reservoirs as it ascends to the surface.

116 Colgate University Journal of the Sciences
The proximity of the Galapagos hotspot to an active mid-ocean ridge may explain the wide diversity of lava compositions in the archipelago (figure 1). The Galapagos hotspot is only 100 km south of the Galapagos Spreading Center. Paleotectonic reconstruction indicates that the GSC passed over the stationary Galapagos hotspot eight million years ago (Hey et al., 1977). Schilling et al. (1976) first noticed regions of geochemical enrichment, the chemical signature of plume material, in lavas erupted at the Galapagos spreading ridge, with the geochemical enrichment peaking at the closest approach of the ridge to the hotspot. Shortly thereafter, a study by White and Hoffman (1978) identified areas of geochemical depletion within the Galapagos platform. The observations made by these investigators are consistent with the theory that the plume and shallow mantle melt are interacting with each other at the GSC and within the mantle plume.
However, the mechanism of interaction is not straightforward. A binary mixing model proposed by White et al. (1993) to explain the chemical variations of Galapagos hotspot and spreading center lavas by the exclusive mixing of plume and shallow mantle material proved to be too simple and was unable to explain all the variability (Harpp, 1995).
Precisely how the Galapagos hotspot and the GSC have contributed to the formation of the Galapagos archipelago is still not completely understood. The current geographic location of a chain of five islands- Darwin, Wolf, Pinta, Marchena, and Genovesa- between the spreading ridge and the Galapagos hotspot provides a unique opportunity to refine theories regarding the interaction of plumes and adjacent mid-ocean ridges (figure 1). Darwin, Wolf, Pinta, Marchena, and Genovesa lie on a northwest-southeast trend just off the northern edge of the Galapagos platform (e.g. Cullen and McBirney, 1987). These five islands produce a heterogeneous mixture of both tholeiitic and mildly alkaline basaltic lava (Cullen and McBirney, 1987). Morgan (1978) and Cullen and McBirney (1987) suggest the variation is a result of plume material being transferred into the GSC along a shallow mantle conduit, consistent with the earlier work of Schilling (1976). Basalt samples have been collected from a single cliff on Genovesa. The samples collected from this cliff represent the entire subaerial history of Genovesa, and are possibly the most complete and detailed section collected from any northern Galapagos island. Mass spectrometry and X-ray diffraction were performed on these basalts to determine bulk major and trace element concentrations. The major and trace element concentrations allow certain conclusions to be drawn about the local geologic processes that have occurred during the formation and eruptive history of Genovesa, and how Genovesa fits into the regional picture of plume and ridge interaction. Locally, the geochemical data indicates that the subaeriel exposure of Genovesa was erupted from a long-lived and unfractionated magma chamber. Harker variation diagrams indicate that the geochemistry of the erupted lavas on Genovesa do not represent a liquid line of descent from a continuously fractionating mamgma chamber. Instead, the lavas appear to have been derived from a magma chamber that was underwent periodic and frequent refreshment with magma of a constant composition. The observation that the magma chamber was long lived and unfractionated supports the conclusions of Contag (1978) regarding the two prominent calderas on Genovesa (figure 3). Contag (1978) argues that the central caldera was the principle vent for all of the subaerial lava on Genovesa, except for fissure flow material unrelated to the formation of Genovesa. The magma chamber for the central vent is the large caldera, which has been flooded to form Darwin Bay, according to the model proposed by Contag. Although fractional crystallization is expected in a magma chamber the size of the one that collapsed to form Darwin Bay, the geochemical similarity of lavas suggests that multiple small magma chambers that are less prone to the effects of fractional crystallization are an unlikely source of the erupted lava. The geochemistry of Genovesa is also important for understanding the relationship between the Galapagos Mantle Plume and the Galapagos Spreading Center. The most important geochemical data for distinguishing the relationship of Genovesa to these two formational variables are the rare earth elements.
REE patterns can indicate the source region as the incompatible element enriched deep mantle or the incompatible element depleted upper mantle, or a combination of both. A REE comparison basalts derived from the Galapagos Plume and basalts derived from the upper mantle show that Genovesa closely resembles the MORB from the East Pacific Rise. The REE plot for Genovesa strongly indicates that mid-ocean ridge basalt is the primary constituent of Genovesa basalt, and the lavas of Genovesa were derived from the shallow mantle.

Colgate University Journal of the Sciences 117
Material and Methods
Rock Collection Procedure Ten days were spent on Genovesa Island, also known as Tower Island, located in the northeast
corner of the Galapagos archipelago (figure 1). At each sample site, a Global Positioning System (GPS) was activated immediately upon arrival and allowed to average for a more accurate position during the time that took it to sample the cliff section. The precise location of the cliff sample is N 00° 18 ' 33.5'' latitude and 89° 57' 50.2 longitude. The first sample was hammered out at the high tide line, and each successive sample was taken at approximately six meter intervals, with the total column height estimated at 71 meters. Due to the verticality of the cliff face, the lateral discontinuity in the cliff section is estimated at 50 meters. The samples were place in sample bags with one or two other rocks, and labeled. Later, the rocks were removed and placed in individual sample bags, and relabeled.
Rock Grinding and XRF The samples were cut, ground into powder, and placed into glass vials at Macalester College.
Powder from each sample was also used for both pressed pellet and glass bead analysis X-Ray fluorescence.
ICP-MS For each rock sample, approximately .25 g of rock powder was weighed. The weight was record
precisely to the ten thousandth of a gram on an analytical balance. The rock powder was poured directly out of the glass vials onto weighing paper. After the weight was recorded, the rock powder was placed into Cervillex 30 ml Teflon capsules and labeled using marker. The Teflon capsules were cleaned by submergence for 24 hours in successive baths of Citronox soap and water, 50% nitric acid, and 50% hydrochloric acid. A procedural blank was included at the beginning of the weighing process.
Under a ventilating hood, 15 ml of trace metal grade nitric acid and 10 ml of trace metal grade hydrofluoric acid were added to the rock powder in the Teflon capsules. The capsules were recapped and placed on hotplates set to low heat, at a setting of approximately 2.5. After 37 hours of heating, the capsules were taken off the hot plates and allowed to cool for one hour. The capsule tops were then removed, and the uncapped capsules were placed back on the hotplates and allowed to evaporate in a ventilating hood until completely dry.
Samples G99-5B, G99-5C, and G99-5J were refilled with 10 ml of trace metal grade nitric acid, 10 ml of water, and 1 ml of hydrofluoric acid after 29 hours of evaporation. These three samples were capped and removed from heat during the time the other samples were evaporating. The rest of the samples and the procedural blank were refilled after 45.5 hours with the same volumes and types of acid. Each sample was then returned to the hotplates set to setting 2.5 for 3 hours and 15 minutes.
The dissolved rock samples were placed into 250 ml plastic bottles that were cleaned using successive 24 hour baths of Citronox soap and water and 25% nitric acid. Before the dissolved rock and acid was added to the 250 ml bottles, the bottles were labeled. The contents of the Teflon capsules were completely transferred into the 250 ml bottles, and the capsules were repeatedly filled with water and emptied into the 250 ml bottles. After all the dissolved rock and acid was transferred to the 250 ml bottles, pure water was added until the bottle was almost full. The 250 ml bottles were then weighed and recorded. The bottles, enclosed in ziplock bags, were placed inside a cleanbox immediately after being weighed.
The rock dissolution procedure was conducted in a dust free lab. All water that was used for cleaning and dissolution was filtered by a Millipore water filtration system that produces water with a resistivety of 18.2 ohms/cm. The samples were only exposed to unfiltered air for a short period of time, approximately 2 minutes, during weighing on the analytical balance. The sample containers were enclosed in ziplock bags during transport from the dust-free lab to the analytical balance.
Immediately prior to analysis, the liquid samples and standards were transferred into plastic vials, which had been cleaned using successive 24 hour baths of Citrinox soap and water, and 25% nitric acid. The vials were placed in an autosampler, and processed through a Hewlett Packard 4500 Inertly Coupled Plasma-Mass Spectrometer. Prior to processing the samples through the ICP-MS, a new skimmer cone and sampling cone were installed and the electrostatic lens assembly was cleaned.

118 Colgate University Journal of the Sciences
Data
Hand Sample and Thin Section Descriptions In general, the thin sections from Genovesa show features that are typical of basalt. There is some
variation in the texture and composition of the groundmass within each of these samples, but all the samples have to some degree a crystalline groundmass consisting of various concentrations of plagioclase, pyroxene, and brown glass. Also, some samples contain various concentrations of phenocrysts and glomerocrysts or clusters of crystalsof plagioclase.
G99-5A: A dark gray aphyric basalt. The rock is 15% vesicles, which range in size from 1-3 mm. Microcrystaline and equigranular in thinsection. Interstial plagioclase and pyroxene, with some intersertal brown cryptocrystaline glass between the palgioclase blades. Plagioclase grains are subhedral blades and laths, which are 65% of the crystalline material. Subhedral to anhedral pyroxene are 30-35% of the crystaline material; moderately vesicular, medium vesicles.
G99-5B: A blackish gray aphyric basalt with orange oxidation in some areas. The rock is 45% vesicles, which range in size from 1-6 mm. In thin section, 5b shows glomeroporphyritic texture. Clusters of subhedral plagioclases and clusters of plagioclase with integranular pyroxenes are enclosed by a microcrystaline to cryptocrystaline groundmass of equigranular plagioclase and pyroxene. Some brown glass is presents. Subhedral plagioclase constitutes 655 of the crystal clots. Subhedral pyroxenes constitute approximately 35% of the glomerocrysts.
G99-5C: In hand specimen, a light gray basalt with 20% plagioclase phenocrysts. The plagioclase crystals range in size between 3-10 mm. The sample is 15% vesicles with vesicles ranging in size from 1- 2 mm. In thin section, the porphyritic texture of phenocrysts of plagioclase is clearly evident, surrounded by a groundmass of microcrystaline plagioclase and pyroxene. The plagioclase phenocrysts are subhedral to anhedral. Glomerocrysts with significant embayment and intergrowth between plagioclase crystals are prominent. No zoning was identified in the plages. The groundmass is 50% subhedral blades of microcrystal plagioclase and 50% interstial pyroxene.
G99-5D: A light gray porphyritic basalt. Phenocrysts of plagioclase crystals range in size between 3-10 mm. The rock is 10% vesicles with the vesicles ranging in size between 1- 2 mm. The porphyritic texture is surrounded by a groundmass of microcrystaline plagioclase and pyroxene. The plagioclase phenocrysts are subhedral and constitute 20% of the rock. Glomerocrysts with some embayment and intergrowth between plagioclase crystals exist. Zoning is identifiable within two large phenocrysts. The groundmass is 50% subhedral blades of microcrystal plagioclase and 50% interstial pyroxene.
G99-5E: A gray, porphyritic basalt. 25% of the rock is plagioclase phenocrysts. The phenocrysts are subhedral and range in size from 2-5 mm. The rock is 10% vesicles with vesicles ranging in size from 1-3 mm. The phenocrysts of plagioclase are contained in a groundmass of microcrystaline plagioclase and pyroxene. The plagioclase phenocrysts are subhedral. Glomerocrysts with some embayment and intergrowth between plagioclase crystals exist. Zoning is identifiable in two medium sized phenocrysts. The groundmass is 45-50% subhedral to anhedral blades of microcrystaline plagioclase, 45-50% interstial pyroxene and some brown glass. The matrix appears slightly less well formed than in 5c and 5d, especially the plagioclase laths within the groundmass.
G99-5F: A light gray and dense plag-phyric basalt. The rock is 1% plagioclase, with microphenocrysts no larger than 1 mm in size. The few phenocrysts show significant intergrowth. The rock is 15% vesicles, with vesicles ranging in size from 1-3 mm. Some areas are avesicular. Under the microscope a microporphyritic texture is evident, with a microcrystaline to cryptocrystaline matrix. The groundmass consists of 25% anhedral to subhedral plagioclase, 35% pyroxene, and 30% brown glass.
G99-5G: A light gray aphyric basalt, although <1 mm plagioclase phenocrysts are visible but constitute <1% of the rock. The sample is 10% vesicles, with vesicles ranging in size <1-2 mm and distributed in clusters throughout the rock. Some areas are avesicular. This sample is similar to 5f in being microporphyritic, with the phenocrysts completely anhedral, elongated, and with significant intergrowth and embayement. The groundmass is microcystaline and subequigranular. The plagioclase crystals in the groundmass are subhedral blades and columns, constituting 30% of the groundmass. Pyroxenes are interstial and are approximately 40% of the groundmass. Intersertal brown glass is also prominent; constituting 30% of the groundmass. Certain areas within the slide appear to have been cooled faster than others, areas of smaller microlites and more brown glass are plainly evident.

Colgate University Journal of the Sciences 119
G99-5H: Dark gray to reddish brown with plagioclase phenocrysts constituting 3% of the rock. The plagioclase phenocrysts are no larger than 1mm. The rock is 45% vesicles, with vesicles ranging in size from 2-6 mm. The texture of the basalt is microcrystaline, with extremely small and extremely few equigranular plagioclase phenocrysts. The groundmass consists of subhedral plagioclase columns and needles that constitute 30% of the groudmass. A small amount of pyroxene constitutes less than 5% of the rock. 65% of the groundmass is brown glass, significantly more than any other rock.
G99-5I: A light gray porphyritic, ultraphyric basalt that is 50% plagioclase megacrysts. The megacrysts are subhedral to euhedral plagioclase grains that range in size from 5-30 mm. The macrophenocrysts are subheral and tabular in thin section, but some corners are perfectly euhedral. A few small plagioclase crystals are embedded within and at the edges of the largest macrophenocrysts. Zoning is visible with the naked eye in a few extremely large megacrysts, but in thin section there are no zoned phenocrysts. Small glomerporphyritic clusters of equant, subhedral plagioclase blades are evident in thin section. The microcrystaline groundmass consists of 50% subhedral to anhedral needles of plagioclase, 5-10% anhedral interstial pyroxene, and 40% brown glass. 20% of the rock is vesicles. The vesicles range in size from 1-7 mm.
G99-5J: A gray basalt with light orange oxidation on exposed surfaces. 3% of the rock is plagioclase phenocrysts ranging in size from 3-5mm. 40% of the rock is vesicles that range in size between <1-5 mm. The texture of the rock is microrystaline, with an equigranular groundmass. The thin section shows a single glomerocryst of euhedral plagioclase. The glomerocryst consists of 3 to 5 intergrown, tabular plagioclase crystals. Two plagioclase grains are almost completely euhedral with sharply defined edges. No zoning is evident in this glomerocryst. The groundmass is 70% bladed, subhedral plagioclase, 20% intersertal brown glass, and 10% interstitial pyroxene.
G99-5K: In thin section, this rock is microcrystaline with a seriate textured. Subhedral plagioclase columns and laths of various sizes dominate the rock, with the plagioclase constituting 50% of the rock. Some poorly formed laths appear as small phenocrysts, with zoning visible in a small number of the larger grains. Interstitial pyroxenes and some larger subhedral pyroxenes constitute 40% of the rock. Intersertal brown glass constitutes 10% of the rock. The rock is 20% vesicles. The vesicles are all less than 4 mm.
Statistical Analysis of Major and Trace Element Data An F-test was performed on both major and trace element data (table 1). The experimental
variance across the data set was compared to the analytical variance to prove or disprove a null hypothesis to 95% certainty. The analytical variance was determined by treating one standard sample as an unknown during ICP-MS analyses, and from previously determined analytical error values for the XRF. The null hypothesis was proposed in order to determine if the difference in experimental concentrations between samples for each element is statistically significant. The complete results are presented in figure x. Concentrations and weight percentages within the data set are significantly different for most of the elements and oxides that are imp ortant for geochemical analysis and interpretation, and it is therefore valuable to continue an exploration of the geochemistry of samples from Genovesa.
Major Element Data Major element data is useful for classifying igneous rocks on the basis of their chemical
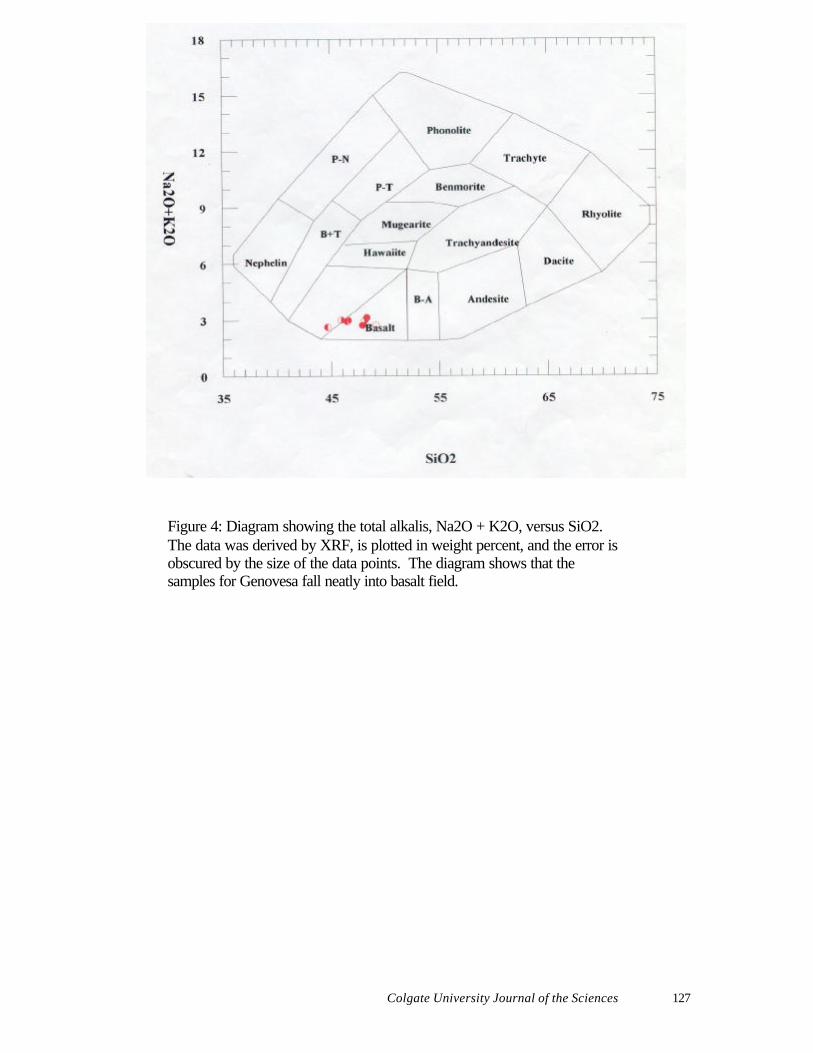
compositions, the complete results are located in table 2. The total alkalis -silica diagram (TAS) is one of the most useful classification schemes available for volcanic rocks (Rollinson, 49). The total alkali weight percentage of each sample, Na2O + K2O, is plotted against total silica weight percentage in figure 4 and figure 5. In figure 4, the samples fall neatly into the field of basalt, with little variation in alkali concentration. Volcanic rocks may also be subdivided into two major magma series, the alkaline and the subalkaline or tholeiitic, on the same total alkali versus silica plot. Figure 5 shows the samples falling below the alkaline-subalkaline dividing line, into the subalkaline or tholeiitic field. Also, on a triangular oxide diagram or AFM plot, figure 6, the sample set clusters in the tholeitic field. Although the differences are extremely small, figures 4, 5, and 6 do show statistically significant difference. In general, the sample set shows little variation in major element concentrations. The sample G99-5I, the only sample containing macrophenocrysts of plagioclase, is the most different. The sample set ranges in composition from 49.12% to 44.68% for SiO2, and from 9.18% to 5.92% for MgO. For both MgO and SiO2, G99-5I is the most depleted.

120 Colgate University Journal of the Sciences
Trace Element Data The complete trace element data from cliff section G99-5 is shown in table 3. Two methods were
performed on the dissolved samples, one series of analyses for low atomic masses and one series of analyses for high atomic masses. The ICP-MS analyzed the dissolved G99-5 samples, in addition to a procedural blank and five standards, in three continuous analyses. Some atomic masses were analyzed within both methods, but the data from method RBW is preferred over the data from method TM due to tuning difficulties and unoptimal performance of the ICP-MS during the analyses of method TM.
Although trace element data from both methods is used to varying degrees within this paper, the rare earth elements (REE), atomic numbers 57 through 71, are the most useful of all trace elements (Rollinson, 133). The REE elements are useful because all are stable 3+ ions that steadily decrease in ionic size with increasing atomic number (Rollinson, 134). REE with larger ionic radii have a greater preference for the liquid phase than ions with smaller atomic radii. During various petrological processes, the REE fractionate with respect to each other. For example, a melt derived from a rock with an equal concentration of all the REE elements will contain much higher concentrations of REE with large atomic radii than smaller diameter REE.
The predictable behaviors of the REE are useful to understanding the complex processes that have led to the genesis of volcanic rocks. The pattern of REE concentrations after being normalized to chondrite values is of considerable petrologic interest. The rare earth element pattern for the sample collected from Genovesa is shown in figure 7. The graph of REE concentrations, after being chondrite normalized, versus atomic number show little variation within the sample set. Sample G99-5I, the macrophenocrystic ultraphyric sample, is the most depleted.
Discussion Determining the genetic relationship among lavas from cliff section 5 is crucial to understanding
the formation of Genovesa. Examining major and trace element data from Genovesa lavas can identify geochemical variations and trends. Compositional variations and trends within the cliff section are useful for understanding the amount of fractional crystallization that has occurred prior, and for determining the source of the lavas. Also, understanding how these factors have change though times can be determined by examining the trends within the stratigraphic column.
Geochemical data from Genovesa is also useful for explaining the exact relationship between the mid-ocean ridge and the mantle plume. By comparing data from Genovesa to data from other locations within the Galapagos region, specifically the western islands and the mid-ocean ridge, the formation of Genovesa can be understood as part of the regional plume-ridge interaction.
Variation Diagrams Fractional crystallization is a significant process in the evolution of many igneous rocks, and is
frequently the cause for the geochemical variations observed within suites of related lavas (Rollinson, 1993). The process of fractional crystallization occurs inside a magma chamber or as magma is rising to the surface. Fractional crystallization has a predictable effect on basaltic composition, and can be examined using variation diagrams of major and trace element concentrations. If the geochemical variation exhibited within a suite of lavas is the result of simple shallow fractionation, the lava compositions should form a coherent trend on a graph of degree of fractionation ( e.g. MgO or SiO2) versus the concentration of a highly incompatible element (e.g., Na2O or TiO2).
Due to the affinity SiO2 and MgO have for entering into the solid state, the concentrations of SiO2 and MgO will decrease in the residual liquid as the liquid undergoes fractional crystallization. Incompatible elements will become increasingly concentrated in the residual liquid. The result of fractional crystallization is a liquid with a lower concentration of SiO2 and MgO, but higher concentrations of incompatible elements. Graphically, a negatively sloping, linear best-fit trend line will pass through the data points if significant fractional crystallization has occurred.
In order to determine the degree to which lavas from Genovesa have undergone fractional crystallization, the data from cliff section 5 on Genovesa are plotted on variation diagrams, figure 8 and figure 9, and a graph of stratigraphic height versus MgO, NaO2, and TiO2, figure 10. The plot of the incompatible oxides Na2O and TiO2 versus the compatible indicators of fractionation SiO2 and MgO show little evidence to support any significant amounts of systematic fractional crystallization. The data points
Colgate University Journal of the Sciences 121
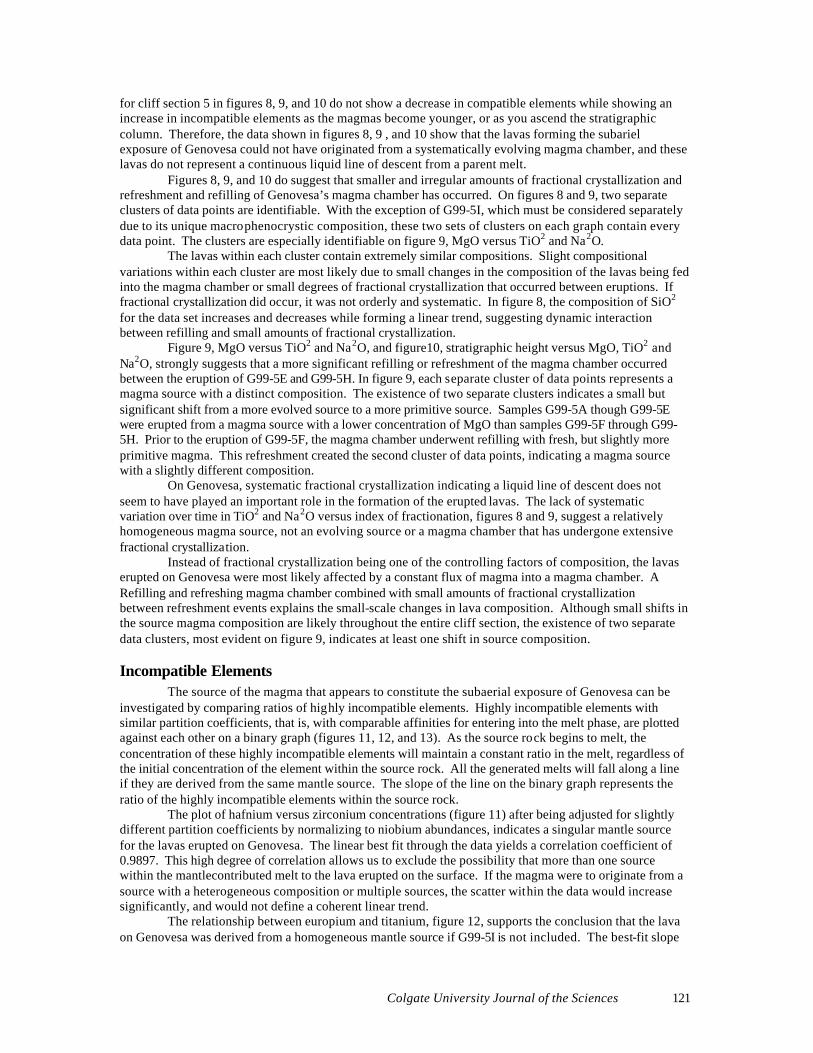
for cliff section 5 in figures 8, 9, and 10 do not show a decrease in compatible elements while showing an increase in incompatible elements as the magmas become younger, or as you ascend the stratigraphic column. Therefore, the data shown in figures 8, 9 , and 10 show that the lavas forming the subariel exposure of Genovesa could not have originated from a systematically evolving magma chamber, and these lavas do not represent a continuous liquid line of descent from a parent melt.
Figures 8, 9, and 10 do suggest that smaller and irregular amounts of fractional crystallization and refreshment and refilling of Genovesa’s magma chamber has occurred. On figures 8 and 9, two separate clusters of data points are identifiable. With the exception of G99-5I, which must be considered separately due to its unique macrophenocrystic composition, these two sets of clusters on each graph contain every data point. The clusters are especially identifiable on figure 9, MgO versus TiO2 and Na2O.
The lavas within each cluster contain extremely similar compositions. Slight compositional variations within each cluster are most likely due to small changes in the composition of the lavas being fed into the magma chamber or small degrees of fractional crystallization that occurred between eruptions. If fractional crystallization did occur, it was not orderly and systematic. In figure 8, the composition of SiO2 for the data set increases and decreases while forming a linear trend, suggesting dynamic interaction between refilling and small amounts of fractional crystallization.
Figure 9, MgO versus TiO2 and Na2O, and figure10, stratigraphic height versus MgO, TiO2 and Na2O, strongly suggests that a more significant refilling or refreshment of the magma chamber occurred between the eruption of G99-5E and G99-5H. In figure 9, each separate cluster of data points represents a magma source with a distinct composition. The existence of two separate clusters indicates a small but significant shift from a more evolved source to a more primitive source. Samples G99-5A though G99-5E were erupted from a magma source with a lower concentration of MgO than samples G99-5F through G99-5H. Prior to the eruption of G99-5F, the magma chamber underwent refilling with fresh, but slightly more primitive magma. This refreshment created the second cluster of data points, indicating a magma source with a slightly different composition.
On Genovesa, systematic fractional crystallization indicating a liquid line of descent does not seem to have played an important role in the formation of the erupted lavas. The lack of systematic variation over time in TiO2 and Na2O versus index of fractionation, figures 8 and 9, suggest a relatively homogeneous magma source, not an evolving source or a magma chamber that has undergone extensive fractional crystallization.
Instead of fractional crystallization being one of the controlling factors of composition, the lavas erupted on Genovesa were most likely affected by a constant flux of magma into a magma chamber. A Refilling and refreshing magma chamber combined with small amounts of fractional crystallization between refreshment events explains the small-scale changes in lava composition. Although small shifts in the source magma composition are likely throughout the entire cliff section, the existence of two separate data clusters, most evident on figure 9, indicates at least one shift in source composition.
Incompatible Elements The source of the magma that appears to constitute the subaerial exposure of Genovesa can be investigated by comparing ratios of highly incompatible elements. Highly incompatible elements with similar partition coefficients, that is, with comparable affinities for entering into the melt phase, are plotted against each other on a binary graph (figures 11, 12, and 13). As the source rock begins to melt, the concentration of these highly incompatible elements will maintain a constant ratio in the melt, regardless of the initial concentration of the element within the source rock. All the generated melts will fall along a line if they are derived from the same mantle source. The slope of the line on the binary graph represents the ratio of the highly incompatible elements within the source rock. The plot of hafnium versus zirconium concentrations (figure 11) after being adjusted for slightly different partition coefficients by normalizing to niobium abundances, indicates a singular mantle source for the lavas erupted on Genovesa. The linear best fit through the data yields a correlation coefficient of 0.9897. This high degree of correlation allows us to exclude the possibility that more than one source within the mantlecontributed melt to the lava erupted on the surface. If the magma were to originate from a source with a heterogeneous composition or multiple sources, the scatter within the data would increase significantly, and would not define a coherent linear trend. The relationship between europium and titanium, figure 12, supports the conclusion that the lava on Genovesa was derived from a homogeneous mantle source if G99-5I is not included. The best-fit slope

122 Colgate University Journal of the Sciences
representing the ratio of europium to titanium in each sample source yields a correlation coefficient of 0.8850 without including G99-5I. The correlation between the data points is strong, again indicating that the lava erupted on the surface of Genovesa was derived from a homogenous mantle source. The graph of europium and titanium (figure 12), if considered with figure 11 showing Hf versus Zr, indicates that G99-5I formed from the same the same magma as the sample set, but crystallized separately. In figure 11, the ratio of Zr to Hf in G99-5I is similar if not identical to the rest of the data set. In contrast, G99-5I lies far from the trend defined by the bulk of the samples on the Eu vs Ti plot (figure 12). The overabundance of europium within G99-5I can be attributed to the macrophenocrysts in the lava, as well as the unique physical properties of the element europium. Europium appears to be the only rare earth element that occurs in nature in both the divalent and trivalent states (Philpotts and Schnetzler, 1967). Plagioclase accepts divalent cations in the crystal lattice in greater abundance than trivalent cations. As a result, plagioclase-rich lavas will have higher concentrations of europium than other exclusively trivalent rare earth elements (Philpotts and Schnetzler, 1967). Therefore, it is not necessary to factor in a separate melt source with a higher concentration of europium to explain G99-5I. On the plot of hafnium versus zirconium (figure 11), G99-5I plots on the line with the rest of the data set because these elements are found in extremely low concentrations in plagioclase. Thus, the Hf/Zr ratio is not significantly affected by the abundance of plagioclase phenocrysts in G99-5I, and instead represents the original source composition. Sample G99-5I contains concentrations that are inconsistent with the rest of the data set only for elements that are abundant in plagioclase phenocrysts. Europium is preferentially incorporated into the plagioclase crystals, and as a result, the macrophenocrysts of G99-5I give the bulk lava chemistry of this sample a positive Europium anomaly.
Regional Conclusions Drawn from Variation Diagrams and Incompatible Elements Major and trace element data allow us to draw conclusions about the regional phenomena that have influence the formation of Genovesa. Major element data indicate that Genovesa lavas should be classified as subalkaline basalts (figures 4, 5, and 6). Also, major element data give insight into fractionation processes that have occurred below the surface. Variation diagrams indicate that systematic fractional crystallization has not occurred (figures 8 and 9). Instead, Genovesa’s magma chamber or the shallow source region of the erupted lavas underwent periods of magmatic refreshment, possibly followed by short periods of fractional crystallization. Ratios of incompatible elements show that the source of the magma feeding Genovesa comes from a singular mantle source (figures 11, 12, and 13). Although the variation diagrams indicate small compositional changes in the erupted magma due to refreshment with more primitive magma, the source of Genovesa’s magma is largely homogenous. The hypothesis that the lavas on Genovesa were erupted from a singular and long-lived magma chamber supports Contag’s (1978) conclusions regarding the two calderas on Genovesa. Contag (1978) argues that the central caldera is the principle vent for Genovesa, and that the flooded caldera forming Darwin Bay was a shallow magma chamber feeding lava to the central vent (figure 3). The geochemical similarity of Genovesa basalts makes this hypothesis highly plausible. Smaller lava chambers make fractional crystallization harder to distinguish, but the variability in lava compositions would likely increase. The combination of highly similar compositions, little fractionation, and a singular mantle source supports the conclusion that Genovesa basalts erupted from the central caldera but also was stored for an unknown period of t ime in the Darwin Bay caldera.
Comparison of Genovesa to the Galapagos Hotspot and the GSC The geochemistry of Genovesa has regional implications. Genovesa is located between the
Galapagos Hotspot and the Galapagos Spreading Center (figure 1), and the geochemistry of Genovesa is an important piece of information for understanding the interaction between the Galapagos Hotspot and the Galapagos Spreading Center. Both the Galapagos Hotspot and the Galapagos Spreading Center produce magma that has the distinct geochemical signature of a particular mantle region. The Galapagos Hotspot produces basalt that resembles the geochemistry of the deep, enriched mantle. The GSC produces basalt derived from the upper mantle and depleted in incompatible elements. In order to determine the mantle source of the lava for Genovesa and to discriminate between contributions from the shallow mantle and the deep mantle, it is necessary to compare Genovesa lavas to lavas from distinct geographic areas within the Galapagos. The western islands of Fernandina and Islabella are believed to be located closest to the geographic center of the Genovesa Hotspot, and consist of lavas most

Colgate University Journal of the Sciences 123
resembling lava from a deep mantle plume. Dredge samples from the Galapagos Spreading Center will also be compared to Genovesa. These samples collected along the spreading ridge represent the other end member of Galapagos lava geochemistry, mid-ocean ridge basalt.
Major Element Comparisons Between Genovesa, the Western Islands, and the GSC Comparing major element data from a variety of volcanoes and regions is difficult because
fractional crystallization and other melting processes superimpose variation on the original composition of the magma. Still, a total alkali versus silica plot (TAS) is one the most useful ways to classify volcanic rocks (Rollinson, 1993), and compare major element data from a variety of locations in a broad manner.
Figure 14 is TAS diagram showing the composition of lavas from the western islands, the GSC, and Genovesa within the basalt field and discriminated into alkaline and subalkine (tholeiitic) subclassifications as defined by Rollinson (1993). Again, major element data can vary significantly due to local melt and crystallization processes, but it is possible to draw general conclusions about classification of each set of lavas from figure 14. The most obvious conclusion that can be drawn from figure 14 is that the western islands have a composition that consistently falls into the alkaline field and GSC lavas are mostly subalkine basalts. The GSC lavas have typically lower concentrations of alkalis and higher concentrations of silica than plume related lavas.
Genovesa lavas plot along the division between alkaline and subalkaline lava, and do not fall into the center of the cluster of samples from either the western islands or the GSC. Definitive conclusions cannot be drawn about the relationship between Genovesa and various mantle sources from the major element concentrations in figure 14. Still, the fact that the compositions of Genovesa lavas do not exactly resemble the western islands or the GSC hints at some amount of mixing between two or more mantle components to create an intermediate lava composition.
REE Comparisons between Genovesa, the Western Islands, and the GSC The rare earth elements, elements with atomic number 57 to 71, are the most useful of all the trace
elements (Rollinson, 1993). Rare earth elements are so useful due to the small but steady decrease in ionic size with increasing atomic number, allowing patterns of REE to represent the original composition of the unaltered parent (Rollinson, 1993). Figure 15 shows chondrite normalized rare earth element concentrations for Genovesa, along with two separate fields of data. The enriched field has been drawn around the REE concentrations of lavas sampled by White et al. (1995) on Isabella and Fernandina. The depleted field has been drawn around the rare earth concentrations of MORB dredged from the East Pacific Rise, a mid-ocean ridge with a spreading rate similar to the GSC. High quality REE data for the GSC is extremely scarce and is not useful for a comparison with highly precise and accurate data from Genovesa and the western islands. Although the East Pacific Rise may produce basalt that is compositionally different than the GSC, it is highly unlikely that the mantle source for each mid-ocean is anything but the depleted upper mantle.
The basalt from Genovesa neatly falls into the field of mid-ocean ridge basalt. In figure 15, the concentrations of rare earth elements and the patterns that results from these concentrations indicate a region of geochemical depletion as the mantle source of Genovesa. The upper mantle, which has had incompatible elements removed by the formation of continental crust, is the most likely source of the MORB type basalt that forms Genovesa.
Conclusions Any investigation into Galapagos geology focuses on both local phenomena, as well as large scale mantle processes that have affected the formation of the entire Galapagos Islands. Geochemical evidence from samples collected on Genovesa have improved our understanding of the origin and genesis of the magma on this island, as well as contributed a small piece of information that will help explain how mantle plumes and mid-ocean ridges interact. Regionally, it does not appear that Genovesa owes its genesis directly to the geologic influence of the proximate Galapagos Hotspot. The existence of an island consisting of MORB is sufficiently rare that both the Galapagos Spreading Center and the Galapagos Hotspot must be taken into account when explaining the origin of Genovesa. The existence of an active mid-ocean ridge and a deep mantle plume are believe to be the primary cause of phenomenon that are not characteristic of intra-plate islands. The Galapagos Islands do not have a distinct

124 Colgate University Journal of the Sciences
linear eruptive history; 13 different volcanoes are believed to have been active in Holocene time (White et al., 1993). Also, a wide geochemical diversity of basalt is found within the Galapagos Islands, which is different from the enriched homogeneity of such island chains as Hawaii.
Geologists have speculated that unique properties of the Galapagos Hotspot can explain the geochemical distribution of basalts and the non-linear eruptive pattern within the Galapagos Islands. The geographic distribution of deep and shallow mantle basalt is opposite that predicted by the model of a rising mantle plume mixing radially outward with surrounding depleted asthenosphere (White et al., 1993). White et al. (1993) have proposed that the Galapagos Islands are the surface manifestation of a weak deep mantle plume that has been bent to the east by asthenospheric flow (figure 16). The Nazca Plate, on which the Galapagos Islands reside, has moved east-southeast at 37 mm/yr for the past 3 million years, a significantly high enough rate to suggest that strong currents exist within the shallow mantel (White et al., 1993). In models, the bending of the Galapagos mantle plume to the east by asthenospheric currents causes mixing of depleted upper mantle material with deep mantle material. The geographical and geochemical distribution of lava that is predicted by a bent plume model explains in a general manner the geochemical distribution of basalts across the Galapagos Islands, and the activity of volcanoes across the Galapagos Platform.
The geochemical evidence from Genovesa does not conflict with the bent plume model. Part of the bent plume model is based on the observation that contours connection areas of congruent amounts of enrichment or depletion form a horseshoe pattern that opens to the east, northeast (White et al., 1993). White et al. (1993) speculates that isotopic data from Genovesa will be most similar to the an unanalyzed area of the Galapagos Spreading Center closest to Genovesa. The geochemical data from cliff section G99-5 on Genovesa substantiates the conclusion that the compositions of Genovesa basalts are likely to be extremely similar to basalts from the GSC. White et al. (1993) also speculates that a transfer of mantle material from the mantle plume to the mid-ocean ridge at great depth has influenced the GSC.
The geochemical data from Genovesa does not support this conclusion. The almost identical resemblance between the REE element pattern for Genovesa and the REE pattern of MORB from a spreading center unaffected by deep mantle material conflicts with White et al.’s interpretation of isotopic evidence. The only bit of evidence to suggest that mixing between the plume and ridge has occurred is major element data shown in figure 14. Local melting processes from Genovesa could easily explain the intermediate composition of lavas between the GSC and the western islands. More samples from Genovesa, as well as dredge samples from the submerged island may show slightly different major element concentrations that would place Genovesa clearly within the subalkaline field and more similar to the mid-ocean ridge basalts from the GSC. Due to the strength and reliability of the REE data for Genovesa, it is unlikely that analyses of more Genovesa samples from various locations on the volcanoes would move the concentration of the major elements into the alkaline field with the western islands.
The probability that the Galapagos Plume played any major role in the formation of subarial Genovesa is highly unlikely. The geochemistry from Genovesa and cliff section G99-5 strongly indicates that the parent of lavas from Genovesa is the depleted upper mantle, the same source for the Galapagos Spreading Center. Existing models explain the geologic evolution of the Galapagos Islands as a result of the interaction between a deep mantle plume and a mid-ocean ridge. Due to this data, any Galapagos Hotspot-GSC model must explain the emergence Genovesa as an island consisting of mid-ocean ridge basalts and geochemically unaffected by the proximity of a deep mantle plume.

Colgate University Journal of the Sciences 125
Figures
Figure 1: Regional geotectonic diagram of the Galapagos platform and the surrounding area from Cullen and McBirney (1987). The geographic center of the Galapagos Hotspot is located beneath Fernandina, and the Galapagos Spreading Center is located approximately 100 to 125 km to the north, northeast.
G a l a p a g o s S p r e a d i n g C e n t e r
C o c o s R i d g e
W o l f
P i n t a
G e n o v e s a
1 0 0 0
F a t h o m s
S a n t a C r u z
I s a b e l aS a n C r i s t o b a l
C a r n e g i eR i d g e
2 N
1 N
0 d e g .
1 S
8 8 W9 0 W9 2 W
F e r n a n d i n a
GalapagosHotspot

126 Colgate University Journal of the Sciences
Figure 2: Cartoon of a typical mantle plume or hotspot originally from Harpp and Geist (1998). A typical hotspot island will produce basalt with the distinct geochemistry of the enriched deep mantle and a linear chain of islands.
Figure 3: Geologic map of Genovesa constructed by the reconnaissance survey of Contag (1978). The cliff section is located on the Darwin Bay side of the south, southwest claw.
P l a t e M o t i o n
E x t i n c t H o t s p o t V o l c a n o
A c t i v e H o t s p o t V o l c a n o
M i d - O c e a n R i d g e
R o c k +M e l t
D e p l e t e d U p p e r M a n t l e
M a n t l e C u r r e n t s
E n r i c h e dM a n t l e P l u m e
H o t P l a s t i c R o c k
Cliff section
Colgate University Journal of the Sciences 127
Figure 4: Diagram showing the total alkalis, Na2O + K2O, versus SiO2. The data was derived by XRF, is plotted in weight percent, and the error is obscured by the size of the data points. The diagram shows that the samples for Genovesa fall neatly into basalt field.
Tas 1

128 Colgate University Journal of the Sciences
Figure 5: A similar diagram showing the total alkalis, Na2O + K2O, versus SiO2 in weight percent. Again, the data was derived from XRF and error is smaller than the data points. The diagram is divided into alkaline and subalkaline fields.
TAS 2

Colgate University Journal of the Sciences 129
Figure 7: A graph of the rare earth concentrations in PPM for Genovesa. The concentrations are plotted against the REE in increasing atomic number. The data is derived from ICP-MS and error is smaller than the data points. The concentrations are plotted on a logarithmic scale after being normalized to values from Harpp (personal communication). The graph shows that the basalts on Genovesa are highly depleted incompatible elements.
1
10
100
La Ce Pr Nd Sm Eu Gd Tb Dy Ho Er Tm Yb Lu
Element
Con
cent
ratio
n P
PM
GenovesaGenovesaGenovesa
GenovesaGenovesaGenovesa
GenovesaGenovesaGenovesa
GenovesaGenovesa

130 Colgate University Journal of the Sciences
Figure 8: Harker variation diagram showing SiO2 weight percentage versus the weight percentage of TiO2 and Na2O. The data was derived from XRF and the error is smaller than the data points. SiO2 is a relatively compatible, TiO2 and Na2O are incompatible. The diagram does not show that any significant and systematic fractional crystallization took place.
SiO2 versus TiO2 and Na2O
R2 = 0.8431
R2 = 0.6887
0.00
0.50
1.00
1.50
2.00
2.50
3.00
47.40 47.60 47.80 48.00 48.20 48.40 48.60 48.80 49.00 49.20
SiO2 %
Wei
gh
t % TiO2Na2O
I
I
G
G
E
E
C
C
H
H
D
D
B
B
A
A
J
F
J
F
K
K

Colgate University Journal of the Sciences 131
Figure 9: Harker variation diagram showing MgO weight percentage versus the weight percentage of TiO2 and Na2O. The data was derived from XRF and the error is smaller than the data points. SiO2 is a relatively compatible, TiO2 and Na2O are incompatible. The diagram does not show that any significant and systematic fractional crystallization took place. Instead, the existance of two clusters of data suggest that magma of a consistent composition was being fed into a long lived magma chamber, with one small change to a more primitive composition with time.
MgO versus TiO2 and Na2O
R2 = 0.3444
R2 = 0.5642
0.00
0.50
1.00
1.50
2.00
2.50
3.00
3.50 4.50 5.50 6.50 7.50 8.50
MgO Weight %
Wei
ght
%
Na2OTiO2
F
F
G
G
H
HB
B
D
D
E
E
K
K
A
A
J
J
C
C
I
I

132 Colgate University Journal of the Sciences
Figure 10: A graph of stratigraphic height, shown on the X-axis by the equally spaced sample letters, and weight percent TiO2, Na2O, and MgO. The error is smaller than the data points, and the data was all derived from X-ray fluorescence. This diagram also shows that no significant fractional crystallization has occurred over time.
Stratigraphic Height versus Weight Percent
0.00
1.00
2.00
3.00
4.00
5.00
6.00
7.00
8.00
9.00
10.00
A B C D E F G H I J K
Wei
ght % TiO2
Na2OMgO

Colgate University Journal of the Sciences 133
Figure 11: A plot of the incompatible elements hafnium and zirconium after being normalized to niobium abundances. The error for the data set is smaller than the data points, and the data is derived from ICP-MS. The R2 value is exceedingly strong, indicating that a single source of the magma feeding Genovesa’s magma chamber
Hf/Nb v. Zr/Nb
R2 = 0.9897
1.10
1.20
1.30
1.40
1.50
1.60
47.00 49.00 51.00 53.00 55.00 57.00 59.00 61.00 63.00Zr/Nb
Hf/
Nb

134 Colgate University Journal of the Sciences
Figure 12: A plot of the incompatible elements europium and titanium after being normalized to niobium abundances. The error for the data set is smaller than the data points, and the data is derived from ICP-MS. The R2 value is exceedingly strong, indicating that a single source of the magma feeding Genovesa’s magma chamber. The R2 value shown does not include sample G99-5I, which is considered separate due to macrophenocrysts of plagioclase.
Ti/Nb v. Eu/Nb
R2 = 0.8885
500.00
550.00
600.00
650.00
700.00
750.00
800.00
850.00
0.65 0.70 0.75 0.80 0.85 0.90Eu/Nb
Ti/N
b

Colgate University Journal of the Sciences 135
Figure 13: A plot of the incompatible elements strontium and Pr after being normalized to niobium abundances. The error for the data set is smaller than the data points, and the data is derived from ICP-MS. The R2 value is less strong than in figure 11, but due to the small number of data point the relationship is strong enough to support the conclusion that a single source feed magma to Genovesa’s magma chamber. The R2 value shown does not include sample G99-5I, which is considered separate due to macrophenocrysts of plagioclase.
Sr/Nb v. Pr/Nb
R2 = 0.5898
50.00
75.00
100.00
125.00
150.00
175.00
200.00
225.00
0.80 0.85 0.90 0.95 1.00 1.05 1.10 1.15 1.20
Pr/Nb
Sr/
Nb
G99-5I

136 Colgate University Journal of the Sciences
Figure 14: Diagram showing total alkalis, Na2O + K2O, versus SiO2 in weight percent. All the data was derived by XRF and the error is obscured by the size of the data points. The samples from Genovesa are plotted with samples from seven western volcanoes analyzed by White et al. (1993) and with dredge samples from the Galapagos Spreading Center analyzed by Schilling et al., (1982). All of the samples plotted fall within the basalt field, but there is a noticeable difference when the samples are categorized as either alkaline or subalkaline basalt. Both the basalt field and the discrimination line between alkaline and subalkaline basalt has been drawn according to the specifications of Rollinson (1993).
TAS Diagram for Genovesa, the W. Islands, and the GSC
1.00
1.50
2.00
2.50
3.00
3.50
4.00
4.50
5.00
5.50
6.00
45.00 47.00 49.00 51.00 53.00Silica Weight %
(Western Island data from White, 1995; GSC data from Schilling et al, 1982)
Na2
O+K
2O W
eigh
t %
W. IslandsGSCGenovesaAlkaline
Subalkaline
Basalt
Basalt

Colgate University Journal of the Sciences 137
Figure 15: A comparison of REE from Genovesa to fields drawn around the REE concentrations of western islands, from White et al. (1993), and the East Pacific Rise, from Harpp (personal communication, 1999). Genovesa REE are plotted in PPM against atomic number, with error bars being obscured by the size of the data points. The resemblance of Genovesa samples to MORB strongly suggests that the depleted upper mantle is the singular mantle source for Genovesa.
REE Comparision of Genovesa to MORB and the Galapagos Plume
1
10
100
La Ce Pr Nd Sm Eu Gd Tb Dy Ho Er Tm Yb LuElement
(MORB from Harpp, Pers. Comm.; Galapagos Plume from White et al, 1995)
Con
cent
rati
on (P
PM
)
MORB
Galapagos Plume

138 Colgate University Journal of the Sciences
Figure 16: Cartoon of the bent plume model proposed by White et al. (1993) to explain the unique characteristics of the Galapagos Islands. The cartoon is found in Harpp and Geist (1998).
The Bent Plume Model

Colgate University Journal of the Sciences 139
References Anderson, A., 1998, The core mantle boundary region. Geodynamics Series, v. 28, p.
255-271. Cullen, A.., and McBirney, A.R., 1987, The volcanic geology and petrology of Isla Pinta,
Galapagos archipelago. Geological Society of America Bulletin, v. 98, p. 294 301.
Cullen, A.., Vicenzi, E., McBirney, A.R., 1989, Plagioclase-ultraphyric basalts of the
Galapagos archipelago. Journal of Volcanology and Geothermal Research, v. 37, p. 325-337.
Geist, D.J., White, W.M., 1988, Plume-Asthenosphere mixing beneath the Galapagos
Archipelago. Nature, v. 333, p. 657-660. Harpp, K., and Geist, D., 1998, Galapagos plumology. Noticias De Galapagos, v. 59,
p.23-29. Hey, R., Johnson, G.L., Lowrie, A., 1977, Recent plate motion in the Galapagos area.
Geologic Society of America Bulletin, v. 88, p. 1385-1403. Morgan, W.J., 1978, Rodriquez, Darwin, Amsterdam,…, a second type of hotspot island.
Journal of Geophysical Research, v. 83, n. B11, p. 5355-5360. Philpotts, J.A., Schentzler, C.C., 1967, Europium Anomolies and the genesis of basalt .
Chemical Geology, v. 3. Rollinson, H.R., 1993, Using geochemical data: evaluation, presentation, interpretation.
Longman Scientific and Technical, New York. Schilling, J.-G., Anderson, R.N., and Vogt, p., 1976, Rare earth, Fe and Ti variations
along the Galapagos spreading centre, and their relationship to the Galapagos mantle plume. Nature, v. 261, p.108-113.
Schilling, J.G., Kingsley, R.H., and Devine, J.D., 1982, Galapagos hot-spot-spreading
center system spatial petrological and geochemical variations. Journal of Geophysical Research, v. 87, n. B7. P. 5593-5610.
Vicenzi, E.P., McBirney, A.R., White, W.M., and Hamilton, M., 1989, The geology and
geochemistry of Isla Marchena,Galapagos archipelago: an ocean island adjacent to a mid-ocean ridge. Journal of Volcanology and Geothermal Research, v. 40, p. 291-315.
White, W.M., Hofmann, A.W., 1978, Geochemistry of the Galapagos Islands;
implications for Mantle dynamics and evolution. Carnegie Institution of Washington, v. 77, p. 596-605.
White, W.M., McBirney, A.R., Duncan, R.A., 1993, Petrology and geochemistry of the
Galapagos Islands; portrait of a pathological mantle plume. Journal of Geophysical Research, B, Solid Earth and Planets, v. 98, p. 19,533-19,563.