Embed Size (px)
Citation preview
Review of Economics & Finance
Submitted on 02/July/2012
Article ID: 1923-7529-2013-01-49-14 Atef Saad Alshehry, and Sarra Ben Slimane
~ 49 ~
On the Optimality of GCC Monetary Union:
Asymmetric Shocks Assessments1
Dr. Atef Saad Alshehry
College of Administrative Sciences, Najaran University
King Abdelaziz Rd P.O Box 1988 Najran 61441 Saudia Arabia
Tel: +966(0)500384022 E-mail: [email protected]
Dr. Sarra Ben Slimane
College of Administrative Sciences, Najaran University
King Abdelaziz Rd P.O Box 1988 Najran 61441 Saudia Arabia
Tel: +966(0)543657383 E-mail: [email protected]
Abstract: The main objective of this paper is to investigate the desirability and the feasibility of
establishing a monetary union in GCC countries. The paper assesses the symmetry of the external
shocks that the economies are subject to and the degree of synchronization in long run economic
activities and in short run business cycle. The paper establishes the following results: (i) In general
correlation results of the various shocks indicate that GCC countries are still far forming an optimal
currency union given the fact that a large number of correlation’s coefficients are not positive
meaning that shocks are asymmetric; (ii) However, decomposition variance results argue well for
feasibility of currency union across GCC countries.
Keywords: Monetary Union, GCC countries, convergence criteria, Structural VAR model,
Asymmetric shocks
JEL Classifications: C320; E320; F620
1. Introduction
The Gulf Cooperation Council (GCC) was established in 1981, comprising six countries:
Bahrain, Kuwait, Oman, Qatar, Saudi Arabia and the U.A.E with the objective of strengthening
economic integration and coordinating monetary and financial policies towards achieving a
monetary union between the members in the long-run.
In 2001, The Gulf Cooperation Council decided to introduce a common currency by 2010.
While this was one of the goals of creating the GCC in early 1980s (Article 22 of the Council’s
Unified Economic Agreement), it only gets momentum and support in recent years due to the
successful introduction of the common currency in Europe. Indeed, in 2005, the GCC members
adopted the EU convergence criteria with respect to budget deficit, public debt, currency reserves,
interest rates and inflation.
The main objective of this paper is to investigate the extent to which the GCC member states
meet the theoretical criteria for an optimal monetary union. The paper tests the desirability and
feasibility of establishing a Monetary union in GCC countries through assessing the symmetry of
the external shocks that the economies are subject to and the degree of synchronization in long run
economic activities and in short run business cycle.
1 The research is funded by the Deanship of Scientific Research of Najarn University.
ISSNs: 1923-7529; 1923-8401 © 2013 Academic Research Centre of Canada
~ 50 ~
We employ the methodology of Bayoumi and Eichengreen (1994) to estimate multivariate
SVAR model with four variables including: the World GDP, domestic real GDP, real effective
exchanges rates and the domestic price levels. The world GDP captures exogenous external shocks
while domestic shocks comprise supply, demand and monetary shocks.This approach expands on
the list of variables in previous studies, which were limited to real GDP, consumer price index and
interest rates (Goto and Hamada (1994), and Kuwan (1998)).
The remainder of the paper is organized as follow. Section 2 reviews economic convergence
issues of GCC member states. Sections 3 and 4 provide existing empirical studies, the SVAR
methodology, and our empirical findings. Section 5 concludes this paper.
2. Economic Convergence of GCC Countries
When analyzing economic convergence, a crucial distinction can be made between monetary
and fiscal convergence. Monetary convergence refers to variables mainly determined by monetary
policy, such as inflation, interest rates and exchange rates, whereas fiscal convergence refers to
indicators such as budget deficits and debt levels, which are strongly influenced by fiscal policy.
2.1 Monetary Convergence
This section analyzes monetary convergence in GCC member states, focusing on inflation
rates, interest rates and exchange rate stability.
2.1.1 Inflation Rate
A general rise in the price level will cause a reduction in the purchasing power of the member
country’s currency. Therefore, in order to maintain a union-wide monetary stability, it is important
to think about a criterion that would bring close inflation rates among members. Price stability is an
important element in facilitating the task of
the new central bank.
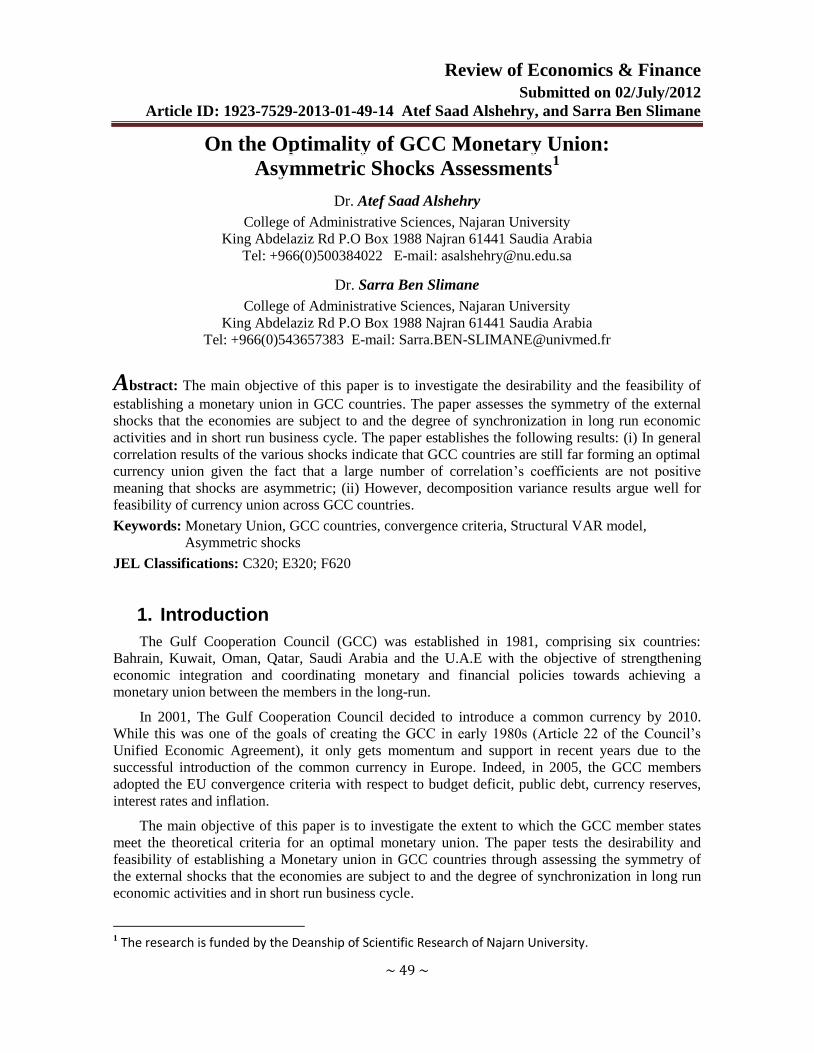
During the past two decades inflation
rates in GCC countries have been
maintained at low level. Inflation rates
have also tended to move broadly in
parallel between countries during this
period (see figure 1).
The average inflation rate over the last
two decades has been highest in the UAE
(6.9%) and lowest in Saudi Arabia (1.1%).
The difference between the highest and
lowest inflation rates in GCC countries
seems to have gradually narrowed and to
have become less volatile over the past 10
years, pointing to increased convergence
(see figure 2).
In conclusion, the high degree of
inflation convergence of GCC member states at low levels of inflation over the past 20 years is
remarkable. The major factor explaining the persistently low inflation rates are the continued peg of
the currencies to the US dollar. The GCC countries’ choice of an external anchor for monetary
policy has obviously been credible and served them well in the past to anchor inflation expectations
and to import monetary stability from the anchor economy. Another factor that seems to have
contributed to low inflation rates has been the relatively low level of central bank credit to
Review of Economics & Finance
~ 51 ~
governments in GCC countries. Unlike in some other Middle East countries, GCC member states
did not extensively use monetary policy to accommodate budget deficits. This was facilitated by
accumulated foreign assets, which they could resort to in times of budgetary strain, for instance in
periods of low oil prices. Moreover, the low level of inflation achieved in all GCC member states in
the last 20 years points to a shared policy preference for price stability, which also seems to enjoy
support among the respective populations (Strum and Siegfried (2005)).
2.1.2 Interest Rates
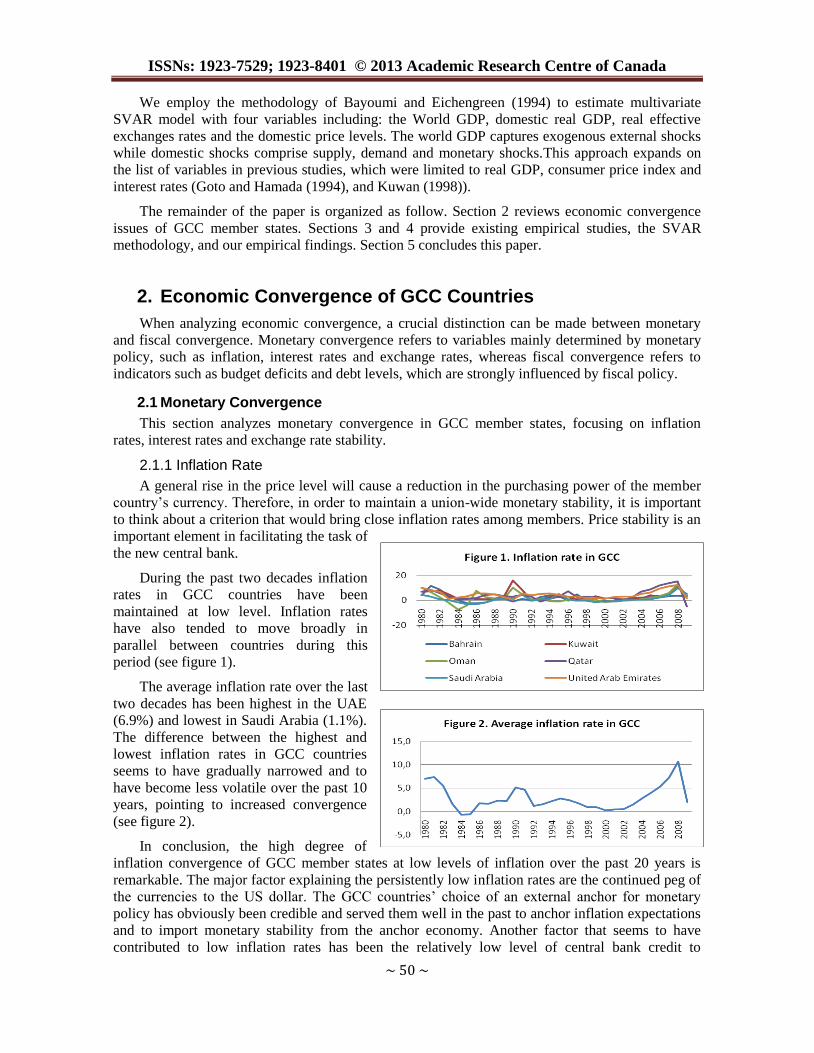
Figure 3 plots the interest rates on
three months deposit in the GCC states.
This Figure shows that, in the last two
decades, the interest rates in the GCC states
co-moved in similar range. The high degree
of interest rate convergence reflects the
inflation convergence and the degree of
exchange rate stability among GCC
countries resulting from the fixed peg to the
US dollar.
Additionally, figure emphasizes the fact that the GCC interest rates closely follow the US
interest rate. The spread between GCC and US interest rates is generally low and reflects the
credibility of the exchange rate peg.
Specific evolution can be observed for Oman in the second half of the 1990s due to interest
regulations. Qatar had a fixed interest rate until 1990; afterwards, the interest rate fluctuated in line
with other GCC interest rates. As a consequence, the difference between the highest and the lowest
interest rate in the GCC area is quite small, making no need for massive convergence steps, in this
context, ahead of introducing a single currency.
2.1.3 Exchange Rates
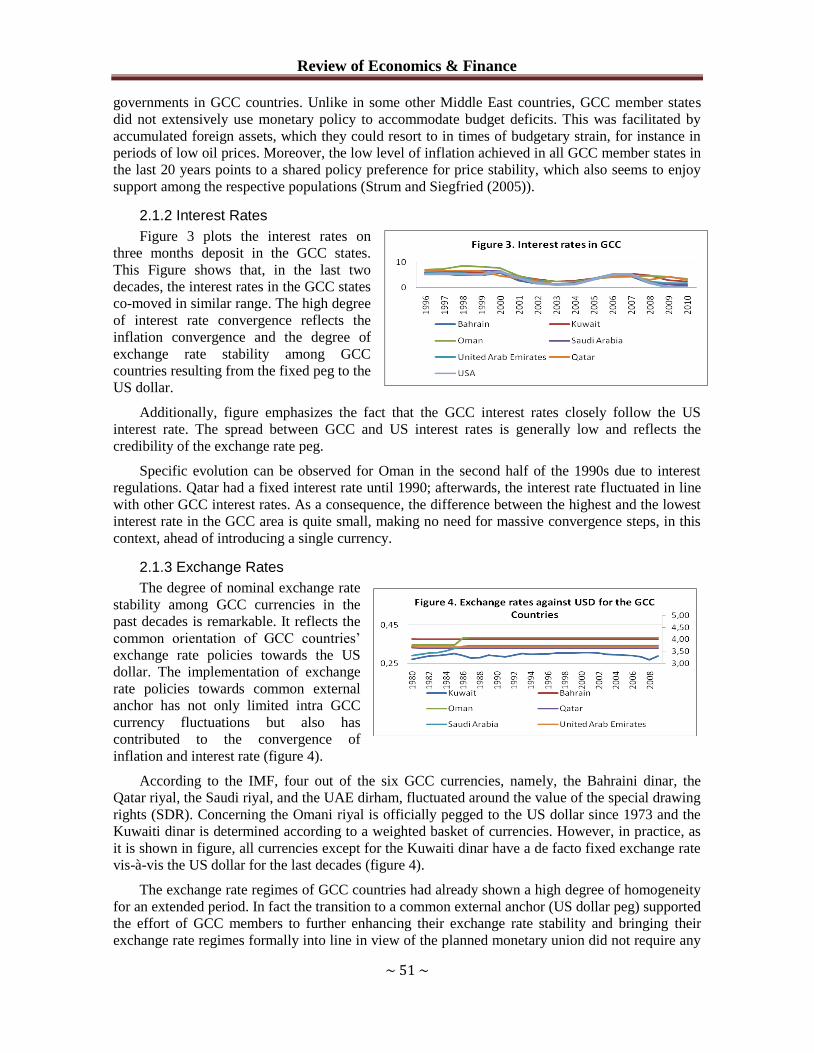
The degree of nominal exchange rate
stability among GCC currencies in the
past decades is remarkable. It reflects the
common orientation of GCC countries’
exchange rate policies towards the US
dollar. The implementation of exchange
rate policies towards common external
anchor has not only limited intra GCC
currency fluctuations but also has
contributed to the convergence of
inflation and interest rate (figure 4).
According to the IMF, four out of the six GCC currencies, namely, the Bahraini dinar, the
Qatar riyal, the Saudi riyal, and the UAE dirham, fluctuated around the value of the special drawing
rights (SDR). Concerning the Omani riyal is officially pegged to the US dollar since 1973 and the
Kuwaiti dinar is determined according to a weighted basket of currencies. However, in practice, as
it is shown in figure, all currencies except for the Kuwaiti dinar have a de facto fixed exchange rate
vis-à-vis the US dollar for the last decades (figure 4).
The exchange rate regimes of GCC countries had already shown a high degree of homogeneity
for an extended period. In fact the transition to a common external anchor (US dollar peg) supported
the effort of GCC members to further enhancing their exchange rate stability and bringing their
exchange rate regimes formally into line in view of the planned monetary union did not require any
ISSNs: 1923-7529; 1923-8401 © 2013 Academic Research Centre of Canada
~ 52 ~
major modifications to the GCC countries’ long-standing exchange rate regimes, with the exception
to a limited extent of Kuwait.
Exchange rate stability among the GCC countries is notable and cannot be explained by foreign
exchange restrictions because it has been evolved in an environment of relatively open capital
accounts. Moreover, this exchange rate stability has resisted to various instances of severe economic
and political turbulence, such as large oil price fluctuations, crises in various emerging market
economies with a global impact, the 1990/1991 Gulf War following the Iraqi invasion of Kuwait,
and most recently the military intervention in Iraq in 2003.
This stability can be explained by three main factors: (i) the similarity of economic structures
of GCC member states, notably the role of oil in their economies, which reduces the potential for
asymmetric shocks and thus the need to resort to exchange rate adjustments; (ii) economic policies
in GCC member states, which have largely been consistent with the exchange rate pegs and have
not undermined their credibility; and (iii) the accumulation of significant foreign exchange reserves
by GCC member states, which have supported the credibility of the peg and deterred speculative
attacks (Strum and Siegfried (2005)).
2.2 Fiscal Convergence
Fiscal convergence examined here on the basis of deficit to GDP ratios and debt to GDP ratios
in order to provide an overview of fiscal situation.
2.2.1 Budget Balance
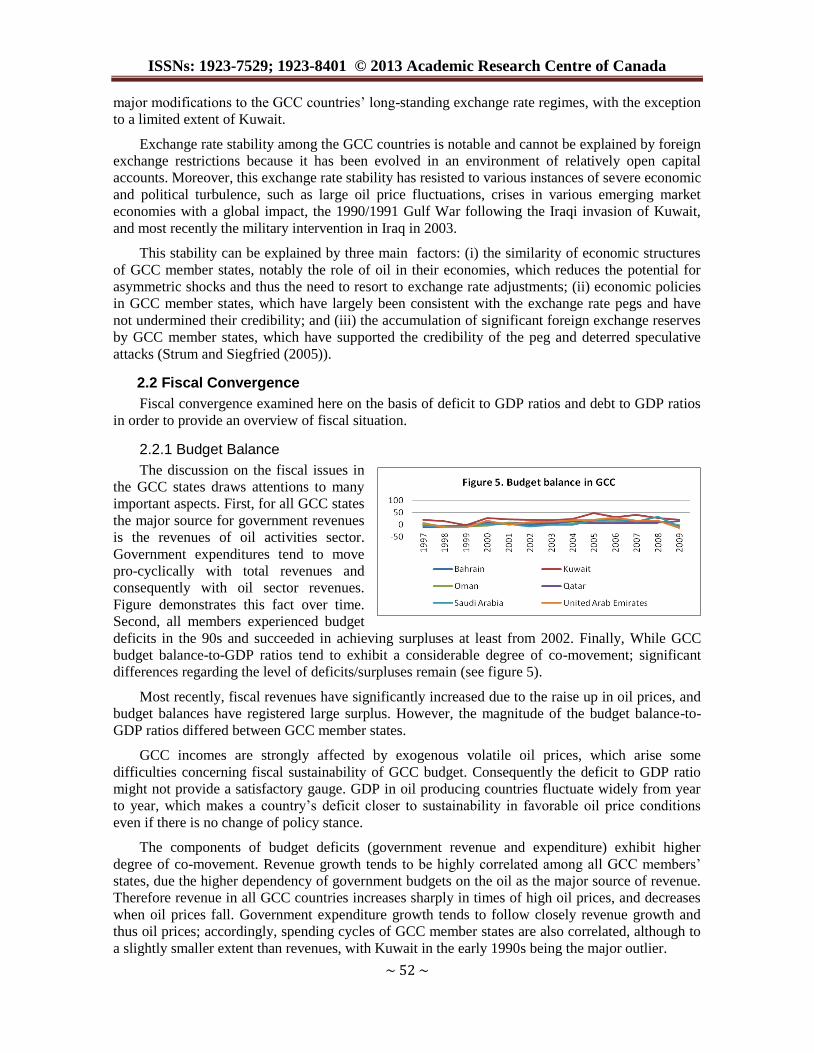
The discussion on the fiscal issues in
the GCC states draws attentions to many
important aspects. First, for all GCC states
the major source for government revenues
is the revenues of oil activities sector.
Government expenditures tend to move
pro-cyclically with total revenues and
consequently with oil sector revenues.
Figure demonstrates this fact over time.
Second, all members experienced budget
deficits in the 90s and succeeded in achieving surpluses at least from 2002. Finally, While GCC
budget balance-to-GDP ratios tend to exhibit a considerable degree of co-movement; significant
differences regarding the level of deficits/surpluses remain (see figure 5).
Most recently, fiscal revenues have significantly increased due to the raise up in oil prices, and
budget balances have registered large surplus. However, the magnitude of the budget balance-to-
GDP ratios differed between GCC member states.
GCC incomes are strongly affected by exogenous volatile oil prices, which arise some
difficulties concerning fiscal sustainability of GCC budget. Consequently the deficit to GDP ratio
might not provide a satisfactory gauge. GDP in oil producing countries fluctuate widely from year
to year, which makes a country’s deficit closer to sustainability in favorable oil price conditions
even if there is no change of policy stance.
The components of budget deficits (government revenue and expenditure) exhibit higher
degree of co-movement. Revenue growth tends to be highly correlated among all GCC members’
states, due the higher dependency of government budgets on the oil as the major source of revenue.
Therefore revenue in all GCC countries increases sharply in times of high oil prices, and decreases
when oil prices fall. Government expenditure growth tends to follow closely revenue growth and
thus oil prices; accordingly, spending cycles of GCC member states are also correlated, although to
a slightly smaller extent than revenues, with Kuwait in the early 1990s being the major outlier.
Review of Economics & Finance
~ 53 ~
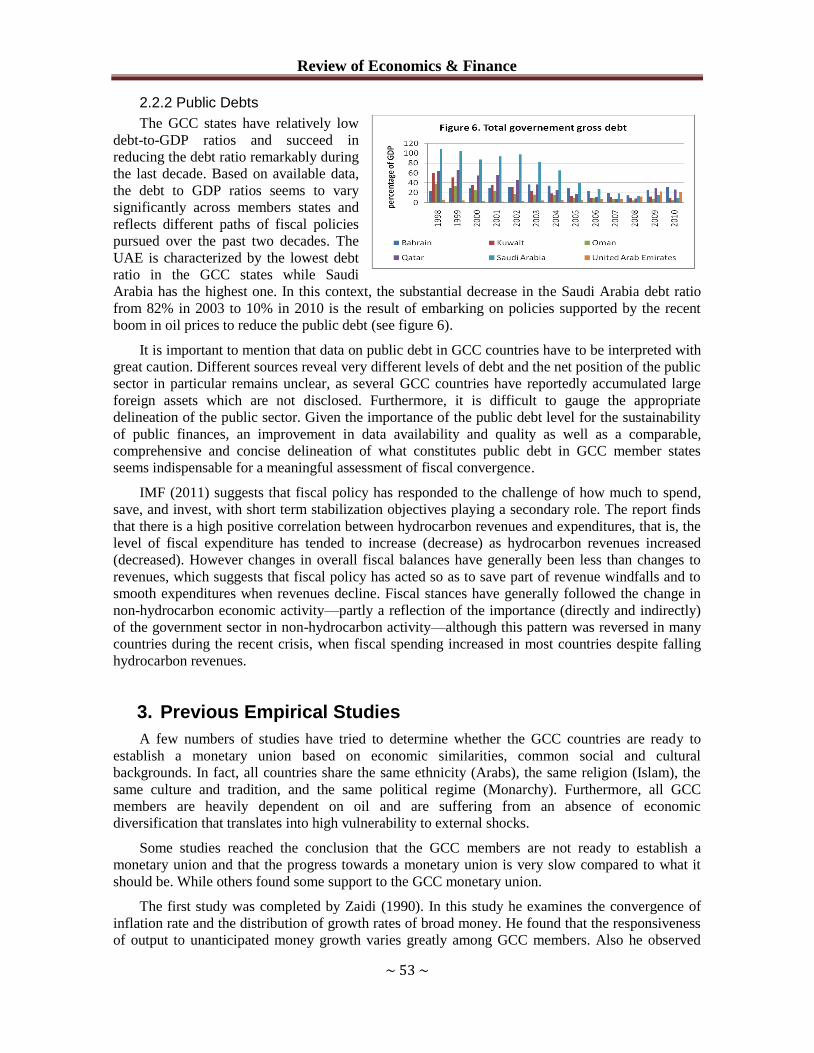
2.2.2 Public Debts
The GCC states have relatively low
debt-to-GDP ratios and succeed in
reducing the debt ratio remarkably during
the last decade. Based on available data,
the debt to GDP ratios seems to vary
significantly across members states and
reflects different paths of fiscal policies
pursued over the past two decades. The
UAE is characterized by the lowest debt
ratio in the GCC states while Saudi
Arabia has the highest one. In this context, the substantial decrease in the Saudi Arabia debt ratio
from 82% in 2003 to 10% in 2010 is the result of embarking on policies supported by the recent
boom in oil prices to reduce the public debt (see figure 6).
It is important to mention that data on public debt in GCC countries have to be interpreted with
great caution. Different sources reveal very different levels of debt and the net position of the public
sector in particular remains unclear, as several GCC countries have reportedly accumulated large
foreign assets which are not disclosed. Furthermore, it is difficult to gauge the appropriate
delineation of the public sector. Given the importance of the public debt level for the sustainability
of public finances, an improvement in data availability and quality as well as a comparable,
comprehensive and concise delineation of what constitutes public debt in GCC member states
seems indispensable for a meaningful assessment of fiscal convergence.
IMF (2011) suggests that fiscal policy has responded to the challenge of how much to spend,
save, and invest, with short term stabilization objectives playing a secondary role. The report finds
that there is a high positive correlation between hydrocarbon revenues and expenditures, that is, the
level of fiscal expenditure has tended to increase (decrease) as hydrocarbon revenues increased
(decreased). However changes in overall fiscal balances have generally been less than changes to
revenues, which suggests that fiscal policy has acted so as to save part of revenue windfalls and to
smooth expenditures when revenues decline. Fiscal stances have generally followed the change in
non-hydrocarbon economic activity—partly a reflection of the importance (directly and indirectly)
of the government sector in non-hydrocarbon activity—although this pattern was reversed in many
countries during the recent crisis, when fiscal spending increased in most countries despite falling
hydrocarbon revenues.
3. Previous Empirical Studies
A few numbers of studies have tried to determine whether the GCC countries are ready to
establish a monetary union based on economic similarities, common social and cultural
backgrounds. In fact, all countries share the same ethnicity (Arabs), the same religion (Islam), the
same culture and tradition, and the same political regime (Monarchy). Furthermore, all GCC
members are heavily dependent on oil and are suffering from an absence of economic
diversification that translates into high vulnerability to external shocks.
Some studies reached the conclusion that the GCC members are not ready to establish a
monetary union and that the progress towards a monetary union is very slow compared to what it
should be. While others found some support to the GCC monetary union.
The first study was completed by Zaidi (1990). In this study he examines the convergence of
inflation rate and the distribution of growth rates of broad money. He found that the responsiveness
of output to unanticipated money growth varies greatly among GCC members. Also he observed
ISSNs: 1923-7529; 1923-8401 © 2013 Academic Research Centre of Canada
~ 54 ~
convergence in inflation rates and moderate dispersion in the growth rates of broad money. In light
of these findings, he invites GCC members to have more advanced coordination of monetary
policies.
Dar and Presley (2001) explained that GCC members have low degrees of integration as results
of insignificants volume of intra-trade in the GCC zone. The authors argued that this result is due to
the similarity of oil-based economic structures and to other economic and political factors. In terms
of policy recommendations, they suggested facilitating intra-regional trade and foreign direct
investment, enhancing economic diversification programs, accelerating privatization efforts.
Laabas and Limam (2002) presented a fulfill examination of the integration progress of GCC
members. They conducted a formal test based on the generalized purchasing power parity. The test
showed that real exchange rates are closely related and shared the same stochastic trend and hence
points of the readiness, although to different degree, of the countries of the region to form currency
union. Also, the authors examined different eligibility criteria for currency unions, including
openness, factor mobility, commodity diversification, production structure, price and wage
flexibility, relating of inflation rates, degree of policy coordination and political factors. They
concluded that not all prior conditions are favorable for currency union. So, the authors maintained
the idea that the creation of currency union does not closely related to meet prior conditions. As in
the case of the European Union, the eligibility criteria are generally fulfilled ex post rather than ex
ante. Finally, they supported that GCC leads to more convergence in economic structures and
economic policies and synchronized cycles.
Jadresic (2002) established a cost benefit analysis of replacing the individual GCC currencies
with common regional currency. He concluded that the success of such union is conditional on a lot
of measures including the removal of domestic and cross-border distortions that are considered as a
hamper to intra-trade and FDI, ensuring macroeconomic stability via more national policies
coordination, deepening regional integration, developing non oil economy and enhancing political
integration.
Darrat and Al-Shamsi (2005) used cointegration tests among GCC countries’ GDP, inflation,
exchanges rates, money stock and monetary base. They found that Gulf countries share a common
long run trend linking their economic activity, financial markets and monetary policies. So the
presence of long rum relationship between variables does not imply the short-run business cycles
synchronization. They concluded that socio-political differences may hinder towards achievement
of full economic and financial integration and creation of a viable monetary union.
Sturm and Siegfried(2005) focused, in their article on selected macroeconomic and institutional
issues and key policy choices which are likely to arise during the process of monetary integration.
The main findings are that (i) a supranational GCC monetary institution is required to conduct a
single monetary and exchange rate policy geared to economic, monetary and financial conditions in
the monetary union as a whole; (ii) GCC member states have already achieved a remarkable degree
of monetary convergence, but fiscal convergence remains a challenge and needs to be supported by
an appropriate fiscal policy framework; and (iii) there is currently a high degree of structural
convergence, although this is expected to diminish in view of the process of diversification in GCC
economies, which calls for adequate policy responses.
Hebous (2006) suggested in this paper that the GCC states achieved a remarkable degree of
convergence in terms of criteria similar to the European convergence criteria. He focused on the
similarities among GCC countries as the main factor leading to reduced costs of forming a currency
union. Since the theoretical trade integration of the GCC states is not yet reflected by a large intra-
GCC trade volume, the expected economic benefits associated with introducing a common currency
might be lowered. Reducing oil-dependency is the key issue facing the GCC to maintain stronger
economies and pick up the benefits of a deeper integration.
Review of Economics & Finance
~ 55 ~
4. Empirical Methodology and Investigation
In this paper we use a four-variable structural VAR model based on Blanchard and Quah(1989)
structural shocks identification. These variables are log differences of world real GDP *
ty ,
domestic output ty , real exchange rate te and the price level tp .
The determination of structural shocks is done through the vector of shocks (the external
supply shock ( *ty
) the domestic supply shock (ty ), a domestic demand shock (
te ), a nominal
demand shock (tp ).
The structural model is as follows:
ttttt LAAAAX ...22110
t
t
t
t
p
e
y
y
t
t
t
t
LA
p
e
y
y
*
)(
*
.
The vector tttt
peyyt ,,,* represents the four structural shocks that are likely to affect
the macroeconomic variables in the economy.
We assume that structural shocks are uncorrelated with a normalized covariance matrix. The
identification of these structural shocks is required by Blanchard and Quah to impose long term
constraints. These long-term constraints are usually presented through the matrix denoted )1(A .
We consider that world real output is exogenous meaning that domestic supply, domestic
demand and monetary shocks do not affect world real GDP in the long term. Nevertheless, domestic
variables are affected by external shocks as well as domestic shocks. This imply that 011 A and
0141312 AAA .
In order to identify structural shocks we assume the following long term restrictions:
The real domestic GDP is affected only by supply shocks in long term, 022 LA
1. Supply and demand shocks affect real exchange rates in the long term,
03332 LALA ;
2. Monetary shocks do not affect either real domestic GDP or real exchange rates in the long
term, 03424 LALA ;
As consequence, the system can be written as follows:
t
t
t
t
p
e
y
y
t
t
t
t
AAAA
AAA
AA
A
p
e
y
y
*
)1()1()1()1(
0)1()1()1(
00)1()1(
000)1(
44434241
333231
2221
11*
LALALALA
LALALALA
LALALALA
LALALALA
LA
44434241
34333231
24232221
14131211
ISSNs: 1923-7529; 1923-8401 © 2013 Academic Research Centre of Canada
~ 56 ~
4.1 Data Description
The data in this paper covers the period 1970-2010 in annual frequency, collected from various
issues of the World Development Indicators (WDI) and International Financial Statistics (IFS). The
variables are the world real GDP, domestic GDP, exchanges rates and the price level. The world
real GDP is the real production of the G7 which are the major trading partners of GCC countries.
Real GDP in each country is expressed in constant US dollars. The REER is converted into a single
index (2000=100). For the price level we use the GDP deflator (2000=100).
4.2 Test Results
When using the VAR technique, one has to test for the stationarity of the variables as well as
for the cointegration relationships. Indeed Maddala and Kim (1998) noted that in the cases when the
variables are neither stationary nor co integrated, the VAR model has to be estimated using the first
differences. To test for stationarity of the variables, we use the ADF test.
Given an observed time series nYYY ,..., 21 Dicky and Fuller consider three differential
autoregressive equations to detect the presence of unit roots:
t
p
j
jtjtt eYYY
1
1 (1)
t
p
j
jtjtt eYYY
1
1 (2)
t
p
j
jtjttt eYYY
1
1 (3)
Where t is the time index;
is an intercept constant called drift;
is the coefficient of presenting process root;
is the lag order of the first differences autoregressive process;
te is an independent identically distributes residual term.
The difference between the three equations concerns the presence of the deterministic element.
The focuses of testing is whether the coefficient is equal to zero that mean that original
nYYY ,..., 21 process has unit root, hence the null hypothesis of 0 (random walk process) is
tested against the alternative hypothesis 0 stationary.
(h1) tYH :0 is random walk 0
tYH :1 is stationary process 0
(h2) tYH :0 is random walk around a drift 0,0
tYH :1 is level stationary process 0,0
(h3) tYH :0 is random walk around a trend 0,0
tYH :1 is level stationary process 0,0
ADF testing technique involves Ordinary Least Squares (OLS) method to find the coefficients
of the model chosen. To estimate the significance of the coefficients in focus, the modified T
(Student)-statistic (known as Dickey-Fuller statistic) is computed and compared with the relevant
critical value: if the test statistic is less than the critical value then the null hypothesis is rejected.
Each version of the test has its own critical value which depends on the size of the sample.
Review of Economics & Finance
~ 57 ~
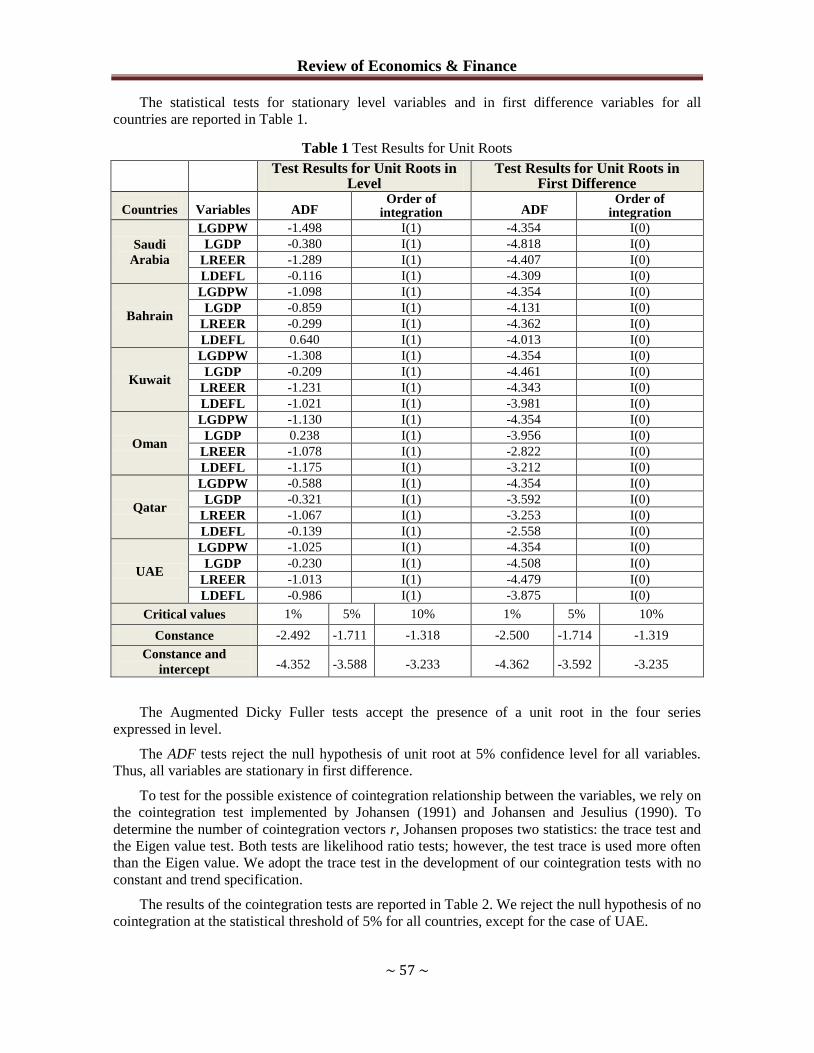
The statistical tests for stationary level variables and in first difference variables for all
countries are reported in Table 1.
Table 1 Test Results for Unit Roots
Test Results for Unit Roots in
Level Test Results for Unit Roots in
First Difference
Countries Variables ADF Order of
integration ADF Order of
integration
Saudi
Arabia
LGDPW -1.498 I(1) -4.354 I(0)
LGDP -0.380 I(1) -4.818 I(0)
LREER -1.289 I(1) -4.407 I(0)
LDEFL -0.116 I(1) -4.309 I(0)
Bahrain
LGDPW -1.098 I(1) -4.354 I(0)
LGDP -0.859 I(1) -4.131 I(0)
LREER -0.299 I(1) -4.362 I(0)
LDEFL 0.640 I(1) -4.013 I(0)
Kuwait
LGDPW -1.308 I(1) -4.354 I(0)
LGDP -0.209 I(1) -4.461 I(0)
LREER -1.231 I(1) -4.343 I(0)
LDEFL -1.021 I(1) -3.981 I(0)
Oman
LGDPW -1.130 I(1) -4.354 I(0)
LGDP 0.238 I(1) -3.956 I(0)
LREER -1.078 I(1) -2.822 I(0)
LDEFL -1.175 I(1) -3.212 I(0)
Qatar
LGDPW -0.588 I(1) -4.354 I(0)
LGDP -0.321 I(1) -3.592 I(0)
LREER -1.067 I(1) -3.253 I(0)
LDEFL -0.139 I(1) -2.558 I(0)
UAE
LGDPW -1.025 I(1) -4.354 I(0)
LGDP -0.230 I(1) -4.508 I(0)
LREER -1.013 I(1) -4.479 I(0)
LDEFL -0.986 I(1) -3.875 I(0)
Critical values 1% 5% 10% 1% 5% 10%
Constance -2.492 -1.711 -1.318 -2.500 -1.714 -1.319
Constance and
intercept -4.352 -3.588 -3.233 -4.362 -3.592 -3.235
The Augmented Dicky Fuller tests accept the presence of a unit root in the four series
expressed in level.
The ADF tests reject the null hypothesis of unit root at 5% confidence level for all variables.
Thus, all variables are stationary in first difference.
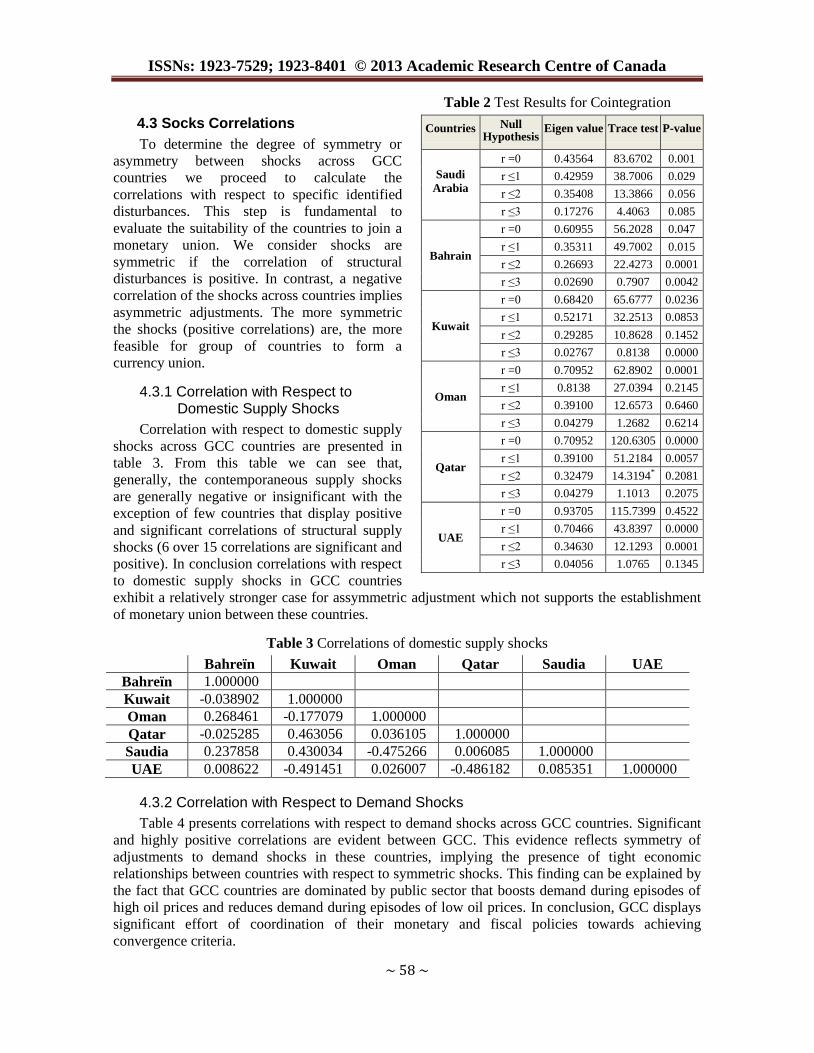
To test for the possible existence of cointegration relationship between the variables, we rely on
the cointegration test implemented by Johansen (1991) and Johansen and Jesulius (1990). To
determine the number of cointegration vectors r, Johansen proposes two statistics: the trace test and
the Eigen value test. Both tests are likelihood ratio tests; however, the test trace is used more often
than the Eigen value. We adopt the trace test in the development of our cointegration tests with no
constant and trend specification.
The results of the cointegration tests are reported in Table 2. We reject the null hypothesis of no
cointegration at the statistical threshold of 5% for all countries, except for the case of UAE.
ISSNs: 1923-7529; 1923-8401 © 2013 Academic Research Centre of Canada
~ 58 ~
Table 2 Test Results for Cointegration
4.3 Socks Correlations
To determine the degree of symmetry or
asymmetry between shocks across GCC
countries we proceed to calculate the
correlations with respect to specific identified
disturbances. This step is fundamental to
evaluate the suitability of the countries to join a
monetary union. We consider shocks are
symmetric if the correlation of structural
disturbances is positive. In contrast, a negative
correlation of the shocks across countries implies
asymmetric adjustments. The more symmetric
the shocks (positive correlations) are, the more
feasible for group of countries to form a
currency union.
4.3.1 Correlation with Respect to Domestic Supply Shocks
Correlation with respect to domestic supply
shocks across GCC countries are presented in
table 3. From this table we can see that,
generally, the contemporaneous supply shocks
are generally negative or insignificant with the
exception of few countries that display positive
and significant correlations of structural supply
shocks (6 over 15 correlations are significant and
positive). In conclusion correlations with respect
to domestic supply shocks in GCC countries
exhibit a relatively stronger case for assymmetric adjustment which not supports the establishment
of monetary union between these countries.
Table 3 Correlations of domestic supply shocks
Bahreïn Kuwait Oman Qatar Saudia UAE
Bahreïn 1.000000
Kuwait -0.038902 1.000000
Oman 0.268461 -0.177079 1.000000
Qatar -0.025285 0.463056 0.036105 1.000000
Saudia 0.237858 0.430034 -0.475266 0.006085 1.000000
UAE 0.008622 -0.491451 0.026007 -0.486182 0.085351 1.000000
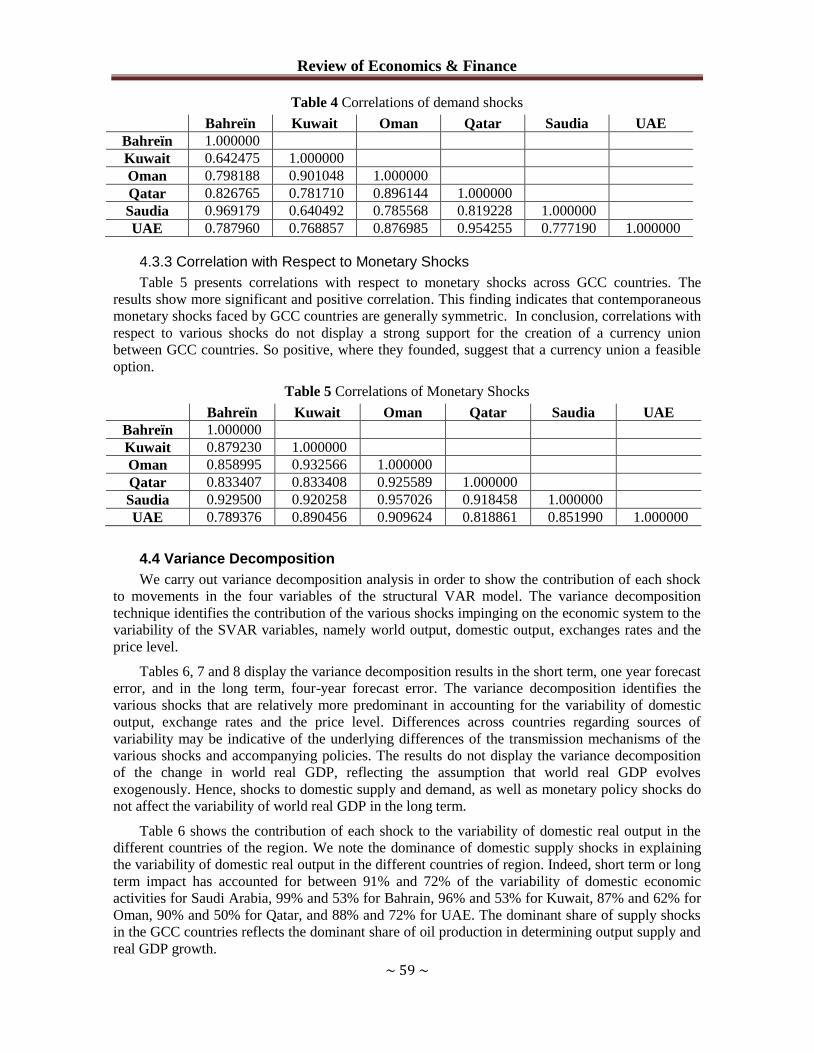
4.3.2 Correlation with Respect to Demand Shocks
Table 4 presents correlations with respect to demand shocks across GCC countries. Significant
and highly positive correlations are evident between GCC. This evidence reflects symmetry of
adjustments to demand shocks in these countries, implying the presence of tight economic
relationships between countries with respect to symmetric shocks. This finding can be explained by
the fact that GCC countries are dominated by public sector that boosts demand during episodes of
high oil prices and reduces demand during episodes of low oil prices. In conclusion, GCC displays
significant effort of coordination of their monetary and fiscal policies towards achieving
convergence criteria.
Countries Null Hypothesis
Eigen value Trace test P-value
Saudi
Arabia
r =0 0.43564 83.6702 0.001
r ≤1 0.42959 38.7006 0.029
r ≤2 0.35408 13.3866 0.056
r ≤3 0.17276 4.4063 0.085
Bahrain
r =0 0.60955 56.2028 0.047
r ≤1 0.35311 49.7002 0.015
r ≤2 0.26693 22.4273 0.0001
r ≤3 0.02690 0.7907 0.0042
Kuwait
r =0 0.68420 65.6777 0.0236
r ≤1 0.52171 32.2513 0.0853
r ≤2 0.29285 10.8628 0.1452
r ≤3 0.02767 0.8138 0.0000
Oman
r =0 0.70952 62.8902 0.0001
r ≤1 0.8138 27.0394 0.2145
r ≤2 0.39100 12.6573 0.6460
r ≤3 0.04279 1.2682 0.6214
Qatar
r =0 0.70952 120.6305 0.0000
r ≤1 0.39100 51.2184 0.0057
r ≤2 0.32479 14.3194* 0.2081
r ≤3 0.04279 1.1013 0.2075
UAE
r =0 0.93705 115.7399 0.4522
r ≤1 0.70466 43.8397 0.0000
r ≤2 0.34630 12.1293 0.0001
r ≤3 0.04056 1.0765 0.1345
Review of Economics & Finance
~ 59 ~
Table 4 Correlations of demand shocks
Bahreïn Kuwait Oman Qatar Saudia UAE
Bahreïn 1.000000
Kuwait 0.642475 1.000000
Oman 0.798188 0.901048 1.000000
Qatar 0.826765 0.781710 0.896144 1.000000
Saudia 0.969179 0.640492 0.785568 0.819228 1.000000
UAE 0.787960 0.768857 0.876985 0.954255 0.777190 1.000000
4.3.3 Correlation with Respect to Monetary Shocks
Table 5 presents correlations with respect to monetary shocks across GCC countries. The
results show more significant and positive correlation. This finding indicates that contemporaneous
monetary shocks faced by GCC countries are generally symmetric. In conclusion, correlations with
respect to various shocks do not display a strong support for the creation of a currency union
between GCC countries. So positive, where they founded, suggest that a currency union a feasible
option.
Table 5 Correlations of Monetary Shocks
Bahreïn Kuwait Oman Qatar Saudia UAE
Bahreïn 1.000000
Kuwait 0.879230 1.000000
Oman 0.858995 0.932566 1.000000
Qatar 0.833407 0.833408 0.925589 1.000000
Saudia 0.929500 0.920258 0.957026 0.918458 1.000000
UAE 0.789376 0.890456 0.909624 0.818861 0.851990 1.000000
4.4 Variance Decomposition
We carry out variance decomposition analysis in order to show the contribution of each shock
to movements in the four variables of the structural VAR model. The variance decomposition
technique identifies the contribution of the various shocks impinging on the economic system to the
variability of the SVAR variables, namely world output, domestic output, exchanges rates and the
price level.
Tables 6, 7 and 8 display the variance decomposition results in the short term, one year forecast
error, and in the long term, four-year forecast error. The variance decomposition identifies the
various shocks that are relatively more predominant in accounting for the variability of domestic
output, exchange rates and the price level. Differences across countries regarding sources of
variability may be indicative of the underlying differences of the transmission mechanisms of the
various shocks and accompanying policies. The results do not display the variance decomposition
of the change in world real GDP, reflecting the assumption that world real GDP evolves
exogenously. Hence, shocks to domestic supply and demand, as well as monetary policy shocks do
not affect the variability of world real GDP in the long term.
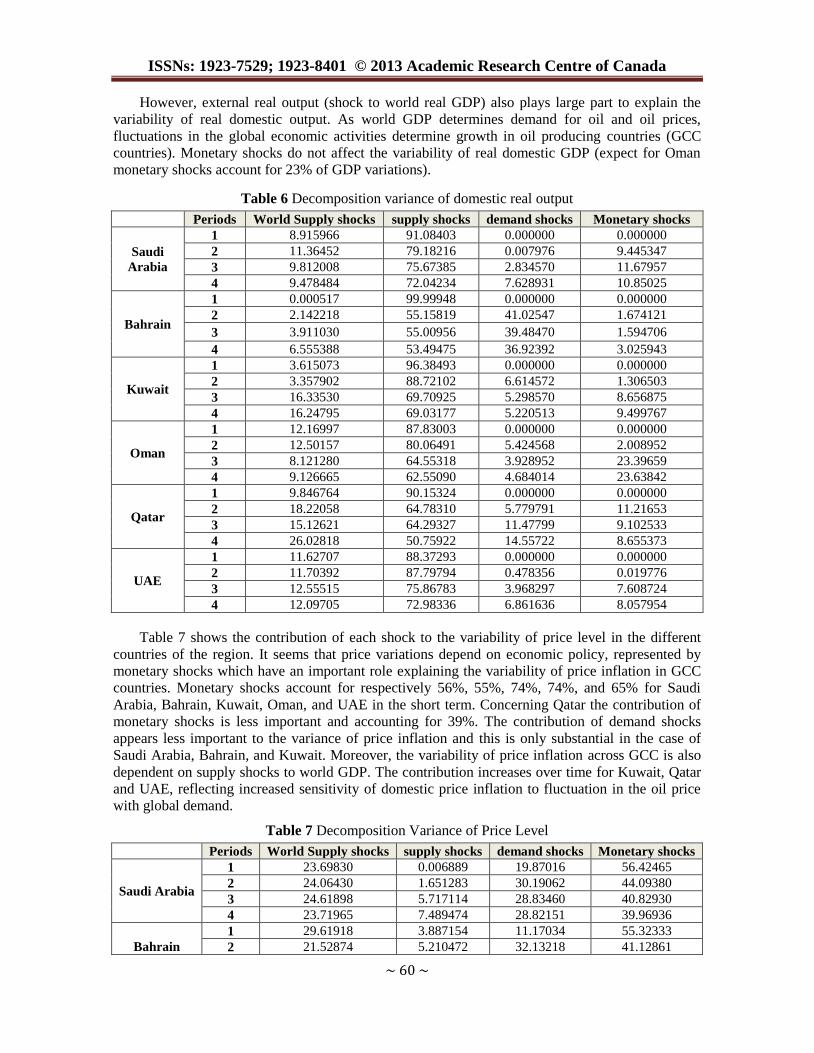
Table 6 shows the contribution of each shock to the variability of domestic real output in the
different countries of the region. We note the dominance of domestic supply shocks in explaining
the variability of domestic real output in the different countries of region. Indeed, short term or long
term impact has accounted for between 91% and 72% of the variability of domestic economic
activities for Saudi Arabia, 99% and 53% for Bahrain, 96% and 53% for Kuwait, 87% and 62% for
Oman, 90% and 50% for Qatar, and 88% and 72% for UAE. The dominant share of supply shocks
in the GCC countries reflects the dominant share of oil production in determining output supply and
real GDP growth.
ISSNs: 1923-7529; 1923-8401 © 2013 Academic Research Centre of Canada
~ 60 ~
However, external real output (shock to world real GDP) also plays large part to explain the
variability of real domestic output. As world GDP determines demand for oil and oil prices,
fluctuations in the global economic activities determine growth in oil producing countries (GCC
countries). Monetary shocks do not affect the variability of real domestic GDP (expect for Oman
monetary shocks account for 23% of GDP variations).
Table 6 Decomposition variance of domestic real output
Periods World Supply shocks supply shocks demand shocks Monetary shocks
Saudi
Arabia
1 8.915966 91.08403 0.000000 0.000000
2 11.36452 79.18216 0.007976 9.445347
3 9.812008 75.67385 2.834570 11.67957
4 9.478484 72.04234 7.628931 10.85025
Bahrain
1 0.000517 99.99948 0.000000 0.000000
2 2.142218 55.15819 41.02547 1.674121
3 3.911030 55.00956 39.48470 1.594706
4 6.555388 53.49475 36.92392 3.025943
Kuwait
1 3.615073 96.38493 0.000000 0.000000
2 3.357902 88.72102 6.614572 1.306503
3 16.33530 69.70925 5.298570 8.656875
4 16.24795 69.03177 5.220513 9.499767
Oman
1 12.16997 87.83003 0.000000 0.000000
2 12.50157 80.06491 5.424568 2.008952
3 8.121280 64.55318 3.928952 23.39659
4 9.126665 62.55090 4.684014 23.63842
Qatar
1 9.846764 90.15324 0.000000 0.000000
2 18.22058 64.78310 5.779791 11.21653
3 15.12621 64.29327 11.47799 9.102533
4 26.02818 50.75922 14.55722 8.655373
UAE
1 11.62707 88.37293 0.000000 0.000000
2 11.70392 87.79794 0.478356 0.019776
3 12.55515 75.86783 3.968297 7.608724
4 12.09705 72.98336 6.861636 8.057954
Table 7 shows the contribution of each shock to the variability of price level in the different
countries of the region. It seems that price variations depend on economic policy, represented by
monetary shocks which have an important role explaining the variability of price inflation in GCC
countries. Monetary shocks account for respectively 56%, 55%, 74%, 74%, and 65% for Saudi
Arabia, Bahrain, Kuwait, Oman, and UAE in the short term. Concerning Qatar the contribution of
monetary shocks is less important and accounting for 39%. The contribution of demand shocks
appears less important to the variance of price inflation and this is only substantial in the case of
Saudi Arabia, Bahrain, and Kuwait. Moreover, the variability of price inflation across GCC is also
dependent on supply shocks to world GDP. The contribution increases over time for Kuwait, Qatar
and UAE, reflecting increased sensitivity of domestic price inflation to fluctuation in the oil price
with global demand.
Table 7 Decomposition Variance of Price Level
Periods World Supply shocks supply shocks demand shocks Monetary shocks
Saudi Arabia
1 23.69830 0.006889 19.87016 56.42465
2 24.06430 1.651283 30.19062 44.09380
3 24.61898 5.717114 28.83460 40.82930
4 23.71965 7.489474 28.82151 39.96936
Bahrain
1 29.61918 3.887154 11.17034 55.32333
2 21.52874 5.210472 32.13218 41.12861
Review of Economics & Finance
~ 61 ~
Bahrain 3 25.99582 5.722484 31.68300 36.59870
4 25.80539 6.165380 31.22692 36.80231
Kuwait
1 12.44177 0.115805 13.16889 74.27353
2 12.75563 1.443753 14.25309 71.54753
3 18.05701 1.759645 13.05814 67.12520
4 18.78756 2.512694 12.81482 65.88492
Oman
1 23.37923 0.838749 1.305958 74.47606
2 18.50857 17.69514 1.494718 62.30158
3 17.71466 18.67045 2.730382 60.88451
4 16.16355 19.07654 2.952150 61.80776
Qatar
1 36.76452 18.33388 5.013605 39.88800
2 37.34656 19.33220 12.50933 30.81191
3 66.18273 13.42670 5.927742 14.46282
4 55.92646 14.42204 6.667366 22.98414
UAE
1 32.66850 2.019784 0.009083 65.30264
2 38.37454 1.893913 1.273603 58.45794
3 39.06786 3.935236 1.449999 55.54691
4 38.45192 4.741116 1.613108 55.19385
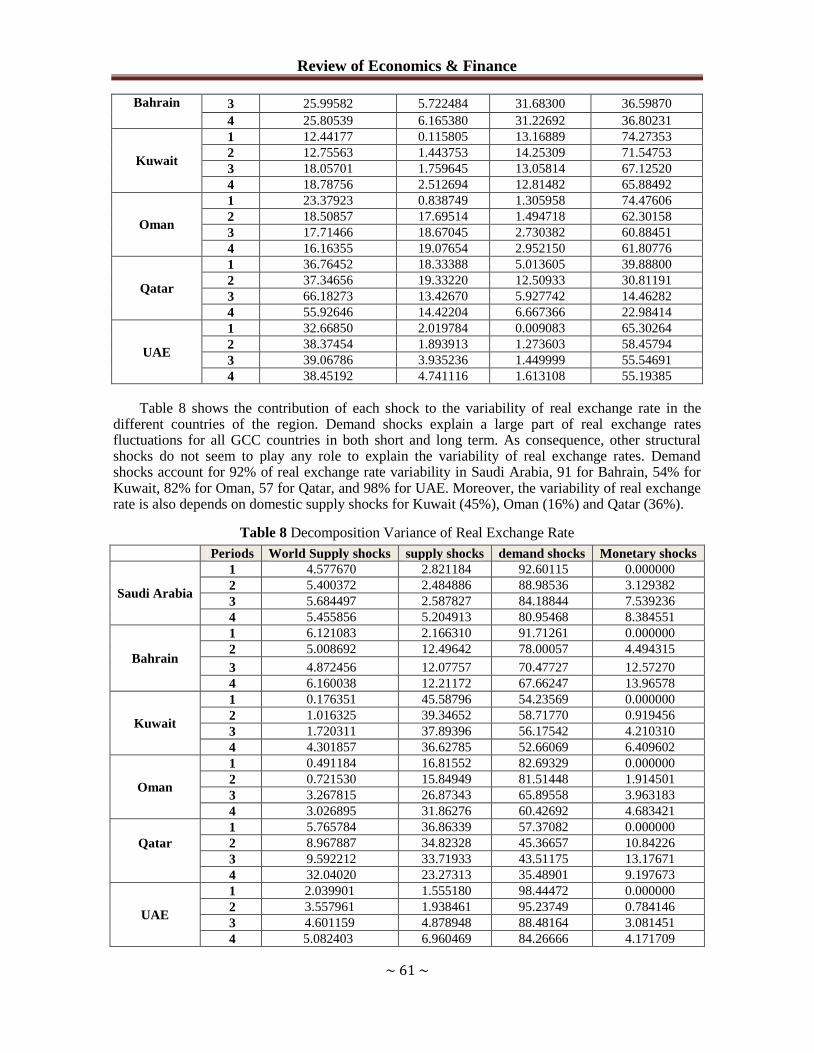
Table 8 shows the contribution of each shock to the variability of real exchange rate in the different countries of the region. Demand shocks explain a large part of real exchange rates fluctuations for all GCC countries in both short and long term. As consequence, other structural shocks do not seem to play any role to explain the variability of real exchange rates. Demand shocks account for 92% of real exchange rate variability in Saudi Arabia, 91 for Bahrain, 54% for Kuwait, 82% for Oman, 57 for Qatar, and 98% for UAE. Moreover, the variability of real exchange rate is also depends on domestic supply shocks for Kuwait (45%), Oman (16%) and Qatar (36%).
Table 8 Decomposition Variance of Real Exchange Rate
Periods World Supply shocks supply shocks demand shocks Monetary shocks
Saudi Arabia
1 4.577670 2.821184 92.60115 0.000000
2 5.400372 2.484886 88.98536 3.129382
3 5.684497 2.587827 84.18844 7.539236
4 5.455856 5.204913 80.95468 8.384551
Bahrain
1 6.121083 2.166310 91.71261 0.000000
2 5.008692 12.49642 78.00057 4.494315
3 4.872456 12.07757 70.47727 12.57270
4 6.160038 12.21172 67.66247 13.96578
Kuwait
1 0.176351 45.58796 54.23569 0.000000
2 1.016325 39.34652 58.71770 0.919456
3 1.720311 37.89396 56.17542 4.210310
4 4.301857 36.62785 52.66069 6.409602
Oman
1 0.491184 16.81552 82.69329 0.000000
2 0.721530 15.84949 81.51448 1.914501
3 3.267815 26.87343 65.89558 3.963183
4 3.026895 31.86276 60.42692 4.683421
Qatar
1 5.765784 36.86339 57.37082 0.000000
2 8.967887 34.82328 45.36657 10.84226
3 9.592212 33.71933 43.51175 13.17671
4 32.04020 23.27313 35.48901 9.197673
UAE
1 2.039901 1.555180 98.44472 0.000000
2 3.557961 1.938461 95.23749 0.784146
3 4.601159 4.878948 88.48164 3.081451
4 5.082403 6.960469 84.26666 4.171709
ISSNs: 1923-7529; 1923-8401 © 2013 Academic Research Centre of Canada
~ 62 ~
5. Conclusions
The present study has focused on the feasibility of creating a currency union between GCC
countries. An attempt at evaluating the readiness of GCC countries at establishing a currency union
is conducted using formal test, based on multivariate structural VAR model, and informal tests
based on the OAC literature.
When looking at the overall picture concerning the convergence of GCC economies, we
conclude that the degree of monetary convergence with low and similar inflation rates, co-moving
interest rates and low interest rate differentials and stable exchange rate is remarkable. Fiscal
convergence is less marked than monetary convergence. While government revenues and
expenditure and the budget balance tend to move in parallel due to the dependency of public
finances on oil revenues, the level of deficit/surplus varies significantly between countries.
Our analysis shows also that despite progress achieved on many front, GCC countries are yet to
fulfill the necessary pre-conditions for the establishment of currency union. The structure of their
economies remains dominated by the oil sector, intra-regional trade is very limited.
The formal test consists on the assessment of the degree of symmetry of shocks between GCC
countries. The methodology accounts for correlations across various shocks to identify their effects
on macroeconomic aggregates across GCC members’ countries and evaluates the prospect of their
integration in the context of a monetary union.
In general correlation results of the various shocks indicate that GCC countries are still far
forming an optimal currency union given the fact that a large number of correlation’s coefficients
are not positive meaning that shocks are asymmetric. However, decomposition variance results
argue well for feasibility of currency union across GCC countries.
References
[1] Bayoumi, T., and Eichengreen, B. (1994), “One Money or Many? Analyzing the Prospects for
Monetary Unification in Various Parts of the World”, Princeton Studies in International
Economics, No.76 [On-line] Available at: www.princeton.edu/~ies/IES_Studies/S76.pdf
[2] Blanchard, O. J., and Quah, D. (1989), “The Dynamic Effects of Aggregate Demand and Supply
Disturbances”, American Economic Review, 79(4):655- 673.
[3] Dar, H.A., and Presley, J. (2001), “The Gulf Co-operation Council: A Slow Path to Integration”,
World Economy, 24(9):1161-1178.
[4] Darrat, A.F. and Al-Shamsi, F.S. (2005), “On the Path of Integration in the Gulf Region”,
Applied Economics, 37(9): 1055- 1062.
[5] Goto, J. and Hamada, K. (1994), “Economic Preconditions for Asian Regional Integration”, In
Ito, T., and Krueger, A.O, (Eds.), Macroeconomic Linkages, University of Chicago Press, pp.
359-388.
[6] Jadresic, E. (2002), “On a Currency for the GCC Countries, IMF Policy Discussion Paper 12.
[7] Kuwan, C.H. (1998), “The Theory of Optimum Currency Areas and the Possibility of Forming a
Yen Bloc in Asia”, Journal of Asian Economics, 9(4): 555-580.
[8] Laabas,B., and Limam, I. (2002), “Are GCC Countries Ready for Currency Union”, Arab
Planning Institute Working Paper, No.32.
[9] Sturm, M. and Siegfried, N. (2005), “Regional Monetary integration in the member states of the
Gulf Cooperation Council”, European Central Bank Occasional Paper Series, No.31.
[10]Zaidi, I. (1990), “Monetary Coordination among the Gulf Cooperation Council Countries”,
World Development, 18(5): 759-768.