Embed Size (px)
Citation preview

I N V E N T U R E .I N S T I T U T I O N A L R E S E A R C H
On the Move…….INITIATING COVERAGE
Mr.Vardhan DharkarChief Finance Officer.022 66670289 / 66670254
Stock metricsBloomberg code KEC:IN
Reuters code KECL :BO
BSE Group B
BSE Code 532714
NSE Symbol KEC
Face Value Rs10
Market Cap (Rs cr) 1883.3
52WeekHigh/Low 456.80 /108
Sensex 13769
Nifty 4078.90
Average volume 31660.00
Shareholding pattern
41.5
36.8
15.6
6.1
Promtoers FIIs MFs, UTI & Insurance Others
Research AnalystMitesh [email protected]
Manoj [email protected]
022-407515158th July 2009
Current PriceRs 382.00
Target PriceRs 545.69
Potential Upside 42.85%
Time Frame24 Months
KEC International KEC International (KEC), is among the leading transmission EPC and tower manufacturing company, The company has leveraged its strong project management skills in T&D and replicated it via diversification in other growing areas of Railways and Telecom .RPG transmission and NITEL, both owned by the same promoter group, which were merged into KEC in Oct 2007 would benefit KEC in a big way and help it in growing its business dimensions which is mainly in Power T&D and Telecom infrastructure markets. KEC International generates about 69% of its revenue from international market including 25% from the Middle East region.
Robust Book Order to drive growthKEC order book stood at Rs 5160Cr which is mainly contributed by the transmission sector. The company is L1 for 5000Cr Telecom Order from BSNL is expected to confirmed by next two months.. The company recently received huge orders from Egypt, Australia, Afghanistan & India. As the company has a strong presence in international market with 74%of its order coming from the international market.
Improving Efficiency through merger: The merger of RPG Transmission and NITL will lead to higher efficiency and will enhance operational and financial capability of KEC.. Further the reduction of subcontracting expenditure with respect to net sales has reduced the overall business risk of the company.
Valuation:We have valued the company using P/E methodology; the stock is trading at P/E of 16.12x FY09 earnings. The current stock price is 382.00. We have arrived at the target price of Rs.545.69, considering time frame of 24 months. The stock is trading at 16.12x and 10.50x of FY09 and FY10 earnings. We rate the stock as a Market Ouperformer and have huge potential to move upward by 42.85 %.Key Financials
Year Ended March F Y 07 F Y 08 F Y 09 F Y 10E
Net Sales (Rs in crore) 2040.63 2814.48 3428.33 4000.00
EBIDTA 252.54 354.57 301.61 413.35
PBT 159.86 261.85 178.64 269.34
Net Profit (Rs in crore) 104.64 172.16 116.80 179.35
EBIDTA Margins (%) 12.38 12.60 8.80 10.33
Net Profit Margins (%) 5.13 6.12 3.41 4.48
EPS 21.23 34.92 23.69 36.39
ROCE (%) 33.28 30.12 23.61 28.06
ROE (%) 38.47 34.77 20.93 25.25Source IGSL Research
Industry Power Transmission
Market Data
Shareholding Pattern :

I N V E N T U R E .I N S T I T U T I O N A L R E S E A R C H
TABLE OF CONTENT
Serial No.
Particulars Page No.
1. Company Profile 3
2. Segment wise Revenue 4
3. Order Book 5-6
4. Investment Rationale 7
5. Industry Overview 9
6. Investment Concerns 14
7. Financial Summary 15
8. Income Statement 17
9. Balance Sheet 18
10. Cash Flow & Ratios 20-21

I N V E N T U R E .I N S T I T U T I O N A L R E S E A R C H
Back Ground of RPG Group
Source: Company
Management TeamName Designation
R P Goenka Group Chairman Emeritus
Harsh Goenka Group Chairman
Sanjiv Goenka Group Vice Chairman
Ramesh Chandak MD & CEO
Vardhan Dharkar CFO
Source: Company
Company BackgroundKEC is, a part of the USD 3 billion RPG group, carries vast experience and expertise in the Engineering Procurement Construction (EPC) business in power transmission, distribution, sub-station, railways and telecom having presence both in India and overseas. With present employee strength of about 2,500, spread over 18 countries and footprints in over 40 countries, the company has emerged as one of the leading power transmission EPC companies in the world providing end to end solution in Transmission, Distribution and Sub-station projects. Over the years, the company has demonstrated its capabilities in cross-country project management by meeting challenging requirements with regards to cost, quality and time with the support of pre-qualifications and an extremely valuable human capital in all the areas of its business – Power Transmission Networks, Power Distribution Networks, sub stations, Railway Electrification projects, Optical Fiber Cable Installations, Telecom Infrastructure Services and strengthen itself in services of Designing and Engineering, Tower Testing, Satellite and GPRS Surveys and Hotline Stringing.KEC International is a leading engineering, procurement and construction player in the power transmission and distributionspace, which generates about 69% of its revenue from international market including 25% from the Middle East region. KEC has successfully executed contracts from 33Kv to 800Kv in India and abroad. Till date, KEC has laid down more than 60000 kms of transmission lines of 400 kV which is 1.5 times the circumference of the earth (40000 kms).KEC has gone from strength to strength successfully exporting its EPC services to over 40 countries and widening its client base across the world. The company has an increasingly strong presence in South Asia, Middle East, Central Asia and Africa. Recently, it also made a mark in North America and seeks to serve more opportunities in that region. During its six decades of existence, KEC has helped transmit power to various countries that include Argentina, Australia, Brazil, Canada, Egypt, Ethiopia, Ghana, India, Indonesia, Iran, Iraq, Kenya, Kuwait, Lebanon, Malaysia, New Zealand, Nepal, Nigeria, Philippines, South Africa, Sri Lanka, Saudi Arabia, Sudan, Syria, Tajikistan, Thailand, Tunisia, USA, UAE and Vietnam..The company’s manufacturing facilities are at strategically advantageous locations of Jaipur in Rajasthan, Nagpur in Maharshtra & Jabalpur in Madhya Pradesh. Besides, it also has three modern tower testing services at Mumbai, Jaipur and JabalpurWhich are capable of testing towers up to 1000KV.
Business Segment
Companies
Transmission KEC Int, RPG cables
Power CESC,Noida Power
Tyres CEAT, Philips carbon, Harrison Malayalam
Retail Spencer Hypermarket , Music World, Spencer’s
Technology Zensar, RPG life science, Raychem RPG
Entertainment Saregama, Hamara CD

I N V E N T U R E .I N S T I T U T I O N A L R E S E A R C H
Revenue Model
The Revenue Model which is mainly contributed by the International market .Almost 60% of the revenue comes from the international market and the rest from the domestic side.
0
20
40
60
80
100
FY05 FY06 FY07 FY08 FY09E
Revenue Break up
International Domestic
Source: Company
Region wise Revenue Mix
Revenue MIx
31%
24%18%
27%
South Asia Middel East Central Asia Africa
Source: Company

I N V E N T U R E .I N S T I T U T I O N A L R E S E A R C H
SWOT ANALYSIS
SRENGHTS WEAKNESS
OPPORTUNITY THREATS
RECENT ORDER
ORDER DATE CLIENT VALUE( Cr) DETAILSTower supply June-23 Peru (South
America)&Chhattisgarh.
110 Tower Supply order From Peru of 33 cr and 77Crrest from Chhattisgarh
Turnkey Construction Of 110KV April-23 Mozambia&Nambia
95 Turnkey Construction Of 110KV and installation.
Rural Electrification project in West Bengal (255Cr), PGCIL (67Cr) &Transmission Corporation of Andhra Pradesh Ltd, (43Cr).
Feb-18 West Bengal State Electricity Distribution Company
365 Electrification new/augmentation Substations/PGCIL in Bihar, covering electrification in 16 blocks&Commissioning of 400 KV line in transmission in AP.
Design, supply and construction of 500 kV double circuit lines
Dec-12 Egyptian Electricity Transmission company
636 Largest ever order for KEC in value terms
Turnkey RuralElectrification project in Keonjhar, Orissa
Sept-08 NTPC Electric SupplyCompany Ltd. (NESCL)
120 Electrification of 2,195 villages-Construction of eight 33/11KV new new/augmentationsubstations
Source: Company
Aggressive in Foreign bidding and good exposure in the international markets which help the company to generate good revenue.
Commodities prices have fallen significantly which has resulted in order flow from the foreign clients
Good Scope for expanding through diversification and with the recent JV’s would help to the business going forward.
Due to the worsening global scenario the overall credit requirement of the company have fallen which may effect the company financials

I N V E N T U R E .I N S T I T U T I O N A L R E S E A R C H
ORDER BOOK
Order Book(RsCr)
25003000
4200
5160
0
1000
2000
3000
4000
5000
6000
FY06 FY07 FY08 FY09
Source: Company
KEC ORDER BOOK BREAK UP
KEC order book break up
77%
22%1%
Tranmission Line Distrubution Others
Source:Company
I N V E N T U R E .I N S T I T U T I O N A L R E S E A R C H
The merger has increased the total tower manufacturing capacity of the company to 161,000 tons per annum. The merger would enable KEC to utilize the surplus capacity of RPG Transmissions effectively and to reduce costs substantially
The company is also exploring opportunities in key developed markets such as North America, where no major investment was planned in Power in the past decade; significant investments has been planned in T&D now
Investment Rationale
Merger of RPG Transmissions and NITEL beneficial to KECThe merger of RPG Transmissions and NITEL with the company has made KEC one of the largest transmission companies across the globe. The merger has increased the total tower manufacturing capacity of the company to 161,000 tons per annum. The merger would enable KEC to utilize the surplus capacity of RPG Transmissions effectively and to reduce costs substantially. The company would extend its operational areas to telecom, railways power transmission and rural electrification.
Robust Order BookKEC Order book Stands at Rs 5163Cr which is 1.50x FY09 sales. The company is L1 for 5000Cr Telecom Order from BSNL is expected to confirm by next two months. The company recently received orders from Egypt, Australia, Afghanistan and Power Grid in India.
T&D Demand Robust with focus on international marketKEC is a strong transmission EPC player globally due to: i) strong project management skills, a key requirement in transmission EPC, developed the over years through projects executed in various countries and terrains, ii) strong pre-qualification status in various countries, iii) with the largest manufacturing facilities in India and iv) strong designing and testing towers (up to 1,000KV). Besides, the company has strong client base spread over 40 countries with noticeable presence in India, South Asia, the Middle East, Africa and Central Asia.
New markets to Grow KEC has strong client base spread over 40 countries with impressive presence in the Middle East, Africa and Central Asia. The company is also exploring opportunities in key developed markets such as North America, where no major investment was planned in Power in the past decade; significant investments has been planned in T&D now.
Opportunity in Railways KEC, which has already bagged various orders for railway electrification project, now plans to further profit from growing opportunity in other infrastructure development projects for the Railways such as laying cross-country railway tracks etc. During XI Plan, the Railways plan to spend Rs2,500bn on strengthening and upgrading railway system to address rising passenger and freight traffic, which is growing at 6% and 8- 9% annually. Besides opportunities for EPC players for electrification of 3,500kms, dedicated rail freight corridor has also been planned initially, western and eastern routes covering ~2,700kms track with an investment of Rs220bn mainly through EPC. KEC is believed to be have submitted all required documents for the forthcoming tenders that are expected to be floated by end-2009.

I N V E N T U R E .I N S T I T U T I O N A L R E S E A R C H
KEC planning to make a big entry here we expect the growth in revenue in Telecom Towers for the company would remain at 40% CAGR during FY08-FY10E
KEC has strong tower design and testing towers capabilities, thus providing end-to-end solutions.
Telecom Tower Business to grow at 35-40%The government is planning to go for tendering of 40000 telecom towers under USO fund to role out telecom network in the rural areas. With KEC planning to make a big entry here we expect the growth in revenue in Telecom Towers for the company would remain at 40% CAGR during FY08-FY10E.
Company providing full rangeIn FY09, KEC has under taken a BOO project under the USO fund. Under this the company will execute 400 towers in the rural and class C telecom areas with a subsidized cost of Rs 100 crore. These towers will be owned by the company and will be rented out to the telecom operators in those areas. Till FY13E the company cannot go for commercialization these towers and the expenses made for the operation of these towers will be reimbursed by the operators. From FY14E the company can rent out these towers at market rates. The company expects 4 operators each for each tower with a monthlyrental of Rs 40000 per operators.
Lower Commodities prices and falling Interest rates beneficialThe recently fall in the commodities prices and the interest rate would help the company to improve its margins. For instance, the falling interest rates, lower commodity prices and the likely increase in domestic inflow of power transmission orders in H2, FY09 augurs well for the company. The company’s cost of borrowing is in the range of 10-10.5 per cent, which should gradually come down going forward.
Strong in designing and manufacturingKEC has strong tower design and testing towers capabilities, thus providing end-to-end solutions. Besides, its manufacturing facilities with 180,000MT capacity (including70, 000MT contracted) are located in Jabalpur, Jaipur and Nagpur for transmission &telecom towers, giving the company significant cost advantages over its overseas peers.
KEC Capex PlansCompany had incurred a capex of 200 Cr, of which 120Cr is in NITL only. The ongoing capex would see the company adding 30,000 tonnes of tower making capacity to 200,000 tonnes a year by December. The company has reduced its capex plans on account of the economic turmoil and wants to preserve the cash to be on the safer side.

I N V E N T U R E .I N S T I T U T I O N A L R E S E A R C H
Yearly Investment by PGCIL IN 11TH PLAN
0
20000
40000
60000
80000
100000
120000
140000
FY08 FY09E FY10E FY11E FY12R
Source: PGCIL
The government has revived the APDRP (Accelerated PowerDevelopment & Reform Programme) scheme, entailing a capex of Rs515.7 bn for the T&D sector in FY09-12E
Industry Analysis
Power grid set to double its capacityPGCIL and Ministry of Power (MoP) have targeted nearly doubletransformation capacity addition (9,000 MVA) in FY10 over FY09 (5,655 MVA) in draft performance MOU for PGCIL (see Exhibit 3). Historically, PGCIL has overshot the ‘Very Good’ target by 15-16%, notching the “Excellent” target. Having achieved <50% in 220/765 kV and <75% in 400 kV segments for April-October 2008 period, we believe that some part of the capacity may slip in FY10. This, apart from the planned ~2x addition would enhance visibility for transformer industry growth mainly in the 765/400/220 kV segment.
Inter-Regional transmission capacity to increase from 17,000 MW to 37,000 MW by FY12Current inter-regional power transfer capacity stands at around 17,000 MW. The 11th FYP period entails huge capacity built-up (see Exhibit 5&6) required for evacuating and supplying power across the nation. Thus the unprecedented demand for substations andtransformers.
PGCIL has increased ordering and finalizing projects after sorting-out sovereign guarantee schemes last year and internal issues inFY09. 7-8 large size (765 kV transformer, reactor and substation package) tenders are up for bidding and most of them have to beawarded in next 3-4 months.
PGCIL achieved lower than expected capacities in the first 1-1/2 year for the 11th FYP, with no large generation capacity additions planned in the period .considering the under achievement and other internal problems sorted out a PGCIL, we expect the business of high voltage segment to pick up in the near future.
APDRP-II, National Electricity Fund to plug state funding gapsThe government has revived the APDRP (Accelerated PowerDevelopment & Reform Programme) scheme, entailing a capex ofRs515.7 bn for the T&D sector in FY09-12E. The programme would focus on establishment of base line data and fixation of accountability, and reduction of AT&C losses through strengthening and up-gradation of sub-transmission and distribution network and adoption of information technology. The program would be taken up in two parts viz. Part A and Part B.
I N V E N T U R E .I N S T I T U T I O N A L R E S E A R C H
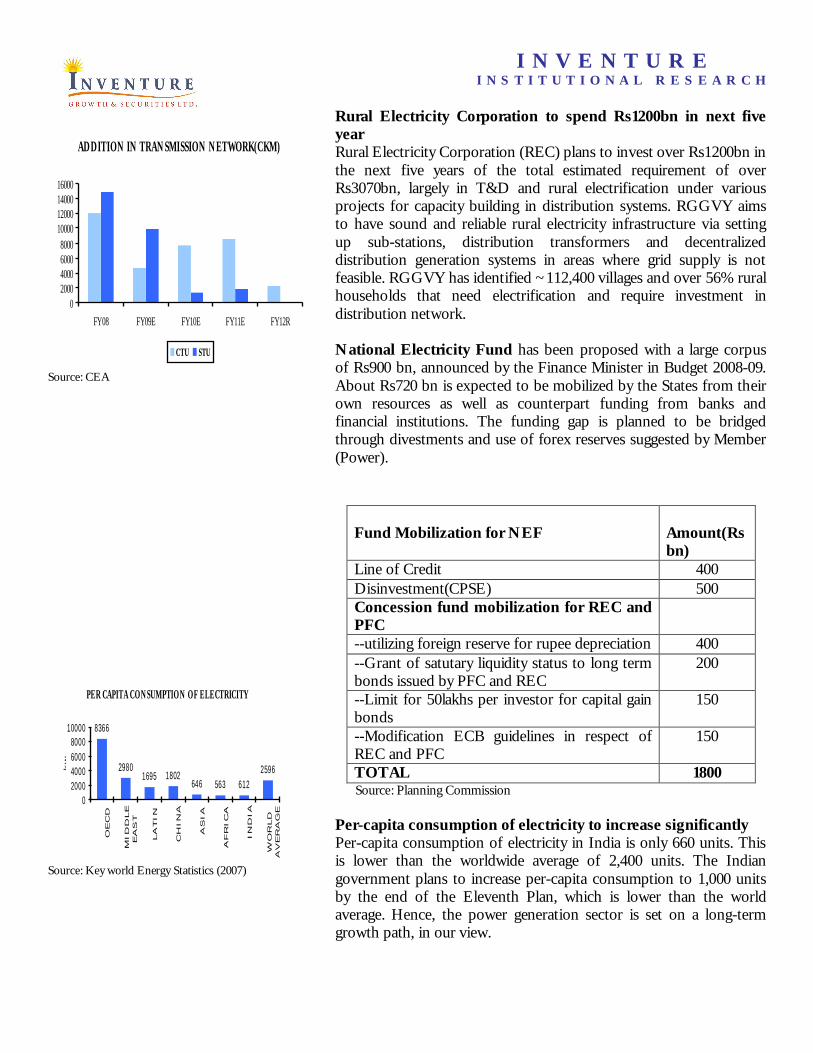
ADDITION IN TRANSMISSION NETWORK(CKM)
02000400060008000
10000120001400016000
FY08 FY09E FY10E FY11E FY12R
CTU STU
Source: CEA
PER CAPITA CONSUMPTION OF ELECTRICITY
8366
29801695 1802
646 563 6122596
02000400060008000
10000
OECD
MID
DLE
EAS
T
LA
TIN
CH
IN
A
ASIA
AFRICA
IN
DIA
WO
RLD
AVERA
GE
kw
Source: Key world Energy Statistics (2007)
Rural Electricity Corporation to spend Rs1200bn in next five yearRural Electricity Corporation (REC) plans to invest over Rs1200bn in the next five years of the total estimated requirement of over Rs3070bn, largely in T&D and rural electrification under various projects for capacity building in distribution systems. RGGVY aims to have sound and reliable rural electricity infrastructure via setting up sub-stations, distribution transformers and decentralizeddistribution generation systems in areas where grid supply is not feasible. RGGVY has identified ~112,400 villages and over 56% rural households that need electrification and require investment in distribution network.
National Electricity Fund has been proposed with a large corpus of Rs900 bn, announced by the Finance Minister in Budget 2008-09. About Rs720 bn is expected to be mobilized by the States from their own resources as well as counterpart funding from banks and financial institutions. The funding gap is planned to be bridged through divestments and use of forex reserves suggested by Member (Power).
Fund Mobilization for NEF Amount(Rs bn)
Line of Credit 400Disinvestment(CPSE) 500Concession fund mobilization for REC and PFC--utilizing foreign reserve for rupee depreciation 400--Grant of satutary liquidity status to long term bonds issued by PFC and REC
200
--Limit for 50lakhs per investor for capital gain bonds
150
--Modification ECB guidelines in respect of REC and PFC
150
TOTAL 1800 Source: Planning Commission
Per-capita consumption of electricity to increase significantlyPer-capita consumption of electricity in India is only 660 units. This is lower than the worldwide average of 2,400 units. The Indian government plans to increase per-capita consumption to 1,000 units by the end of the Eleventh Plan, which is lower than the world average. Hence, the power generation sector is set on a long-term growth path, in our view.

I N V E N T U R E .I N S T I T U T I O N A L R E S E A R C H
Inter Regioanl Transmission Capacity
0
2000
4000
6000
8000
10000
12000
14000
Eastt-SouthEast
NorthEast
WestEast-
NorthEast
North -East
NorthWest
West-South
NorthEast-NorthWest
Mw
Xth Plan X1th Plan X11th Plan
Source: CEA
Two projects - Sasan UMPP and Mundra UMPP - have already been awarded to developers. Tariffs quoted in the bidding of these two projectswere extraordinarily low and the success of these projects could open up doors to a large amount of private participation in the sector, in our view…
Ambitious plans for the Indian power sectorThe power sector is a priority for the Indian government. India suffers from chronic power shortages with a peak power deficit as high as 14%. Per-capita consumption is only 660 units compared to a worldwide average of 2,400 units and 14,000 units in the US. The Indian government has embarked upon an ambitious target of ‘Power for All’ by 2012. We believe this has led to a spurt in activity in the sector with huge investments planned in the near future. Thegovernment envisions an addition of approximately 78,000MW in the Eleventh Five-Year Plan. We expect this to be supplemented by similar investments in power T&D.
Power capacity addition targets (Eleventh Plan) (in MW)
Source: Economic Survey 2007-2008
We estimate a huge market for power equipmentWe expect a US$50 bn market for power generation equipment and a US$45 bn market for power T&D equipment over FY08E-FY12E. Companies set to benefit from these investments include generation equipment makers such as Bharat Heavy Electrical Ltd,), and T&D equipment makers such as ABB India ,Crompton Greaves and Areva T&D India).Planned investments in the power sector in the Eleventh plan are a four-fold increase on the10th five-year plan. Hence, high growth rates demonstrated by companies over the past three to four years should be sustainable.
Ultra-mega power projectsBesides the projects planned under the Eleventh Plan, the government has also initiated the concept of ultra mega power projects (UMPPs). These projects are estimated to be very large projects of 4,000MW each to be awarded on a tariff-based bidding process. Two projects — Sasan UMPP and Mundra UMPP — have already been awarded to developers. Tariffs quoted in the bidding of these two projects were extraordinarily low and the success of these projects could open up doors to a large amount of private participation in the sector, in our view. The government has planned an additional five projects, and their benefits would only be realized in the Twelfth Plan.
Sector Hydro Thermal Nuclear Total %share
Central 9685 26800 3380 39865 50.7
State 3605 24347 0 27952 35.5
Private `3263 7497 0 10760 13.8
Total 16533 58644 3380 78577
%Share 21.1 74.6 4.4 100

I N V E N T U R E .I N S T I T U T I O N A L R E S E A R C H
Long-term Growth StoryWhile the thumb rule says that every megawatt of new power generation capacity requires an investment of Rs 4-4.5 Cr, another Rs 1.5 Cr is required as investment in T&D infrastructure if the power generated has to efficiently reach the point of consumption (household, industry, etc). In this light and given that India have plans to add 78,000 mw in the 11th five-year plan (2008-12) and 80,000 mw in the 12th plan (2013-17), there is enough growthvisibility for companies in the T&D infrastructure space. The government’s focus to electrify every village and the huge investments being made in setting up the ultra mega power plants (4,000 mw each) provide further comfort in terms of growth potential. According to industry estimates, government owned, Power Grid Corporation has capital expenditure plans of Rs 55,000 Cr on T&D during the 11th five-year plan. Out of this, Power Gridwill spend about Rs 8,500Cr in FY09 and about Rs 9,000-10,000Cr in FY10. Importantly, a similar amount will be spent by various State Electricity Boards and under schemes like rural electrification and APDRP.
Planned augmentation of inter-regional transmission capacity
Source: CEA, Infraline energy research
Planned investment in transmissionSince various new generating initiatives have been outlined in the Eleventh Plan, investments will have to be made in T&D for the proper evacuation of power. This along with investment in inter-regional transmission will drive investments in T&D in the eleventh plan.
Investment in T&D
Sub sector (INR bn) (INR bn)
Inter-state transmission 750
Intra-state transmission 650
TOTAL 1400 Source: CEA
Planned augmentation of inter-regional transmission capacityYear (MW) FY02 FY05 FY07 FY10E FY12E765KV 0 0 1100 2200 9200400KV 1000 2400 7800 11400 16400HVDC 2200 5200 5700 11400 16400220KV 1850 1850 1850 1850 1850TOTAL 5050 9450 16450 21150 37150

I N V E N T U R E .I N S T I T U T I O N A L R E S E A R C H
Power ReformsObjective Recommendation
Open access to T&D Transmission opened to private lenderswith over 19 traders wheeling power
National ElectricityPolicy, 2005
Financial turn around andcommercial viability of theelectricity sector Control cost of generation Introduced captive coal block
allocationand competitive bidding for controllingpower costs
Except Hydro Power Power generation has been delicensed since 2003
Delicense distribution inrural areas
Distribution and generation has beendelicensed in rural areas since June 2003
Electricity Act, 2003
Open up electricity toprivate sector
Allow open access tocaptive generation
Open access allowed for captive players tocarry electricity from generating plant todestination of use since June 2003
Ahulwalia Committee(FY03)
Restructure financialconditions of StateElectricity board
Secure payment of StateElectricity Boards (SEB)through bond issuance
50% of (interest due) payments werewaived and the balance of dues (includingthe principle amount) was securitisedthrough bonds issued by respective stategovernments
Accelerated PowerReforms DevelopmentProgram, FY03(APDRP)
Accelerate distributionreforms and initiate financialturnaround
Up gradation of transmissionand distribution networkthereby reducing aggregatetechnical and commercial(AT&C) losses
AT&C losses reduced to 34% in FY05 from37% in FY02Commercial losses of state electricityboards reduced by 33% from Rs.293bn inFY02 to Rs.197bn in FY04
Source: Ministry of Power and Central Electricity Authority

I N V E N T U R E .I N S T I T U T I O N A L R E S E A R C H
The company is significantly exposed to rising commodities prices .Any further increase in the prices would hamper the company profit and the margin will further fall.
There are delays in the execution of order by the government which has resulted in slowing of the projects
Risks
Raw material pricesKEC’s 70% order book consists of the international revenue and all the export orders have a price variation contract with no price variation clause. The company is significantly exposed to rising commodities prices .Any further increase in the prices would hamper the company profit and the margin will further fall.
Focused on single clientAs large part of the domestic orders come from the single client it posses huge risk to the business, the orders may be distributed according the company requirement and could be evenly distributed and may also disappoint expectation.
Interest rate scenarioThe recent surge in the global crude prices has lead to tightening of the interest rate this has lead to higher borrowing cost which KEC requires for strengthening its capital working requirement which know the company would have to buy at a higher price.
Foreign exchange Fluctuations
The company is widely exposed to the international markets so to match the currency fluctuation the company is trying to match it by the expenses wherever possible.
Delays in Government spending
There are delays in the execution of order by the government which has resulted in slowing of the projects.

I N V E N T U R E .I N S T I T U T I O N A L R E S E A R C H
The company made a higher capex in FY09 which resulted in low Asset turnover of the company
The EBIDTA margin of the companies in the transmission tower sector hasbeen showing an improvement due to the increase in order flows and projects with higher margins. The net margin of these companies have also been increasing due to better working capital management, leading to a decline in interest costs across the sector
HIGHER CAPEX IN FY09 RESULTING FALL IN ASSET TURNOVER
0
1000
2000
3000
4000
5000
FY07 FY08 FY09E FY10E
0.000.50
1.001.50
2.002.50
3.003.50
Net sales Asset turnover
`
EBDITA & EBDITA MARGIN(%)
0.00
100.00
200.00
300.00
400.00
500.00
FY07 FY08 FY09E FY10E
0.00
2.00
4.00
6.00
8.00
10.00
12.00
14.00
EBDITA EBITA MARGIN(%)
I N V E N T U R E .I N S T I T U T I O N A L R E S E A R C H
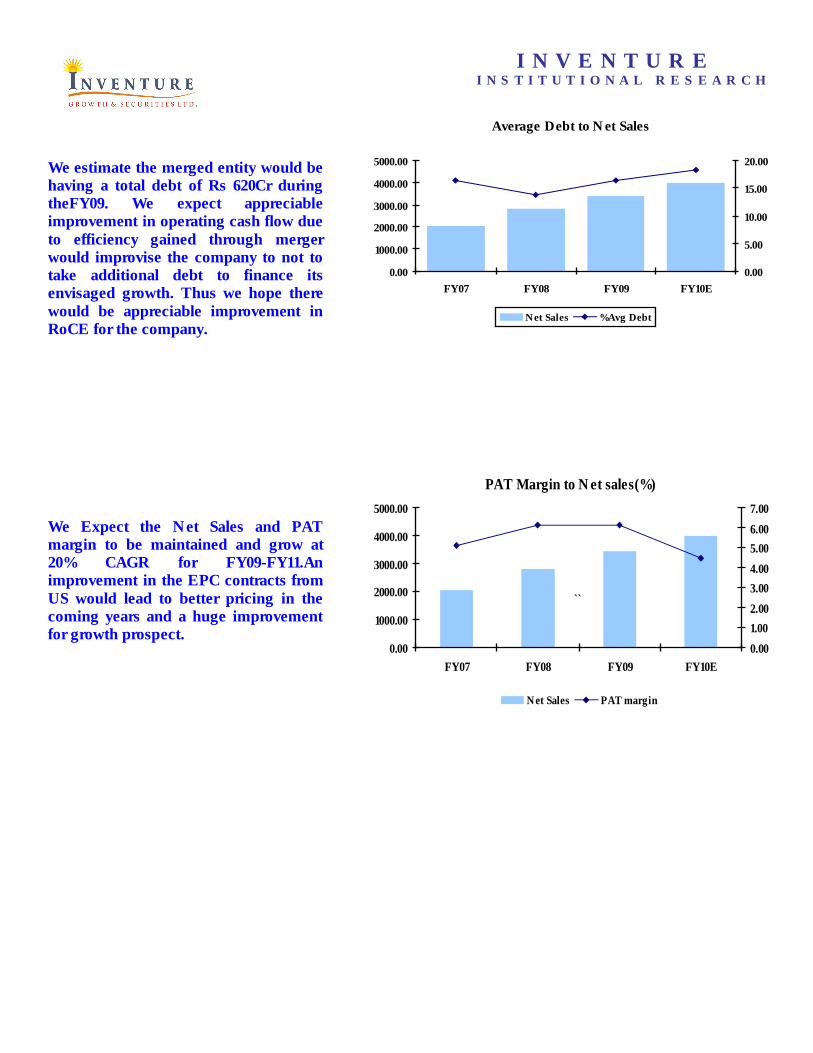
We estimate the merged entity would be having a total debt of Rs 620Cr during theFY09. We expect appreciable improvement in operating cash flow due to efficiency gained through merger would improvise the company to not to take additional debt to finance its envisaged growth. Thus we hope there would be appreciable improvement in RoCE for the company.
We Expect the Net Sales and PAT margin to be maintained and grow at 20% CAGR for FY09-FY11.An improvement in the EPC contracts from US would lead to better pricing in the coming years and a huge improvement for growth prospect.
Average Debt to Net Sales
0.00
1000.00
2000.00
3000.00
4000.00
5000.00
FY07 FY08 FY09 FY10E
0.00
5.00
10.00
15.00
20.00
Net Sales %Avg Debt
PAT Margin to Net sales(%)
0.00
1000.00
2000.00
3000.00
4000.00
5000.00
FY07 FY08 FY09 FY10E
0.00
1.00
2.00
3.00
4.00
5.00
6.00
7.00
Net Sales PAT margin
``

I N V E N T U R E .I N S T I T U T I O N A L R E S E A R C H
Profit and Loss Account Rs. Cr
FY06 FY07 FY08 FY09 FY10E
Net Sales 1727.25 2040.63 2814.48 3428.83 4000.00
% Growth - 18.14 37.92 21.83 16.66
Other Income 0.42 0.69 0.25 0.28 0.35
Total Income 1727.67 2041.32 2814.73 3429.11 4000.35
Raw Material Expns 889.40 929.33 1413.86 1975.83 2200.00
% Sales 51.49 45.54 50.24 57.62 55.00
Employee Expenses 83.77 95.47 123.25 142.00 172.00
% Sales 4.85 4.68 4.38 4.14 4.30
Other Expenses 591.82 763.98 923.05 1009.67 1215.00
% Sales 34.26 37.44 32.80 29.45 30.38
TOTAL EXPENDITURE 1564.99 1788.78 2460.16 3127.50 3587.00
% Sales 90.61 87.66 87.41 91.21 89.68
PBIDT 162.68 252.54 354.57 301.61 413.35
% Growth - 55.24 40.40 -14.94 37.05
Interest 59.28 59.25 67.65 99.97 118.00
% Avg Debt 17.82 16.49 13.83 16.48 18.27
PBDT 103.40 193.29 286.92 201.64 295.35
Depreciation 26.94 33.43 25.07 23.00 26.00
% Gross Block 5.99 7.29 5.07 3.99 3.99
PBT 76.46 159.86 261.85 178.64 269.35
% PBT 35.52 34.54 34.25 34.62 33.41
Reported Profit After Tax 49.30 104.64 172.16 116.80 179.35
% Growth - 112.25 64.53 -32.16 53.55Source: IGSL

I N V E N T U R E .I N S T I T U T I O N A L R E S E A R C H
Balance Sheet Rs. Cr
Source: IGSL
SOURCES OF FUNDS : FY06 FY07 FY08 FY09 FY10E
Share Capital 50.69 50.69 59.74 59.74 59.74
Reserves Total 136.51 221.31 435.34 508.74 660.95
Total Shareholders Funds Netwoth 187.2 272.00 495.08 558.08 710.29
Total Debt 332.63 386.19 591.77 621.82 670
Total Liabilities 531.48 686.59 1099.1 1179.9 1380.29
APPLICATION OF FUNDS
Gross Block 449.91 467.63 521.29 631.97 671.97
Less : Accumulated Depreciation 26.88 60 89.85 124.78 150.78
Net Block 423.03 407.63 431.44 507.19 521.19
Capital Work in Progress 5.97 2.29 18.9 54.33 39.56
Investments 20.48 20.59 0.47 0 0.47
Sundry Debtors 680.31 904.09 1430.01 1866.2 2008.6
Cash and Bank 63.61 21.39 68.02 141.05 300.00
Loans and Advances 161.87 171.73 276.94 302.85 350
Other Current Assets 0 0 0 0.05 0
Total Current Assets 1030.69 1247.78 1980.4 2535.9 2958.6
Total Current Liabilities 940.22 990.78 1317.09 1887.7 2150
Net Current Assets 90.47 257 663.31 648.25 808.60
Total Assets 519.83 658.48 1094.08 1179.95 1380.29

I N V E N T U R E .I N S T I T U T I O N A L R E S E A R C H
Ratio Analysis Rs.Cr
Source: IGSL
Ratio Analysis
Turnover Ratios FY06 FY07 FY08 FY09 FY10E
Net sales to total assets 3.32 3.10 2.57 2.91 2.90
Net sales to Fixed assets 4.03 4.98 6.25 6.11 7.13
Net sales to net working capital 19.09 7.94 4.24 5.29 4.95
Net Working Capital Days 19.12 45.97 86.02 69.01 73.78
Net sales to inventory 13.83 13.55 13.70 15.19 13.33
Net sales to debtors 2.54 2.26 1.97 1.84 1.99
Liquidity ratios
Current ratio 1.10 1.26 1.50 1.34 1.38
Inventory Days 26.39 26.93 26.64 24.03 27.38
Debtors Days 143.76 161.71 185.45 198.66 183.28
Valuation Ratios (x)
PE 38.20 18.00 10.94 16.12 10.50
P/BV 10.06 6.92 3.80 3.37 2.65
EV/EBIDTA 14.39 9.27 6.60 7.76 5.66
EV/SALES 1.36 1.15 0.83 0.68 0.59
Market Cap/Sales 1.14 0.97 0.70 0.58 0.49
Return Ratios (%)
ROCE 26.11 33.28 30.12 23.61 28.06
ROE 26.34 38.47 34.77 20.93 25.25
Margins (%)
EBIDTA 9.42 12.38 12.60 8.80 10.33
EBIT 7.86 10.74 11.71 8.13 9.68
PAT 2.85 5.13 6.12 3.41 4.48
EPS - 112.25 64.53 -32.16 53.55

I N V E N T U R E .I N S T I T U T I O N A L R E S E A R C H
CASH FLOW Rs Cr
FY06 FY07 FY08 FY09 FY10E
Cash Flow Summary
Cash and Cash Equivalents at Beginning of the year 165.39 62.99 21.39 68.99 140.98
Op. Profit before Working Capital Changes 163.81 238.94 361.81 339.66 418.35
Total (OP before Working Capital Changes) -40.43 -221.34 -266.94 101 81.03
Cash Flow before Extraordinary Items 115.71 -21.85 4.34 376.71 409.38
Net Cash from Operating Activities 115.71 -21.85 4.34 376.71 409.38
Net Cash Used in Investing Activities -32.52 -9.83 -13.36 -135.98 -105.00
Cash Flow From Financing Activities
Net Cash Used in Financing Activities -185.59 -9.92 55.64 -168.74 -145.14
Net Inc/(Dec) in Cash and Cash Equivalent -102.4 -41.6 46.62 71.99 159.24
Cash and Cash Equivalents at End of the year 62.99 21.39 68.01 140.98 300.22
Source: IGSL

I N V E N T U R E .I N S T I T U T I O N A L R E S E A R C H
Names Designation E-Mail Id. Contact Number
Nagji Rita CMD [email protected] 40751515*531
SALES
Ravinder Kasliwal Head Institutional Sales [email protected] 40751565/66Dealing
Vinit Rita Institutional Dealer [email protected] 40751565/66
Rashda Ainapore Institutional Dealer [email protected] 40751565/66
Amit Rita Institutional Dealer [email protected] 40751565/66
Research
Neha Kakade Senior Research Analyst [email protected] 40750515*583
Ashish Pandey Research Analyst [email protected] 40751515*582
Manoj Jethva Research Analyst [email protected] 40751515*579
Mitesh Shah Research Analyst [email protected] 40751515*581
Denil Savla Research Analyst [email protected] 40751515*580
Sanjeev Haria Research Analyst [email protected] 40751515
Sibayan Banerjee Technical Analyst [email protected] 022 22723797
Ashok Patel Technical Analyst [email protected] 022 22723797
Madhu Patel Technical Analyst [email protected] 022 22723797
DisclaimerThis Document has been prepared by Inventure Growth & Securities Ltd. The information, analysis and estimates contained herein are based on Inventure’s assessment and have been obtained from sources believed to be reliable. Neither Inventure Growth & Securities Ltd nor any of its employees or associates accepts any liability whatsoever direct or indirect that may arise from the use of information herein and shall not be responsible for its completeness and accuracy. It is not an offer to sell or a solicitation to buy securities. This document is for circulation only
Visit us at www.inventuregrowth.com
Please send your Feed Back to [email protected]
Inventure Growth & Securities LtdCorporate Office: - Viraj Tower, 2nd Floor, Near Landmark,
Western Express Highway, Andheri East, Mumbai - 400 069.Tel.:- +91-22-40751515, Fax: - +91-22-40751535

![[XLS] Report... · Web viewKARNATAKA BANK LTD. KAYA LIMITED KEC INTERNATIONAL LTD. (FORMERLY KNOWN AS KEC INFRASTRUCTURES LTD.) KESAR PETROPRODUCTS LTD KESORAM INDUSTRIES LTD KEWAL](https://img.pdfslide.us/doc/110x75/5ac79c417f8b9a42358b9ef2/xls-reportweb-viewkarnataka-bank-ltd-kaya-limited-kec-international-ltd-formerly.jpg)