Embed Size (px)
Citation preview
Subscriber access provided by the Library Service | University of Stellenbosch
The Journal of Physical Chemistry C is published by the American Chemical Society.1155 Sixteenth Street N.W., Washington, DC 20036Published by American Chemical Society. Copyright © American Chemical Society.However, no copyright claim is made to original U.S. Government works, or worksproduced by employees of any Commonwealth realm Crown government in the courseof their duties.
Article
On the Mass Transport in Apparently Iodine-free Ionic Liquid PolyanilineCoated Carbon Black Composite Electrolyte in Dye-sensitized Solar Cell
Henri Johannes Vahlman, Janne Kristian Halme, Juuso T. Korhonen, Kerttu Aitola, and Janne PatakangasJ. Phys. Chem. C, Just Accepted Manuscript • DOI: 10.1021/jp401401t • Publication Date (Web): 25 Apr 2013
Downloaded from http://pubs.acs.org on May 6, 2013
Just Accepted
“Just Accepted” manuscripts have been peer-reviewed and accepted for publication. They are postedonline prior to technical editing, formatting for publication and author proofing. The American ChemicalSociety provides “Just Accepted” as a free service to the research community to expedite thedissemination of scientific material as soon as possible after acceptance. “Just Accepted” manuscriptsappear in full in PDF format accompanied by an HTML abstract. “Just Accepted” manuscripts have beenfully peer reviewed, but should not be considered the official version of record. They are accessible to allreaders and citable by the Digital Object Identifier (DOI®). “Just Accepted” is an optional service offeredto authors. Therefore, the “Just Accepted” Web site may not include all articles that will be publishedin the journal. After a manuscript is technically edited and formatted, it will be removed from the “JustAccepted” Web site and published as an ASAP article. Note that technical editing may introduce minorchanges to the manuscript text and/or graphics which could affect content, and all legal disclaimersand ethical guidelines that apply to the journal pertain. ACS cannot be held responsible for errorsor consequences arising from the use of information contained in these “Just Accepted” manuscripts.
On the Mass Transport in Apparently Iodine-free
Ionic Liquid Polyaniline Coated Carbon Black
Composite Electrolyte in Dye-sensitized Solar Cell
Henri Vahlman, Janne Halme,∗ Juuso Korhonen, Kerttu Aitola, and Janne
Patakangas
Department of Applied Physics, Aalto University, Espoo
E-mail: [email protected]
∗To whom correspondence should be addressed
1
Page 1 of 31
ACS Paragon Plus Environment
The Journal of Physical Chemistry
123456789101112131415161718192021222324252627282930313233343536373839404142434445464748495051525354555657585960
Abstract
Volatile electrolytes are a stability concern in dye solar cells (DSC) due to their tendency
to leakage. A composite electrolyte consisting of iodide based ionic liquid and polyaniline
coated carbon black has been previously reported to provide good current transport while be-
ing leakage proof due to a quasi-solid structure and absence of volatile constituents. In this
paper we investigate the operating principle of this type of electrolyte, and especially its ex-
ceptional feature of operating efficiently without added iodine. Absence of additive iodine is
significant due to the fact that it is usually required to form the current carrying I−/I−3 redox
couple. We modified an electrolyte mass transport model from the literature to estimate the
upper-limit for the charge transport capability of the composite electrolyte. Comparison of
experimental results with the estimated upper-limit for the diffusion limiting current density
shows clearly that the high current densities observed experimentally with the composite elec-
trolyte can not be explained with normal diffusion even in the case that every feasible source
and transport mechanism of free I–3 known until now is considered, including photogeneration
of I−3 , shortened diffusion layer thickness, impurity I−3 and accumulation of I−3 to the photo-
electrode from the counterelectrode pores and electrolyte edge regions. This intriguing result
suggests a currently unknown I−3 source or transport mechanism in this type of DSC.
KEYWORDS: photovoltaics; carbon nanoparticle; quasi-solid electrolyte; extended electron
transfer surface
Introduction
Dye solar cell (DSC)1 has a structure and materials that enable fabrication of colorful, semitrans-
parent, flexible and lightweight modules. These traits combined with roll-to-roll adaptability and
relatively low investment costs of necessary manufacturing equipment have ensured growing re-
search interest over the past two decades. However, technological and material development is still
required, in particular to improve the operating lifetime and reliability of DSC modules. One crit-
ical issue with this respect is possible leakage of the volatile liquid electrolyte commonly used in
2
Page 2 of 31
ACS Paragon Plus Environment
The Journal of Physical Chemistry
123456789101112131415161718192021222324252627282930313233343536373839404142434445464748495051525354555657585960
DSC, due, for example, to a sudden sealant failure or a more gradual diffusion through the sealant
materials.
A possible pathway to solve problems related to electrolyte volatility and leakage is to utilize
electrolytes based on ionic liquids (IL) that have practically zero vapor pressure at all conceivable
solar cell operating temperatures. Among different classes of ILs, imidazolium iodides are an often
preferred choice due to their relatively low viscosity and the fact that they inherently contain high
I− concentration which is necessary for fast dye regeneration. Nevertheless, their viscosity still
being much higher than that of organic solvents, a relatively high amount of additive I2 is needed
to support a diffusion flux of I−3 from the photoelectrode to the counterelectrode (practically all
additive I2 reacts with electrolyte I− and forms I−3 ). High I−3 concentration, however, has the
downside of increasing recombination losses at the photoelectrode, which tends to decrease the
open circuit voltage of the cell. On the positive side, high I− content has been found to give
rise to a specific Grotthus-type bond exchange mechanism, which gives imidazolium iodide based
ionic liquids better charge transport properties than expected on the basis of their relatively high
viscosity.2
To further improve charge transport properties of ionic liquid electrolytes, several different
approaches have been taken. These include mixing imidazolium iodide salts with lower viscos-
ity non-electroactive ionic liquids,3 mixing different imidazolium iodide salts together in order
to form low viscosity eutectic melts,4 shortening the diffusion path by fabricating straight ion
paths,5,6 and attempting to improve the Grotthus bond exchange by dispersing either conducting,7
semiconducting7,8 or insulating nanoparticles9,10 into the electrolyte. In many cases, the nanoparti-
cle dispersion approach had the additional benefit of quasi-solidifying the electrolyte, thus making
it easier to deposit and less prone to escaping from a sealed DSC.
A particularly interesting approach in regard to electrolyte gelation with nanoparticles was
detailed by Ikeda et al.:11 the authors made a composite electrolyte using only two electrolyte
components; 11 wt.-% of conducting polyaniline-loaded carbon black (PACB) nanoparticles was
mixed with 1,3-diethyleneoxide derivative of imidazolium iodide (EOImI), which after grinding
3
Page 3 of 31
ACS Paragon Plus Environment
The Journal of Physical Chemistry
123456789101112131415161718192021222324252627282930313233343536373839404142434445464748495051525354555657585960
in an agate mortar formed a highly viscous conductive black electrolyte paste. No added iodine
was required for the electrolyte to operate efficiently in a DSC, but formation of triiodide from
iodide anions of EOImI under illumination was considered sufficient to drive the device. In fact,
added I2 was shown to be even detrimental to the DSC efficiency, for an unknown reason. This is
the complete opposite of the situation that usually prevails in the case of ionic liquid electrolytes;
normally a high amount of additive I2 is required to remove the I−3 diffusion limitation, and addi-
tional I2 does not begin to deteriorate the cell performance until a relatively high I−3 concentration
is reached.12 From the point of view of device optimization and improvement, and possible future
novel applications of the composite electrolyte concept, it is important to know and understand the
mechanisms that, on one hand improve the mass transport such that additive I2 becomes redundant,
and on the other hand those that ultimately restrict the conversion efficiency of such an additive I2-
free system. In this paper we focus on the first-mentioned point, that is, our objective is to provide
clarity for the exceptionally efficient charge transport without added I2.
As to why the ionic liquid - carbon nanoparticle composites work so efficiently as DSC elec-
trolytes without any added I2, it has been proposed in the literature that a so called extended elec-
tron transfer surface (EETS) is formed between the electrodes.13–15 According to the EETS model,
electrons are transferred close to the photoelectrode through ohmic conduction taking place in the
conductive and catalytically active carbon material. According to the EETS model, the efficiency
enhancement observed in this type of DSC follows from improved charge transport through the
electrolyte layer, deriving from the combined effects of photogeneration of I−3 on one hand, and
shortened I−3 diffusion distance on the other. In the course of this paper, we examine to which extent
the above mentioned improvement in electrolyte charge transport derives from these two hypothe-
sis. Moreover, since one of the precursors for the synthesis of imidazolium iodides, iodomethane
(CH3I), usually contains trace amounts of diiodomethane (CH2I2), we take into account the possi-
bility that the ionic liquid contains a non-negligible concentration of impurity I−3 .
For theoretical analysis, we utilize a well-known electrolyte diffusion model and modify it such
that it can be justifiably used for obtaining a theoretical upper-limit estimation for the diffusion
4
Page 4 of 31
ACS Paragon Plus Environment
The Journal of Physical Chemistry
123456789101112131415161718192021222324252627282930313233343536373839404142434445464748495051525354555657585960
limiting current density in conditions that correspond closely to the ones present in the ionic liquid
- carbon nanocomposite DSC according to the EETS hypothesis. Our results indicate that, although
the above mentioned mechanisms can noticeably increase the limiting current density, there still
remains an unexplained gap between the low limiting current density predicted by the modified
theory and the experimentally observed high short circuit current density in this type of DSC.
This unexpected result means that some fundamental aspects related to the operating principle of
this type of composite electrolyte in a dye solar cell are not known yet, and an anomalous charge
transport mechanism or triiodide source must be assumed in order to account for the exceptionally
efficient charge transport.
Theory
Our main tool in this paper is the application of a mathematical diffusion model of Papageorgiou
et al.,16 which we modified to be able to provide an upper-limit estimation to jlim based upon
the presumptions of the EETS-model, namely 1) reduced electrode separation, and 2) crucial role
of photogenerated I−3 in current transport in the electrolyte. The modifications we made to the
original model are based on the following simplifying assumptions: A) We hypothesize that the
carbon paste functions similar to a porous counter electrode, in which case jlim is not reached
until all the carbon pores between the photoelectrode and the counterelectrode glass substrate are
completely depleted of triiodide.17 Moreover, we consider the possibility that I−3 could accumu-
late from the electrolyte edge regions outside the photoactive area, into the photoactive area, as
suggested by numerical simulations.18 B) Tortuosity and constrictivity of the porous layers are
neglected, and thus the porous structure has no effect on the diffusion coefficients of the redox
species. C) Light-absorption profile in the photoelectrode is assumed uniform. We state here that
the above assumptions work as to overestimate jlim as compared to reality, meaning that our esti-
mates are valid as upper limits for the true jlim. We clarify this statement and grounds for the above
assumptions below in this theory section and further in context with the results.
5
Page 5 of 31
ACS Paragon Plus Environment
The Journal of Physical Chemistry
123456789101112131415161718192021222324252627282930313233343536373839404142434445464748495051525354555657585960
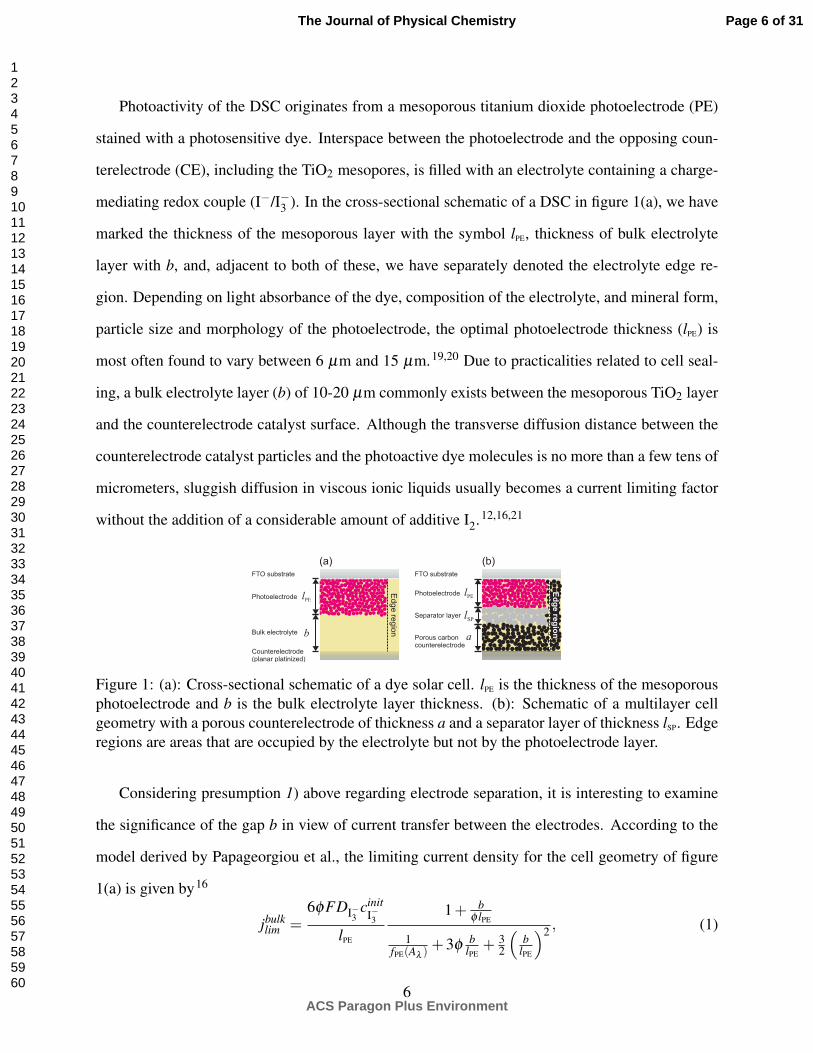
Photoactivity of the DSC originates from a mesoporous titanium dioxide photoelectrode (PE)
stained with a photosensitive dye. Interspace between the photoelectrode and the opposing coun-
terelectrode (CE), including the TiO2 mesopores, is filled with an electrolyte containing a charge-
mediating redox couple (I−/I−3 ). In the cross-sectional schematic of a DSC in figure 1(a), we have
marked the thickness of the mesoporous layer with the symbol lPE, thickness of bulk electrolyte
layer with b, and, adjacent to both of these, we have separately denoted the electrolyte edge re-
gion. Depending on light absorbance of the dye, composition of the electrolyte, and mineral form,
particle size and morphology of the photoelectrode, the optimal photoelectrode thickness (lPE) is
most often found to vary between 6 µm and 15 µm.19,20 Due to practicalities related to cell seal-
ing, a bulk electrolyte layer (b) of 10-20 µm commonly exists between the mesoporous TiO2 layer
and the counterelectrode catalyst surface. Although the transverse diffusion distance between the
counterelectrode catalyst particles and the photoactive dye molecules is no more than a few tens of
micrometers, sluggish diffusion in viscous ionic liquids usually becomes a current limiting factor
without the addition of a considerable amount of additive I2.12,16,21
Photoelectrode
FTO substrate
Counterelectrode(planar platinized)
Bulk electrolyte
Ed
ge
reg
ion
b
lPE
Photoelectrode
FTO substrate
Separator layer
Porous carboncounterelectrode
lPE
lSP
a
Ed
ge
reg
ion
(a) (b)
Figure 1: (a): Cross-sectional schematic of a dye solar cell. lPE is the thickness of the mesoporousphotoelectrode and b is the bulk electrolyte layer thickness. (b): Schematic of a multilayer cellgeometry with a porous counterelectrode of thickness a and a separator layer of thickness lSP. Edgeregions are areas that are occupied by the electrolyte but not by the photoelectrode layer.
Considering presumption 1) above regarding electrode separation, it is interesting to examine
the significance of the gap b in view of current transfer between the electrodes. According to the
model derived by Papageorgiou et al., the limiting current density for the cell geometry of figure
1(a) is given by16
jbulklim =
6ϕFDI−3cinit
I−3lPE
1+ bϕ lPE
1fPE(Aλ )
+3ϕ blPE
+ 32
(b
lPE
)2 , (1)
6
Page 6 of 31
ACS Paragon Plus Environment
The Journal of Physical Chemistry
123456789101112131415161718192021222324252627282930313233343536373839404142434445464748495051525354555657585960
where ϕPE is the porosity of the mesoporous TiO2 photoelectrode, F is the Faraday constant, DI−3
is the diffusion constant of triiodide, cinitI−3
is the initial open circuit triiodide concentration in the
electrolyte, Aλ is the absorbance of the dyed photoelectrode including electrolyte in the pores, and
fPE(Aλ ) is an absorbance dependent factor that takes into account that photon absorption in the
photoelectrode follows the Beer-Lambert law. It is to be noted here that the significance of the
factor fPE(Aλ ) is related to the simplifying assumption C) regarding the photoelectrode light ab-
sorption profile. In the case of nonuniform absorption (Aλ > 0, fPE(Aλ )< 1), light intensity decays
as a function of absorption distance, which means that, on average, dye injection and regenera-
tion take place farther from the counterelectrode than in the case of uniform absorption (Aλ = 0,
fPE(Aλ ) = 1) thus increasing the average diffusion distance of the I−3 ions. Increased average diffu-
sion distance lowers jlim, which in equation (1) is accounted for with a value of the factor fPE(Aλ )
less than unity.16 Here we use fPE(Aλ ) = 1 since our interest is to estimate the theoretical upper
limit for the limiting current density.
The next step in our analysis is to link the expression for jlim in eq. (1) to a cell geometry
more suitable for a DSC with the ionic liquid-carbon nanocomposite electrolyte. Here we utilize a
geometry presented in fig. 1(b), based on three adjacent porous layers; a photoactive mesoporous
TiO2 electrode of thickness lPE, a non-sensitized separator layer of thickness lSP, and a porous
counterelectrode of thickness a, depicting the carbon nanoparticles contained in the electrolyte
formulation.17 There are varied opinions in the literature as to where the interface between the
cathodic structure, i.e. carbon nanoparticles bound by the ionic liquid, and the pure ionic liquid
electrolyte medium in the pores of the photoelectrode film actually resides, and correspondingly
whether the cathodic charge transfer occurs outside or inside the porous photoactive TiO2 struc-
ture. On one hand, the mesopores have been considered too narrow for the carbon nanoparticles
to enter,14 in which case charge transfer would optimally take place at the outer surface of the
TiO2 layer. Thereagain, experimental results have been published according to which ionic liquid-
covered carbon nanoparticles penetrate deep into the TiO2 mesopores and thus the cathodic charge
transfer and dye regeneration would occur in very close proximity to each other.22 Our theoretical
7
Page 7 of 31
ACS Paragon Plus Environment
The Journal of Physical Chemistry
123456789101112131415161718192021222324252627282930313233343536373839404142434445464748495051525354555657585960
analysis in this paper is based on our own SEM images, presented in the results part, according to
which TiO2 pores remain mainly free of carbon nanoparticles and only the ionic liquid penetrates
through into the mesoporous TiO2 structure.
The expression for the limiting current density in the standard DSC structure (eq. 1 and fig.
1(a)) can be modified to yield an upper limit estimate for the limiting current density in the compos-
ite electrolyte DSC in fig. 1(b). Making simplifying assumptions A)-C), and defining cPE, SP
I−3(@ jlim)
as the average I−3 concentration in the redox-active volume of the electrolyte at the limiting current
conditions, that is, the PE and the separator layer pores in this case (I−3 is depleted from CE pores
at jlim), we can rewrite equation (1) for the fig. 1(b) porous multilayer case as
j SPlim =
6ϕPEFDI−3cPE, SP
I−3(@ jlim)
lPE
1+ ϕSPϕPE
lSPlPE
1+3ϕPEϕSP
lSPlPE
+ 32
(lSPlPE
)2 , (2)
where ϕSP and lSP are the porosity and the thickness of the separator layer respectively. Differ-
ences in eq. (2) with respect to eq. (1) become apparent if we consider that we have substituted
fPE(Aλ ) = 1, and that the bulk electrolyte layer of thickness b and porosity of 1 has been replaced
with a separator layer of thickness lSP and porosity of ϕSP. In practice, this means firstly that light
absorption in the PE is assumed uniform, and secondly, that the CE pores have been entirely de-
pleted of I−3 , and the charge transfer current on the whole cathode structure is concentrated in the
immediate vicinity of its interface with the separator layer. The last mentioned consideration is
motivated by theoretical analysis of porous counterelectrodes, which has shown that the porous
cathode cavities function as a sort of I−3 reservoir, providing I−3 to regions of reduced concentra-
tion i.e. the photoelectrode and separator layers in this case.17 Note that in the case of a planar
CE, limiting current density is reached when I−3 concentration at the planar electrode surface ap-
proaches zero. In the porous CE case, however, zero concentration on the entire cathode surface,
corresponding to a fully developed diffusion limitation, requires the depletion of I−3 from the whole
porous structure. Therefore, as stated in the simplifying assumption A) above, our estimations for
jlim are based on the presumption that, at the limiting current conditions, the entire supply of I−3
8
Page 8 of 31
ACS Paragon Plus Environment
The Journal of Physical Chemistry
123456789101112131415161718192021222324252627282930313233343536373839404142434445464748495051525354555657585960
has diffused out of the carbon mesopores, and thus provides an additional contribution to the con-
centration of I−3 in the other parts of the cell, in this case, the pores of the separator layer and the
mesoporous TiO2 photoelectrode.
To calculate an upper-limit estimation for jlim on the basis of eq. (2), we need a credible esti-
mate for the average I−3 concentration in the redox-active volume. Our estimation for this quantity
is based on the following arguments: I) Since the ionic liquid-carbon nanocomposite electrolyte
functions without additive triiodide, we must assume that the total concentration of I−3 originates
from either photogenerated or impurity triiodide, or both. II) As stated in simplifying assumption
A), we assume that all I−3 originally present throughout the electrolyte volume, including the edge
regions, is accumulated in the PE and separator layers at the limiting current conditions. III) As-
suming fast regeneration of oxidized dye molecules (i.e. negligible concentration of oxidized dye
at steady state), all photoinjected electrons can be expected to originate from I− anions oxidized to
one I−3 molecule per each pair of injected electrons through reactions
γ +Dinjection−−−−→ D++ e−(CB) (3)
3I−+2D+ regeneration−−−−−−→ I−3 +2D, (4)
where D+ and D are oxidized and neutral dye molecules respectively, γ is an absorbed photon, and
e−(CB) are electrons injected into the conduction band (CB) of TiO2. The exact concentrations
of I−3 and I− thus depend on the illumination-induced total charge temporarily accumulated as
electrons in both trap and conduction band states of the mesoporous PE and the separator layer (in
addition to the photoactive layer, electrons diffuse also in the separator layer since we assume here
that it is made of semiconducting TiO2 particles).
With arguments I) - III), the average I−3 concentration at the limiting current conditions can be
9
Page 9 of 31
ACS Paragon Plus Environment
The Journal of Physical Chemistry
123456789101112131415161718192021222324252627282930313233343536373839404142434445464748495051525354555657585960
written as (valid for both cell geometries in fig. 1)
cPE, SP
I−3(@ jlim) = cphg
I−3(@ jlim)+ cimp
I−3(@ jlim) (5)
=
(nTiO2
light −nTiO2dark
)[(1−ϕPE)lPE +(1−ϕSP)lSP]
2NA [ϕPElPE +ϕSPlSP +b]
+cinit
I−3
[ϕPElPE +ϕSPlSP +b+ϕaa+ϕedgeVedge
][ϕPElPE +ϕSPlSP +b]
, (6)
where nTiO2light and nTiO2
dark are PE electron densities under illumination and in the dark respectively,
lSP and ϕSP are respectively the thickness and the porosity of the separator layer, Vedge and ϕedge
are respectively the volume and porosity of edge regions occupied by electrolyte, cphgI−3
(@ jlim) and
cimpI−3
(@ jlim) are respectively the average photogenerated I−3 and the impurity I−3 concentrations in
the redox-active volume at limiting current conditions, and cinitI−3
is the initial open circuit (impurity)
I−3 concentration in the dark. Here we have assumed for simplicity that the volume of the dye
monolayer is negligible. We have also associated the carbon nanocomposite layer with a porosity
following from the quasi-solidification of the electrolyte, given by
ϕa =
msolρsol
mdispρdisp
+ msolρsol
=
(mdisp
msol
ρsol
ρdisp+1
)−1
, (7)
where msol and ρsol are the mass and the density of the solvent respectively, and mdisp and ρdisp are
the mass and the density of the dispersed carbon nanoparticles respectively.
To quantify the significance of impurity I−3 contained in pure PMII we require an estimation for
the term cinitI−3
in eq. (6). For experimental evaluation of cinitI−3
we consider here a cell consisting of two
symmetric, parallel planar electrodes and pure PMII as electrolyte. As there is no photoelectrode
in this kind of cell, it is clear that there will be no photogeneration of electrons either. Moreover, in
eq. (6), all dimensional terms except b will equal to zero. We can thus see that in eq. (6), regardless
of the cell voltage, current density or the cell dimensions, the total I−3 concentration will equal to
the initial concentration cinitI−3
. For a planar symmetric cell, relationship between jlim and DI−3can
10
Page 10 of 31
ACS Paragon Plus Environment
The Journal of Physical Chemistry
123456789101112131415161718192021222324252627282930313233343536373839404142434445464748495051525354555657585960
be written as23
DI−3=
δdiff
4zFcI−3
jlim, (8)
where z is the valence number and δdiff is the diffusion layer thickness equaling half the electrode
separation. On the other hand, DI−3can be expressed with respect to the characteristic frequency of
diffusion in a finite layer (ωdiff ) as23
DI−3= ωdiff δ 2
diff . (9)
Combining equations (8) and (9) allows us to express the (impurity) I−3 concentration in a symmet-
ric planar cell as
cinitI−3
=jlim
4zFωdiff δdiff, (10)
where z = 2 in this case. An experimental estimate of cinitI−3
can be obtained by determining jlim by
cyclic voltammetry and ωdiff by electrochemical impedance spectroscopy.
Experimental
Cell materials and assembly
The substrate material was fluorine-doped tin oxide (FTO) coated glass (Pilkington TEC-15, 15
Ω/sq, Hartford Glass Company, Inc.). Two electrolyte filling holes 1 mm in diameter were drilled
in TEC-15 substrates to be used as counterelectrodes in liquid electrolyte DSCs. After rinsing with
washing detergent, the substrates were ultrasonicated in ethanol and then in acetone, three minutes
in both. The conducting side of the photoelectrode side substrates was then coated with a ∼35 nm
overlayer of TiO2 through atomic layer deposition (ALD) to ensure electrical isolation of FTO
from the conducting ionic liquid-carbon nanoparticle electrolyte paste.
Photoactive mesoporous TiO2 layers were prepared by screen-printing a TiO2 paste (Dyesol
18NR-T) on the center of the ALD-deposited area of the substrates in a rectangular pattern 0.4 cm2
11
Page 11 of 31
ACS Paragon Plus Environment
The Journal of Physical Chemistry
123456789101112131415161718192021222324252627282930313233343536373839404142434445464748495051525354555657585960
in area. Two layers ∼ 4µm thick each were deposited in each printing cycle, followed by a ten
minute drying period on a hotplate at 110 C. The photoactive layers were coated with a ∼ 4µm
thick light-scattering overlayer of porous anatase TiO2 with a particle diameter greater than 100 nm
(Solaronix Ti-Nanoxide R/SP) by screen-printing. The printed substrates were sintered for thirty
minutes at 450C.
The sintered photoelectrodes were placed overnight in a dye bath of 0.32 mM cis-bis(iso-
thiocyanato)bis(2,2’-bipyridyl-4,4’-dicarboxylato)ruthenium(II) bistetrabutylammonium (Dyesol
N719, used as received) in AA-grade ethanol (min. 99.5 wt. %). After dyeing, the photoelec-
trodes were rinsed with A14 grade ethanol (91.2 wt. %) and placed in storage embedded in A14
ethanol.
Platinized counterelectrodes (PtCE) were prepared by thermal platinization of the conducting
side of a TEC-15 substrate with a 10 mM solution of platinum tetrachloride (PtCl4, 99.99 %,
Aldrich) in 2-propanol (99.99 %, Sigma-Aldrich) at 385 C for 15 minutes.
Organic liquid electrolyte (denoted OLE in the text) composed of 0.05 M iodine (99 %, Merck),
0.5 M N-methylbenzimidazole (99 %, Sigma-Aldrich), 0.5 M 1-propyl-3-methylimidazolium io-
dide (PMII, >99 %, Iolitec) and 0.1 M Guanidinium thiocyanate (>99 %, Merck) in 3-methoxy-
propionitrile (MPN, >99 %, Alfa-Aesar) was mixed in a measuring bottle in room air and left
enclosed for stirring overnight. Dry ionic liquid electrolyte (denoted ILE (dry) in the text) was
prepared such that the ionic liquid (PMII, >98 %, Iolitec) was first dried in a vacuum oven at
100 C under reduced pressure overnight and moved into a glovebox with a humidity level of less
than 10 ppm, after which 0.26 M iodine, 0.5 M N-methylbenzimidazole and 0.1 M Guanidinium
thiocyanate were mixed into the dried PMII and the composition was stirred overnight. Electrolyte
denoted simply ILE was prepared with similar components in room air and thus contains some
water absorbed from ambient air.
Ionic liquid-carbon nanocomposite electrolyte (denoted PMII/PACB) was prepared such that
0.5 grams of 20 wt. % polyaniline on carbon black (PACB, Sigma-Aldrich) was dispersed into 4.0
grams of PMII by grinding in an agate mortar for ∼30 minutes in room air to form a black clay-like
12
Page 12 of 31
ACS Paragon Plus Environment
The Journal of Physical Chemistry
123456789101112131415161718192021222324252627282930313233343536373839404142434445464748495051525354555657585960
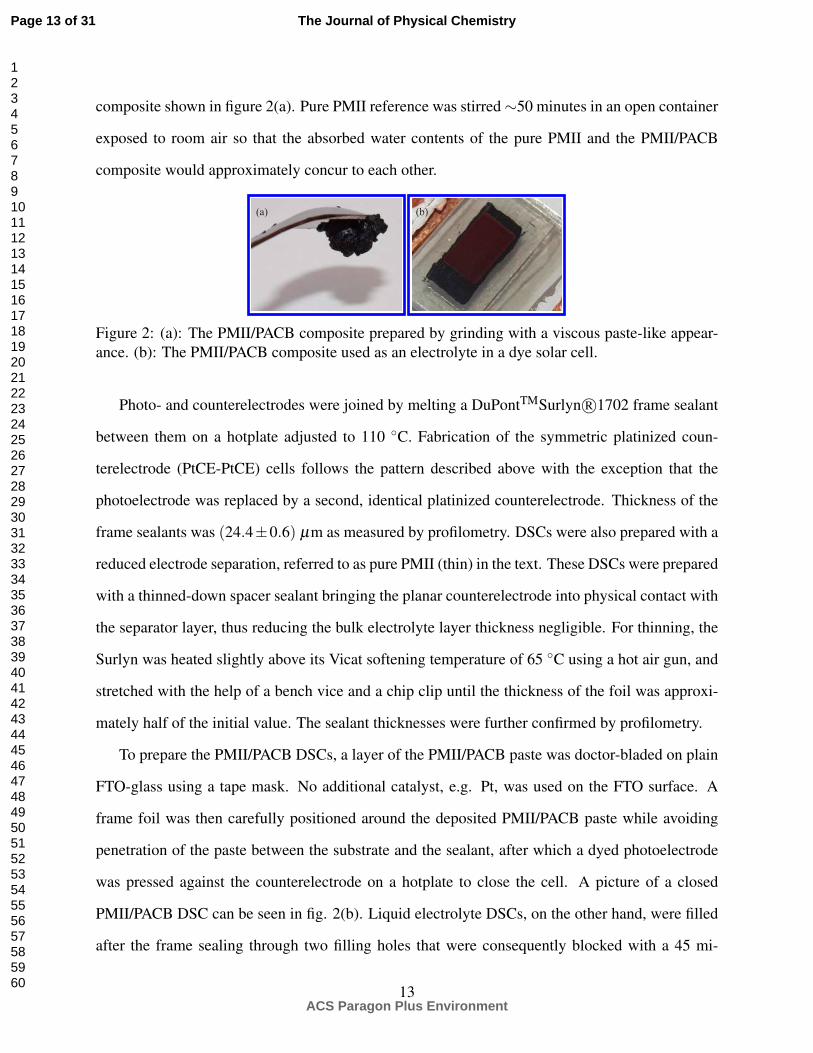
composite shown in figure 2(a). Pure PMII reference was stirred ∼50 minutes in an open container
exposed to room air so that the absorbed water contents of the pure PMII and the PMII/PACB
composite would approximately concur to each other.
(a) (b)
Figure 2: (a): The PMII/PACB composite prepared by grinding with a viscous paste-like appear-ance. (b): The PMII/PACB composite used as an electrolyte in a dye solar cell.
Photo- and counterelectrodes were joined by melting a DuPontTMSurlyn R⃝1702 frame sealant
between them on a hotplate adjusted to 110 C. Fabrication of the symmetric platinized coun-
terelectrode (PtCE-PtCE) cells follows the pattern described above with the exception that the
photoelectrode was replaced by a second, identical platinized counterelectrode. Thickness of the
frame sealants was (24.4±0.6) µm as measured by profilometry. DSCs were also prepared with a
reduced electrode separation, referred to as pure PMII (thin) in the text. These DSCs were prepared
with a thinned-down spacer sealant bringing the planar counterelectrode into physical contact with
the separator layer, thus reducing the bulk electrolyte layer thickness negligible. For thinning, the
Surlyn was heated slightly above its Vicat softening temperature of 65 C using a hot air gun, and
stretched with the help of a bench vice and a chip clip until the thickness of the foil was approxi-
mately half of the initial value. The sealant thicknesses were further confirmed by profilometry.
To prepare the PMII/PACB DSCs, a layer of the PMII/PACB paste was doctor-bladed on plain
FTO-glass using a tape mask. No additional catalyst, e.g. Pt, was used on the FTO surface. A
frame foil was then carefully positioned around the deposited PMII/PACB paste while avoiding
penetration of the paste between the substrate and the sealant, after which a dyed photoelectrode
was pressed against the counterelectrode on a hotplate to close the cell. A picture of a closed
PMII/PACB DSC can be seen in fig. 2(b). Liquid electrolyte DSCs, on the other hand, were filled
after the frame sealing through two filling holes that were consequently blocked with a 45 mi-
13
Page 13 of 31
ACS Paragon Plus Environment
The Journal of Physical Chemistry
123456789101112131415161718192021222324252627282930313233343536373839404142434445464748495051525354555657585960
crometers thick Surlyn R⃝1601 cover sealant melted between the backside of the counterelectrode
substrate and a microscope cover glass.
Electrical contacts were prepared with copper tape and conducting silver paint. Epoxy was
applied on top of the paint to protect the silver layer and to provide mechanical integrity. An
opaque black tape mask with an opening of 0.7 cm2 in area was glued on the photoelectrode side
substrate to minimize the effect of stray light during a jV -measurement.
SEM samples were prepared by opening the cells and cutting the photoelectrode substrate with
a glass cutter.
Measurements and equipment
jV -curves were measured with a non-commercial solar simulator utilizing ten 150 W halogen
lamps. The measured current densities were corrected for a spectral mismatch factor of 0.94. Irra-
diation power was adjusted to 1000 W/m2 with the help of a silicon calibration cell to correspond
to AM 1.5G conditions. The jV -behavior of an illuminated DSC was measured with a Keithley
2420 3A SourceMeter.
Electrochemical impedance spectroscopy (EIS) response of the symmetric PtCE-PtCE cells
was measured with a Zahner IM6 Impedance Measurement Unit with an R-MUX multiplexer card.
The frequency range used was from 10 mHz to 100 kHz. Amplitude of voltage modulation was
10 mV, and bias voltage was fixed to 0 V. Zview 2 software by Scribner was used for equivalent
circuit fitting.
Screen printed thick-film thicknesses were measured using a Dektak 6M stylus profiler pro-
filometer by Veeco Instruments. Viscosity measurements were performed with a Physica MCR 301
rheometer (Anton Paar GmbH). Inbuilt temperature control system was used to determine the tem-
perature dependence of viscosity. All reported temperatures excluding the viscosity measurement
were measured with a type K thermocouple attached to a Testo 925 thermocouple thermometer.
Scanning electron microscopic (SEM) images were taken with a Zeiss Sigma VP. Acceleration
voltage was 10 kV in the case of figures 4(a), 4(b) and 4(d), and 1 kV in the case of fig. 4(c).
14
Page 14 of 31
ACS Paragon Plus Environment
The Journal of Physical Chemistry
123456789101112131415161718192021222324252627282930313233343536373839404142434445464748495051525354555657585960
The reported experimental results are an average over a minimum of three samples. We have
used the standard error of the mean to estimate component errors, and the total differential for
estimating the maximum error of functions of several component variables.
Results and discussion
To obtain a good picture of the overall operation of the ionic liquid-carbon nanoparticle (PMII/PACB)
electrolyte DSC, we first compare it with chosen reference cases, namely pure PMII and standard
MPN based electrolytes, in terms of current-voltage characteristics and especially the temperature
behavior of jsc. The experimental jsc values are then compared with modeled upper-limit estimates
for jlim revealing the main result of the paper.
Photovoltaic performance and its temperature dependence
The ionic liquid-carbon nanocomposite electrolyte (PMII/PACB) greatly outperformed reference
pure PMII electrolyte in its current carrying ability at room temperature, which can be seen in table
1 listing the photovoltaic parameters of our cells. Here we note that in our case the performance
difference between the PMII/PACB electrolyte and pure PMII was strongly temperature dependent,
in particular when it comes to jsc. This can be seen in fig. 3(a) illustrating the evolution of the
current-voltage behavior of pure PMII DSCs during several consecutive back and forth voltage
sweeps under the heat irradiance of the solar simulator lamps (without cooling). In addition to
the factor of six increase in the short circuit current density, the open circuit voltage dropped by
∼50 mV when the photoelectrode substrate outer surface temperature (TS) increased from ∼30 C
to ∼50 C. The current density increase can be linked to exponentially declining viscosity of pure
PMII as a function of temperature as shown in figure 3(b), and a consequent enhancement in the
limiting current density. As seen in fig. 3(b), the viscosity of pure PMII is decreased by a factor of
∼5 with temperature climbing from 25 C to 50 C, in fair agreement with the observed increase
in the short circuit current density.
15
Page 15 of 31
ACS Paragon Plus Environment
The Journal of Physical Chemistry
123456789101112131415161718192021222324252627282930313233343536373839404142434445464748495051525354555657585960
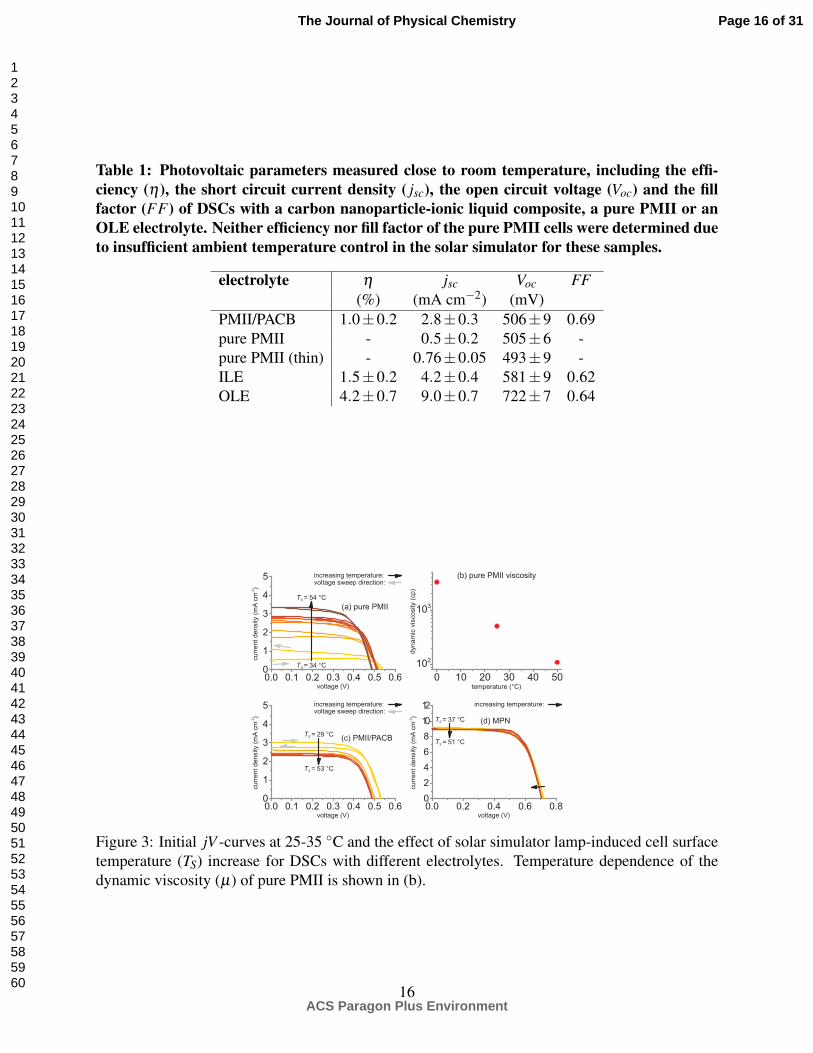
Table 1: Photovoltaic parameters measured close to room temperature, including the effi-ciency (η), the short circuit current density ( jsc), the open circuit voltage (Voc) and the fillfactor (FF) of DSCs with a carbon nanoparticle-ionic liquid composite, a pure PMII or anOLE electrolyte. Neither efficiency nor fill factor of the pure PMII cells were determined dueto insufficient ambient temperature control in the solar simulator for these samples.
electrolyte η jsc Voc FF(%) (mA cm−2) (mV)
PMII/PACB 1.0±0.2 2.8±0.3 506±9 0.69pure PMII - 0.5±0.2 505±6 -pure PMII (thin) - 0.76±0.05 493±9 -ILE 1.5±0.2 4.2±0.4 581±9 0.62OLE 4.2±0.7 9.0±0.7 722±7 0.64
curr
ent density (
mA
cm
)-2
T =S
34 °C
T =S
54 °C
increasing temperature:voltage sweep direction:
temperature (°C)
dynam
ic v
iscosity (
cp)
voltage (V)
curr
ent density (
mA
cm
)-2
T =S
29 °C
T =S
53 °C
increasing temperature:voltage sweep direction:
(c) PMII/PACB
(a) pure PMII
(b) pure PMII viscosity
increasing temperature:
T =S
37 °C
T =S
51 °C
(d) MPN
curr
ent density (
mA
cm
)-2
voltage (V)
voltage (V)
Figure 3: Initial jV -curves at 25-35 C and the effect of solar simulator lamp-induced cell surfacetemperature (TS) increase for DSCs with different electrolytes. Temperature dependence of thedynamic viscosity (µ) of pure PMII is shown in (b).
16
Page 16 of 31
ACS Paragon Plus Environment
The Journal of Physical Chemistry
123456789101112131415161718192021222324252627282930313233343536373839404142434445464748495051525354555657585960
On the other hand, the temperature behavior of PMII/PACB, as seen in fig. 3(c), differed no-
tably from that of pure PMII. As the cells heated up, instead of increasing such as in the pure PMII
case, jsc of the PMII/PACB cells decreased to about 80 % of the starting value. Simultaneously, Voc
dropped ∼50 mV similar to what was observed with pure PMII. Based on an expected Arrhenius-
type exponential temperature dependence of the recombination rate constant we assume here that
the decline in both jsc and Voc with increasing temperature derives from magnified recombination
losses with a possible contribution from a downward shift of the TiO2 conduction band energy.
A similar phenomenon was also visible in the reference MPN cells (fig. 3(d)), although in much
smaller scale due to considerably lower recombination current density to begin with. Finally, we
note that at ca. 54 C, jsc was higher with pure PMII than with PMII/PACB. Without a possibility
for a detailed analysis, here we tentatively assign the lower jsc in the PMII/PACB cells to recombi-
nation losses due to direct contact of the semiconducting spacer layer with the PACB particles that
can catalyze the I−3 reduction reaction.
The above results give support to earlier publications14,22,24,25 in the sense that considerably
higher photocurrents were obtained with an electrolyte where an ionic liquid (here PMII) was
quasi-solidified with carbon nanoparticles ( jsc ≈ 3 mA/cm2), rather than merely using pure PMII
as electrolyte ( jsc ≈ 0.5 mA/cm2), close to room temperature (∼30C). Minimizing the bulk elec-
trolyte layer in the pure PMII (thin) case narrowed the difference only slightly ( jsc ≈ 0.76 mA/cm2).
These results strongly suggest that quasi-solidification of pure PMII with carbon nanoparticles, al-
beit raising an issue of significant current loss through recombination, expedites charge transfer
to such a degree that diffusion limitation observed with pure PMII is removed without the need
for additive iodine. Moreover, minimizing the bulk electrolyte layer thickness improved the pho-
tocurrent only slightly in the pure PMII case, which indicates that the two main hypothesis for
the PMII/PACB electrolyte operation, namely photogeneration of I−3 and shortened diffusion layer
thickness, are not sufficient to explain the high jsc of the PMII/PACB DSCs.
In this work, efficiencies were considerably lower than in the earlier publications where cor-
responding electrolyte compositions of ionic liquid and carbon nanoparticles were used, and ef-
17
Page 17 of 31
ACS Paragon Plus Environment
The Journal of Physical Chemistry
123456789101112131415161718192021222324252627282930313233343536373839404142434445464748495051525354555657585960
ficiencies up to 6.37 % have been reported.11,13–15,22,24–27 This is most likely due to the lack
of TiCl4 treatment on the sintered photoelectrodes and/or thinner ∼ 8 µm photoelectrodes in the
present case. However, as will be discussed below, our experimental jsc values are sufficiently high
compared to the theoretical upper limit for jlim in order to confirm the incapability of previously
presented rationalizations (photogeneration of I−3 and shortened diffusion layer thickness) or newly
suggested in this paper (impurity I−3 ) in explaining the operation of the PMII/PACB DSC. Consid-
ering that our jsc values were comparably low, the above conclusion should also be valid regarding
the results of the earlier publications where higher values of jsc were obtained and the discrepancy
between the modified model used here and experimental results is even greater. In the following,
we seek further understanding on this result by estimating the upper limit of jlim enhancement
deriving from various sources described in the theory section. First, however, we confirm through
SEM imaging that the actual layer structure of the PMII/PACB DSCs is in agreement with the
structure assumed in the theoretical modeling.
Supporting evidence for the modeled multilayer cell geometry from SEM
imaging
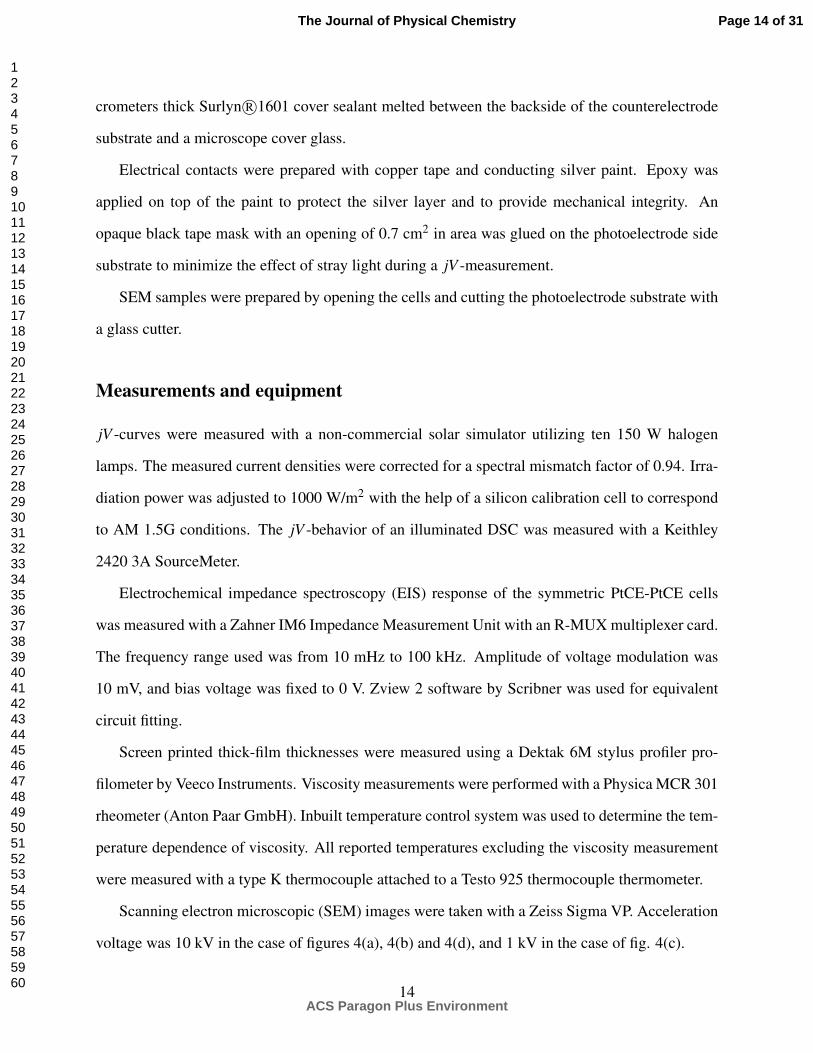
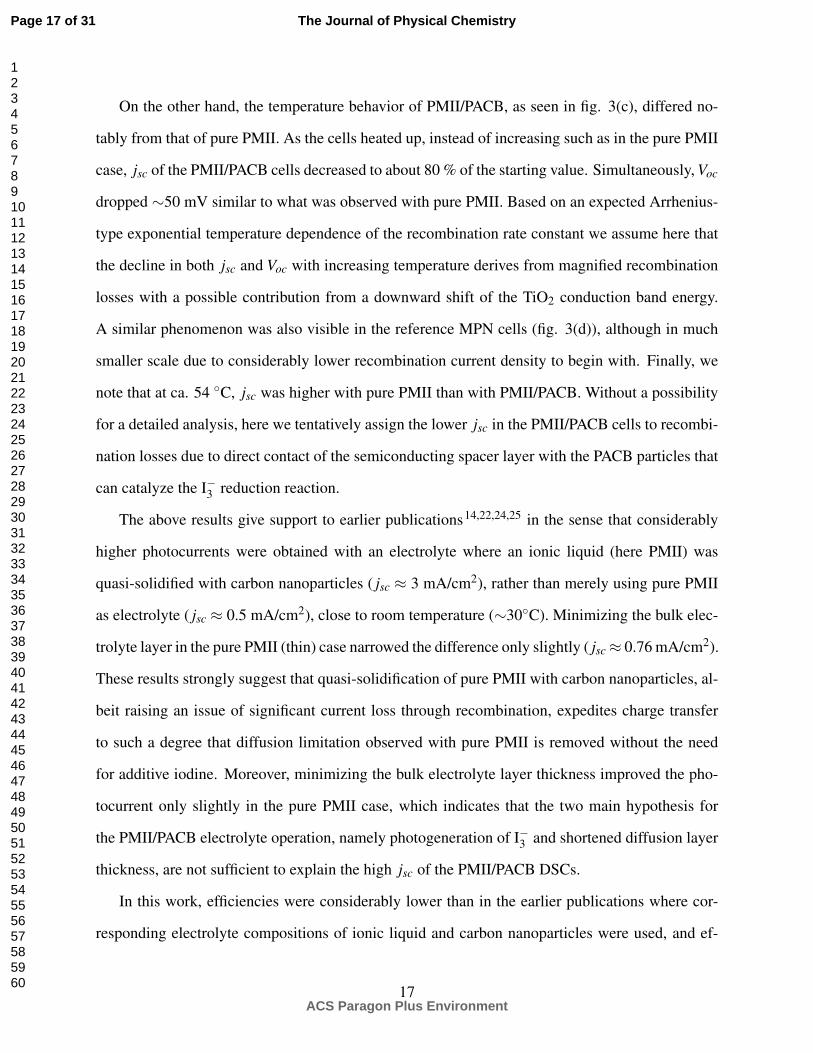
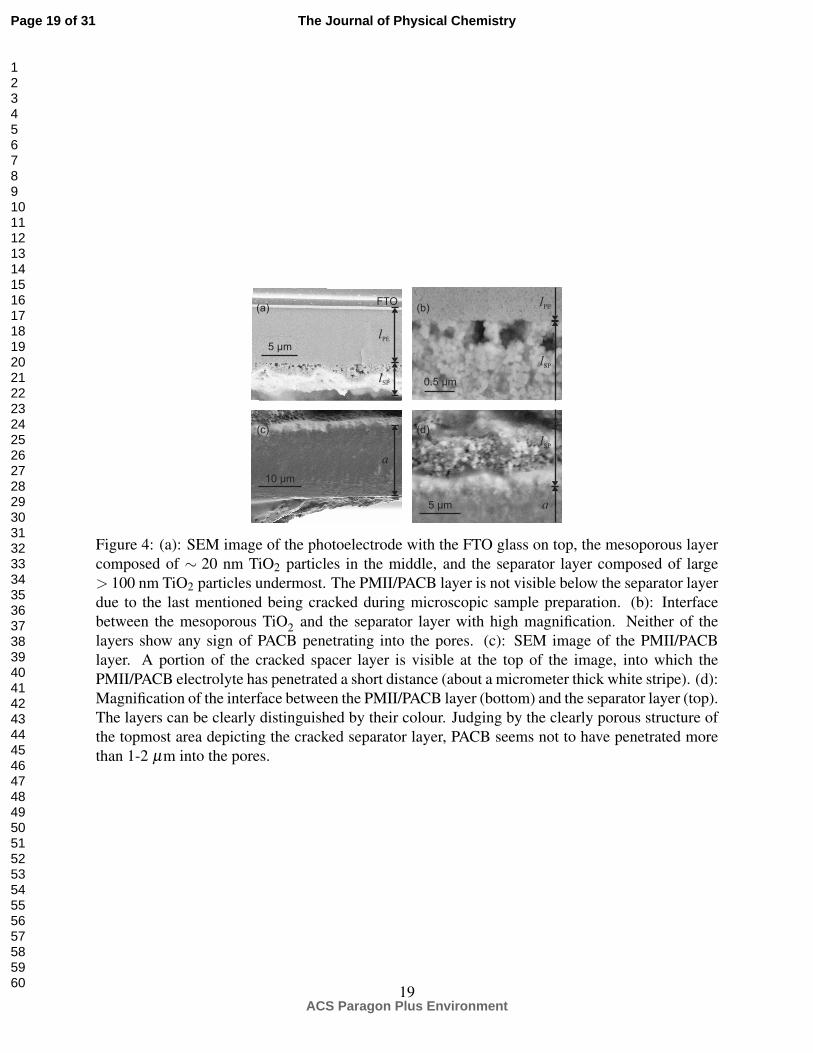
Scanning electron microscopic (SEM) images provided confirmation that the multilayer structure
depicted in fig. 1(b) is in good correspondence with the actual structure of the PMII/PACB cells.
In view of modeling considerations, it was important to rule out the possibility that the PACB par-
ticles penetrate into the separator layer, and possibly even further into the mesoporous photoelec-
trode layer. Should this mixing of the layers occur, the carbon material, functioning as a cathodic
structure in our model, would penetrate even closer to dye molecules, and eq. (2) expression would
no longer represent an upper limit for jlim. The acquired SEM images strongly suggest that PACB
particles do not penetrate farther than one or two micrometers into the separator layer, and that the
rest of the spacer layer and the mesoporous photoelectrode layer are PACB-free. Therefore we can
conclude that, from the diffusion modeling viewpoint, fig. 1(b) schematic is a valid depiction of
the PMII/PACB DSC.
18
Page 18 of 31
ACS Paragon Plus Environment
The Journal of Physical Chemistry
123456789101112131415161718192021222324252627282930313233343536373839404142434445464748495051525354555657585960
0.5 µm
lPE
lSP
5 µm
lSP
a
5 µml
PE
lSP
FTO
10 µm
a
(a) (b)
(c) (d)
Figure 4: (a): SEM image of the photoelectrode with the FTO glass on top, the mesoporous layercomposed of ∼ 20 nm TiO2 particles in the middle, and the separator layer composed of large> 100 nm TiO2 particles undermost. The PMII/PACB layer is not visible below the separator layerdue to the last mentioned being cracked during microscopic sample preparation. (b): Interfacebetween the mesoporous TiO2 and the separator layer with high magnification. Neither of thelayers show any sign of PACB penetrating into the pores. (c): SEM image of the PMII/PACBlayer. A portion of the cracked spacer layer is visible at the top of the image, into which thePMII/PACB electrolyte has penetrated a short distance (about a micrometer thick white stripe). (d):Magnification of the interface between the PMII/PACB layer (bottom) and the separator layer (top).The layers can be clearly distinguished by their colour. Judging by the clearly porous structure ofthe topmost area depicting the cracked separator layer, PACB seems not to have penetrated morethan 1-2 µm into the pores.
19
Page 19 of 31
ACS Paragon Plus Environment
The Journal of Physical Chemistry
123456789101112131415161718192021222324252627282930313233343536373839404142434445464748495051525354555657585960
Estimation of impurity I−3 and photogenerated I−3 concentrations at the limit-
ing current conditions
In the expression for the average redox-active volume I−3 concentration in eq. (6), impurities
and photogeneration were taken into account as possible sources of non-additive I−3 . Here we
firstly estimate the impurity I−3 concentration experimentally by using a combination of cyclic
voltammetry (CV) and electrochemical impedance spectroscopy (EIS) techniques as described in
the theory section. Secondly, assessing the amount of photogenerated I−3 on the basis of eq. (6)
requires knowledge about the photoelectrode electron density under operating conditions, which
we have approximated here based on the literature.
Open circuit I−3 concentration cinitI−3
of pure PMII was measured from symmetric PtCE-PtCE
cells at Vbias = 0 V by determining ωdiff using EIS and jlim through CV, and substituting both
quantities into eq. (10). Table 2 shows the above mentioned quantities for different electrolytes,
and in addition, diffusion coefficients calculated on the basis of eq. (9). Triiodide concentrations
of OLE and ILE (dry) electrolytes obtained with the above described method correspond well with
their respective additive iodine concentrations of 50 mM and 260 mM. Additive I2 being the only
significant source of I−3 in the OLE, the good correspondence between the added and the measured
I−3 concentrations shows that the method of eqs. (8)-(10) gives reasonably accurate estimates for
the free I−3 concentration. The method gives relatively low but significant free I−3 concentration of
(8± 2) mM for the pure PMII, which in the absence of additive iodine corresponds fully to the
impurity I−3 . It is noteworthy that this impurity concentration is only 3 % of the additive I−3 in the
ILE.
Photoelectrode electron density has been investigated earlier in the literature through time in-
tegration of photocurrent decay transients.28,29 In this method, a DSC is initially illuminated from
the photoelectrode side for 5 s with a red light emitting diode at open circuit. After a short voltage
decay period in the dark, the residual charge is extracted from the photoelectrode at short circuit
conditions. Varying the decay period a voltage-charge relationship is obtained.29 It has been found
that while the solvent type has a subtle effect on the electron density at a given photovoltage,28
20
Page 20 of 31
ACS Paragon Plus Environment
The Journal of Physical Chemistry
123456789101112131415161718192021222324252627282930313233343536373839404142434445464748495051525354555657585960
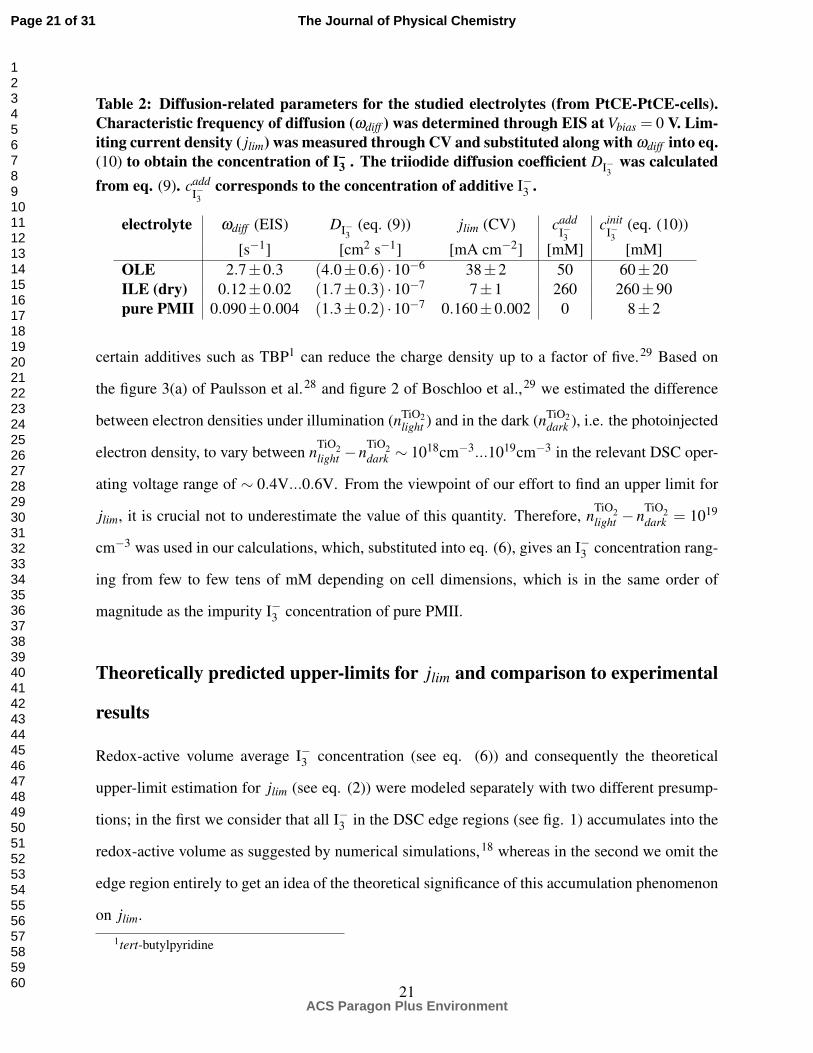
Table 2: Diffusion-related parameters for the studied electrolytes (from PtCE-PtCE-cells).Characteristic frequency of diffusion (ωdiff ) was determined through EIS at Vbias = 0 V. Lim-iting current density ( jlim) was measured through CV and substituted along with ωdiff into eq.(10) to obtain the concentration of I–
3 . The triiodide diffusion coefficient DI−3was calculated
from eq. (9). caddI−3
corresponds to the concentration of additive I−3 .
electrolyte ωdiff (EIS) DI−3(eq. (9)) jlim (CV) cadd
I−3cinit
I−3(eq. (10))
[s−1] [cm2 s−1] [mA cm−2] [mM] [mM]OLE 2.7±0.3 (4.0±0.6) ·10−6 38±2 50 60±20ILE (dry) 0.12±0.02 (1.7±0.3) ·10−7 7±1 260 260±90pure PMII 0.090±0.004 (1.3±0.2) ·10−7 0.160±0.002 0 8±2
certain additives such as TBP1 can reduce the charge density up to a factor of five.29 Based on
the figure 3(a) of Paulsson et al.28 and figure 2 of Boschloo et al.,29 we estimated the difference
between electron densities under illumination (nTiO2light ) and in the dark (nTiO2
dark ), i.e. the photoinjected
electron density, to vary between nTiO2light −nTiO2
dark ∼ 1018cm−3...1019cm−3 in the relevant DSC oper-
ating voltage range of ∼ 0.4V...0.6V. From the viewpoint of our effort to find an upper limit for
jlim, it is crucial not to underestimate the value of this quantity. Therefore, nTiO2light − nTiO2
dark = 1019
cm−3 was used in our calculations, which, substituted into eq. (6), gives an I−3 concentration rang-
ing from few to few tens of mM depending on cell dimensions, which is in the same order of
magnitude as the impurity I−3 concentration of pure PMII.
Theoretically predicted upper-limits for jlim and comparison to experimental
results
Redox-active volume average I−3 concentration (see eq. (6)) and consequently the theoretical
upper-limit estimation for jlim (see eq. (2)) were modeled separately with two different presump-
tions; in the first we consider that all I−3 in the DSC edge regions (see fig. 1) accumulates into the
redox-active volume as suggested by numerical simulations,18 whereas in the second we omit the
edge region entirely to get an idea of the theoretical significance of this accumulation phenomenon
on jlim.
1tert-butylpyridine
21
Page 21 of 31
ACS Paragon Plus Environment
The Journal of Physical Chemistry
123456789101112131415161718192021222324252627282930313233343536373839404142434445464748495051525354555657585960
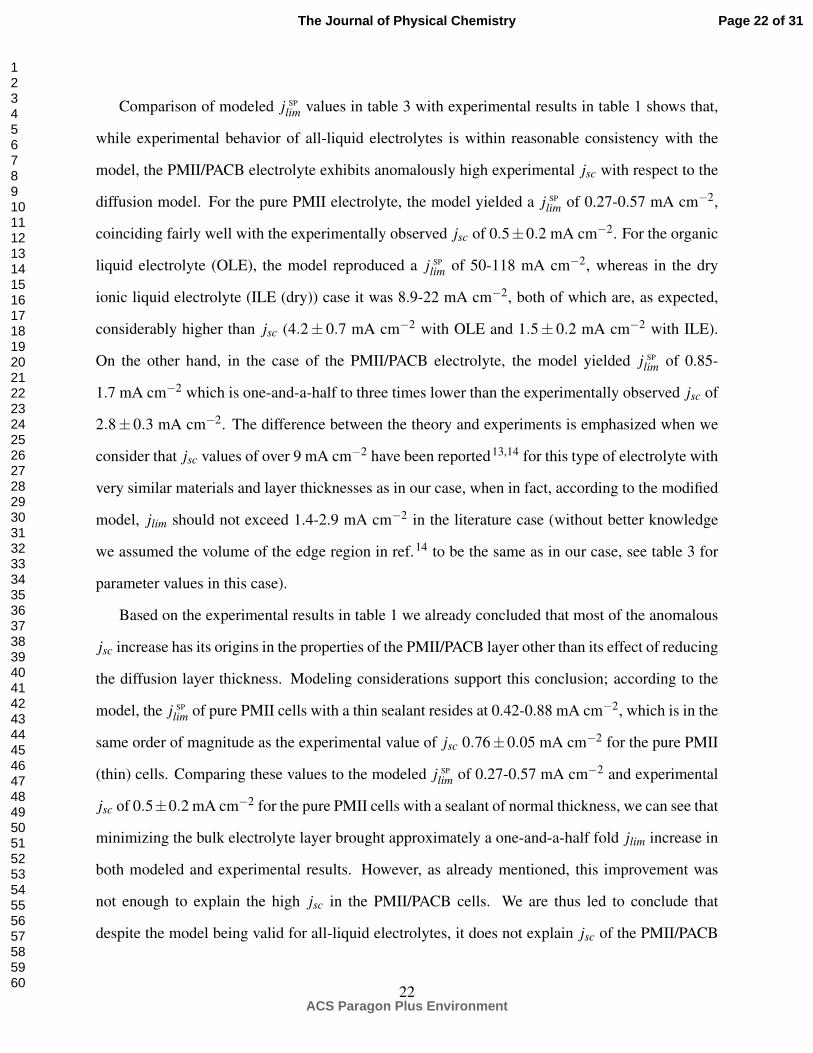
Comparison of modeled j SPlim values in table 3 with experimental results in table 1 shows that,
while experimental behavior of all-liquid electrolytes is within reasonable consistency with the
model, the PMII/PACB electrolyte exhibits anomalously high experimental jsc with respect to the
diffusion model. For the pure PMII electrolyte, the model yielded a j SPlim of 0.27-0.57 mA cm−2,
coinciding fairly well with the experimentally observed jsc of 0.5±0.2 mA cm−2. For the organic
liquid electrolyte (OLE), the model reproduced a j SPlim of 50-118 mA cm−2, whereas in the dry
ionic liquid electrolyte (ILE (dry)) case it was 8.9-22 mA cm−2, both of which are, as expected,
considerably higher than jsc (4.2± 0.7 mA cm−2 with OLE and 1.5± 0.2 mA cm−2 with ILE).
On the other hand, in the case of the PMII/PACB electrolyte, the model yielded j SPlim of 0.85-
1.7 mA cm−2 which is one-and-a-half to three times lower than the experimentally observed jsc of
2.8±0.3 mA cm−2. The difference between the theory and experiments is emphasized when we
consider that jsc values of over 9 mA cm−2 have been reported13,14 for this type of electrolyte with
very similar materials and layer thicknesses as in our case, when in fact, according to the modified
model, jlim should not exceed 1.4-2.9 mA cm−2 in the literature case (without better knowledge
we assumed the volume of the edge region in ref.14 to be the same as in our case, see table 3 for
parameter values in this case).
Based on the experimental results in table 1 we already concluded that most of the anomalous
jsc increase has its origins in the properties of the PMII/PACB layer other than its effect of reducing
the diffusion layer thickness. Modeling considerations support this conclusion; according to the
model, the j SPlim of pure PMII cells with a thin sealant resides at 0.42-0.88 mA cm−2, which is in the
same order of magnitude as the experimental value of jsc 0.76±0.05 mA cm−2 for the pure PMII
(thin) cells. Comparing these values to the modeled j SPlim of 0.27-0.57 mA cm−2 and experimental
jsc of 0.5±0.2 mA cm−2 for the pure PMII cells with a sealant of normal thickness, we can see that
minimizing the bulk electrolyte layer brought approximately a one-and-a-half fold jlim increase in
both modeled and experimental results. However, as already mentioned, this improvement was
not enough to explain the high jsc in the PMII/PACB cells. We are thus led to conclude that
despite the model being valid for all-liquid electrolytes, it does not explain jsc of the PMII/PACB
22
Page 22 of 31
ACS Paragon Plus Environment
The Journal of Physical Chemistry
123456789101112131415161718192021222324252627282930313233343536373839404142434445464748495051525354555657585960
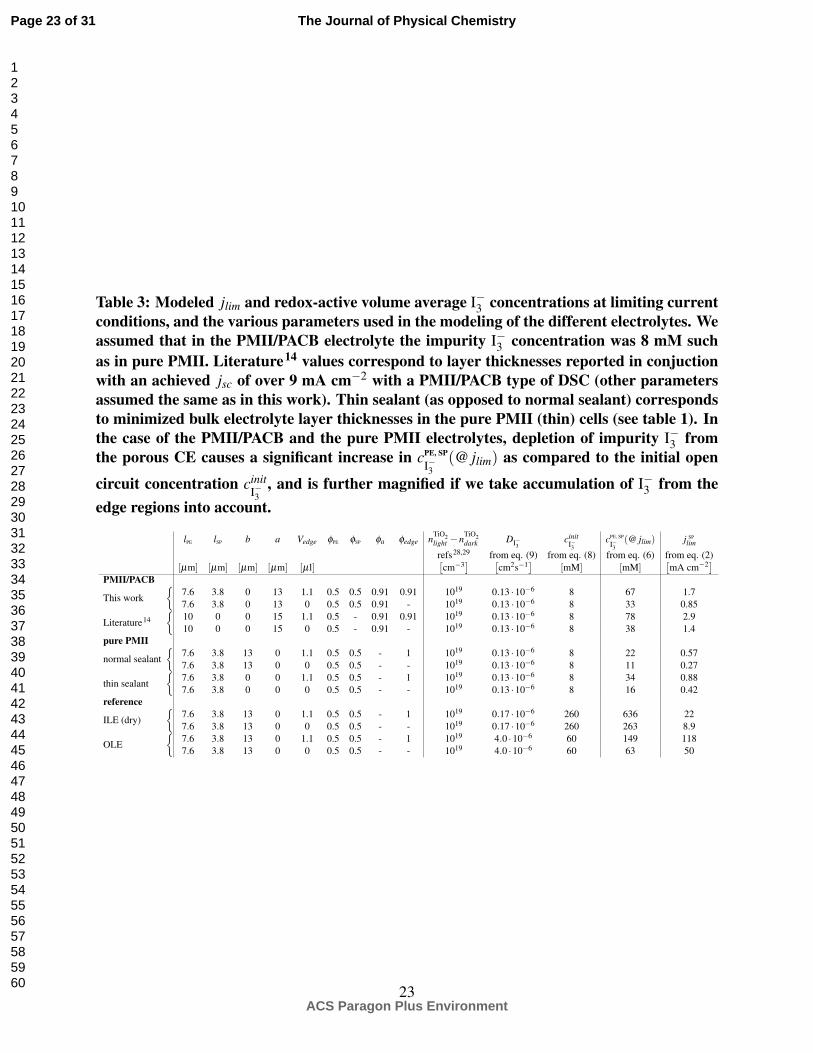
Table 3: Modeled jlim and redox-active volume average I−3 concentrations at limiting currentconditions, and the various parameters used in the modeling of the different electrolytes. Weassumed that in the PMII/PACB electrolyte the impurity I−3 concentration was 8 mM suchas in pure PMII. Literature14 values correspond to layer thicknesses reported in conjuctionwith an achieved jsc of over 9 mA cm−2 with a PMII/PACB type of DSC (other parametersassumed the same as in this work). Thin sealant (as opposed to normal sealant) correspondsto minimized bulk electrolyte layer thicknesses in the pure PMII (thin) cells (see table 1). Inthe case of the PMII/PACB and the pure PMII electrolytes, depletion of impurity I−3 fromthe porous CE causes a significant increase in cPE, SP
I−3(@ jlim) as compared to the initial open
circuit concentration cinitI−3
, and is further magnified if we take accumulation of I−3 from theedge regions into account.
lPE lSP b a Vedge ϕPE ϕSP ϕa ϕedge nTiO2light −nTiO2
dark DI−3cinit
I−3cPE, SP
I−3(@ jlim) j SP
lim
refs28,29 from eq. (9) from eq. (8) from eq. (6) from eq. (2)[µm] [µm] [µm] [µm] [µl]
[cm−3] [
cm2s−1] [mM] [mM][mA cm−2]
PMII/PACB
This work
7.6 3.8 0 13 1.1 0.5 0.5 0.91 0.91 1019 0.13 ·10−6 8 67 1.77.6 3.8 0 13 0 0.5 0.5 0.91 - 1019 0.13 ·10−6 8 33 0.85
Literature14
10 0 0 15 1.1 0.5 - 0.91 0.91 1019 0.13 ·10−6 8 78 2.910 0 0 15 0 0.5 - 0.91 - 1019 0.13 ·10−6 8 38 1.4
pure PMII
normal sealant
7.6 3.8 13 0 1.1 0.5 0.5 - 1 1019 0.13 ·10−6 8 22 0.577.6 3.8 13 0 0 0.5 0.5 - - 1019 0.13 ·10−6 8 11 0.27
thin sealant
7.6 3.8 0 0 1.1 0.5 0.5 - 1 1019 0.13 ·10−6 8 34 0.887.6 3.8 0 0 0 0.5 0.5 - - 1019 0.13 ·10−6 8 16 0.42
reference
ILE (dry)
7.6 3.8 13 0 1.1 0.5 0.5 - 1 1019 0.17 ·10−6 260 636 227.6 3.8 13 0 0 0.5 0.5 - - 1019 0.17 ·10−6 260 263 8.9
OLE
7.6 3.8 13 0 1.1 0.5 0.5 - 1 1019 4.0 ·10−6 60 149 1187.6 3.8 13 0 0 0.5 0.5 - - 1019 4.0 ·10−6 60 63 50
23
Page 23 of 31
ACS Paragon Plus Environment
The Journal of Physical Chemistry
123456789101112131415161718192021222324252627282930313233343536373839404142434445464748495051525354555657585960
cells, not even when all impurity and photogenerated I−3 contained in the electrolyte is assumed to
accumulate to the redox-active region and contribute to the charge transport.
The above considerations suggest that charge transport in the PMII/PACB electrolyte cannot
be explained by normal diffusion given the amount of I−3 deriving from feasible known sources.
To account for the exceptional charge transport behavior requires assuming either a considerably
shorter diffusion layer thickness than expected, an in-pore diffusion coefficient notably exceeding
that of the bulk electrolyte, or an unidentified I−3 source. However, as was evident based on the
fig. 4 SEM images, the PACB particles are not present in the TiO2 pores and thus it is unlikely
that the diffusion layer thickness could be shorter than our optimistic estimation. Regarding in-
pore diffusion coefficient, charge carrier diffusion in organic liquid electrolytes has been verified
to slow down in nanoporous layers.30,31 In the case of ionic liquids, charge carrier diffusion has
been reported to decrease in nanoporous materials,32 although experimental evidence of acceler-
ated in-pore diffusion has also been recently found in the case of 1-butyl-3-methylimidazolium
tetrafluoroborate ionic liquid in nanoporous silica.33 Nevertheless, since diffusion limited jsc of
the thin reference cells with pure PMII corresponded well with the modified diffusion model, it
is unlikely that deviation from the model observed in the case of the PMII/PACB electrolyte is
explained by accelerated in-pore charge transport in the PE and separator layer pores. Thus, within
the framework of the theory, the most credible explanation for the high jlim in the PMII/PACB
DSC is an unexpected I−3 source in addition to the photogenerated I−3 and impurity I−3 that were
quantified here.
As the PMII/PACB DSCs apparently seem to contain more I−3 than expected, we consider here
the concentration of I−3 that would be required in order for the diffusion model and the experiments
to agree. We calculated a minimum "apparent" I−3 concentration required under illumination at
limiting current conditions for the model to allow the experimentally measured jsc by solving for
cPE, SP
I−3(@ jlim) in eq. (2). Substituting j SP
lim with the jsc of 2.8 mA cm−2 experimentally observed
in this work gives a minimum I−3 concentration of 110 mM in the redox-active volume (PE and
separator layer pores), which is 1.6 to 3.3 times higher than the estimated upper-limit concentra-
24
Page 24 of 31
ACS Paragon Plus Environment
The Journal of Physical Chemistry
123456789101112131415161718192021222324252627282930313233343536373839404142434445464748495051525354555657585960
tion (see table 3). Similar analysis for the literature14 jsc of 9.2 mA cm−2 gives an apparent I−3
concentration of 240 mM in the redox-active volume, which is 3.1 to 6.4-fold compared to the
value determined in this work.
We refrain here to speculate the possible origins for this high apparent extra I−3 concentration.
Instead, we settle for concluding that the high jsc observed with the PMII/PACB electrolyte cannot
be explained by the combined effect of all the hitherto known mechanisms: photogeneration of
I−3 , shortened diffusion distance, impurity I−3 from the PMII and accumulation of I−3 from the edge
region to the active region. Whether the missing explanation is an unknown I−3 source or a yet
unidentified charge transport mechanism inside the mesoporous photoelectrode, requires further
research.
Conclusions
Improvement of short circuit current density of dye-sensitized solar cells (DSC) upon mixing
polyaniline coated carbon black (PACB) in a pure 1-propyl-3-methylimidazolium iodide (PMII)
ionic liquid electrolyte could not be explained by the previously proposed extended electron trans-
fer surface (EETS) model even when all the following possible hitherto known sources and trans-
port mechanisms for free I−3 ions were taken into account: photogeneration of I−3 , shortened diffu-
sion distance, impurity I−3 from PMII and accumulation of I−3 from the edge region to the redox-
active volume of the electrolyte. Extraordinarily high jsc, unaccountable for by a diffusion model
for liquid electrolyte DSCs, suggests the existence of an unknown triiodide source or an unidenti-
fied charge transport mechanism inside the photoelectrode pores. This means that further research
is necessary to fully understand the electrochemical operating principle of the PMII/PACB elec-
trolyte in the DSC.
25
Page 25 of 31
ACS Paragon Plus Environment
The Journal of Physical Chemistry
123456789101112131415161718192021222324252627282930313233343536373839404142434445464748495051525354555657585960
Acknowledgement
The authors thank T. Vainikka and D. Lloyd for help with viscosity measurements and glovebox
operation, K. Miettunen for expertise and assistance regarding substrate treatment and manuscript
proofreading, Beneq Oy for ALD-coating the TiO2 compact layer, and M.I. Asghar for assistance
with SEM imaging. This work was funded partially by Multidisciplinary Institute of Digitization
and Energy (MIDE) of Aalto University (project CNBe), and partially by Tekes - the Finnish
Funding Agency for Technology and Innovation, under the project Robust dye solar cells printed
on metal (KesMPV), number 2928/31/2010.
References
(1) O’Regan, B.; Grätzel, M. A low-cost, high-efficiency solar cell based on dye-sensitized col-
loidal titanium dioxide films. Nature 1991, 353, 737–40.
(2) Kawano, R.; Watanabe, M. Anomaly of charge transport of an iodide/tri-iodide redox couple
in an ionic liquid and its importance in dye-sensitized solar cells. Chemical communications
(Cambridge, England) 2005, (16), 2107–2109.
(3) Wang, P.; Zakeeruddin, S. M.; Moser, J. E.; Grätzel, M. A New Ionic Liquid Electrolyte En-
hances the Conversion Efficiency of Dye-Sensitized Solar Cells. Journal of Physical Chem-
istry B 2003, 107, 13280–13285.
(4) Cao, Y.; Zhang, J.; Bai, Y.; Li, R.; Zakeeruddin, S. M.; Grätzel, M.; Wang, P. Dye-Sensitized
Solar Cells with Solvent-Free Ionic Liquid Electrolytes. The Journal of Physical Chemistry
C 2008, 112, 13775–13781.
(5) Kato, T.; Hayase, S. Quasi-Solid Dye Sensitized Solar Cell with Straight Ion Paths. Journal
of the Electrochemical Society 2007, 154, B117–B121.
(6) Kogo, T.; Hayase, S.; Kaiho, T.; Taguchi, M. Quasi-solid Dye Sensitized Solar Cells Having
Straight Ion Paths. Journal of the Electrochemical Society 2008, 155, K166–K169.
26
Page 26 of 31
ACS Paragon Plus Environment
The Journal of Physical Chemistry
123456789101112131415161718192021222324252627282930313233343536373839404142434445464748495051525354555657585960
(7) Usui, H.; Matsui, H.; Tanabe, N.; Yanagida, S. Improved dye-sensitized solar cells using ionic
nanocomposite gel electrolytes. Journal of Photochemistry and Photobiology A: Chemistry
2004, 164, 97–101.
(8) Huo, Z.; Dai, S.; Wang, K.; Kong, F.; Zhang, C.; Pan, X.; Fang, X. Nanocomposite gel
electrolyte with large enhanced charge transport properties of an I−3 /I− redox couple for
quasi-solid-state dye-sensitized solar cells. Solar Energy Materials and Solar Cells, 2007,
91, 1959–1965.
(9) Katakabe, T.; Kawano, R.; Watanabe, M. Acceleration of Redox Diffusion and Charge-
Transfer Rates in an Ionic Liquid with Nanoparticle Addition. Electrochemical and Solid-
State Letters 2007, 10, F23–F25.
(10) Lee, K.-M.; Chen, P.-Y.; Lee, C.-P.; Ho, K.-C. Binary room-temperature ionic liquids based
electrolytes solidified with SiO2 nanoparticles for dye-sensitized solar cells. Journal of Power
Sources 2009, 190, 573–577.
(11) Ikeda, N.; Teshima, K.; Miyasaka, T. Conductive polymer-carbon-imidazolium composite: a
simple means for constructing solid-state dye-sensitized solar cells. Chemical Communica-
tions 2006, 1733–1735.
(12) Berginc, M.; Krašovec, U. O.; Hocevar, M.; Topic, M. Performance of dye-sensitized solar
cells based on Ionic liquids: Effect of temperature and iodine concentration. Thin Solid Films
2008, 516, 7155–7159.
(13) Chen, P.-Y.; Lee, C.-P.; Vittal, R.; Ho, K.-C. A quasi solid-state dye-sensitized solar cell
containing binary ionic liquid and polyaniline-loaded carbon black. Journal of Power Sources
2010, 195, 3933–3938.
(14) Lee, C.-P.; Chen, P.-Y.; Vittal, R.; Ho, K.-C. Iodine-free high efficient quasi solid-state dye-
sensitized solar cell containing ionic liquid and polyaniline-loaded carbon black. Journal of
Materials Chemistry 2010, 20, 2356–2361.
27
Page 27 of 31
ACS Paragon Plus Environment
The Journal of Physical Chemistry
123456789101112131415161718192021222324252627282930313233343536373839404142434445464748495051525354555657585960
(15) Lee, C.-P.; Lin, L.-Y.; Chen, P.-Y.; Vittal, R.; Ho, K.-C. All-solid-state dye-sensitized solar
cells incorporating SWCNTs and crystal growth inhibitor. Journal of Materials Chemistry
2010, 20, 3619–3625.
(16) Papageorgiou, N. On the relevance of mass transport in thin layer nanocrystalline photoelec-
trochemical solar cells. Solar Energy Materials and Solar Cells 1996, 44, 405.
(17) Papageorgiou, N.; Liska, P.; Kay, A.; Grätzel, M. Mediator Transport in Multilayer Nanocrys-
talline Photoelectrochemical Cell Configurations. Journal of the Electrochemical Society
1999, 146, 898–907.
(18) Miettunen, K.; Halme, J.; Visuri, A.-M.; Lund, P. Two-Dimensional Time-Dependent Nu-
merical Modeling of Edge Effects in Dye Solar Cells. The Journal of Physical Chemistry C
2011, 115, 7019–7031.
(19) Ito, S.; Zakeeruddin, S. M.; Humphry-Baker, R.; Liska, P.; Charvet, R.; Comte, P.; Nazeerud-
din, M. K.; Péchy, P.; Takata, M.; Miura, H.; Uchida, S.; Grätzel, M. High-Efficiency
Organic-Dye-Sensitized Solar Cells Controlled by Nanocrystalline-TiO2 Electrode Thick-
ness. Advanced Materials 2006, 18, 1202–1205.
(20) Wang, Z. S. Significant influence of TiO2 photoelectrode morphology on the energy conver-
sion efficiency of N719 dye-sensitized solar cell. Coordination Chemistry Reviews 2004, 248,
1381.
(21) Papageorgiou, N.; Barbè, C.; Grätzel, M. Morphology and Adsorbate Dependence of Ionic
Transport in Dye Sensitized Mesoporous TiO2 Films. The Journal of Physical Chemistry B
1998, 102, 4156–4164.
(22) Lei, B.-X.; Fang, W.-J.; Hou, Y.-F.; Liao, J.-Y.; Kuang, D.-B.; Su, C.-Y. All-solid-state elec-
trolytes consisting of ionic liquid and carbon black for efficient dye-sensitized solar cells.
Journal of Photochemistry and Photobiology A: Chemistry 2010, 216, 8–14.
28
Page 28 of 31
ACS Paragon Plus Environment
The Journal of Physical Chemistry
123456789101112131415161718192021222324252627282930313233343536373839404142434445464748495051525354555657585960
(23) Hauch, A.; Georg, A. Diffusion in the electrolyte and charge-transfer reaction at the platinum
electrode in dye-sensitized solar cells. Electrochimica Acta 2001, 46, 3457–3466.
(24) Ahmad, I.; Khan, U.; Gun’ko, Y. K. Graphene, carbon nanotube and ionic liquid mixtures:
towards new quasi-solid state electrolytes for dye sensitised solar cells. Journal of Materials
Chemistry 2011, 21, 16990–16996.
(25) Karim, M. R.; Islam, A.; Singh, S. P.; Han, L. Quasi Solid-State Dye-Sensitized Solar Cell In-
corporating Highly Conducting Polythiophene-Coated Carbon Nanotube Composites in Ionic
Liquid. Advances in OptoElectronics 2011, 2011.
(26) Ikeda, N.; Miyasaka, T. Plastic and Solid-state Dye-sensitized Solar Cells Incorporating
Single-wall Carbon Nanotubes. Chemistry Letters 2007, 36, 466–467.
(27) Lee, C.-P.; Yeh, M.-H.; Vittal, R.; Ho, K.-C. Solid-state dye-sensitized solar cell with a charge
transfer layer comprising two ionic liquids and a carbon material. Journal of Materials Chem-
istry 2011, 21, 15471–15478.
(28) Paulsson, H.; Kloo, L.; Hagfeldt, A.; Boschloo, G. Electron transport and recombination in
dye-sensitized solar cells with ionic liquid electrolytes. Journal of Electroanalytical Chem-
istry 2006, 586, 56–61.
(29) Boschloo, G.; Häggman, L.; Hagfeldt, A. Quantification of the Effect of 4-tert-Butylpyridine
Addition to I−/I−3 Redox Electrolytes in Dye-Sensitized Nanostructured TiO2 Solar Cells.
The Journal of Physical Chemistry B 2006, 110, 13144–13150.
(30) Kebede, Z.; Lindquist, S.-E. The obstructed diffusion of the I−3 ion in mesoscopic TiO2 mem-
branes. Solar Energy Materials and Solar Cells 1998, 51, 291.
(31) Kron, G.; Rau, U.; Durr, M.; Miteva, T.; Nelles, G.; Yasuda, A.; Werner, J. H. Diffusion Limi-
tations to I−3 /I− Electrolyte Transport Through Nanoporous TiO2 Networks. Electrochemical
and solid-state letters 2003, 6, E11.
29
Page 29 of 31
ACS Paragon Plus Environment
The Journal of Physical Chemistry
123456789101112131415161718192021222324252627282930313233343536373839404142434445464748495051525354555657585960
(32) Bideau, J. L.; Gaveau, P.; Bellayer, S.; Neouze, M. A.; Vioux, A. Effect of confinement on
ionic liquids dynamics in monolithic silica ionogels: 1H NMR study. Physical Chemistry
Chemical Physics 2007, 9, 5419–5422.
(33) Iacob, C.; Sangoro, J. R.; Kipnusu, W. K.; Valiullin, R.; Karger, J.; Kremer, F. Enhanced
charge transport in nano-confined ionic liquids. Soft Matter 2012, 8, 289–293.
30
Page 30 of 31
ACS Paragon Plus Environment
The Journal of Physical Chemistry
123456789101112131415161718192021222324252627282930313233343536373839404142434445464748495051525354555657585960

Graphical TOC Entry
photoelectrode
FTO substrate
separator layer
ionic liquid -carbon nanoparticleelectrolyte paste
short I diffusion distance3
-
impurity I accumulation3
-
I photogeneration3
-
I3
-
3 I-
2 e-
ohmic conduction
ALD-coated TiO thin layer2
31
Page 31 of 31
ACS Paragon Plus Environment
The Journal of Physical Chemistry
123456789101112131415161718192021222324252627282930313233343536373839404142434445464748495051525354555657585960