Embed Size (px)
Citation preview

Theor. Appl. Climatol. 83, 1–19 (2006)DOI 10.1007/s00704-005-0138-z
Meteorologisches Institut, Universit€aat Bonn, Bonn, Germany
On the linear response of tropical African climateto SST changes deduced from regionalclimate model simulations
H. Paeth and A. Hense
With 10 Figures
Received May 14, 2004; revised February 15, 2005; accepted February 15, 2005Published online May 20, 2005 # Springer-Verlag 2005
Summary
Previous studies have highlighted the crucial role ofsea surface temperature (SST) anomalies in the tropicalAtlantic region in forcing the summer monsoon rainfallover subsaharan West Africa. Understanding the physicalprocesses, relating SST variations to changes in the amountand distribution of African rainfall, is a key factor inimproving weather and climate forecasts in this highlyvulnerable region.
Here, we present sensitivity experiments from a regionalclimate model with prescribed warmer tropical SSTs,according to enhanced greenhouse conditions at the end ofthe 21st century. This dynamical downscaling approachprovides information about the nonlinear response of theatmosphere to oceanic heating. It has been suggested thatthe response is at least partly accounted for by the lineartheory of tropical dynamics, involving a Kelvin and Rossbywave response to a tropical heat source. We computethe major modes of the linear Matsuno-Gill model for geo-potential height and horizontal wind components andproject the simulated response patterns onto these linearmodes, in order to evaluate to which extent the simplelinear theory may explain the SST-induced climate anom-alies over Africa. A multivariate Hotelling T2 test isused to evaluate whether these anomalies are statisticallysignificant.
Forcing the regional climate model by warmer SSTs leadsto substantial climate anomalies over tropical Africa: Rain-fall is increases over the Guinea Coast region (GCR) andtropical East Africa, but decreases over the Congo Basin andthe Sahel Zone (SHZ). At the 850 hPa level, a trough devel-ops over southern West Africa and the Gulf of Guinea, and is
associated with stronger surface wind convergence over theGCR. These changes in the atmospheric dynamics stronglyproject onto the leading modes of the linear Matsuno-Gillmodel at various zonal wave numbers. The correspondingatmospheric heating pattern is highly reminiscent of thesimulated nonlinear model reponse. The T2 test statisticsreveal that the SST forcing induces a statistically significantclimate anomaly over tropical Africa if the climate statevector is reduced by projecting the simulated data onto theleading 10 linear modes. It is also shown that the linearresponse prevails in a long-term simulation with more real-istic lower and lateral boundary conditions. Thus, lineartropical dynamics are assumed to be a major physical pro-cess on the ground of the prominent SST-African rainfallrelationship.
1. Introduction
Rainfall over tropical and subtropical Africahas been in the main focus of climate researchfor many years. This is mostly due to a promi-nent drought tendency over the Sahel Zone(SHZ) and, to a lesser extent, over the GuineaCoast region (GCR) (Nicholson, 2001; LeBarb�ee et al., 2002). This negative trend in rain-fall amount has prevailed since the late 1960sand caused tremendous economical damage,loss of human welfare and large-scale migrationtowards the coastal region of southern West

Africa (Findley, 1994; Benson and Clay, 1998).Thus, it is important to understand the mech-anisms that are responsible for changes in theamount and distribution of rainfall over thishighly sensitive region of the Earth. Improvingour knowledge is essential to identify therelevant forcing factors and finally to establishforecast systems at seasonal to interannual timescales for agricultural planning and medium-range protection measures, (Mo and Thiaw,2002).
It has been suggested that the reduction infreshwater supply over subsaharan Africa maybe partly man-made in the context of deforesta-tion and land surface degradation (Clark et al.,2001; Semazzi and Song, 2001). However, mostauthors agree that African rainfall anomalies areprimarily initiated by sea surface temperature(SST) and only secondarily reinforced in ampli-tude and persistence by feedbacks with theland surface characteristics (Zeng et al., 1999;Nichsolson, 2001). There are a variety of studiesdealing with the statistical relationships betweenrainfall changes over West Africa and SST varia-tions in different oceanic regions. In terms ofthe African summer monsoon, providing around70% of the annual rainfall amount over sub-saharan West Africa (Saha and Saha, 2001), ithas been found that the eastern tropicalAtlantic is the main player (Chang et al., 2000;Ruiz-Barradas et al., 2000; Mo et al., 2001; Paethand Hense, 2003; Paeth and Stuck, 2004). Addi-tional impacts arise from the eastern tropicalPacific, involving the El Ni~nno-Southern Oscilla-tion (ENSO), and, albeit of much lower ampli-tude, from the Indian Ocean SST (Camberlinet al., 2000; Nicholson et al., 2000; Paeth andFriederichs, 2004). The oceanic influence con-cerns almost the whole spectrum of rainfallvariability from intraseasonal to multi-decadaltime scales with slight emphasis on the low-frequency variations (Zeng et al., 1999;Nicholson, 2001; Paeth and Hense, 2004; Paethand Stuck, 2004). Global and regional climatemodel experiments forced with observed SSTsare able to reproduce West African rainfall anom-alies in-phase with the observations, althoughthe amplitudes are generally underestimates,probably related to the missing feedbacks withvegetation cover (Palmer et al., 1992; Paeth andHense, 2004; Paeth et al., 2005).
Given this close connection between Africanrainfall and tropical SSTs, it has been hypothe-sized that increasing greenhouse-gas (GHG)concentrations, which in turn are supposed topredominantly affect the tropical oceans (Paethet al., 2001), may become a key factor in futurechanges in the African summer monsoon cli-mate. Indeed, some studies have suggested thatAfrican precipitation may be subject to sub-stantial changes throughout the 21st century, ifGHG concentrations continue to rise accord-ing to the IPCC scenario A (Houghton et al.,2001; Hulme et al., 2001; Paeth and Hense,2004).
In detail, the response of African rainfall tochanges in tropical Atlantic SSTs, whetherrelated to internal variability or external radiativeheating, is not homogenous across the entirecontinent. Warmer SSTs in the Gulf of Guinearegion result in more abundant rainfall over theGCR, whereas dryer conditions prevail over theSHZ and central tropical Africa (Mo et al., 2001;Paeth and Stuck, 2004). Thus, the spatial gradi-ents in freshwater availability are enhanced,which is suspected of having caused large-scalemigration processes in West Africa during recentdecades (Findley, 1994). This dipole behaviourof precipitation is a basic climate feature overWest Africa (Nicholson and Palao, 1993) withlarge socio-economic relevance. Therefore, it isof interest to understand the physical mech-anisms. Vizy and Cook (2001) have describedsuch a mechanism based on the linear theory byMatsuno (1966) and Gill (1980): A tropical con-vective heat source initiated by warmer SSTs inthe Gulf of Guinea is associated with a Kelvinand Rossby wave response in the tropical tropo-sphere. This leads to enhanced subsidence andreduced rainfall over the Congo Basin. Simulta-neously, the summer monsoon flow is enrichedby humidity due to intensified latent heat fluxesover the tropical Atlantic, where the downwardbranch of the Walker Circulation prevents deepconvection directly over the heating source.Humid air masses are advected to the GCR,where deep convection is finally initiated. Forreasons of continuity, the upward motion is com-pensated by near-surface wind divergence. Thisimplies the southwesterly inflow of humid airmasses over the GCR but stronger northwesterlywinds, the Harmattan, over the SHZ, bringing
2 H. Paeth and A. Hense

dry air from the Saharan region. In addition,positive vorticity is advected to the southermostpart of West Africa by the equatorial Rossbywave response, initiating and intensifying deepconvection over this region.
The linear model of the atmospheric responseto a tropical heat source had first been postu-lated by Matsuno (1966) and advanced by Gill(1980), followed by various applications andinterpretations during the last two decades(Lindzen and Nigam, 1987; Neelin, 1989; Henseand R€oomer, 1995). Robertson and Frankignoul(1990) have compared the skill of the linearMatsuno-Gill model in describing the mean trop-ical circulation of a nonlinear general circula-tion model (GCM). They concluded that aconsiderable part of the tropical dynamics isaccounted for by the linear model. The relevanceof this linear mechanism to African rainfallchanges is also verified in two short-term experi-ments with the regional climate model MM5(Vizy and Cook, 2002).
In the present study, we evaluate the validity ofthe Matsuno-Gill model with respect to climatesensitivity experiments, using a regional climatemodel, and address the question of whether theexternal forcing via the SST field exhibits a sta-tistically significant influence on the atmosphericdynamics over tropical and subtropical Africa.Moreover, the full, nonlinear, and linear responsepatterns of rainfall are compared with each otherin order to assess whether the linear theory pro-vides a reasonable explanation of the physicallink between tropical Atlantic SST forcing andAfrican rainfall changes. The study consists of5 basic steps: (1) The expected warming patternof global SST at the end of the 21st century isderived from a coupled global climate modelsimulations under greenhouse forcing and super-imposed onto the present-day SST fields. (2)These GHG-induced SST fields are used as theoceanic lower boundary condition in a regionalclimate model. July–August time slices are rea-lized for three years with different initial andlateral boundary conditions, once for the ‘‘undis-turbed’’ case, once for the modified SST case. (3)The leading eigenmodes of the linear Matsuno-Gill model are computed for geopotential heightand horizontal wind components. (4) The ampli-tudes of the linear modes are determined by pro-jecting the simulated nonlinear response patterns
onto the leading linear modes. (5) When datareduction of the simulated climate state vectorsis carried out, based on the most relevant 10linear modes, a multivariate Hotelling T2 teststatistics can be applied to the resulting ampli-tude time series, unmodified versus sensitivityexperiments, in order to evaluate whether theGHG-induced SST forcing implies a statisticallysignificant change in African climate in thesubspace of the linear Matsuno-Gill modes. Thelinear model is also validated with respect to amore realistic long-term simulation of late 20th-century climate.
The following section provides a brief descrip-tion of the climate models considered and theexperimental design. Section 3 outlines how themodes of the linear Matsuno-Gill model havebeen determined. Section 4 provides insightinto the T2 test statistics. The results are pre-sented in Section 5 and conclusions are drawnin Section 6.
2. Model description and data sets
In this study the hydrostatic regional climatemodel REMO is used. REMO has been devel-oped at the Max Planck Institute for Meteorologyand is based on the former operational weatherforecast model Europa-Modell of the GermanWeather Service (Jacob, 2001; Jacob et al.,2001). The dynamical core of REMO is basedon the primitive equations with temperature,water vapour, surface pressure, circulation, geo-potential and cloud water content as prognosticvariables. The parameterization of moist convec-tion is computed by the Tiedtke mass fluxscheme (Tiedtke, 1989) with a lower thresholdof cloud thickness, which leads to rainfall. Thethreshold has been decreased from 3000 m to1500 m, in order to account for the specific atmo-spheric instability in the African monsoonal flow.The soil processes are simulated by a 5-layer soilmodel with a maximal depth of 10 m. In the pre-sent version, REMO is run in a horizontal 0.5�
resolution and 20 hybrid vertical levels over thesector 30� W to 60� E and 15� S to 45� N. Thisincludes the northern and central part of Africa,the Mediterranean Basin, southern Europe andthe Arabian peninsula (cf. Fig. 1). This largemodel domain ensures that the regional modelcan develop its own dynamics at the synoptic
On the linear response of tropical African climate to SST changes 3

scale. SSTs and lateral boundary conditions areprescribed every 6 hours at the borders, usingthe ECMWF reanalysis data (ERA15) (Gibsonet al., 1997). Land surface characteristics aretaken from GTOPO30 and NOAA satellite data(Hagemann et al., 1999). Each year the sameannual cycle of vegetation cover and albedois prescribed. Thus, interannual variability inREMO is not related to interannual changes inland surface characteristics.
The regional model REMO has been shown toprovide a realistic description of African climate(Paeth et al., 2005). Particularly, the dynamics ofthe monsoon circulation, including the typicaltropospheric jets and waves, are in excellentagreement with observational data. Cluster anal-ysis has revealed that the basic patterns ofobserved and simulated near-surface climate arelargely congruent with each other. A minormodel deficiency is found in the underestimation(overestimation) of rainfall over (off) the coastalregion of southernmost West Africa, which islikely due to the grid box presentation of orogra-phy and the lack of feedbacks with the land cover.
These deviations are of a systematic nature.Therefore, comparing two sets of simulations ina sensitivity study, such as this are case, shouldlead to a first order estimate of the differencesproduced by a specific anomalous forcing likewarmer SSTs.
Three kinds of experiments have been con-ducted: (1) Three July–August time slice areforced with the unchanged 1987, 1988 and1990 initial, lower and lateral boundary condi-tions from the ERA15 reanalysis data. Theseyears have been chosen as they represent a nor-mal, excessively wet and anomalously dry sum-mer rainy season, respectively, over the GCR(Paeth et al., 2005). The aim here is to verifywhether our findings depend upon the large-scalebackground climate state.
(2) The same time slices, initial and lateralboundary conditions are chosen, but a GHG-induced warming signal is superimposed ontothe day-to-day fluctuations of SST in theREMO domain. The SST signal is derived froma coupled climate model experiment, usingthe ECHAM4=OPYC GCM (Roeckner et al.,
Fig. 1. (Top) Leading EOF pattern ofmonthly-mean SST derived from along-term coupled ECHAM4=OPYCexperiment with GHG forcing. (Bottom)Corresponding annual-mean and 10-year lowpass filtered PC time series,standardized with respect to the 1860–1970 mean. The 1. EOF accounts for87% of total SST variability
4 H. Paeth and A. Hense

1996). This run starts in 1860 and is subject toincreasing GHG concentrations until the year2099. Before 1985, observed trace gas concentra-tions are prescribed, whereas future changes arebased on the IPCC IS92A scenario (Houghtonet al., 2001). The resulting first empirical ortho-gonal function (EOF) of SST in the REMO sectoris shown in Fig. 1. Note that the principal com-ponent (PC) time series is standardized withrespect to the 1860 to 1970 mean which is sup-posed to represent internal climate variability. Incombination with the PC time series, the EOFpattern shows positive SST anomalies into the21st century in all ocean basins. The largestamplitudes occur in the Mediterranean and thesubtropical North Atlantic (up to þ3 K). In theGulf of Guinea, the ocean surface is still warm-ing by 2 K until the end of the present century.Given the relatively small amplitude of the 20thcentury variations (about 1 K maximally, Paethand Stuck, 2004), it can be expected that suchan oceanic heating source exhibits a fundamentalimpact on African climate. It may be borne inmind that one single ECHAM4 realization maynot be sufficient to represent the external GHG-induced signal in the low-latitude SST field.However, it has been shown that tropical andsubtropical SSTs are more affected by radiativeforcing than most other climatological param-eters, accounting for almost 90% of total SSTvariability during the 21st century (Paeth et al.,2001; Paeth and Hense, 2004). Thus, we assumethat the warming in pattern in Fig. 1 is an appro-priate estimate of the expected climate changesignal. Note that there is one major inconsistencyin the idealized sensitivity experiments: Theatmospheric conditions at the boundaries, astaken from the ERA15 data, do not take accountof the oceanic warming signal. Therefore, thedynamical forcing at the borders is not in ac-cordance with the surface conditions withinthe REMO domain. However, Messager et al.(2004) have shown that SST represents the mostsignificant effect in tropical West African cli-mate, whereas lateral boundary conditions onlymodulate the SST-related climate anomalies. Theadvantage of our approach is that the SST forcingis isolated from other factors. As a result themain focus is on the response of the atmosphereto oceanic heating whereas other sources ofinterannual variability from the lateral boundary
conditions are suppressed. Note that the experi-mental design is not appropriate to predict futureclimate changes in tropical Africa, rather theidealized experiments aim at highlighting themechanism.
(3) In order to ensure that the relevance of thelinear model is not an artefact of the idealizedexperimental design, a long-term simulation ofAfrican climate is produced. The regional modelhas been integrated over the 1979 to 2003 periodusing lower and lateral boundary conditionsfrom ECMWF (re-)analyses in the same modeldomain as the sensitivity experiments. This run issubject to entirely consistent forcing fields anddraws a realistic picture of present-day Africanclimate, especially with respect to the atmo-spheric circulation (Paeth et al., 2005). From thissimulation, composites of years with the 5 warm-est and coldest SSTs in the tropical oceans areconstructed and their differences projected ontothe major modes of the linear model.
The simulated composite differences of July–August precipitation are compared with thecomposites from the CRU data set (New et al.,2000) in order to evaluate whether the simulatedresponse to oceanic heating is in agreement withthe observed anomalies during the 20th century.The CRU data set consists of a variety of avail-able station data interpolated to a regular gridand covers the period 1901 to 1998. Althoughthe station density is low in some African re-gions, this data set has been found to provide amore realistic description of rainfall variability intropical Africa than reanalysis products (Poccardet al., 2000).
3. Linear theory
The basic goal of the present study is to gaininsight into the physical mechanism which gov-erns the response of African circulation and rain-fall to changes in low-latitude SSTs. Robertsonand Frankignoul (1990) have shown that thelinear Matsuno-Gill (MG) model provides astatistically significant description of the meantropical climate in the GISS GCM. If tropicalclimate anomalies are considered, the modelshould perform even better, because small distur-bances on the mean flow are assumed (Matsuno,1966; Gill, 1980). The MG model is a reducedgravity model linearized around a horizontally
On the linear response of tropical African climate to SST changes 5

homogeneneous potential temperature state anda superrotational basic flow u0 cos�, while onlythe first vertical baroclinic mode is retained. It isdriven by a deep tropical heat source against fric-tional effects. We consider geopotential heightand horizontal wind components as parametersof the tropical flow, as they are output variablesof the regional climate model REMO. A detaileddescription of a similar analysis with geopoten-tial, streamfunction and velocity potential onthe basis of a global climate GCM is given byHense and R€oomer (1995). We hypothesize thatthe anomaly or difference fields of geopotentialheight �, denoted as the height anomaly of thefluid, zonal wind u and meridional wind v, asderived from the nonlinear REMO experimentswarmer SST versus present-day SST, is describedby the following set of equations
@
@tuþ u0
a
@
@�u� 2~�� sin’v ¼ � c
a cos’
@
@�
g�
c
ð1Þ
@
@tvþ u0
a
@
@�vþ 2~�� sin’u ¼ � c
a
@
@’
g�
cð2Þ
@
@t
g�
cþ u0
a
@
@�
g�
c
þ c
a cos’
�@
@�uþ @
@’cos’v
�¼ q
cð3Þ
’ and � denote the geographical latitude andlongitude, a is the radius of the Earth, ~�� ¼2ð�þ u0
aÞ is the effective rotation rate. The heat-
ing rate q can be understood as an atmosphericheat source, for instance initiated by warmerSST, which directly relates to the rainfall rate,since condensation is associated with the releaseof latent heat in the troposphere (Hense andR€oomer, 1995). c is the phase speed of the gravitywaves and is related to the static stability via theRossby radius of deformation R0
c ¼ �
aR2
0 ð4Þ
This quantity can be used to distinguishbetween tropical (R0 � 800–1000 km) and ex-tratropical (R0 � 1500 km) motions (Longuet-Higgins, 1986). Assuming a harmonic variationin zonal direction and a centered finite difference
response in meridional direction with the samespatial resolution as in REMO, the continuousset of Eqs. (1–3) can be transformed in thefollowing matrix equation (N being the numberof grid points in N=S direction)
d
dt~xxm þMm~xxm ¼ P~qq ð5Þ
with xTm ¼ ðumðy1Þ . . . umðyNÞ; vmðy1Þ . . . vmðyNÞ;g�mcðy1Þ . . . g�mc ðyNÞÞ and qTm ¼ ðqmðy1Þ . . .
qmðyNÞÞ. Details of the matrix M, which relatesthe atmospheric heating to anomalous flow, andthe projection P are given in Appendix A. Here,m indicates that the linear system depends para-metrically upon the zonal wave number. Takingup the ideas by Hense and R€oomer (1995) andHense et al. (1990) we look for the stationarysolution of Eq. (5). This solution is spanned bythose eigenvectors of the system matrix M,which have a small eigenvalue. As we do notknow the form of the linear model a-priori, wehave to specify a sufficiently large set of eigen-vectors with small moduli of eigenvalues. Eigen-analysis of M is carried out for zonal wavenumbers m � ½1; 8� relative to the W=E extent ofREMO. Eigenvectors for the subsequent analysisare obtained by choosing eigenvectors whichhave the 10 smallest modulus of eigenvaluesamong all 8 (zonal wave numbers) times 3 (vari-ables (u, v, g�
c)) times 62 (time steps) eigenvalues.
The eigenvectors are complex valued, thereof 10eigenmodes correspond to 20 real valued basisfunctions spanning the assumed solution spaceof the stationary solution.
After selecting the full anomaly fields simu-lated by REMO, defined as deviations from theoverall mean of all simulations, these fields areprojected upon the selected real modes. Let
eðkÞm ð�; �Þ ¼
�eu;km ; ev;km ; e�;km
�be the eigenvector
with the k-th smallest eigenvalue, then the pro-jection amplitude is defined as
rðkÞm ¼ð ð
~eeðkÞT
m ð�; �Þ! u; v;g�
c
� �ð��Þd�d cos�
ð6Þwhere ! is a 3� 3 matrix, which ensures that all3 variables contribute equally to the projection(Hense and R€oomer, 1995). Here, we choose !to be a diagonal matrix with entries 1
�uu,1�vv,
cg���. The
bared variables are the area-mean values of the
6 H. Paeth and A. Hense

overall mean such that the projection can be writ-ten in the discrete case as (Nxy being the numberof grid points in the REMO domain)
NxyrðkÞm ¼
Xi;j
�eu;km ð�i; �jÞ cos�juð�i; �jÞ
1
�uu
þ ev;km ð�i; �jÞ cos�jvð�i; �jÞ1
�vv
þ e�;km ð�i; �jÞ cos�j
g�
cð�i; �jÞ
c
g���
�ð7Þ
u, v and � anomalies are defined at the 300and 850 hPa level. In order to account for thevertical structure of the first internal baroclinicmode, the difference between the projectionamplitudes between both vertical levels is chosenas the final variable for the subsequent statisticalanalysis.
If a significant difference in these projectionamplitudes between the control and SST-anom-aly forced simulations is found (see next sec-tion), one may calculate, from the significantstructure in u, v and �, the specific forcing q,which is required by the linear model to producethe significant response in the flow variables. Ifthis anomalous heating q is assumed to arisefrom condensation solely, it can be converted toa precipitation rate (see Appendix B), which canbe compared with rainfall anomalies between theREMO control and @SST forced. For this, onecalculates the divergence of the significant flowcomponents and estimates from the implied ver-tical velocity the diabatic heating, which com-pensates the adiabatic cooling. This is the weaktemperature gradient approximation discussed byBretherton and Sobel (2003) and Webster (1972).
4. Test statistics
In order to address the question of whether theSST forcing in the low latitude oceans is asso-ciated with a statistically significant change inAfrican climate, the Hotelling T2 test is appliedto the phase state vector ~xx of dimension q, con-taining the projection amplitudes r
ðkÞm . (Morrison,
1976; Hense and R€oomer, 1995). It is assumedthat this is a multivariate random variable, whichis drawn from a normal distributed ensemblewith mean ~�� and covariance matrix �. The non-linear regional climate model provides two sam-
ples ~xx1 and ~xx2 of size m1 ¼ m2 ¼ 62 days foreach year (1987, 1988, 1990), one sample repre-senting the present-day case, the other represent-ing the disturbed case with warmer tropicaloceans. If the SST forcing exhibits a statisticallysignificant influence on the atmospheric dynam-ics, the two samples constitute different ensem-bles with different means ~��1 and ~��2. Thus,based on the two samples it has to be decidedwhether the null hypothesis H0 : �~��1~��1 ¼ �~��2~��2 orthe alternative hypothesis H0 : �~��1~��1 6¼ �~��2~��2 is valid,given a certain error level. An appropriate testvariable for this pair of hypotheses is given by
T2 ¼ m1m2ðm1 þ m2 � q� 1Þðm1 þ m2Þq
���~xx1~xx1 � �~xx2~xx2
�TW�1
��~xx1~xx1 � �~xx2~xx2
�ð8Þ
with
W ¼ S1ðm1 � 1Þ þ S2ðm2 � 1Þ ð9Þ�~xx1~xx1 and �~xx2~xx2 denote the estimated climatic means
of the two samples, Sx1and Sx2
the correspondingestimated covariance matrices. Given that theinverse of W is defined, T2 is Fisher F distrib-uted under the null hypothesis with ðq;m1 þm2 � q� 1Þ degrees of freedom.
A basic limitation of the Hotelling T2 statisticsis that it is only defined for q < m1 þ m2 � 2. Inthe case of the REMO simulations this require-ment is not fulfilled in the grid point space, butin the space of the lowest 10 eigenmodes of thelinear GM model. The resulting 20 time seriesare then used to estimate the climatic means~xx1;2 and covariance matrices S1;2 of the present-day and the future warming sample. This specialapproach also holds the prospect of testing thestatistical significance of the Matsuno-Gill modelwith respect to African climate dynamics: If thenull hypothesis is rejected, it can be concludedthat the linear model describes an essential partof the circulation anomalies, associated with atropical oceanic heat source. Thus, the eigen-modes of the MG model serve two simultaneouspurposes: (1) to gain insight into the physicallink between rainfall changes over tropicalAfrica and SST anomalies in the adjacent oceanbasins and (2) to provide a valuable basis of datareduction as required by the T2 test statistics inorder to access the statistical significance of theresponse.
On the linear response of tropical African climate to SST changes 7

5. Results
5.1 Simulated nonlinear response patterns
Figure 2 displays the difference patterns of July–August precipitation between the experimentswith warmer SSTs, as expected at the end ofthe 21st century (cf. Fig. 1), and the present-day conditions. The dark (light) grey shadingmarks regions with increasing (decreasing)amounts of rainfall during the July–August mainsummer monsoon period. At first sight, there is astrong response to the oceanic heating, especiallyin the low latitudes: More precipitation is pre-dicted over and off the Guinea Coast with thehighest amplitude (up to þ4500 mm) occurringin the vicinity of the intertropical convergencezone (ITCZ) west of Guinea. The same is foundover tropical East Africa, where warmer SSTs inthe Indian Ocean provide more abundant rainfall.Dryer conditions are simulated over the CongoBasin and in some parts of the SHZ, albeit ofmuch lower amplitude (up to �300 mm). Thespatial structure of the rainfall response is con-sistent with all 3 experiments 1987, 1988 and1990. Thus, the basic mechanism is not affectedby the different boundary conditions from large-scale circulation. A change in rainfall by morethan 4000 mm appears somewhat exaggerated.On the other hand, SST changes of more than2 K have never been observed during the 20thcentury, the maximum amplitude of the year-to-year changes amounting to about 1 K (Paeth andStuck, 2004, their Fig. 11). The sensitivity ofREMO rainfall to SST variations in the Gulf ofGuinea and the subtropical North Atlantic is in arealistic order of magnitude (Paeth and Stuck,2004, their Fig. 12).
From a dynamical point of view, the rainfallanomalies are related to a trough in the 850 hPalevel along the coastal regional of West Africa(Fig. 3). In general, the geopotential height isreduced over the whole continent. Interestingly,all 3 experiments agree in simulating a low westof Guinea which corresponds to the region of thestrongest rainfall signal in Fig. 2. Obviously, aheat low is developing, independent of the initialand boundary conditions, either directly due tooceanic heating or indirectly due to an intensifi-cation of the meridional SST gradient in this sec-tor (cf. Lindzen and Nigam, 1987; Neelin, 1989;
Schade, 2000). However, it is conceivable thatthis tropical cyclogenesis only arises from theidealized experimental design: The atmosphericinflow at the western boundaries of REMO is not
Fig. 2. Rainfall response patterns to tropical Atlantic heat-ing in mm, late 21st century July–August conditions minuspresent-day conditions for 3 years with different lateralboundary conditions
8 H. Paeth and A. Hense

aware of the oceanic heat source within themodel domain. Colder air over warmer SSTmay easily initiate a low. This point is discussedin Subsection 5.5.
As to be expected, the deep tropical con-vection over the GCR and the tropical Atlanticis balanced by near-surface wind convergence(Fig. 4). The response in the summer monsoon
flow is much stronger than in the Harmattanwind, except in the case of 1988. The depressionin the geopotential height is related to a cyclonicanomaly in the surface wind, which is againrevealed by all 3 experiments. An intensifiedinflow from the Indian Ocean is found overtropical East Africa, whereas divergent flowprevails over the Congo Basin with distinct east-erly anomalies into the oceanic heat source. In
Fig. 3. Same as Fig. 2 but for 850 hPa geopotential heightin m
Fig. 4. Same as Fig. 2 but for near-surface wind in ms
On the linear response of tropical African climate to SST changes 9

the upper troposphere, outflow over the low and awave-like pattern with eastward flow over thetropical Atlantic prevail (not shown).
This three-dimensional picture gives support tothe mechanism suggested by Vizy and Cook(2001) (cf. Section 1): The equatorial Kelvinwave response to the heating induces changes inthe Walker circulation east of the heat source,leading to easterly (westerly) anomalies at thesurface (in 300 hPa), subsidence in the middletroposphere and reduced rainfall over central trop-ical Africa. Deep convection is reinforced overthe southernmost part of West Africa due to awind convergence in the near-surface monsoon
circulation. This also implies that the Harmattanis getting stronger, resulting in dryer conditionsover the SHZ, although this signal is muchweaker in REMO than the response in the tropicalcirculation south of 10� N. In the following, thispurely qualitative interpretation is extended bycomparing the response patterns of the nonlinearregional climate model directly with the com-puted dynamical modes of the linear MG model.
5.2 Relevant linear modes
The MG modes from linear theory are computedas described in Section 3, referring to variable
Fig. 5. Amplitudes of projections ofREMO geopotential and wind responsepatterns onto the leading 20 Gill modesfor the 3 sensitivity experiments andzonal wave numbers between 1 and 8,for explanation see text
10 H. Paeth and A. Hense

zonal wave numbers m ¼ 1 . . . 8. Here, we focuson the 20 modes with lowest eigenvalues. TheMG modes, which are most relevant to theresponse patterns of REMO, are detected byprojecting the simulated difference patterns ofu, v and � in 850 hPa and 300 Pa onto these 20
linear modes. For different wave numbers, themodulus of the optimized projection amplitudesffiffiffiffiffiffiffiffiffiffiffiffiffiffiffiffiffiffiffiffiffiffiffiffiffiffiffiffiffiffiffiffiffi�
rðkÞm;a
�2 þ�rðkÞm;b
�2q
over 20 G modes are illus-
trated in Fig. 5, where rðkÞm;a=b are the projection
amplitudes associated with the real and imagi-
Fig. 6. Real part of the leading Gillmodes relevant to the REMO responseto tropical Atlantic heating at differentzonal wave numbers for the sensitivityexperiment 1987, contour lines indicat-ing geopotential anomalies and arrow-heads denoting wind anomalies in themiddle troposphere, for explanation seetext (KW ¼̂¼Kelvin Wave; RW ¼̂¼RossbyWave; GW ¼̂¼Gravity Wave)
On the linear response of tropical African climate to SST changes 11

nary part of the eigenmodes. Given small wavenumbers (m ¼ 1 . . . 3) the dynamical atmo-spheric anomalies in REMO mainly project ontothe first MG mode, which represents the equato-rial Kelvin wave response from linear theory. Interms of large zonal wave numbers (m ¼ 7 . . . 8),the REMO response is associated with MGmode 2, describing the linear Rossby waveresponse. A striking feature is the remarkableprojection amplitude at MG mode 11 andm ¼ 6 which may be interpreted as an atmo-spheric gravity wave response. Varied initialand boundary conditions in the different yearsbarely affect these results. Thus, the MG modesappear to represent robust characteristics of thesimulated behaviour of African climate inresponse to changing SSTs.
In order to visualize our findings, the 10most important MG modes are selected, basedon the results in Fig. 5, and the correspondingeigenvectors are drawn in Fig. 6. For reasonsof clarity only the real part of the eigenvectorsis shown. The contours denote the geopotentialheight anomalies, the arrows of the correspond-ing wind vector anomalies. The patterns in Fig. 6perfectly agree with the known structure of thetropical wave responses, as displayed in pre-vious papers (Gill, 1980; Hense and R€oomer,1995; Bretherton and Sobel, 2003). The firstmode, which basically contributes to the simu-lated tropical anomalies, is the Kelvin waveat wave numbers m ¼ 1 . . . 4. The Rossbywave contribution (mode 2) is relevant atm ¼ 1; 2; 5; 7; 8. In addition, the gravity wave-like feature of mode 11 has been selected. Thesemodes are derived theoretically, hence, they donot differ from year to year. Only the selection ofthe 10 most relevant MG modes involves thesimulated REMO output. The idea of the lineartheory is that lower and higher troposphericanomaly patterns equally project onto thesemodes, except for the opposite sign. In terms ofthe REMO results, this is indeed true (notshown). There is evidence that the linear MGmodes actually play a crucial role in describingthe large-scale dynamical response of Africanclimate to tropical heating. With respect toREMO, this even holds when synoptic-scale pro-cesses, which may be supposed to add somenoise to the large-scale response, are resolvedin the regional modelling.
5.3 Linear response patterns
Another interesting issue is to determine theheating anomalies necessary for setting up theflow anomalies (Fig. 7) and compare them withthe full response pattern of REMO. The calcu-lation of the heating Qð�; ’Þ is described in
Fig. 7. Linear heating response in the middle troposphere,expressed as precipitation rate in mm per 2 months, relatedto the Gill modes relevant to REMO for the 3 sensitivityexperiments, for explanation see text
12 H. Paeth and A. Hense
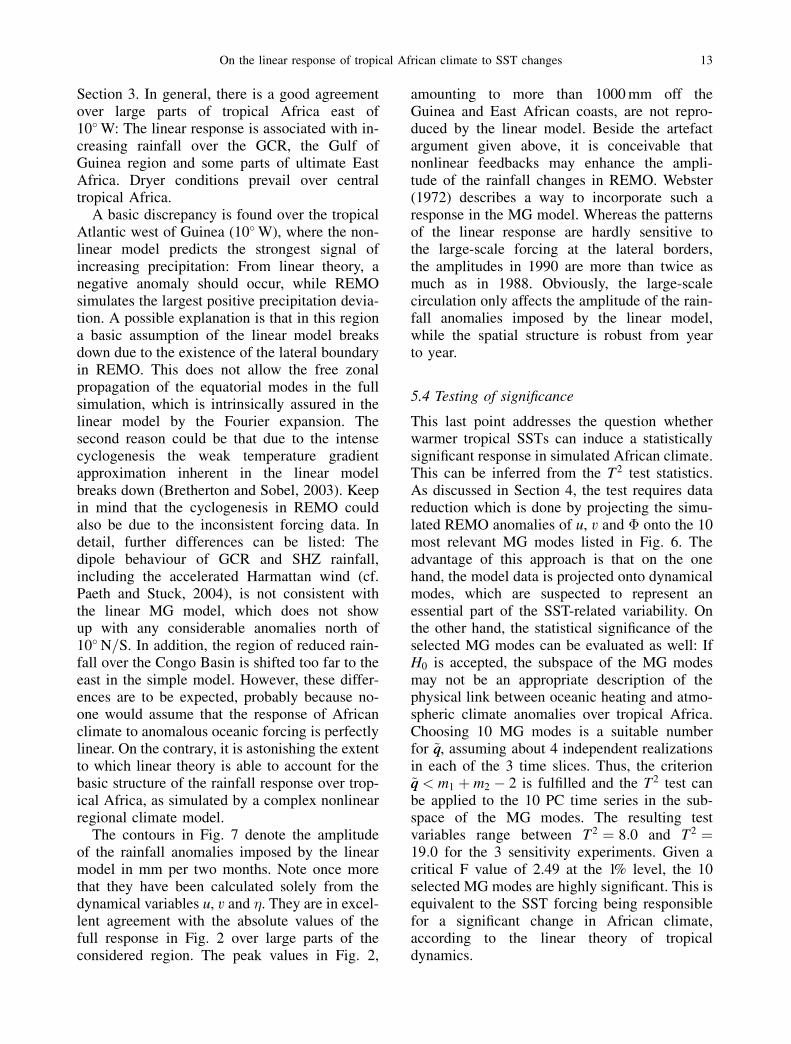
Section 3. In general, there is a good agreementover large parts of tropical Africa east of10� W: The linear response is associated with in-creasing rainfall over the GCR, the Gulf ofGuinea region and some parts of ultimate EastAfrica. Dryer conditions prevail over centraltropical Africa.
A basic discrepancy is found over the tropicalAtlantic west of Guinea (10� W), where the non-linear model predicts the strongest signal ofincreasing precipitation: From linear theory, anegative anomaly should occur, while REMOsimulates the largest positive precipitation devia-tion. A possible explanation is that in this regiona basic assumption of the linear model breaksdown due to the existence of the lateral boundaryin REMO. This does not allow the free zonalpropagation of the equatorial modes in the fullsimulation, which is intrinsically assured in thelinear model by the Fourier expansion. Thesecond reason could be that due to the intensecyclogenesis the weak temperature gradientapproximation inherent in the linear modelbreaks down (Bretherton and Sobel, 2003). Keepin mind that the cyclogenesis in REMO couldalso be due to the inconsistent forcing data. Indetail, further differences can be listed: Thedipole behaviour of GCR and SHZ rainfall,including the accelerated Harmattan wind (cf.Paeth and Stuck, 2004), is not consistent withthe linear MG model, which does not showup with any considerable anomalies north of10� N=S. In addition, the region of reduced rain-fall over the Congo Basin is shifted too far to theeast in the simple model. However, these differ-ences are to be expected, probably because no-one would assume that the response of Africanclimate to anomalous oceanic forcing is perfectlylinear. On the contrary, it is astonishing the extentto which linear theory is able to account for thebasic structure of the rainfall response over trop-ical Africa, as simulated by a complex nonlinearregional climate model.
The contours in Fig. 7 denote the amplitudeof the rainfall anomalies imposed by the linearmodel in mm per two months. Note once morethat they have been calculated solely from thedynamical variables u, v and �. They are in excel-lent agreement with the absolute values of thefull response in Fig. 2 over large parts of theconsidered region. The peak values in Fig. 2,
amounting to more than 1000 mm off theGuinea and East African coasts, are not repro-duced by the linear model. Beside the artefactargument given above, it is conceivable thatnonlinear feedbacks may enhance the ampli-tude of the rainfall changes in REMO. Webster(1972) describes a way to incorporate such aresponse in the MG model. Whereas the patternsof the linear response are hardly sensitive tothe large-scale forcing at the lateral borders,the amplitudes in 1990 are more than twice asmuch as in 1988. Obviously, the large-scalecirculation only affects the amplitude of the rain-fall anomalies imposed by the linear model,while the spatial structure is robust from yearto year.
5.4 Testing of significance
This last point addresses the question whetherwarmer tropical SSTs can induce a statisticallysignificant response in simulated African climate.This can be inferred from the T2 test statistics.As discussed in Section 4, the test requires datareduction which is done by projecting the simu-lated REMO anomalies of u, v and � onto the 10most relevant MG modes listed in Fig. 6. Theadvantage of this approach is that on the onehand, the model data is projected onto dynamicalmodes, which are suspected to represent anessential part of the SST-related variability. Onthe other hand, the statistical significance of theselected MG modes can be evaluated as well: IfH0 is accepted, the subspace of the MG modesmay not be an appropriate description of thephysical link between oceanic heating and atmo-spheric climate anomalies over tropical Africa.Choosing 10 MG modes is a suitable numberfor ~qq, assuming about 4 independent realizationsin each of the 3 time slices. Thus, the criterion~qq < m1 þ m2 � 2 is fulfilled and the T2 test canbe applied to the 10 PC time series in the sub-space of the MG modes. The resulting testvariables range between T2 ¼ 8:0 and T2 ¼19:0 for the 3 sensitivity experiments. Given acritical F value of 2.49 at the 1% level, the 10selected MG modes are highly significant. This isequivalent to the SST forcing being responsiblefor a significant change in African climate,according to the linear theory of tropicaldynamics.
On the linear response of tropical African climate to SST changes 13

5.5 Validation of the MG model
The sensitivity experiments have highlighted themechanism, linking oceanic forcing to large-scale precipitation anomalies. However, it is pos-sible that the imbalance between the SST forcingat the lower boundary and the lateral atmosphericforcing by ERA15 data induces unrealistic fea-tures in the interior of the model domain. In orderto evaluate the MG model with respect to morerealistic climate conditions, we apply the samemethod to a 25-year simulation with REMO.During the period 1979 to 2003 the regionalmodel has been forced with ECMWF analysesand reanalyses at the lower and lateral bound-aries. Thus, lower and lateral forcing fields areconsistent with each other and close to real cli-mate. This long-term run has been found to pro-vide a realistic description of African climate(Paeth et al., 2005), especially in terms of theatmospheric dynamics in the entire troposphere.Five-year composites of warm and cold tropicaloceans in a band between 10� S and 10� N aredetermined. The difference pattern of the compos-ites describes a substantial warming of around1 �C in the tropical Atlantic and around 0.5 �Cin the Indian Ocean (not shown). Note that theamplitude of the forcing is less pronounced thanin the sensitivity experiments which are subjectto late 21st-century oceanic heating.
The corresponding composite differences inJuly–August rainfall are displayed in Fig. 8(top panel). The basic structure of the patternsis similar to the idealized response patterns inFig. 2 with positive anomalies at the GuineanCoast, in the northern tropical Atlantic, over EastAfrica and the Indian Ocean. Dryer conditionsprevail over the southern Sahel and central tropi-cal Africa. In detail, the composite differencesare less homogeneous in space, in particular overcentral Africa. It is likely that additional sourcesof interannual variability, for instance from glob-al circulation prescribed at the lateral boundariesor local effects, impose some spatial noise inthe long-term run. The bottom panel in Fig. 8denotes the corresponding composite differencesin the CRU data. There are indeed some consid-erable discrepancies between model and observa-tions over central tropical Africa, which probablyarise from further key factors in real climate likeland cover changes and interactions with vegeta-
tion. Such processes are not accounted for by themodel but play a major role in African climatevariability (Douville, 2002; Zeng et al., 1999).Nonetheless, the meridional dipole in precipita-tion amount over subsaharan West Africa is ingood agreement. The same holds for the magni-tude of the SST-induced rainfall changes.
The cyclonic activity, prevailing off the wes-tern Guinean Coast in the idealized simula-tions, is less obvious in the composite differences.There is some surface wind convergence,upper-tropospheric outflow and a rainfall peakin the northern tropical Atlantic but no indicationof tropical cyclogenesis. Therefore, we supposethat the cyclogenesis is an artefact of the ideal-ized experiments, arising from the fact thatatmopsheric inflow at the western boundaries ofREMO does not contain of the late 21st-century
Fig. 8. Rainfall response patterns to tropical Atlantic heat-ing in mm, difference between 5-year composites of warmand cold tropical SST (10� S–10� N) 1979–2003
14 H. Paeth and A. Hense

oceanic warming signal. This directly leads toatmospheric instability and a heat low develops.
Projecting the composite differences of lowerand upper tropospheric wind components andgeopotential onto the leading 20 MG modesmentioned above results in the amplitudes shownin Fig. 9. The impact of oceanic heating onAfrican climate anomalies during the 1979 to2003 period obviously works through the sameMG modes as in the idealized experiments,including Kelvin waves, Rossby waves and grav-ity waves. The T2 test reveals a statistically sig-nificant difference between the composites at the1% level. Compared with Fig. 5, the projectionamplitudes are weaker. This is not surprizinggiven the lower amplitude of the oceanic forcing
and the additional factors of internal variabilityin the continuous long-term simulation withvarying lateral boundary conditions. The asso-ciated linear response patterns in Fig. 10 are spa-tially coherent with the idealized response in Fig.7 but, as to be expected, the amplitudes are againlower. There is some evidence that the linearresponse mechanism described above also playsan important role in realistic regional climatemodel simulations, even if additional sources ofinterannual variability are taken into account.This basically enhances our belief in the physicalidea of a partly linear relationship betweentropical oceanic forcing and African climateanomalies.
6. Conclusions
The main goal of the present study is to contri-bute to our understanding of the physicalmechanisms which link African climate anoma-lies to changes in the low-latitude oceans. Pre-vious works have shown that the simple linearMG model accounts for a large part of theSST-related variability in the tropics. Here, weevaluate the linear theory of tropical dynamicswith respect to a nonlinear regional climatemodel, which involves synoptic-scale process-es. Linear and nonlinear response patterns ofAfrican rainfall to the expected oceanic heatingat the end of the 21st century are compared witheach other. In addition, the statistical significanceof the climate anomalies is addressed.
The nonlinear regional climate model REMOpredicts substantial changes in the monsoon cir-
Fig. 9. Amplitudes of projections ofREMO geopotential and wind responsepatterns onto the leading 20 Gill modesfor the difference patterns according tothe 5-year composites of warm and coldtropical SST (1979–2003) and zonalwave numbers between 1 and 8, for ex-planation see text
Fig. 10. Linear heating response in the middle troposphere,expressed as precipitation rate in mm per 2 months, relatedto the Gill modes relevant to REMO for the differencepatterns according to the 5-year composites of warm andcold tropical SST (1979–2003), for explanation see text
On the linear response of tropical African climate to SST changes 15
culation. These changes are associated withanomalies in the rainfall amount and distributionover large parts of tropical and subtropicalAfrica, if the SSTs are warming by several K:Off the Guinea Coastas as well as over theGCR and coastal East Africa more abundant pre-cipitation is simulated whereas dryer conditionsprevail over the Congo Basin and the SHZ. Thispattern is accompanied by a large-scale trough inthe 850 hPa level and near-surface wind conver-gence over the tropical coasts of West and EastAfrica, according to the works by Vizy and Cook(2001, 2002). In order to gain a quantitativeinsight into the role of the linear MG model,the MG modes are computed and the nonlinearREMO output is projected onto these theoreticalmodes. It is found that in particular, the equato-rial Kelvin and Rossby wave responses at variouszonal wave numbers account for the signal in themonsoon circulation as simulated by REMO. Thetheoretical linear rainfall response is in excellentagreement with the large-scale spatial structureof the nonlinear pattern. However, linear theoryis not able to reproduce the remarkable signal inthe ITCZ west of Guinea. Obviously, nonlinearprocesses are involved in REMO. In addition, thetotal amount of the rainfall changes is partlyunderestimated by the MG modes, suggestingthat nonlinear effect may enhance the amplitudeof the response. The multivariate T2 test revealsthat in the subspace of the linear MG modes, theSST forcing induces a statistically significantchange in the monsoonal flow and rainfall overtropical Africa. The linear MG model is success-fully validated under more realistic climateconditions during the late 20th century with con-sistent forcing fields at lateral and lower bound-aries, on the basis of composites of years withwarm and cold tropical SSTs.
Four major conclusions can be drawn fromthis study: (1) Over the land masses of tropicalAfrica, the changes in rainfall and troposphericcirculation basically arise from a linear equato-rial Kelvin and Rossby wave response to tropicaloceanic heating. This even holds when synoptic-scale processes are resolved in the model, whichmay add some noise to the large-scale anomalies.(2) Nonlinear processes enhance the amplitude ofthe climate anomalies and are responsible foradditional effects, such as tropical cyclogenesis,which may overcompensate the linear response.
(3) The SST forcing in the low latitudes has astatistically significant impact on African tropicalclimate at an error level of 1%, implying that theselected MG modes, the test is based on, are sig-nificant. (4) Given the expected warming of thetropical oceans at the end of the 21st century,African summer monsoon rainfall is anticipatedto increase over the GCR and East Africa,whereas dryer conditions may occur over theCongo Basin and the SHZ (cf. Paeth and Stuck,2004). This may have severe implications forfuture migration processes over West Africa(cf. Findley, 1994). Of course, the latter conclu-sion only holds if the signals derived from thesensitivity runs are not an artefact of the ideal-ized experimental design. In any case, there issome evidence that the MG model mechanismprevail, if additional sources of interannual vari-ability are taken into account.
Two basic improvements are intended in orderto draw a more realistic picture of future Africanclimate change: (1) As discussed in Section 2,the forcing in the SST lower boundary conditionsis not consistent with the atmospheric forcing atthe margins of the REMO domain. Thus, furtherinvestigation is needed to implement the GHGforcing in the radiation scheme of REMO andto drive the regional model with atmosphericdata from global climate model output, whichincludes the warming signal in global SST. (2)It has been suggested that changes in land surfacecharacteristics, such as vegetation cover andalbedo, may play a crucial role in rainfall anoma-lies over Africa (Zeng et al., 1999; Clark et al.,2001; Semazzi and Song, 2001). Thus, a morerealistic picture of future African climate changemay be drawn by including scenarios of land usechanges in REMO, in order to assess how thismay counteract the radiative heating effect. Themain conclusion from our study is that the simplelinear MG model provides a reasonable descrip-tion of SST-induced climate anomalies over theAfrican continent. It can be used for the interpre-tation of simple sensitivity studies.
Acknowledgements
This work was supported by the Federal German Minister ofEducation and Research (BMBF) under grant No. 07 GWK02 and by the Ministry of Science and Research (MWF) ofthe Federal State of Northrhine-Westfalia under grant No.223-21200200. We thank Ralf Podzun and Daniela Jacob
16 H. Paeth and A. Hense

from the Max Planck Institute for Meteorology, Hamburg,for their technical support in running the regional climatemodel REMO.
Appendix A. Details of the matrix equation
Given the zonal symmetry and periodicity of the linearmodel, a Fourier transformation of the MG model equations(Eqs. 1–3) is done in the zonal direction at any grid pointline in the meridional direction. Then the matrix equationreads
The terms in square brackets all represent matrices ofdimension ny, equivalent to the number of latitudes in theREMO resolution (ny ¼ 121), hence, the overall matrix Mand the vectors ~�� as well as ~QQ are of dimension 3ny. Thiscomplex matrix M translates an atmospheric heating anom-aly ~QQ, for instance related to warmer SSTs, to an anomaly inthe tropical flow state vector ~��. Note that the zonal wavenumber is slightly modified in the form m̂m ¼ sin ðm��Þ
�� in orderto account for the discrete � grid. � is the frictional param-eter which is set to � ¼ 2:315 � 10�6s�1 (1 per 5 days). S isa diagonal matrix of dimension ny with the sine weightingfactors of the geographical latitude, accordingly, W standsfor the cosine weighting factors. The ny-dimensional matrixD represents the discrete analog of the meridional derivativeincluding the boundary condition of vanishing gradient at thenorthern and southern boundaries. Matrix P is a projectormapping the ny-dimensional vector ~qqm̂m into the 3ny-dimensional vector ~QQm̂m. It has the property PTP ¼ I.
Appendix B. Calculation of the pattern of rainfallanomalies imposed by the linear model
The theoretical atmospheric heating pattern~qq, arising from alinear combination of the leading 20 MG modes, iscomputed. Equation 15 provides an estimate of the realand imaginary part of the amplitudes with rað j; m̂mÞ ¼r̂ra300ð j; m̂mÞ� r̂ra850ð j; m̂mÞ and rbð j; m̂mÞ ¼ r̂rb300ð j; m̂mÞ� r̂rb850ð j; m̂mÞ.A linear combination of the leading 20 MG modes leads to
the complex vector~~��~��m̂m, containing the meridional compo-
nents of the u, v and � fields which are primarily affected bya certain heating anomaly ~qqm̂m, given a wave number m̂m:
~~��~��m̂m ¼X20
j¼1
�rað j; m̂mÞ þ i � rbð j; m̂mÞ
��eaj þ iebj
�ðA2Þ
Knowing matrix Mm̂m from Eq. 12, the ny-dimensionalmeridional component~qqm̂m of the heating pattern can be deter-mined for each zonal wave number m̂m:
~qqm̂m ¼ PTMm̂m~��m̂m ðA3Þ
meaning that only the ny-dimensional matrices in the bottomline of matrix Mm̂m are considered. The two-dimensional heat-ing field is given by:
qð�; ’Þ ¼ 2 � real�Xnm̂m
m̂m¼1
~qqm̂m � exp½im̂m���
ðA4Þ
with nm̂m ¼ 8. The finally resulting response pattern of Afri-can rainfall, as derived from the linear MG model, is com-puted as follows:
Qð�; ’Þ ¼ qð�; ’Þ���cp�o�o�wLv
ðA5Þ
where ��� represents the spatial mean of the simulated geo-potential height anomaly in 500 hPa, cp ¼ 1005 Jkg�1K�1 isthe specific heat, �o ¼ 1:0 kgm�3 and �w ¼ 103 kgm�3
denote the density of air and water, respectively, �o ¼300K is the potential temperature, and Lv ¼ 2:5 � 106 Jkg�1
is the specific evaporation heat.
References
Benson C, Clay EJ (1998) The impact of drought on sub-Saharan economies. World Bank Tech Paper, No. 401,World Bank, Washington DC
Bretherton CS, Sobel AH (2003) The Gill model and theweak temperature gradient approximation. J Atmos Sci60: 451–460
Camberlin P, Janicot S, Poccard I (2001) Seasonality andatmospheric dynamics of the teleconnection betweenAfrican rainfall and tropical sea-surface temperature:Atlantic vs. ENSO. Int J Climate 21: 973–1004
Chang P, Saravanan R, Ji L, Hegerl GC (2000) The effectof local sea surface temperature on atmospheric circu-lation over the tropical Atlantic sector. J Climate 13:2195–2216
Clark DB, Xue Y, Harding RJ, Valdes PJ (2001) Modelingthe impact of land surface degradation on the climate oftropical North Africa. J Climate 14: 1809–1822
Douville H (2002) Influence of soil moisture on the Asianand African monsoons. Part II: Interannual variability.J Climate 15: 701–720
Findley SE (1994) Does drought increase migration? Astudy of migration from rural Mali during the1983–1985 drought. Int Migr Rev 28: 539–553
Gibson R, Kallberg P, Uppala S, Hernandez A, Nomura A,Serrano E (1997) ERA description. Re-Analysis ProjectReport Series No. 1, European Centre for Medium-RangeWeather Forecasts (ECMWF). Reading. UK
Gill A (1980) Some simple solutions for heat-inducedtropical circulation. Quart J Roy Meteor Soc 113:1237–1269
———————————————————u0
aim̂mI þ �I
� � 2~��S �vv
�uu
� ga����uu im̂mW
�1�
2~��S �uu
�vv
� u0
aim̂mI þ �I
� ga����vv
1�’D
�Ha�uu��� im̂mW
�1�
Ha�vv���
1�’W
�1DW�
u0
aim̂mI þ �I
��������
�������|fflfflfflfflfflfflfflfflfflfflfflfflfflfflfflfflfflfflfflfflfflfflfflfflfflfflfflfflfflfflfflfflfflfflfflfflfflfflfflfflfflfflfflfflfflffl{zfflfflfflfflfflfflfflfflfflfflfflfflfflfflfflfflfflfflfflfflfflfflfflfflfflfflfflfflfflfflfflfflfflfflfflfflfflfflfflfflfflfflfflfflfflffl}Mm̂m
~uu~vv~��
0@
1A
|fflffl{zfflffl}~��m̂m
¼ 1
���
~00~00~qqm̂m
0@
1A
|fflfflfflffl{zfflfflfflffl}~QQm̂m
1
���
0
0
I
0@
1A
|fflffl{zfflffl}P
~qqm̂m ðA1Þ
———————————————————
On the linear response of tropical African climate to SST changes 17
Hagemann S, Botzet M, D€uumenil L, Machenhauer B (1999)Derivation of global GCM boundary conditions from 1 kmland use satellite data. Max-Planck-Inst. f. Meteor.,Report No. 289, Hamburg
Hense A, Glowienka-Hense R, von Storch H, St€aahler U(1990) Northern Hemisphere atmospheric response tochanges of Atlantic Ocean SST on decadal time scales:a GCM experiment. Climate Dyn 4: 157–174
Hense A, R€oomer U (1995) Statistical analysis of tropicalclimate anomaly simulations. Clim Dyn 11: 178–192
Houghton JT, Ding Y, Griggs DJ, Noguer M, Van der LindenPJ, Dai X, Maskell K, Johnson CA (eds) (2001) Climatechange 2001. Cambridge: The Scientific Basis
Hulme M, Doherty R, Ngara T, New M, Lister D(2001) African climate change: 1900–2100. Clim Res17: 145–168
Jacob D (2001) A note to the simulation of the annualand interannual variability of the water budget over theBaltic Sea drainage basin. Meteorol Atmos Phys 77:61–74
Jacob D, Van den Hurk BJJM, Andrae U, Elgered G,Fortelius C, Graham LP, Jackson SD, Karstens U,Koepken C, Lindau R, Podzun R, Rockel B, Rubel F,Sass BH, Smith R, Yang X (2001) A comprehensivemodel intercomparison study investigating the waterbudget during the PIDCAP period. Meteorol Atmos Phys77: 19–44
Le Barb�ee L, Lebel T, Tapsoba D (2002) Rainfall variabilityin West Africa during the years 1950–90. J Climate 15:187–202
Lindzen RS, Nigam S (1987) On the role of sea surfacetemperature gradients in forcing low-level winds andconvergence in the tropics. J Atmos Sci 44: 2418–2436
Longuet-Higgins MS (1986) The eigenfunctions ofLaplace’s tidal equations over a sphere. Proc Roy Soc262: 511–580
Matsuno T (1966) Quasi-geostrophic motions in the equa-torial area. J Meteor Soc Japan 44: 25–42
Messager C, Gall�eee H, Brasseur O (2004) Precipitationsensitivity to regional SST in a regional climate simula-tion during the West African monsoon for two dry years.Climate Dyn 22: 249–266
Mo K, Bell GD, Thiaw WM (2001) Impact of sea surfacetemperature anomalies on the Atlantic tropical stormactivity and West African rainfall. J Atmos Sci 58:3477–3496
Mo KC, Thiaw WM (2002) Ensemble canonical correlationprediction of precipitation over the Sahel. Geophys ResLett 29, 10.1029=2002GL015075
Morrison DF (1976) Multivariate statistical methods. NewYork: McGraw-Hill, 415 pp
Neelin JD (1989) On the interpretation of the Gill model.J Atmos Sci 46: 2466–2468
New M, Hulme M, Jones P (2000) Representing twentieth-century space-time climate variability. Part II: Develop-ment of 1901–96 monthly grids of terrestrial surfaceclimate. J Climate 13: 2217–2238
Nicholson SE (2001) Climatic and enviromental changein Africa during the last two centuries. Clim Res 17:123–144
Nicholson SE, Palao IM (1993) A re-evaluation of rainfallvariability in the Sahel. Part I. Characteristics of rainfallfluctuations. Int J Climatol 13: 371–389
Nicholson SE, Some B, Kone B (2000) An analysis of recentrainfall conditions in West Africa, including the rainyseason of the 1997 El Ni~nno and the 1998 La Ni~nna years.J Climate 13: 2628–2640
Paeth H, Born K, Jacob D, Podzun R (2005) Regionaldynamic downscaling over West Africa: model validationand comparison of wet and dry years. Meteorol Zeitschrift(submitted)
Paeth H, Friederichs P (2004) Seasonality and time scalesin the relationship between global SST and African rain-fall. Clim Dyn (online first), DOI 10.1007=s00382-004-0466-1
Paeth H, Friederichs P, Hense A (2001) Covariabilityand interaction of North Atlantic sea surface temperatureand North Atlantic Oscillation in ECHAM3 greenhouse-gas sceanario simulations. Meteorol Zeitschrift 10:295–307
Paeth H, Hense A (2003) Seasonal forecast of sub-sahelianrainfall using cross validated model output statistics.Meteorol Zeitschrift 12: 157–173
Paeth H, Hense A (2004) SST versus climate changesignals in West African rainfall: 20th century varia-tions and future projections. Clim Change 65:157–173
Paeth H, Stuck J (2004) The West African dipole in rainfalland its forcing mechanisms in global and regional climatemodels. Mausam 55: 561–582
Palmer T, Brankovic C, Viterbo P, Miller MJ (1992) Model-ling interannual variations of summer monsoons. J Cli-mate 5: 399–417
Poccard I, Janicot S, Camberlin P (2000) Comparisonof rainfall structures between NCEP=NCAR reanalysesand observed data over tropical Africa. Clim Dyn 16:897–915
Robertson AW, Frankignoul C (1990) The tropical circula-tions: simple model versus general circulation model.Quart J Roy Meteor Soc 116: 69–87
Roeckner E, Arpe K, Bengtsson L, Christoph M, ClaussenM, D€uumenil L, Esch M, Giorgetta M, Schlese U,Schulzweida U (1996) The atmospheric general circula-tion model ECHAM-4: Model description and simulationof present-day climate. Max-Planck-Inst. f. Meteor.,Report No. 218, Hamburg
Ruiz-Barradas A, Carton JA, Nigam S (2000) Structure ofinterannual-to-decadal climate variability in the tropicalAtlantic sector. J Climate 13: 3285–3297
Saha K, Saha S (2001) African monsoons. Part I:Climatological structure and circulation. Mausam 52:479–510
Schade LR (2000) Tropical cyclone intensity and sea surfacetemperature. J Atmos Sci 57: 3123–3130
Semazzi FHM, Song Y (2001) A GCM study of climatechange induced by deforestation in Africa. Clim Res 17:169–182
Tiedtke M (1989) A comprehensive mass flux scheme forcumulus parameterization in large scale models. MonWea Rev 117: 1779–1800
18 H. Paeth and A. Hense

Vizy EK, Cook KH (2001) Mechanisms by which Gulf ofGuinea and Eastern North Atlantic sea surface tempera-ture anomalies can influence African rainfall. J Climate14: 795–821
Vizy EK, Cook KH (2002) Development and applicationof a meso-scale climate model for the tropics: Influenceof sea surface temperature anomalies on the WestAfrican monsoon. J Geophys Res 107, 10.1029=2001JD000686
Webster PJ (1972) Response of the tropical atmosphere tolocal, steady forcing. Mon Wea Rev 100: 518–541
Zeng N, Neelin JD, Lau K-M, Tucker CJ (1999) Enhance-ment of interdecadal climate variability in the Sahel byvegetation interaction. Science 286: 1537–1540
Authors’ address: Heiko Paeth (e-mail: [email protected]), Andreas Hense, Meteorologisches Institut,Universit€aat Bonn, Auf dem H€uugel 20, 53121 Bonn, Germany.
On the linear response of tropical African climate to SST changes 19