Embed Size (px)
Citation preview
ON THE INTERPRETATION OF DOUBLE-PACKER TESTS INHETEROGENEOUS POROUS MEDIA:NUMERICAL SIMULATIONS USING THE STOCHASTIC CONTINUUMANALOGUE
Sven Follin
Department of Engineering Geology, Lund University,Lund, Sweden
December 1992
This report concerns a study which was conductedfor SKB. The conclusions and viewpoints presentedin the report are those of the author(s) and do notnecessarily coincide with those of the client.
Information on SKB technical reports from1977-1978 (TR 121), 1979 (TR 79-28), 1980 (TR 80-26),1981 (TR 81-17), 1982 (TR 82-28), 1983 (TR 83-77),1984 (TR 85-01), 1985 (TR 85-20), 1986 (TR 86-31),1987 (TR 87-33), 1988 (TR 88-32), 1989 (TR 89-40),1990 (TR 90-46) and 1991 (TR 91-64) is availablethrough SKB.
(
i,
I
V
i
ON THE INTERPRETATION OF DOUBLE-PACKER
TESTS IN HETEROGENEOUS POROUS MEDIA:
Numerical simulations using the stochastic continuum
analogue
SVEN FOLLIN
December 1992
Department of Engineering Geology
Lund University, Sweden
[ KEYWORDS: HETEROGENEITY, SUPPORT SCALE, DOUBLE-PACKER TESTING, SIMULATION

1
i,
t
i
Preface
The idea of simulating double-packer tests in heterogeneous porous media arose duringmeetings and discussions conducted by SKB - the Swedish Nuclear Fuel and WasteManagement Company in conjunction with the SKB 91 and the Äspö Hard RockLaboratory projects. The far-field hydraulic modelling undertaken in these two projects ismainly performed with two computer codes called HYDRASTAR and PHOENICS,respectively, which both use heterogeneous porous media concepts.
Two important constraints shared by the two modelling scenarios are the limited amountof hydraulic conductivity data for the model set-up, and the huge volumes of rock beingmodelled. Typically, it has been necessary to resort to single-hole measurements such asfixed-interval double-packer tests. The body of these tests are carried out with short testsection lengths (straddle intervals). Accordingly, the data used for far-field modelling havebeen regularised (scaled-up) in order to fit the comparatively coarser numerical discretisa-tion. The objectives of this study are to closely examine the support scale of double-packer tests and to discuss some tentative possibilities to improve present interpretation,regularisation and modelling techniques based on the stochastic continnum analogue.
The transmissivity value determined with a double-packer test depends to some extent onthe interpretation method used, and the interpretation procedure is therefore a debatablesubject. As a natural consequence of the support scale studies, some of the methods usedfor interpreting constant-head injection tests within the Swedish nuclear waste repositoryprogramme are compared and ambiguities observed in relation to real tests are discussed.
The author is grateful for the financial support from SKB and for the valuable commentsof Mr. Jan-Erik Andersson, GEOSIGMA, Mr. Joel Geier, GOLDER GEOSYSTEM, Dr.J. Jaime Gömez-Hernåndez, UPV, Dr. Roger Thunvik, KTH, Dr. Clifford Voss, USGS,and Mr. Anders Winberg, CONTERRA.
ill
r" \
Ä/ 4
Abstract (English)
Flow in fractured crystalline (hard) rocks is of interest in Sweden for assessing the post-closure radiological safety of a deep repository for high-level nuclear waste. Dependingon the scale of the problem under study different modelling concepts are used. Forsimulation of flow and mass transport in the far field different porous media concepts areoften used, whereas discrete fracture/channel network concepts are often used for near-field simulations. Due to lack of data, it is generally necessary to have resort to single-hole double-packer test data for the far-field simulations, i.e., test data on a small scale areregularised in order to fit a comparatively coarser numerical discretisation, which isgoverned by various computational constraints. It is interesting to note that single-holefixed-interval packer test data are also used as the basis for derivation of the hydro-geologic properties of discrete fracture models, despite the different assumptions regard-ing the geometry of flow. Obviously, techniques that improve the interpretation and theregularisation of single-hole double-packer tests are of paramount interest In the presentstudy the Monte Carlo method is used to investigate the relationship between the trans-missivity value interpreted and the corresponding radius of influence in conjunction withsingle-hole double-packer tests in heterogeneous formations. The numerical flow domainis treated as a two-dimensional heterogeneous porous medium with a spatially varyingdiffusivity on a 3 m scale. Two methods which have been traditionally used for interpret-ing constant-head injection tests within the Swedish nuclear waste repository programme,namely Move's and Jacob-Lohman's formulae, are compared and ambiguities observedin relation to real tests are discussed. The Monte Carlo simulations demonstrate thesensitivity to the correlation range of a spatially varying diffusivity field. In contradictionto what is tacitly assumed in stochastic subsurface hydrology, the results show that thelateral support scale (e.g., the radius of influence) of transmissivity measurements inheterogeneous porous media is a random variable, which is affected by both the hydraulicand statistical characteristics. If these results are general, the traditional methods forscaling-up, assuming a constant lateral scale of support and a multinomial distribution,may lead to an underestimation of the persistence and connectivity of transmissive zones,particularly in highly heterogeneous porous media.
-/4A-
Abstract (Swedish)
iit Kunskap om grundvattnets strömning i sprickigt berg är av betydelse för säkerhets-
A analyser rörande djupförvaring av utbränt kärnbränsle. Olika typer av grundvatten-' modeller förekommer beroende pä beräkningsskalan storlek. För fjärrzonsberäkningar
antas ofta att berget kan modelleras som om det vore ett poröst medium. För närzonsbc-räkningar används även sprickmodeller. Bristen på indata i lämplig skala i samband medfjärrzonsberäkningar medför att man ofta tvingas skala upp s.k. enhilsmätningar tillaktuell beräkningsskala. Enhälsmätningar i liten skala förekommer i stora mängder ochanvänds även för att kalibrera sprickmodeller vid näraonsberäkningar. Med tanke på en-hålsmätningarnas relativt sett stora betydelse finns det anledning att se över tolknings-,kalibrerings- och uppskalningskoncepten. I denna rapport använder vi Monte Carlometoden för att undersöka influensradiens relation till tolkat transmissivitetsvärde i sam-band med enhålsmätningar i starkt heterogena och porösa media. Två tolkningsmetodersom används i Sverige inom forskningen för djupförvaring av använt kärnbränsle för antolka sk. vatteninjektionsmätningar vid konstant tryck (Moye och Jacob-Lohman) liggertill grund för de beräkningsresultat som redovisas. Beräkningsresultaten visar att influens-
•J. radien inte är konstant utan att d e n n a beror både p å d e hydraul i ska o c h statistiska egen-skaperna h o s det o m g i v a n d e mediet . Det ta innebär att d e uppskalningsalgoritmer s o m tra-dit ionel l t används underskattar uthåll igheten o c h konnckt iv i te ten h o s småskal iga struktu-rer m e d h ö g transmissivitet.
1i
Ä/4
i,
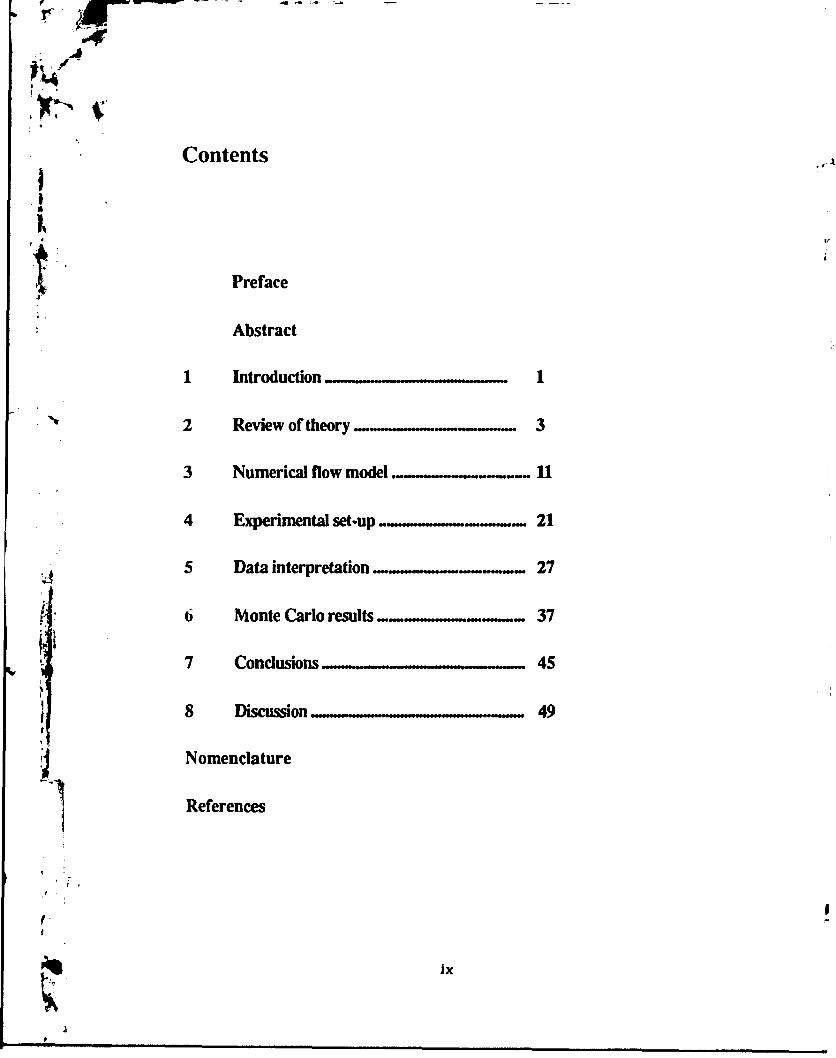
Contents
Preface
Abstract
Introduction,
Review of theory,
3 Numerical flow model 11
4 Experimental set»up .. .~~~~..~. 21
5 Data interpretation. 27
6 Monte Carlo results — ~ 37
7 Conclusions 45
8 Discussion 49
Nomenclature
References
IX

JT
Chapter 1
Introduction
Depending on the scale of the problem under study different modelling concepts are usedir. Sweden for assessing the post-closure radiological safety of a deep repository forhigh-level nuclear waste in fractured crystalline (hard) rocks. For simulation of flow andmass transport in the far field different porous media concepts are often used, whereasdiscrete fracture/channel network concepts are often used for near-field simulations. Dueto lack of data, it is generally necessary to have resort to single-hole double-packer testdata for far-field simulations. That is to say, test data on a small scale are regularised inorder to fit a comparatively coarser numerical discretisation (see, e.g., Gustafson et al.,1989; Svensson, 1991; Norman, 1992), which is governed by various computational con-straints. It is interesting to note that single-hole fixed-interval packer test data are alsoused as the basis for derivation of the hydrogeologic properties of discrete fracturemodels, despite the different assumptions regarding the geometry of flow (see, e.g., Geierand Axelsson, 1991; Geier et al., 1992). Obviously, techniques that improve the interpreta-tion and the regularisation of single-hole double-packer tests are of paramount interest.
The present study attempts to address and support the early stages of hydrogeologiccharacterisation for a high-level radioactive-waste repository in fractured hard rocks usingthe stochastic continuum analogue on a 3 m scale. Thus, the main assumption made inthis study is that fractured hard rocks can be treated as highly heterogeneous porousmedia on the scale of interest The Monte Carlo method is used to investigate the relation-ship between the transmissivity value interpreted and the corresponding radius ofinfluence for single-hole double-packer tests. The objective is to closely examine thelateral support scale (e.g., the radius of influence) of double-packer tests and to discusssome tentative possibilities to improve present interpretation, regularisation and modellingtechniques. The interest for single-hole double-packer tests reflects the likelihood that theearly screening of the rock mass will be conducted with a limited number of boreholes;the best use of the drilling resources will likely require distributing boreholes over a largearea, rather than concentrating them in the small area that would be useful for interferencetesting. Single-hole testing is thus likely to be one of the primary methods for investigat-ing the hydrogeologic properties of the rock mass.
. »t
I-./4
i
t
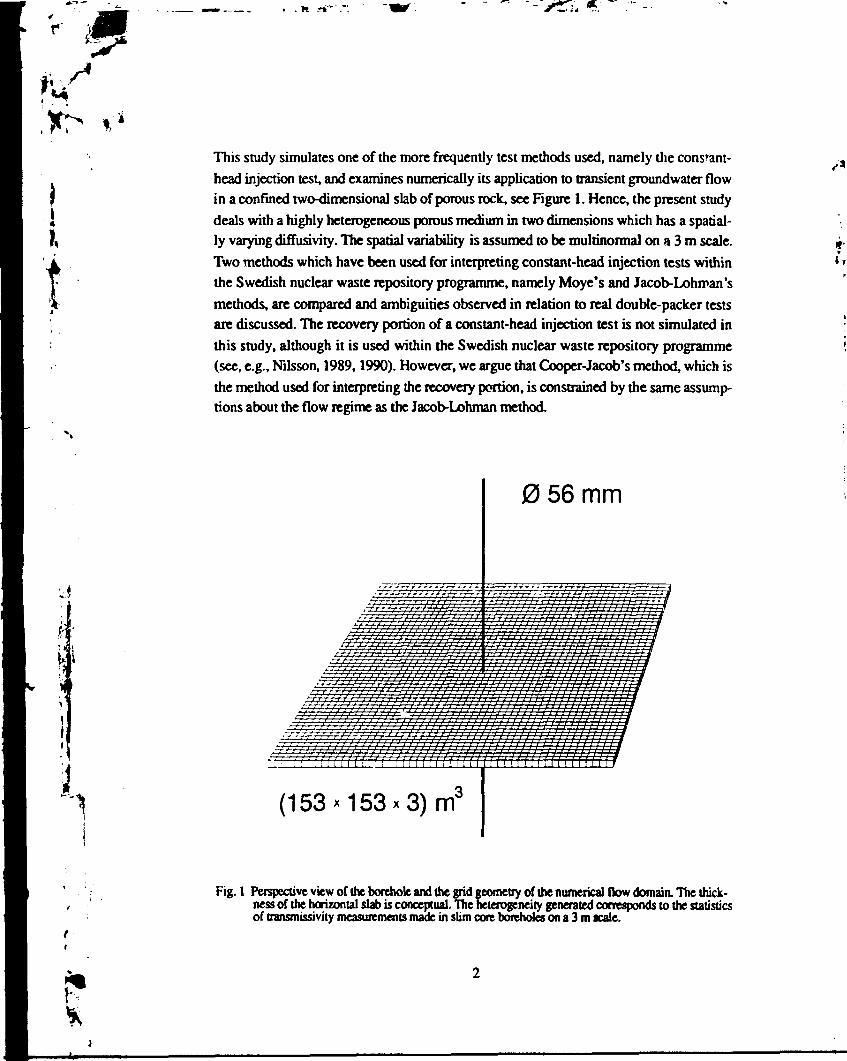
This study simulates one of the more frequently test methods used, namely the constant-head injection test, and examines numerically its application to transient groundwater flowin a confined two-dimensional slab of porous rock, see Figure 1. Hence, the present studydeals with a highly heterogeneous porous medium in two dimensions which has a spatial-ly varying diffusivity. The spatial variability is assumed to be multinomial on a 3 m scale.Two methods which have been used for interpreting constant-head injection tests withinthe Swedish nuclear waste repository programme, namely Moye's and Jacob-Lohroan'smethods, are compared and ambiguities observed in relation to real double-packer testsare discussed. The recovery portion of a constant-head injection test is not simulated inthis study, although it is used within the Swedish nuclear waste repository programme(sec, e.g., Nilsson, 1989,1990). However, we argue that Cooper-Jacob's method, which isthe method used for interpreting the recovery portion, is constrained by the same assump-tions about the flow regime as the Jacob-Lohman method.
•J
0 56 mm
: : ' i T I i ( f i •' i :' ; I [ 7 7 f i' f I
(153*153*3)rrf
irnrniuf-m-
Fig. 1 Perspective view of (he borehole and the grid geometry of the numerical flow domain. The thick-ness of the horizontal slab is conceptual. The heterogeneity generated corresponds to the statisticsof transmissivity measurements made in slim core boreholes on a 3 m scale.
t
Chapter 2
Review of theory
In transient groundwater flow, the mass balance equation for a control volume of asaturated porous medium becomes
- ( 0 P H , ) + V- (pJrt = O (1)dr
where 0 is the effective porosity of the porous medium, pw is the density of the ground-water, and q is the volumetric groundwater flow (flux). For the general case of an aniso-tropic porous medium the flux is given by Darcy's law, which can be written as
f pwg z) (2)
vi w
•i where /fc is the intrinsic permeability tensor of the porous medium, /i* is the dynamic: J, viscosity of the groundwater, pw is the pressure of the groundwater, g is the acceleration• * due to gravity, and z is the vertical unit vector pointing upwards. If the porous medium is
of constant porosity and its intrinsic permeability is isotropic and homogeneous, and ifthe groundwater density and viscosity are constant, a combination of the mass balanceequation and Darcy's law can be written as
V 2 * = ^ (3)K dt
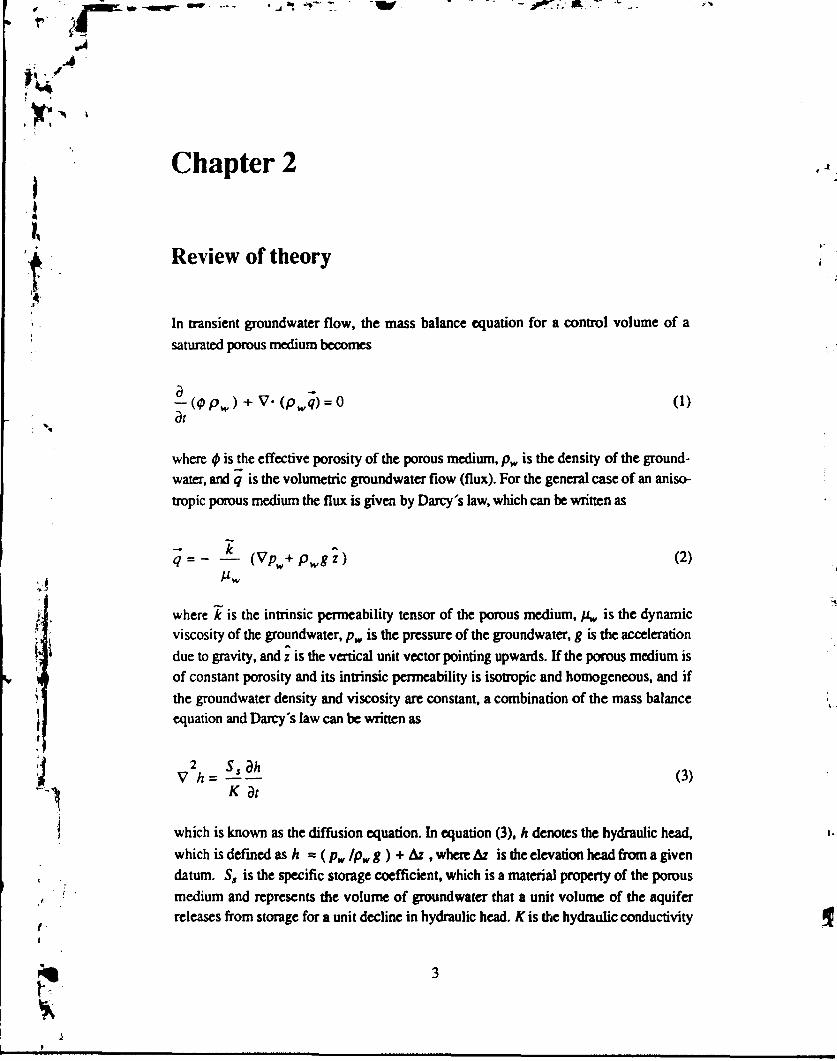
which is known as the diffusion equation. In equation (3), h denotes the hydraulic head,which is defined as h =(pw/pwg) + Äz , where Az is the elevation head from a givendatum. 5, is the specific storage coefficient, which is a material property of the porousmedium and represents the volume of groundwater that a unit volume of the aquiferreleases from storage for a unit decline in hydraulic head. K is the hydraulic conductivity
f
of the aquifer and is a material property of both the porous medium and the fluid. For the
S special case of horizontal transient flow in a confined two-dimensional aquifer of constantI thickness b, equation (3) simplifies to
id h d h S dh—r +—r = (4)3x2 dy2 T &
where S = SJ> and T - Kb. S and T denote the storativity and transmissivity of the aquifer,respectively. Equation (4) is the equation considered in this study, however, for a hetero-geneous porous medium with a spatially varying diffusivity 7/5, i.e., in the numerical flowmodel, the spatially varying diffusivity is constant valued within each element.
The flow geometry associated with equation (4) is radial; the flow lines radiate in all
N directions perpendicular to the hole axis. In a homogeneous porous medium, racial flowoccurs in well tests where the entire thickness of aquifer lies within the test zone; a fullypenetrating well. Classical interpretation methods for well tests in aquifers generallyassume a homogeneous porous medium and simple flow geometries such as linear, radial,and spherical flow, see Figure 2a. Recently, the concept of fractional dimensions (Barker,1988) has been introduced for interpreting hydraulic tests, see Figure 2b. In Sweden,fractional dimension analyses have so far been applied to test data from Stripa (Doe andGeier, 1990) and from Finnsjön (Geier and Axelsson, 1991; Geier and Doe, 1992).
It is important to note that well tests measure transmissivity and not hydraulic conduct-; • ivity K. For a fully penetrating well in a homogeneous porous medium, the average
hydraulic conductivity is calculated from the transmissivity by taking b as the thickness ofthe aquifer, i.e., K = Tib. However, for borehole tests such as the constant-head injectiontest, b is not readily defined. This is particular true for the short packer spacingscommonly used to calculate the hydraulic conductivity of hard rocks in Sweden, wherepacker spacings of the order of a few metres (or less) have been used at several sites suchas Finnsjön, Stripa, and Äspö (see, e.g., Carlsson et al., 1980; Holmes, 1989; Nilsson,1989,1990).
^ Traditionally, the b used for calculating the hydraulic conductivity in conjunction with a
i constant-head injection test is simply the packer spacing L between die double-packers,! despite facts such as (0 the test section covers only a small portion of total thickness of
the rock tested and (if) only a small portion of the test section is conducting fluid, i.e.,. groundwater flow takes place in the fractures intersecting the test section.

m
tO.» 1KB »11 7 I Dm O»IXt0| Dm^tf
Fig. 2a Schematic view of integer-value flow geometries; linear, radial, and spherical flow (reproduced
from Ball etcd., 1992).
SOURCE
SOURCE
> 3 Dimensional flow
Fig. 2b Schematic view of flow geometries with fractional dimensions, Le., dimensions intermediate to
die integer-value dimensions (reproduced from Ball et at., 1992).

«../*
t
Groundwater flow and mass transport in fractured hard rocks occur in fractures planes.The intuitive way to model flow and transport in such a system is to use a fracture orchannel network analogue (see, e.g., Long et al., 1982; Robinson, 1984; Dershowitz,1985; Cacas etal., 1990a,b; Dverstorp, 1991). However, due to the severe computationalconstraints caused by the scale of the problem relative the kind of information that isrequired for setting up a representative fracture flow geometry, different continuumapproximations are frequently used for modelling far-field groundwater flow and masstransport in fractured hard rocks.
The single-porosity approximation (Hubbcrt, 1956; Bear, 1972) and double-porosityapproximation (Barenblatt etal., 1960; Warren and Root, 1963, Duguid and Lee, 1977)represent so called deterministic continuum approaches. The approach adopted in thisstudy is the stochastic continuum method (Neuman 1987,1988), which can be lookedupon as an alternative to both the traditional effective porous medium concept and thediscrete fracture or channel analogue. Neuman (1988) advocated that packer spacingswhich exceed the mean spacing of coated fractures by not more than one order of magni-tude should yield data amenable to treatment by the stochastic continuum method on thatscale in most hard rocks.
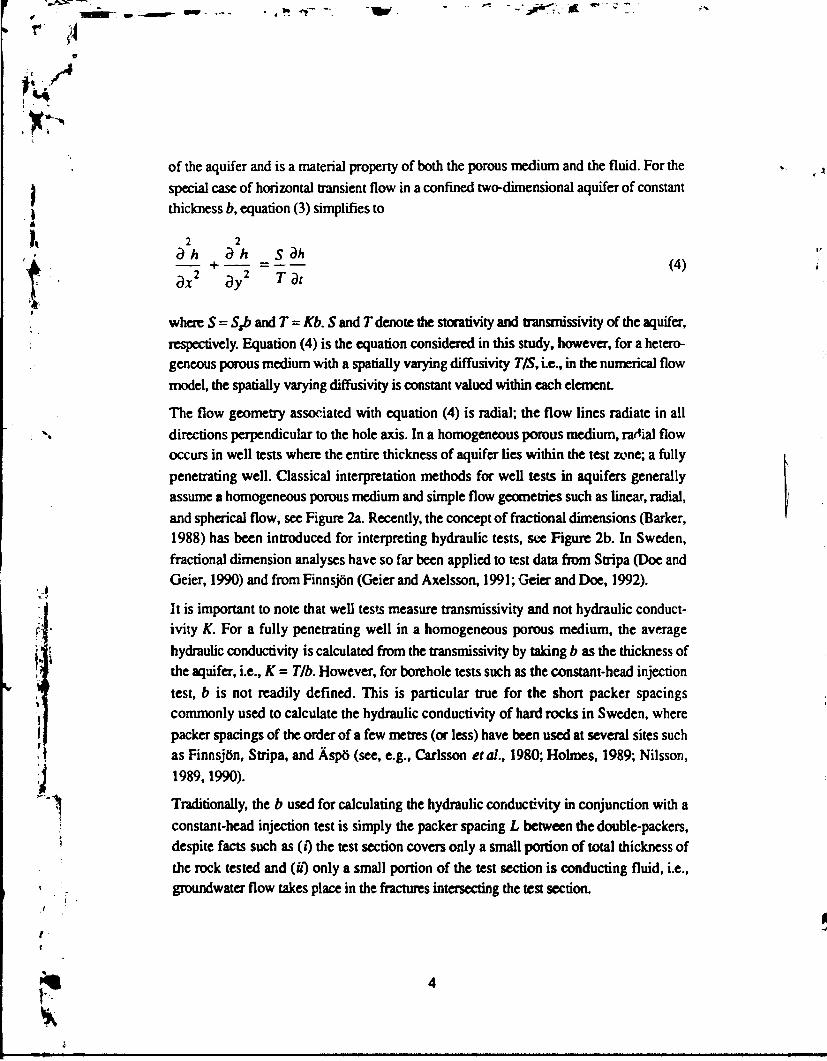
In Figures 3 and 4, transmissivities from one of the boreholes at Äspö Hard RockLaboratory are shown. The fixed-interval contant-head injection tests were run for 10minutes (ef. Nilsson, 1989). The test section length (packer spacing) was 3 m, and theinterpretations were made with Moye's formula (Moye, 1967), which can be written as
. 2(0 l+ln(L/2r )uH lit
(5)
where Tm is Moye's transmissivity, Q(t) is the volumetric flow rate of water at the end ofthe injection period, H is the excess injection head, L is the length of the test section, andrw is the borehole radius. A description of the test procedure used in Sweden in con-junction with constant-head injection tests and Moye's formula is found in, e.g., Alménet al. (1986) and Andersson etal. (1988). Moye's formula assumes:
• porous medium• steady-state flow• homogeneous hydraulic conductivity• cylindrical flow near the well and spherical flow at a distance which is related to the length of the
test section (packer spacing).
r i
0
100
200
400
500
600
-
• I I I !
I i
aii»
t $
e
o o0 »
ÖVo ° **.?...O.f..
• * -
°o o
k.ftO o
° ° 0!..9.
fi o
o»o
• • • *
O 0
>°o
>ö "o
0s
o
* io
' o
0 o,
<
° 0
....
i
....
i
....
1
....
1
....
1
....
f 1 1 1 1 I
1E-10 1E-9 1E-« 1E-7 1E-6 1E-5 1E-4
Tm , fti2/s
Fig. 3 Plot of 3 m transmissivities vs. depth for borehole KAS03 at Äspö Hard Rock Laboratory.The transmissivities are computed with Move's formula. ( = 10 minutes.
99.9
99
95
: x
I
' 20II
5
1
0.1
• •
I0
f
. . 1 . . . . 1 . . . . 1 . . É . . . . 1 . . . .
-10
Fig. 4 Normal probability plot of 3 m transmissivities for borehole KAS03 at AspO Hard RockLaboratory. The transmissivities are computed with Moye'i formula, t«10 minutes.
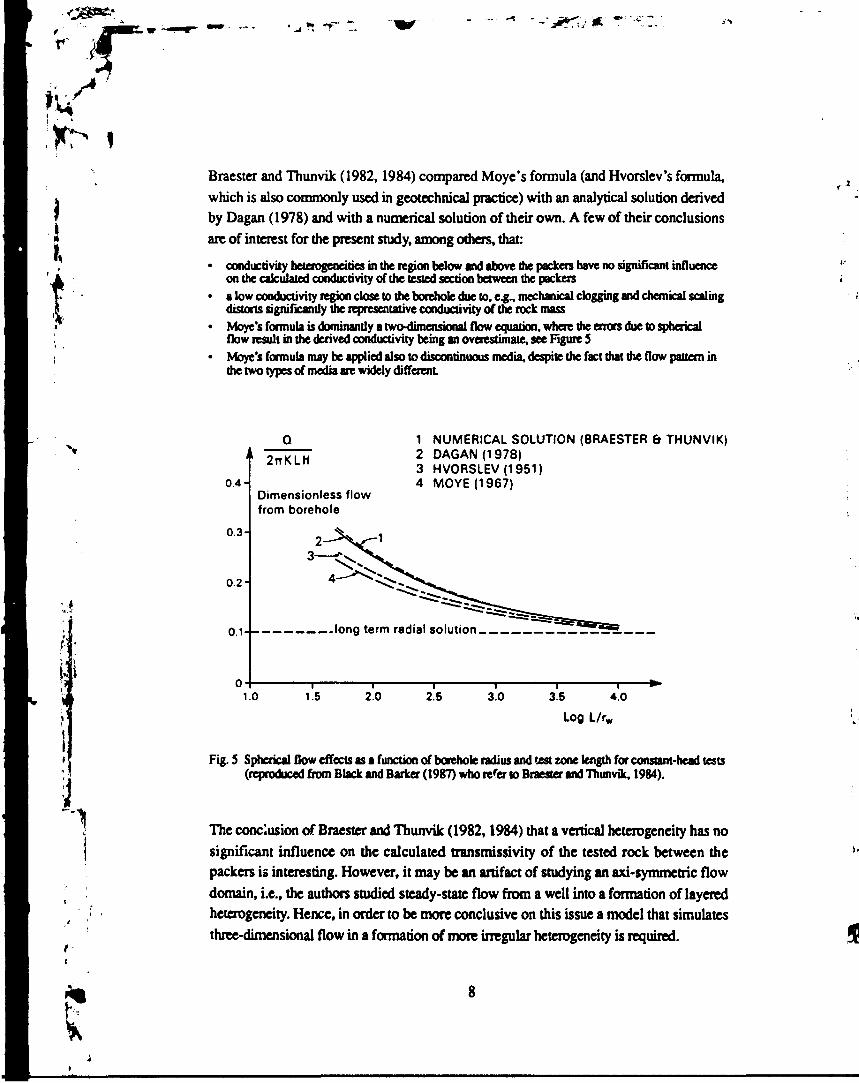
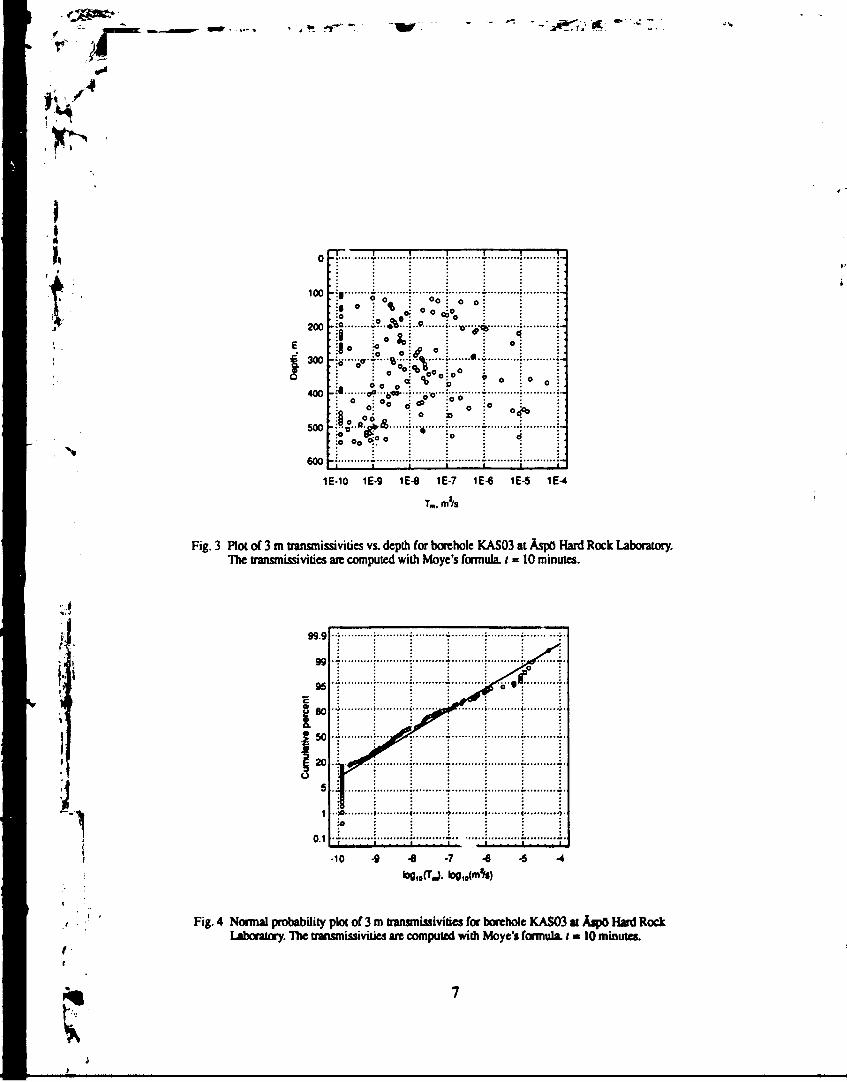
rBracster and Thunvik (1982,1984) compared Moye's formula (and Hvorslev's formula,which is also commonly used in geotechnical practice) with an analytical solution derivedby Dagan (1978) and with a numerical solution of their own. A few of their conclusionsare of interest for the present study, among others, that:
• conductivity heterogeneities in the region below and above the packets have no significant influenceon the calculated conductivity of the tested section between the packers
• a low conductivity region close to the borehole due to, e.g., mechanical clogging and chemical scalingdistorts significantly the representative conductivity of the rock mass
• Moye's formubudormnandy a twcKlmenskmalfkmflow result in the derived conductivity being an overestimate, see Figure 5
• Moye's formula may be applied also to discontinuous media, despite the fact that the flow pattern inthe two types of media are widely different
ft.
0.4-
0.3-
0.2-
0 . 1 - -
2TTKLH
Dimensionless flowfrom borehole
1 NUMERICAL SOLUTION (BRAESTER & THUNVIK)2 DAGAN (1978)3 HV0RSLEV(1951)4 MOYE(1967)
..long term radial solution
1.0 1.5 2.0 2,5 3.0 3.5 4.0
Log L/rw
Fig. S Spherical flow effects as a function of borehole radius and test zone length for constant-head tests(reproduced from Black and Barker (1987) who re'er to Braester and Thunvik, 1984).
The conclusion of Braester and Thunvik (1982,1984) that a vertical heterogeneity has nosignificant influence on the calculated transmissivity of the tested rock between thepackers is interesting. However, it may be an artifact of studying an axi-symmetric flowdomain, i.e., the authors studied steady-state flow from a well into a formation of layeredheterogeneity. Hence, in order to be more conclusive on this issue a model that simulatesthree-dimensional flow in a formation of more irregular heterogeneity is required.
, *• *r"". *:.
Figure 5 shows spherical flow effects for various test section lengths at steady-state flow.It implies that spherical flow effects increase for logx o(L/rw) £ 4, but that the phenomenon
} is comparatively unimportant Nevertheless, one may still argue that the two-dimensional« flow domain used in this study is debatable because a test section length of 3 m and a\\ borehole radius of 0.028 m yields that logx 0(L/rw) - 2 and Q/2nTmH » 0.2.
There are two pertinent conditions that may justify a two-dimensional flow model forstudying the support scale of double-packer tests. Firstly, the flow regime of a double-packer test with a short test section length is probably radial at early times rather thanspherical. Secondly, vertical boreholes intersect predominantly horizontal structures. Asan alternative to the tacit assumption that fractures can be treated as homogeneous planarstructures, the numerical flow model used in this study can also be used for studying flowin a heterogeneous fracture plane (cf. Tsang and Tsang, 1989).
Chapter 3
Numerical flow modeltThe purpose of the numerical flow model is to simulate the hydraulic response in spaceand time of a constant-head injection test between a pair of packers. The boundary condi-tions for this kind of test is readily simulated with a Dirichlet condition at the position ofthe borehole, i.e., a prescribed head corresponding to the excess injection head. TheGalerkin formulation of the finite element method to the chosen equation of groundwaterflow - equation (4) - is used together with a backward difference formulation to the timederivative of the hydraulic head. In other words, the final formulation results in ? systemof equations that can be written in matrix form as
([C] + A/ [K]) (A}, + A, = [C] {*}, + A/ [F),
where [C] and [K] are the capacitance and conductance matrices, respectively, [h] is thehydraulic head matrix, t is time, and [F) is the specified flow matrix.
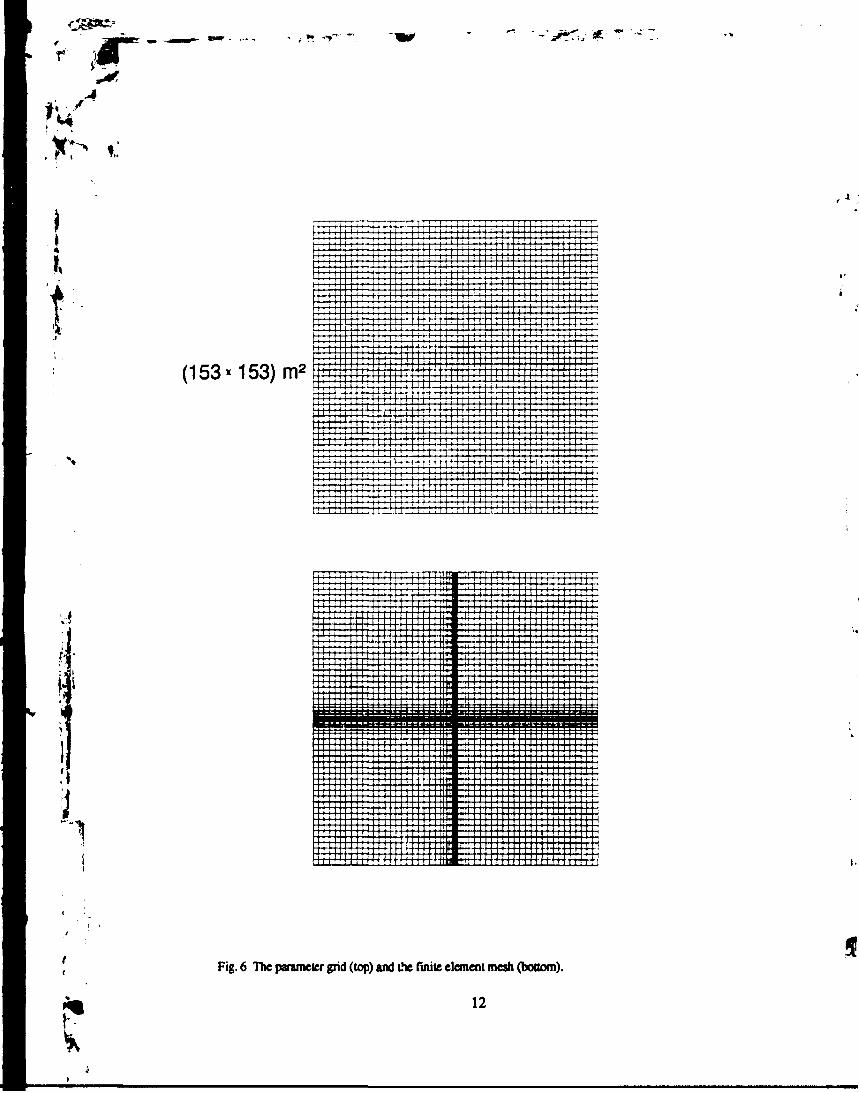
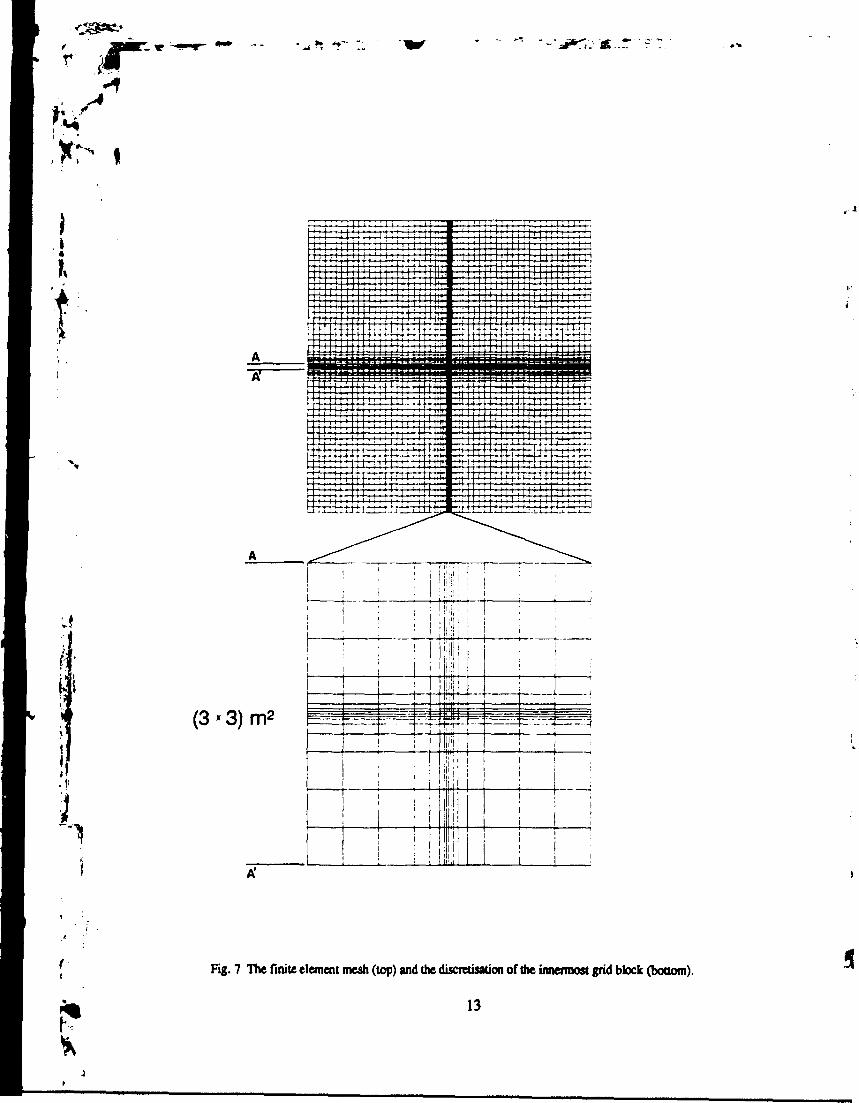
In Figures 6-8, the parameter grid and the finite element mesh are shown. The conceptualarea of the numerical flow domain is (153 m)2 corresponding to 2,601 (3 m)2 blocks, seeFigure 6. The finite element mesh consists of 5,472 bi-quadratic quadrilaterals (9 nodeLagrangian family) and the numerical integration is made with 9 Gauss integration nodes.
| The total number of nodes is 22,192. The innermost grid block is discretised into 2S2
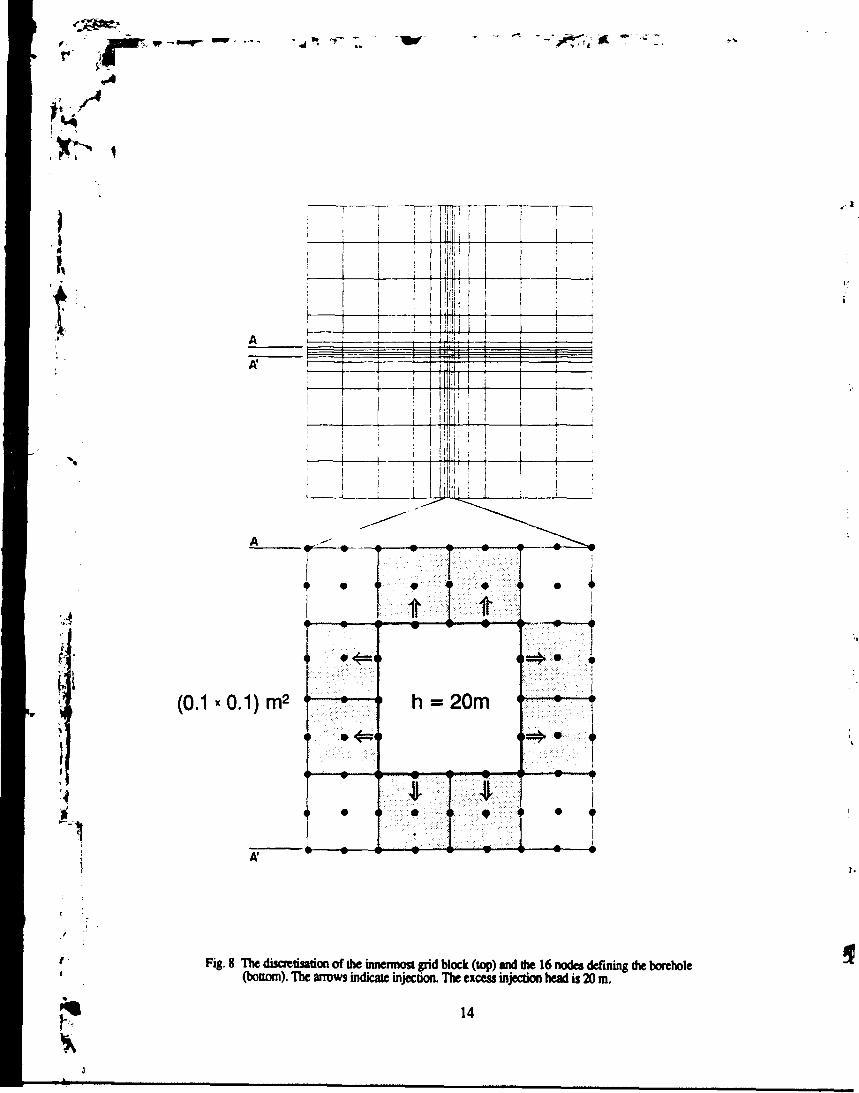
elements, see Figure 7, and has a hole in the centre representing the borehole (cf. Figure1). The borehole radius is about 0.028m, see Figure 8, which equals the nominal boreholeradius of the core drillings used within the Swedish nuclear waste repository programme.
! A logarithmic time step of Ind^^ltj) = /n(10)/5 is used, i.e., five observations per logx
] time cycle. Equation (6) is solved with a front solver (Duff, 1981). During the simulations
the hydraulic head value of the boundary nodes on the borehole perimeter is fixed to 20m, see Figure 8, which equals the excess injection head used within the Swedish nuclearwaste repository programme. The recovery period that follows after a terminated constant-head injection test is not simulated in this study.
11
JT
t(153* 153) m2
XL
t -I
4-
_--
:L
-,
TtTU-U
L
V
VuH
H
_
-
-
i
i .
-
4-
U
• H
If H
t-
H
-
-
H
- * -
-
ti
• »
. - t -
i
tr -
- ,
—i
H
( •
— -
1-
Fig. 6 The parameter grid (top) and the finite element mesh (booom).
12
^- -
»
i
.t.
A
(3 * 3) m2—
i
Jt
ii
!
!l
riff
II1i
i 'i ' ' i
\' | j;! ! i ,
Ij
l|ifcfc
JU
iII
i l11
iii
l
ju 1 !
=4=~-rrq]
i
i
i
i
A'
Fig. 7 The finite element mesh (top) and the discretisation of the innermost grid block (bottom).
13
t-
1
•J
A
A'-
|
} i L J
I
1
i!
i
ii1
ill!i i i
ii
iji
i
4=4—1—i 1— -*
A 11
<
(0 .1* 0.1) m2 (
A ' J
m <
t
i
*
t
2 0 m (
<
i
1
Fig. 8 The discretisation of the innermost grid block (top) and the 16 nodes defining the borehole(bottom). The arrows indicate injectioa The excess injection head is 20 m.
14
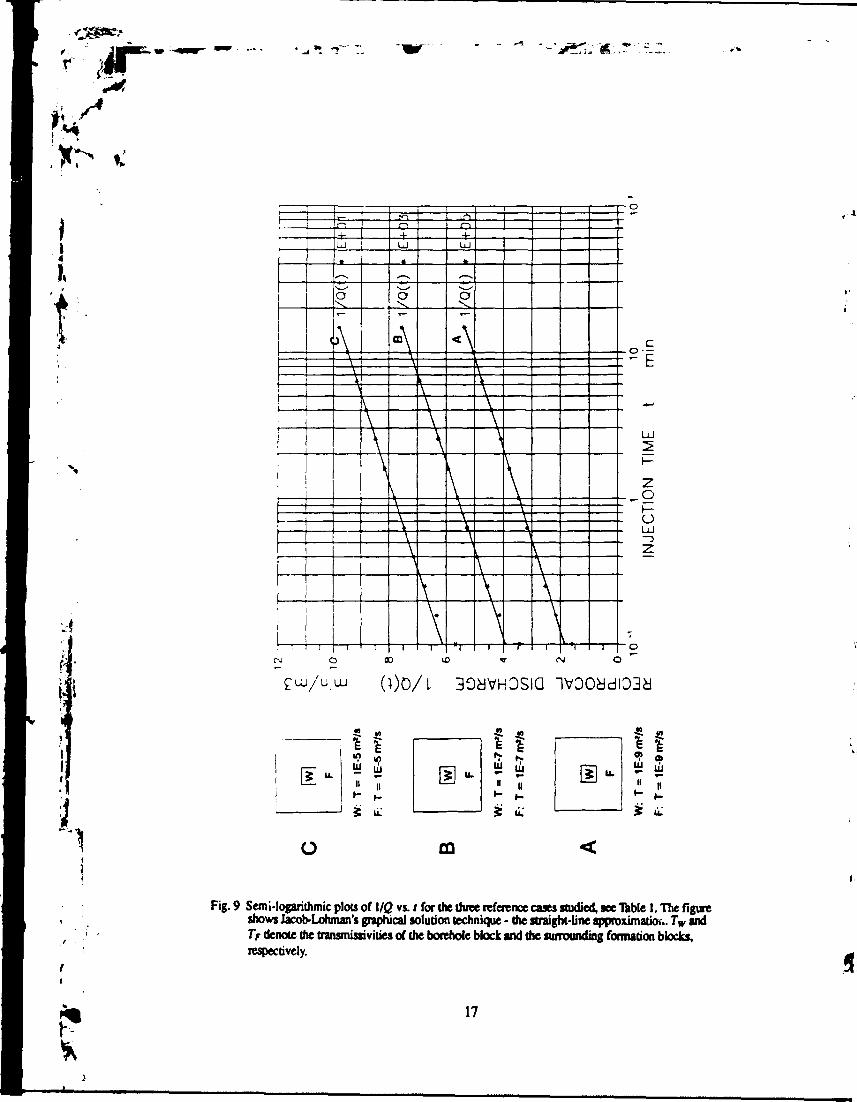
In order to verify the solutions obtained with the numerical flow model, flow rates and
\ hydraulic heads are calculated for three reference cases denoted A, B, and C, see Table 1.? The evaluation of the hydraulic properties of the flow fields simulated is made with both
Jacob-Lohman's graphical solution technique (Jacob and Lohman, 1952) and Moye's'* formula. Figure 9 shows the graphical solution technique and Figure 10 shows a plot of
Å the data in Table 1. Jacob-Lohman's formulae for calculating the transmissivity Tj and theI storativity 5, from the straight line can be written as
1 H A(l/<2(0)
% S> = -^10 ' A(t/G(0) (7b)
where A(l/g(0) is the change in flow rate during a bglQ logarithmic time cycle andl/ö(0i min is obtained by extrapolating the straight line to 1 minute. (The graphicaltechnique and formulae used (Cooper and Jacob, 1946) for interpreting the recoveryperiod (sec, e.g., Nilsson, 1989,1990) arc about die same as those of Jacob-Lohman.)
As shown in Figure 9 the duration of the injection period simulated is 15 minutes, whichequals the period of time used in conjunction with 3 m packer tests within the Swedishnuclear waste repository programme. Andersson et al. (1988) report that occasionally thetest period can be prolonged uo to 120 minutes. In a real field test situation, it is generallyimpossible to maintain a constant injection head during the first 10 to 100 seconds fromthe onset due to technical constraints, which means that the flow rates recorded during thisperiod of time are not reliable for interpretation. Therefore, whenever a transientinterpretation is desired using Jacob-Lohman's straight-line approximation, the straightline is fitted to the data recorded just before the injection test is shut-in (personalcommunications with Mr. Jan-Erik Andersson, GEOSIGMA, 1992).
According to theory equations (7a) and (7b) give reliable values of T and S provided thatthere is no borehole skin and that the dimensionless time tD = (Tt)/(Srw
2) is greater than1,000. For the three reference cases - A, B, and C - tD Z 1,000 while t Z 12.5,0.58, and0.03 minutes, respectively, and Jacob-Lohman's straight-line approximation is readilyadapted to the flow rates simulated. As shown in Table 1 and Figure 10, the values of Tand S calculated with Jacob-Lohman's equations compare well with the reference values.Thus, the implementation of the numerical flow model is considered to be verified.
i

i
t
\
"1
*
x>Tab. 1 Comparison between ihe results calculated with Jacob-Lohman's (Ty and St) and Moye's (7"J
formulae. The reference values used (T^ and S«y) are called case A, B, and C, respectively.- » • • »
Tref . Sret
CASE ( m 2 / s ) (.)
A ; 1.00E-9 9.56E-7
B 1.00E-7 4.43E-6
C j 1.00E-5 ; 2.06E-5
T,
(mz/s)
9.62E-10
9.19E-8
9.06E-6
S i
(")
8.22E-7
5.19E-6
2.79E-5
(m2/s)
1.20E-9
8.52E-6
6.57E-6
Although the flow rate is gradually decreasing with time while transient conditions areprevailing, it is generally assumed in geological and civil engineering that the inter-pretation can be made with a steady-state formula such as Moye's formula. Doe andRemer (1981) compared steady-sute flow and transient flow analyses. They concludedthat the error in assuming a steady-state flow is less than one order of magnitude forreasonable values of the storativity. As shown in Table 1 and in Figure 10, Moye'sformula gives values of the transmissivity that compare well with the three values inter-preted with Jacob-Lohman's formula.
16
I,
f
1
1
1
(
C
4-LJ
, ,,
o"
A \i
i
\
\
\
\
i
a
>"")
UJ
,_^
\
t v -\A\
1
D
\
\
\
\
\
\1
u
[—1
UJ
o
\IA\\
\
\
\
\
\i
rr
\
\
\
\
0
1
g
i
C
- O
_
o
oUJ—3
1V0Oädl33cJ
• »oUJ Lit
O CQ
Fig. 9 Semi-logarithmic plots of l/Q vs.»for the three reference cases studied, see Table 1. The figureshows Jacob-Lohman's graphical solution technique • the straight-line approumatioi.. Tw andTT denote the transmissi vities of the borehole block and the surrounding formation blocks,respectively.
17
.A
U-4
-5
t/T -6
1.6> _o -7
2 ft
S
-9
-10
-10
*•• o-A-
i A
- 1 :1
Tre,
/
/
f
i
r
* i
»r. L? :
1 2-D :1 Radial i1 Flow i
1 L = 3 m i
-9 -8 -7 -5
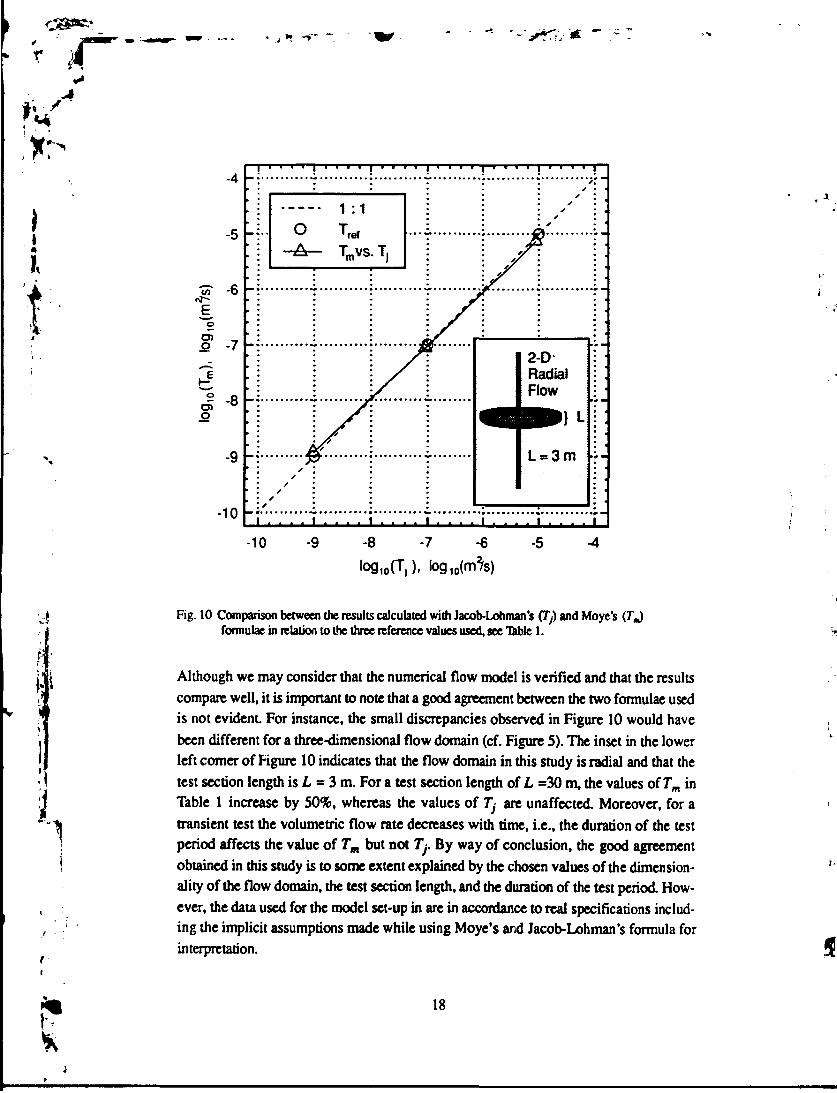
Fig. 10 Comparison between the results calculated with Jacob-Lohman's (Tj) and Moye's (7"Jformulae in relation to the three reference values used, see Table 1.
Although we may consider that the numerical flow model is verified and that the resultscompare well, it is important to note that a good agreement between the two formulae usedis not evidenL For instance, the small discrepancies observed in Figure 10 would havebeen different for a three-dimensional flow domain (cf. Figure 5). The inset in the lowerleft comer of Figure 10 indicates that the flow domain in this study is radial and that thetest section length is L = 3 m. For a test section length of L =30 m, the values of Tn inTable 1 increase by 50%, whereas the values of Tj are unaffected. Moreover, for atransient test the volumetric flow rate decreases with time, i.e., the duration of the testperiod affects the value of Tm but not Tj. By way of conclusion, the good agreementobtained in this study is to some extent explained by the chosen values of the dimension-ality of the flow domain, the test section length, and the duration of the test period. How-ever, the data used for the model set-up in are in accordance to real specifications includ-ing the implicit assumptions made while using Moye's and Jacob-Lohman's formula forinterpretation.
18

é
; • / *
Doe and Reiner (1981) concluded further that the success of applying a steady-state flowformula to some extent depend on the assumed value of the radius of influence. For
I instance, in Moye's formula the radius of influence is replaced by the length of the test• section. Thus, the geometric factor is in this case devoid of any notion about the radius of
influence, which leads to an uncertainty about the volume of rock affected. However, inThiem's formula (Thiem, 1906), which is the equation used by Doe and Reiner (1981),the radius of influence is maintained
h
i
2n H(8)
where re is the radius of influence, which in this case corresponds to the radius to an outerconstant-head boundary. Following Doe and Remer (1981), we may substitute the flowrate in equation (8) by the average flow rate injected during the simulation period in orderto calculate an estimate of re. For reference case B, see Table 1, the calculations yield thatre * 5.3 m after 15 minutes and that re • 15 m after 120 minutes of injection. For thepurpose of this study, we may compare these values with the values computed withCooper-Jacob's expression of the radius of influence valid for a constant flow rate test(Cooper and Jacob, 1946; Jacob, 1950)
iiyn ( 9 )
It is interesting to note that this expression is devoid of any notion about the flow rate.For reference case B equation (9) yields that re«- 6.8 m after 15 minutes of injection andthat re « 20 m after 120 minutes of injection. Figure 11 shows the numerical solution of
! the hydraulic head for reference case B after 15 and 120 minutes of injection, respect-
f ively. The contoured heads are chosen in a logarithmic fashion between H and 0.001//where H is the excess injection head, which in this study is set to 20 m. The two plotsshow that the numerically calculated radius of influence in each case is larger than the
"1| previous values using the assumptions and fonnulae described above. After 15 minutes ofj injection the 0.001// contour (0.02m) is at about 12 m, whereas after 120 minutes of' injection it is at about 33 m. The head values of the nodes on the outer boundary of the
numerical flow domain are unaffected. We recall that the plots in Figure 11 correspond to• . a homogeneous porous medium. The impact of heterogeneity has an unknown effect as' ; yet, although one may expect that the hydraulic conditions closest to the borehole are very, important<
^ 19

I»
f
T = 1.00E-7 m2/s S = 4.43E-6
t = 15 min
- ^ — . , , ; i i - ^
)
I * * 1 * '
1 [ I MCT^J • • i
' v ^ «« i*/1
1
1
t
' ' ' '•'' 1i1 1
-i-i
h = [20m, 7m, 2m, 0.7m, 0.2m, 0.07m, 0.02m]
t = 120 min
-t"—-TtTö-H-t-
ith
Fig. 11 Numerical calculated radii of influence fa reference case B after 15 and 120 minutes of injection,respectively. The size of each grid Mock is (3m)2.
20
3= ~
Chapter 4
i,Experimental set-up
The Monte Carlo method (see, e.g.. Peck et al, 1988; Freeze et at., 1990) is a powerfulalternative to deterministic numerical modelling of flow and mass transport in a hetero-geneous medium. Rather than depending on the detailed information about the actual fieldconditions or a number of debatable assumptions, as required by a deterministic model,the modelling is carried out under uncertainty. The turning bands method (Mantoglou andWilson, 1982) is used in this study for generating unconditional realisations of correlatedtransmissivities, whereas an ordinary random number generator (Schrage, 1969) is usedfor generating unconditional realisations of non-correlated transmissivities.
Besides studying the sensitivity to the statistical structure of the transmissivity field, thesensitivity to the transmissivity value closest to the borehole is also studied. The idea of aborehole giving direct access to virgin unaltered rock is practically a theoretical conceptIn reality, it is important to recognise that the hydraulic properties of the rock in theimmediate vicinity of the borehole are easily altered by the drilling process. Following thepetroleum terminology, this is envisaged as a "skin" and its effect on flow into or out ofthe borehole .s termed skin effect (see, e.g., Earlougher, 1977). Mathematically, the skinfactor £ can have different signs. The sign convention adopted is that a zone of reducedtransmissivity results in a positive skin factor and vice versa. For deep boreholes infractured hard rocks a negative skin effect is likely to occur due to hydraulic fracturing inconjunction with the core drilling. However, the possibility for a positive skin effect due to
i mechanical clogging by the drilling debris should not be neglected. By way of conclu-
sion, the transmissivity value in the immediate vicinity of the borehole is not necessarily
correlated with the transmissivity field of the surrounding formation.
~ll The input data to the two random number generators used for generating the transmissiv-
j ity values to die grid blocks of the numerical flow model are based on statistical analyses' of 10 -15 minutes long constant-head injection tests made with a double-packer spacing
of 3 m. The transmissivity values used in this study to derive a characteristic mean,variance, and covariance function are interpreted with Moye's formula and come fromfield tests made at the Finnsjön study site and the Äspö Hard Rock Laboratory (see, e.g.,Nilsson, 1989, 1990; Gustafson et al., 1989; Cvetkovic and Kung, 1989; Liedholm,
te 21
1991a,b). The input data derived compare well with the hydraulic conditions at theSwedish study sites in fractured hard rocks in general (for a statistical overview, seeWinberg, 1989).
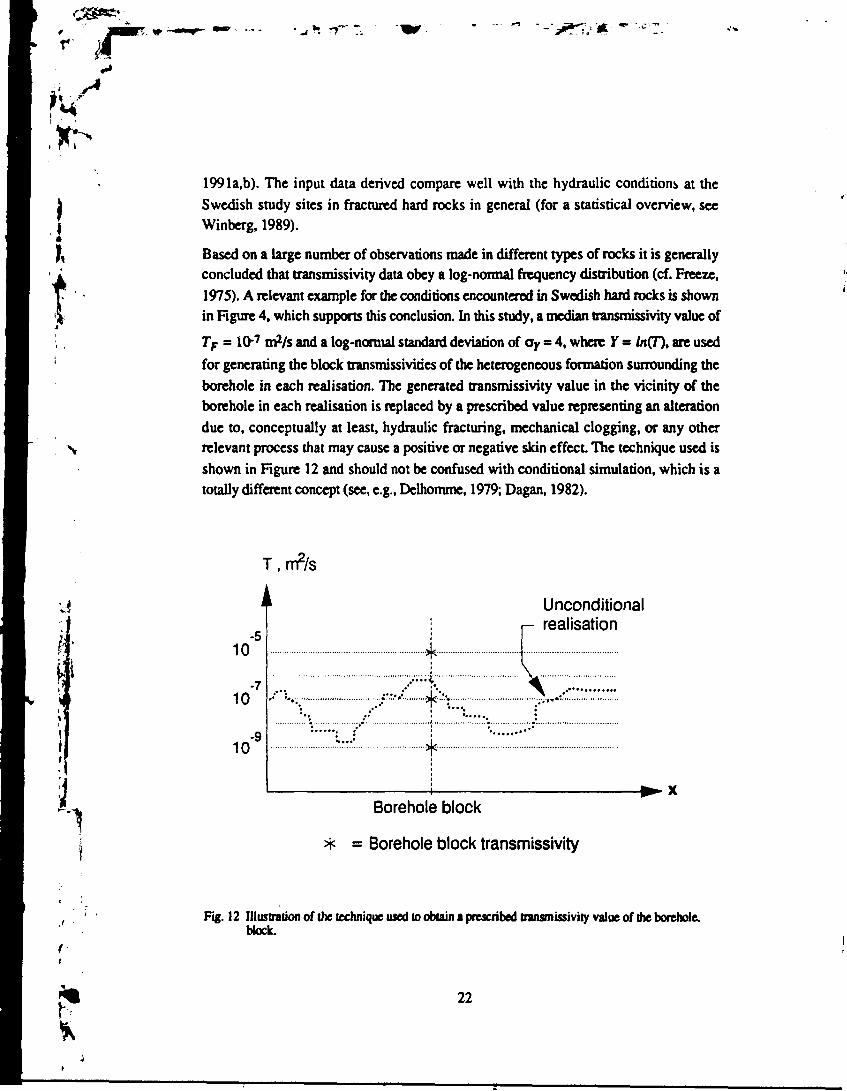
Based on a large number of observations made in different types of rocks it is generallyconcluded that transmissivity data obey a log-normal frequency distribution (cf. Freeze,1975). A relevant example for the conditions encountered in Swedish hard rocks is shownin Figure 4, which supports this conclusion. In this study, a median transmissivity value of
TF = 1O7 rhtys and a log-normal standard deviation of aY - 4, where Y = ln(T), are usedfor generating the block transmissivities of the heterogeneous formation surrounding theborehole in each realisation. The generated transmissivity value in the vicinity of theborehole in each realisation is replaced by a prescribed value representing an alterationdue to, conceptually at least, hydraulic fracturing, mechanical clogging, or any otherrelevant process that may cause a positive or negative skin effect The technique used isshown in Figure 12 and should not be confused with conditional simulation, which is atotally different concept (see, e.g., Delhomme, 1979; Dagan, 1982).
i
T.nf/s
10
10
10
Unconditional
-5
-7
-9
••••• ...
i— icauocuivji i
1
s»-i <*•• -?|C'—j ;• ;•«**
' *•••"•• t
i '• '
j
Borehole block
Borehole block transmissivity
Fig. 12 Illustration of the technique used to obtain a prescribed transmissivity value of the borehole,block.
22
<"S$«£*
t
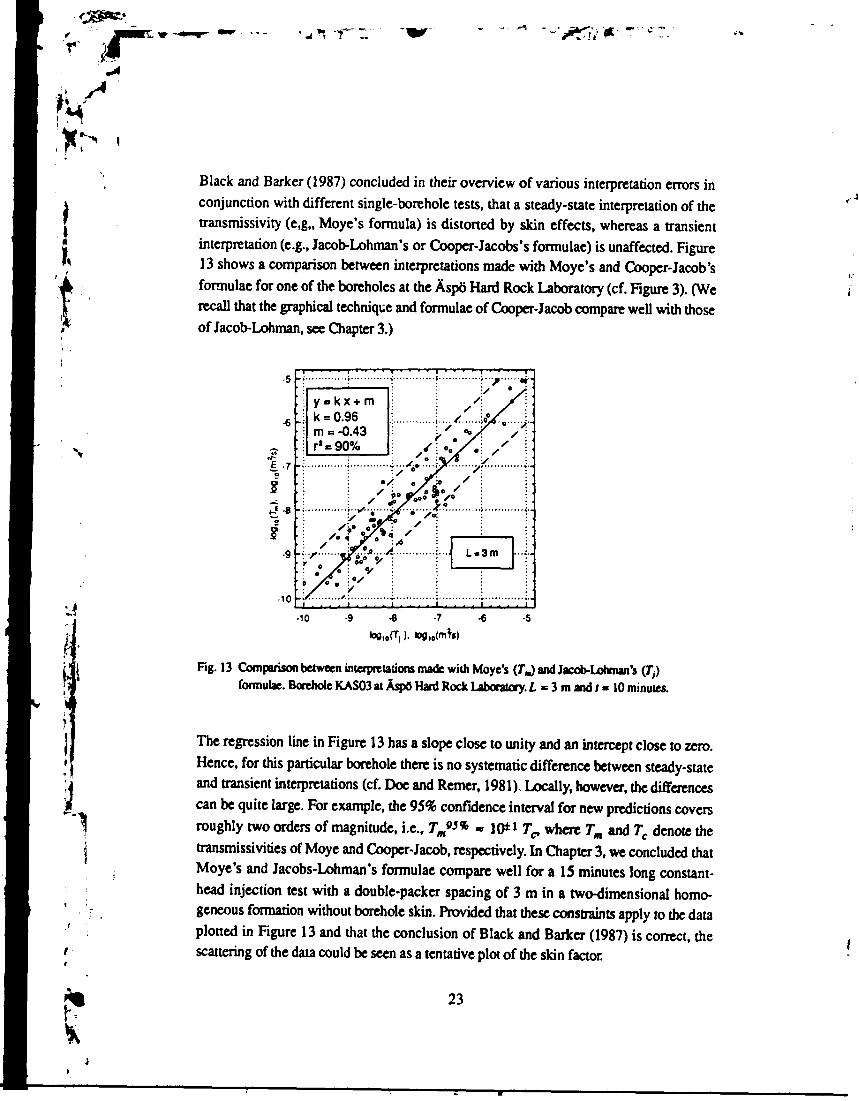
Black and Barker (1987) concluded in their overview of various interpretation errors in
conjunction with different single-borehole tests, that a steady-state interpretation of the
transmissivity (e.g., Moye's formula) is distorted by skin effects, whereas a transient
interpretation (e.g., Jacob-Lohman's or Cooper-Jacobs's formulae) is unaffected. Figure
13 shows a comparison between interpretations made with Moye's and Cooper-Jacob's
formulae for one of the boreholes at the Äspö Hard Rock Laboratory (cf. Figure 3). (We
recall that the graphical technique and formulae of Cooper-Jacob compare well with those
of Jacob-Lohman, see Chapter 3.)
§•7
33-8
i•9
•10
y -k =mr*«
kx + m0.96
= -0.43= 90%
Fig. 13 Comparison between interpretations made with Moye's (7"J and Jacob-Lohman's (7))formulae. Borehole KAS03 at Äspö Hard Rock Laboratory. L = 3 m and t« 10 minutes.
The regression line in Figure 13 has a slope close to unity and an intercept close to zero.
Hence, for this particular borehole there is no systematic difference between steady-state
and transient interpretations (cf. Doe and Remer, 1981), Locally, however, the differences
can be quite large. For example, the 95% confidence interval for new predictions covers
roughly two orders of magnitude, i.e., T m « * - 10*1 Ta where Tm and Tc denote the
transmissivities of Moye and Cooper-Jacob, respectively. In Chapter 3, we concluded that
Moye's and Jacobs-Lohman's formulae compare well for a 15 minutes long constant-
head injection test with a double-packer spacing of 3 m in a two-dimensional homo-
geneous formation without borehole skin. Provided that these constraints apply to the data
plotted in Figure 13 and that the conclusion of Black and Barker (1987) is correct, the
scattering of the data could be seen as a tentative plot of the skin factor.
23
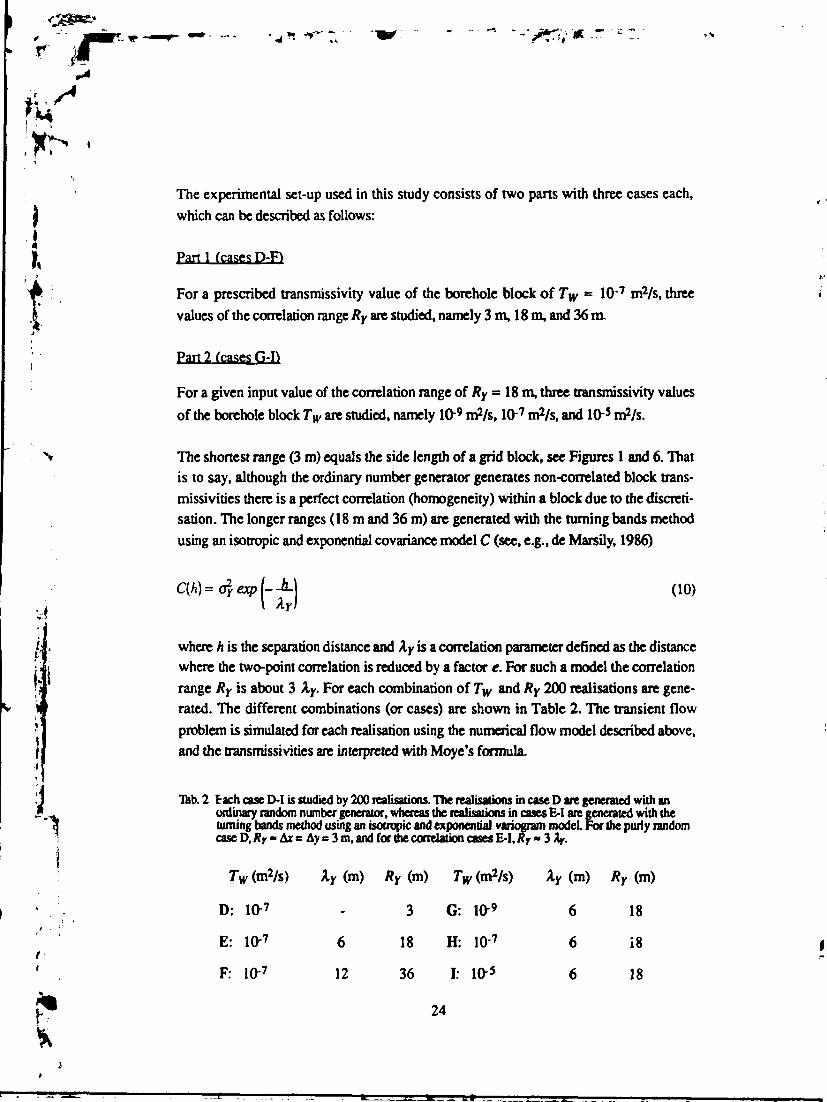
The experimental set-up used in this study consists of two pans with three cases each,
which can be described as follows:
Part 1 (cases D-F)
For a prescribed transmissivity value of the borehole block of 7V = 1 0 7 m2/s, three
values of the correlation range Ry are studied, namely 3 m, 18 m, and 36 m
Part 2 (cases G-I)
For a given input value of the correlation range of Ry - 18 m, three transmissivity values
of the borehole block Tw are studied, namely 10-' rrf/s, 10-7 rr^/s, and 10"5 rritys.
The shortest range (3 m) equals the side length of a grid block, see Figures 1 and 6. Thatis to say, although the ordinary number generator generates non-correlated block trans-missivities there is a perfect correlation (homogeneity) within a block due to the discreti-sation. The longer ranges (18 m and 36 m) are generated with the turning bands methodusing an isotropic and exponential covariance model C (see, e.g., de Marsily, 1986)
(10)
where h is the separation distance and Ay is a correlation parameter defined as the distancewhere the two-point correlation is reduced by a factor e. For such a model the correlationrange Ry is about 3 Ay. For each combination of Tw and Ry 200 realisations are gene-rated. The different combinations (or cases) are shown in Table 2. The transient flowproblem is simulated for each realisation using the numerical flow model described above,
| and the transmissivities are interpreted with Moye's formula,i
'1 Tab. 2 Each case D-I is studied by 200 realisations. The realisations in case D are generated with anordinary random number generator, whereas the realisations in cases E-I are generated with the
S turning bands method using an isotropic and exponential variogram model For the puriy random<ra D,/?r* Ax s A? = 3 m.aitffw the correlation cases E-I, A r " 3 A?.
1Tw (m2/s) Ay (m) Ry (m) Tw (rr^/s) Ay (m) RY (m)
D: 10-7 - 3 G: lfr9 6 18
E: 10-7 6 18 H: 10 7 6 18
. F: 10-7 12 36 I: lfr5 6 18
24

•
As mentioned above, the input data to the two random number generators used for
generating the transmissivity values to the numerical flow model are based on statistical
) analyses of transmissivity measurements made with a double-packer spacing of 3 m.
l Thus, the conceptual thickness of the two-dimensional horizontal slab is 3 m as well (cf.
Figure 1) although the thickness of the slab as such is unimportant for the mathematical
formulation of the problem. However, using input data derived from statistical analyses of
an essential vertically orientated piece of information, i.e., measurements in vertical and
sub-vertical boreholes, for generating a heterogeneous medium in a horizontal plane,
implies that we indirectly assume that the statistical structures reported in the literature are
statistically isotropic. The latter assumption cannot be verified in general due to iack of
data. According to Winberg (1991), a geostatistical analysis of transmissivity data from
boreholes of varying orientation in the Stripa mine, indicates a statistically isotropic co-
variance structure.
We consider it important to stress that a consistent geostatistical analysis of borehole
transmissivity data implies that: (0 the transmissivities have a constant support scale, e.g.,
a constant radius of influence, and (it) transmissivity heterogeneities in the region below
and above each test section have no significant influence on the transmissivity of the
tested section between the packers. However, none of these conditions is evident. In
particular, the assumption about a constant support scale is debatable.
Besides the transmissivity field, the storativity field is also considered to be hetero-
geneous in the present study. Rock compressibility data given by de Marsily (1986) are
used in combination with an empirical relationship between the hydraulic conductivity K
and the effective porosity 0 of the rock mass of Swedish hard rocks suggested by
Winberg et al. (1990) who refer to data reported by Carlsson and Olsson (1981)
il= 0.34 ln(K) (11)
The resulting positive 3V relationship between the log-storativity and the log-transmissiv-
ity fields is shown in Figure 14. By way of conclusion, the random variable in this study
is not the transmissivity but the diffusivity TIS. Field observations of the storativity in
fractured hard rocks are very sparse, but the 3V relationship between S and T shown in
Figure 14 is considered to be relevant for the conditions at the Finnsjön study site
(personal communications with Mr. Jan-Erik Andersson, GEOSIGMA, 1992).
Following equation (9), rt is proportional to V(r/S). For a 3V relationship between 5 and
T we may therefore expect, at least as a working hypothesis, that re « 3Vj. If a relation-
25

fl
é
ship of this order is assumed to be appropriate for the natural conditions in fractured hardrocks, re will vary with two orders of magnitude when T varies six orders of magnitude.According to the transmissivity data shown in Figure 3, such a range in T is not irrelevantConsequently, the doubts raised in this study about a spatially varying support scale inconjunction with conventional double-packer tests are considered to be justified.
-5
W -6
-7 -
-8 -
T T T T T i I t | I
-14 -13 -12 -11 -10 -9 -8 -7 -6 -5
Fig. 14 Assumed relationship between the storaovity and the transmissivity fields.
26
i
Chapter 5
Data interpretation
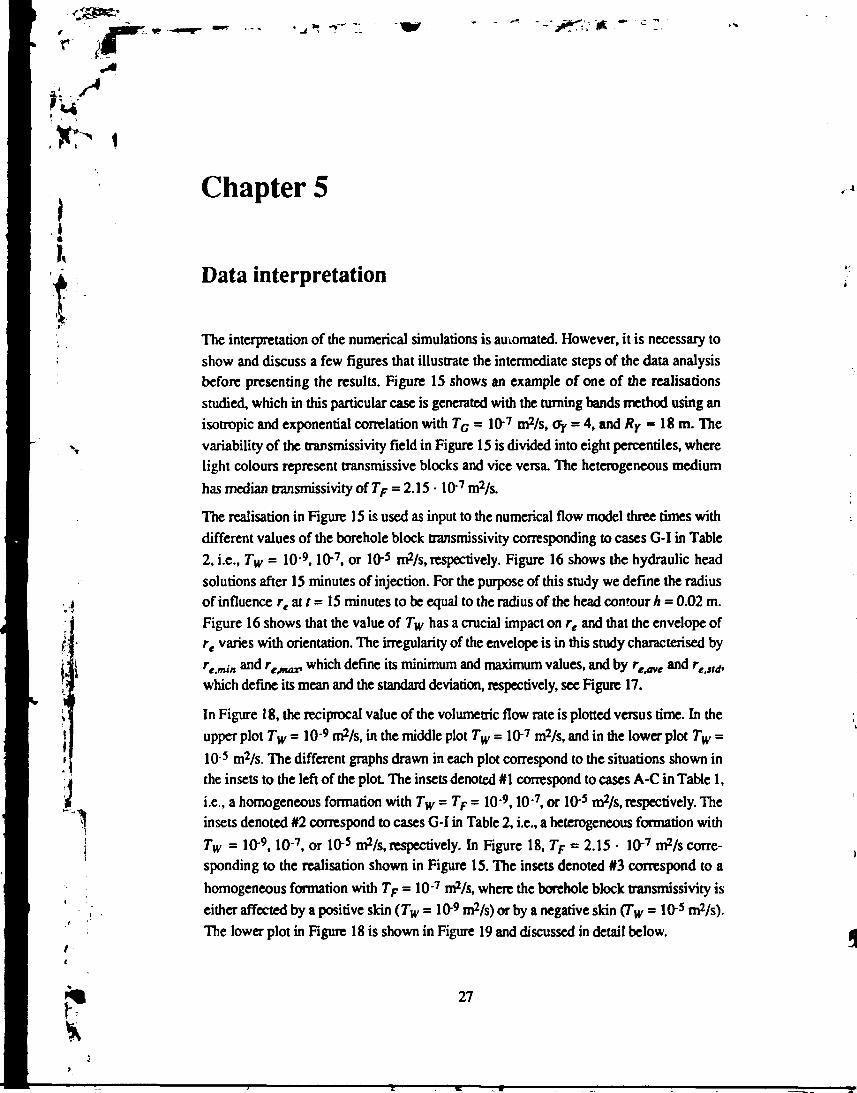
The interpretation of the numerical simulations is automated. However, it is necessary toshow and discuss a few figures that illustrate the intermediate steps of the data analysisbefore presenting the results. Figure 15 shows an example of one of the realisationsstudied, which in this particular case is generated with the turning bands method using anisotropic and exponential correlation with TG = 10"7 rr^/s, oy = 4, and Ry » 18 m. Thevariability of the transmissivity field in Figure 15 is divided into eight pcrcentiles, wherelight colours represent transmissive blocks and vice versa. The heterogeneous mediumhas median transmissivity of TF = 2.15 • 10*7 m2/s.
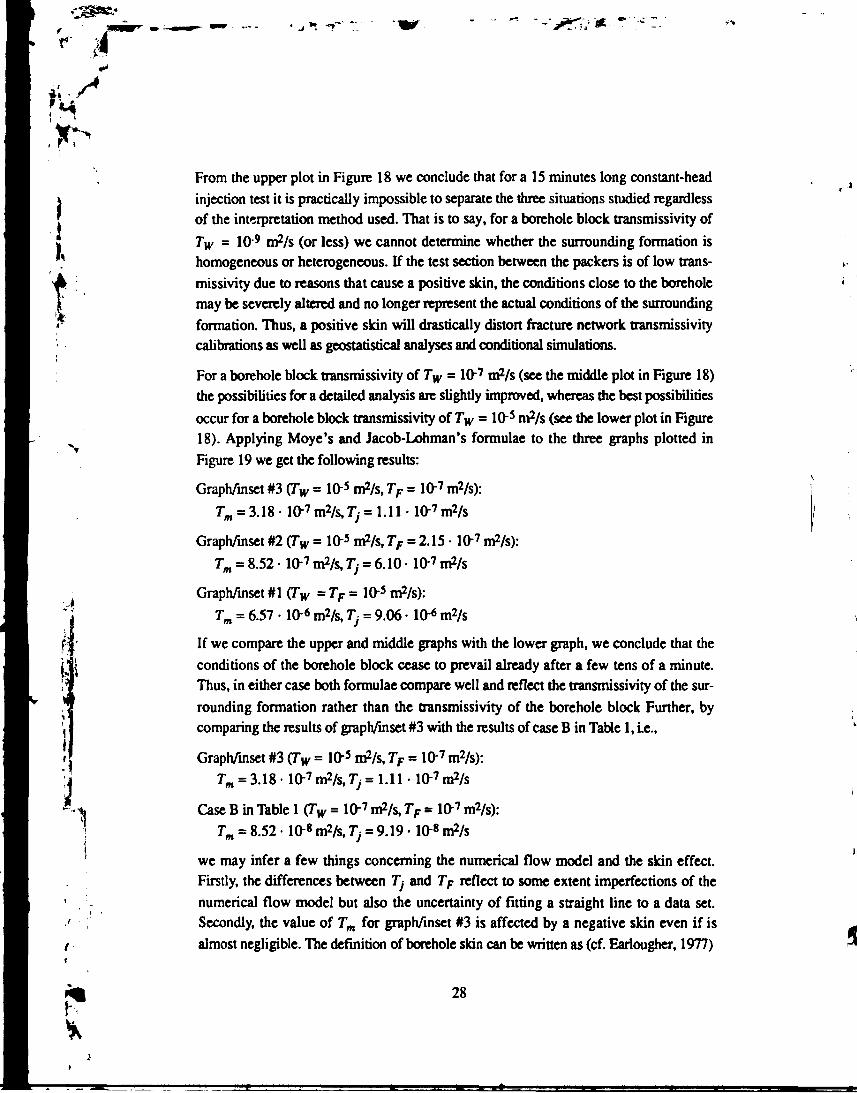
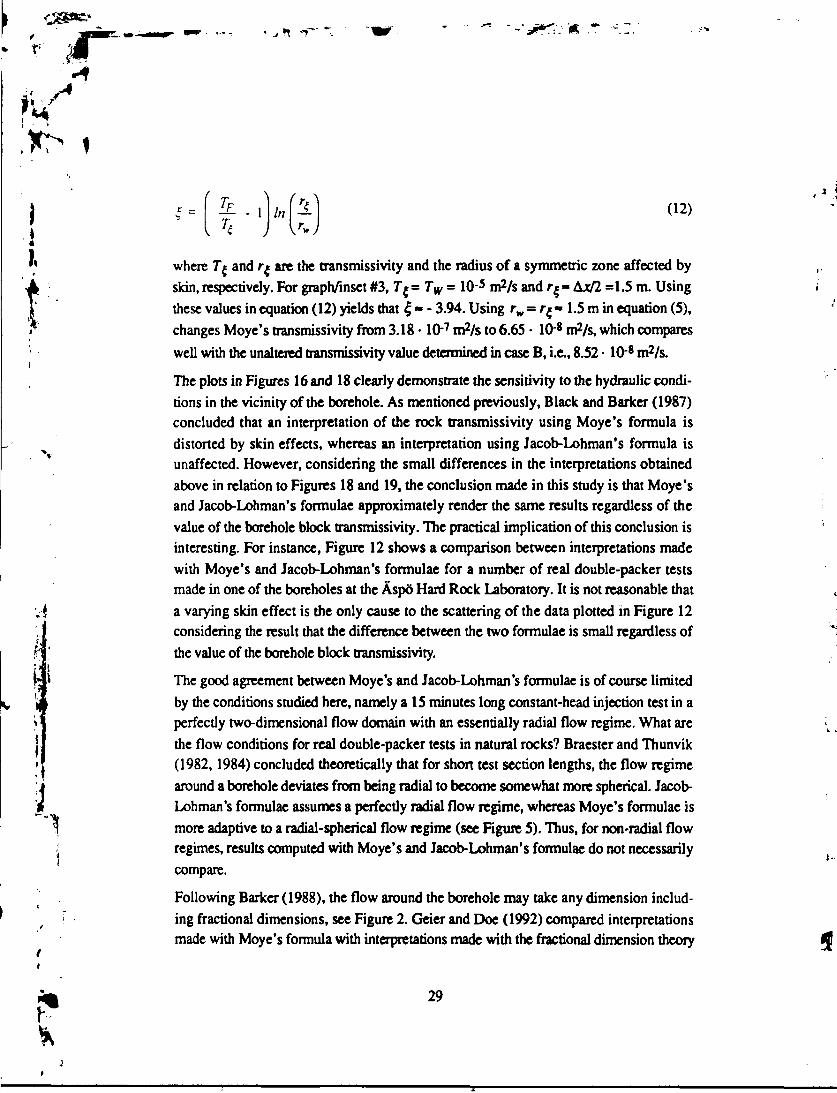
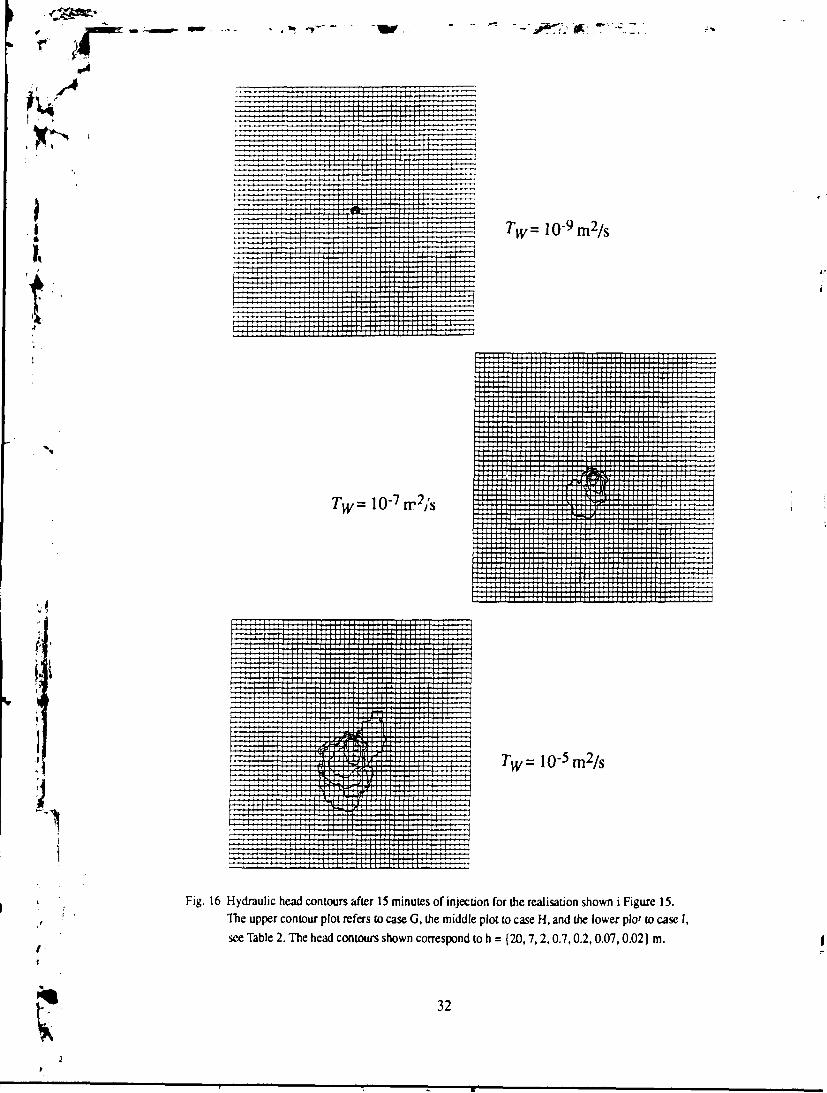
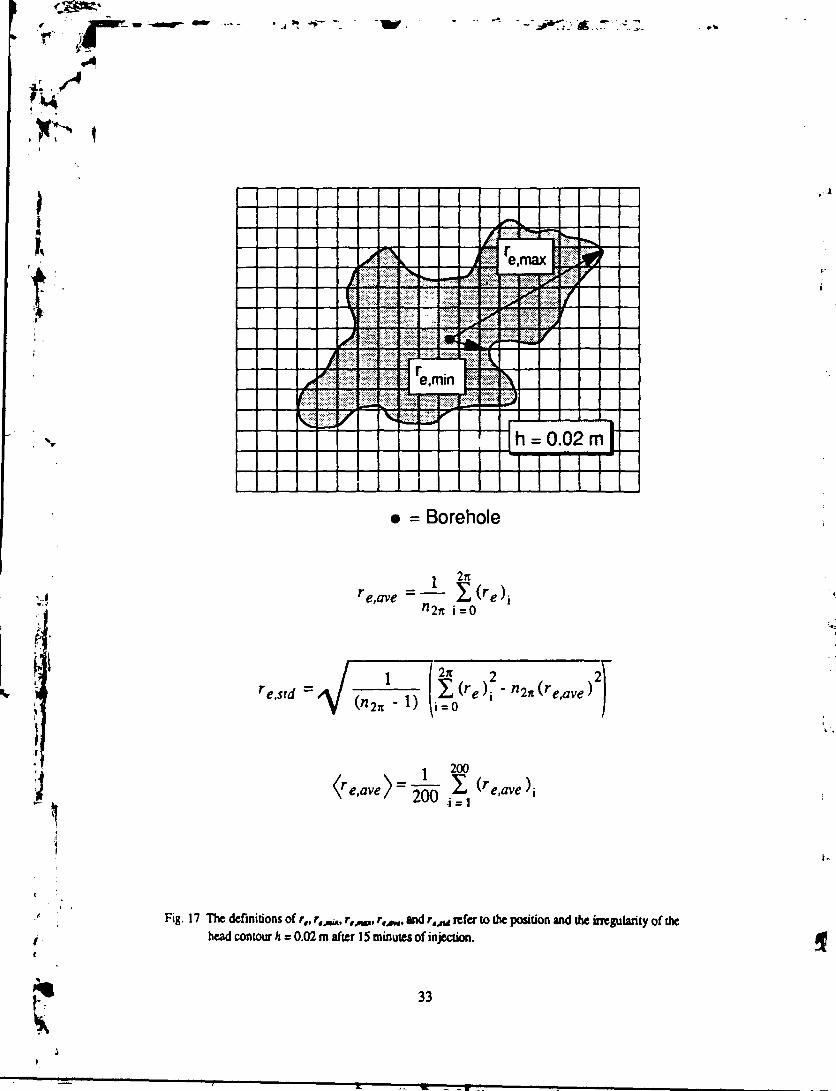
The realisation in Figure 15 is used as input to the numerical flow model three times withdifferent values of the borehole block transmissivity corresponding to cases G-I in Table2, i.e., Tw = 10"9,10"7, or 10"5 rritys, respectively. Figure 16 shows the hydraulic headsolutions after 15 minutes of injection. For the purpose of this study we define the radiusof influence re at t - 15 minutes to be equal to the radius of the head contour h = 0.02 m.Figure 16 shows that the value of Tw has a crucial impact on re and that the envelope ofre varies with orientation. The irregularity of the envelope is in this study characterised byre.min dn^ rejnax> which define its minimum and maximum values, and by r€jme and restd,
which define its mean and the standard deviation, respectively, see Figure 17.
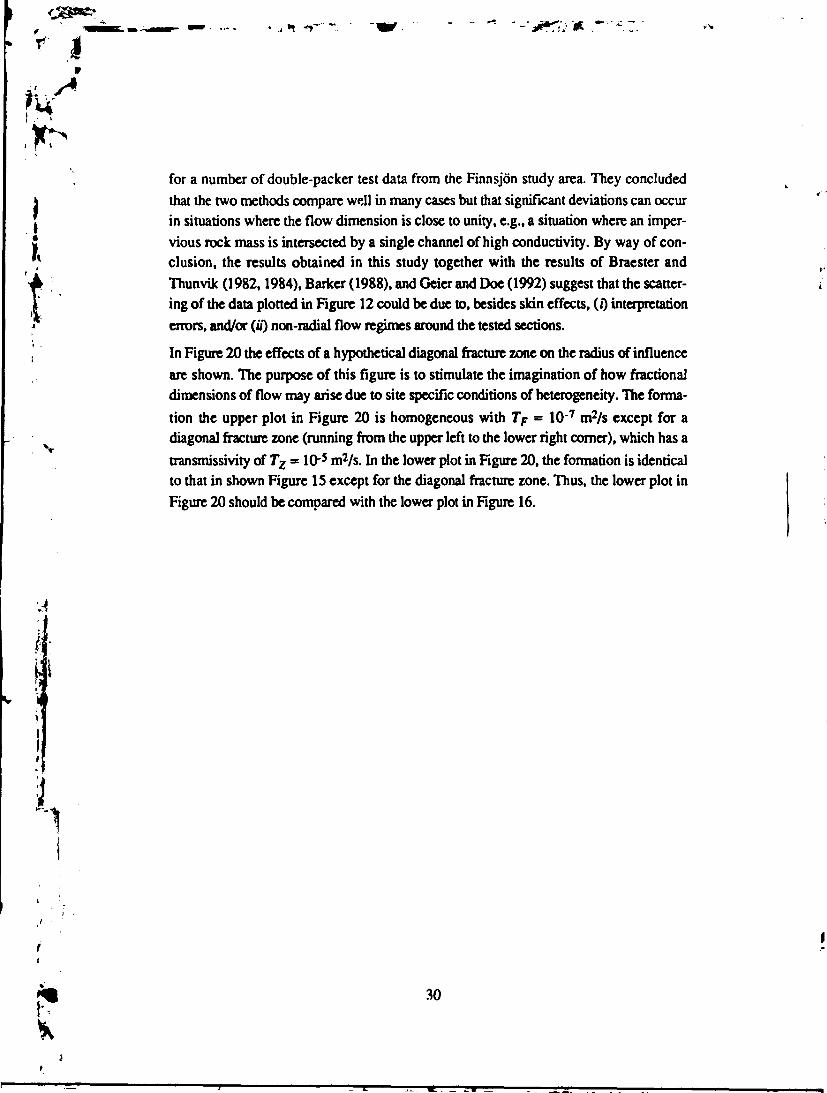
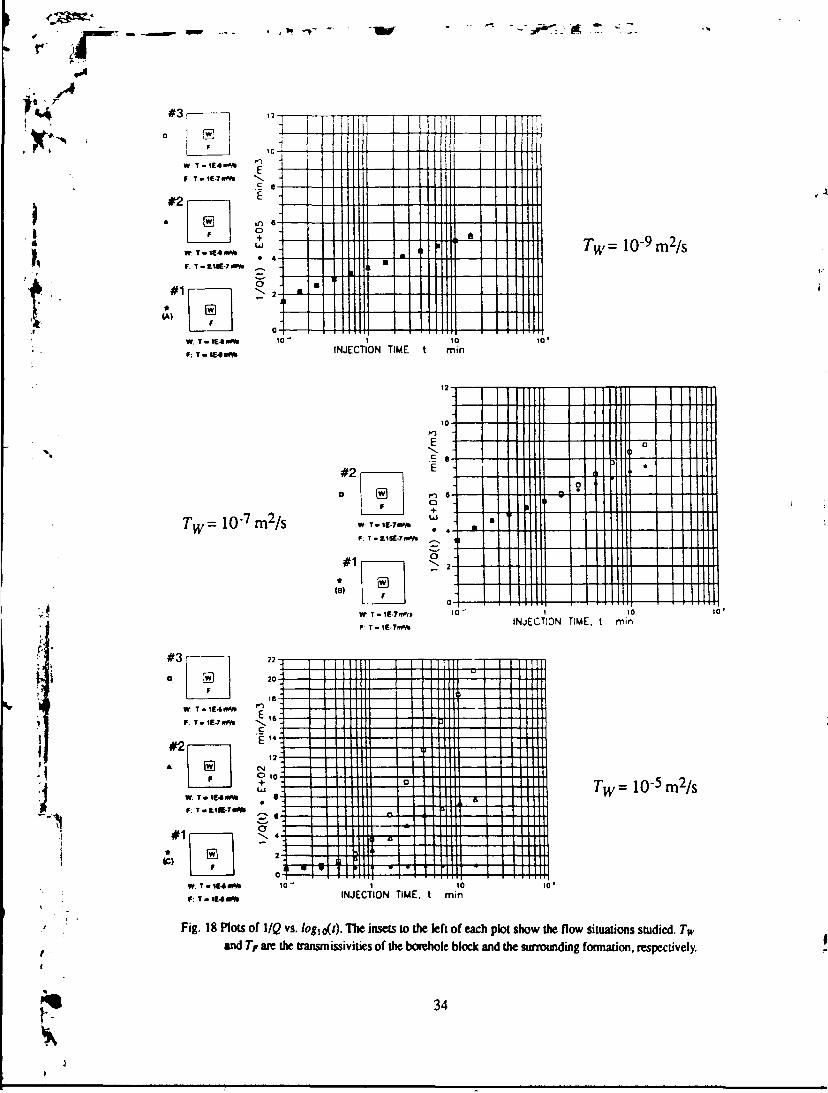
In Figure 18, the reciprocal value of the volumetric flow rate is plotted versus time. In the
upper plot Tw = 1 0 9 mtys, in the middle plot Tw = 10"7 m2/s, and in the lower plot Tw =
10 s m2/s. The different graphs drawn in each plot correspond to the situations shown in
the insets to the left of the plot The insets denoted #1 correspond to cases A-C in Table 1,
i.e., a homogeneous formation with Tw = TF = 10*9,107, or 10"5 mtys, respectively. The
insets denoted #2 correspond to cases G-I in Table 2, i.e., a heterogeneous formation with
Tw = 10-9,10-7, or 10-5 rrP/s, respectively. In Figure 18,7> = 2.15 • 10"7 mVs corre-
sponding to the realisation shown in Figure 15. The insets denoted #3 correspond to a
homogeneous formation with TF = 1 0 7 irP/s, where the borehole block transmissivity is
either affected by a positive skin (Tw = 10-9 m2/s) or by a negative skin (Tw = 10-5 mtys).
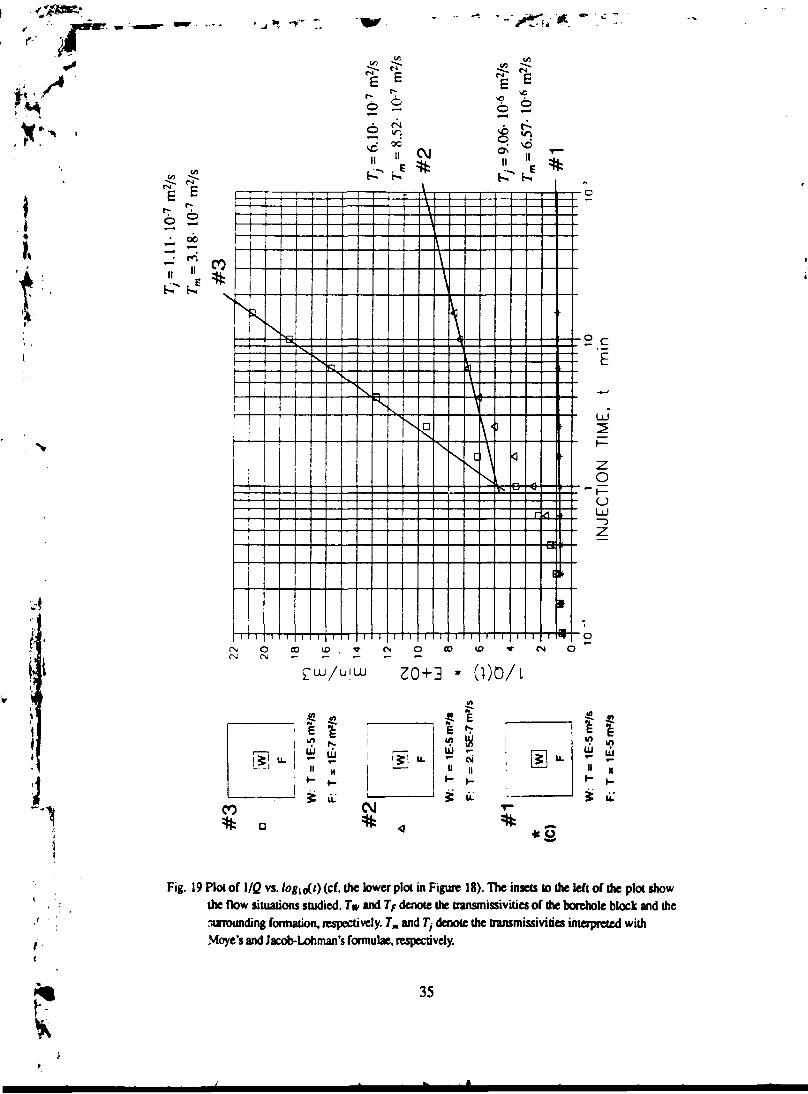
The lower plot in Figure 18 is shown in Figure 19 and discussed in detail below.
27
From the upper plot in Figure 18 we conclude that for a 15 minutes long constant-headinjection test it is practically impossible to separate the three situations studied regardlessof the interpretation method used. That is to say, for a borehole block transmissivity ofTw = 10 9 rrP/s (or less) we cannot determine whether the surrounding formation ishomogeneous or heterogeneous. If the test section between the packers is of low trans-missivity due to reasons that cause a positive skin, the conditions close to the boreholemay be severely altered and no longer represent the actual conditions of the surroundingformation. Thus, a positive skin will drastically distort fracture network transmissivitycalibrations as well as geostatistical analyses and conditional simulations.
For a borehole block transmissivity of Tw = 10~7 mtys (see the middle plot in Figure 18)the possibilities for a detailed analysis are slightly improved, whereas the best possibilitiesoccur for a borehole block transmissivity of Tw = 10"5 nfi/s (see the lower plot in Figure18). Applying Moye's and Jacob-Lohman's formulae to the three graphs plotted inFigure 19 we get the following results:
Graph/inset #3 (Jw = lfr5 rrP/s, 7> = 10"7 m2/s):
Tm = 3.18 • 10-7 m2/s, Tj = 1.11 • lfr7 iritys
Graph/inset #2 (Tw = 10"5 nitys, 7> = 2.15 • lfr7 m2/s):
Tm = 8.52 • 10-7 m2/s, 7) = 6.10 • 10-7 iritys
Graph/inset #1 (Tw = 7> = 10*5 rrf/s):
Tm = 6.57 • 10-6 m2/s, Tj = 9.06 • 10"6 m2/s
If we compare the upper and middle graphs with the lower graph, we conclude that theconditions of the borehole block cease to prevail already after a few tens of a minute.Thus, in either case both formulae compare well and reflect the transmissivity of the sur-rounding formation rather than the transmissivity of the borehole block Further, bycomparing the results of graph/inset #3 with the results of case B in Table 1, i.e.,
Graph/inset #3 (Tw = 10"5 rrP/s, 7> = 10"7 m2/s):Tm = 3.18 • 10"7 m2/s, Tj = 1.11 • 10-7 irP/s
Case B in Table 1 (Tw = l^ 7 m2/^ TF = lfr7 m2/s):Tm = 8.52 • 10-8 m2/s, Tj = 9.19 • lfr8 m2/s
we may infer a few things concerning the numerical flow model and the skin effect.Firstly, the differences between Tj and 7> reflect to some extent imperfections of thenumerical flow model but also the uncertainty of fitting a straight line to a data set.Secondly, the value of Tm for graph/inset #3 is affected by a negative skin even if isalmost negligible. The definition of borehole skin can be written as (cf. Earlougher, 1977)
28
;£
i c - \ lF i ; '? (\2)
" where T; and r* are the transmissivity and the radius o f a symmetric zone affected by•A skin, respectively. For graph/inset #3 , T$ = Tw = 1 0 5 n^/s and r% « AJC/2 =1.5 m. Using1' these values in equation (12) yields that £ •> - 3.94. Using rw = r^ - 1.5 m in equation (5),* changes Moye's transmissivity from 3.18 • 10-7 m2 /s to 6.65 • l(h8 mtys, which compares
well with the unaltered transmissivity value determined in case B, i.e., 8.52 • 10*8 mtys.
The plots in Figures 16 and 18 clearly demonstrate the sensitivity to the hydraulic condi-tions in the vicinity of the borehole. As mentioned previously. Black and Barker (1987)concluded that an interpretation of the rock transmissivity using Moye's formula isdistorted by skin effects, whereas an interpretation using Jacob-Lohman's formula isunaffected. However, considering the small differences in the interpretations obtainedabove in relation to Figures 18 and 19, the conclusion made in this study is that Moye'sand Jacob-Lohman's formulae approximately render the same results regardless of thevalue of the borehole block transmissivity. The practical implication of this conclusion isinteresting. For instance, Figure 12 shows a comparison between interpretations madewith Moye's and Jacob-Lohman's formulae for a number of real double-packer testsmade in one of the boreholes at the Äspö Hard Rock Laboratory. It is not reasonable that
•J, a varying skin effect is the on ly cause to the scattering o f the data plotted in Figure 12considering the result that the difference be tween the t w o formulae is small regardless o fthe value o f the borehole block transmissivity.
The good agreement between M o y e ' s and Jacob-Lohman's formulae is of course l imitedby the conditions studied here, namely a 15 minutes long constant-head injection test in aperfectly two-dimensional f low domain with an essential ly radial f low regime. What arethe f low condit ions for real double-packer tests in natural rocks? Braester and Thunvik(1982,1984) concluded theoretically that for short test section lengths, the flow regimearound a borehole deviates from being radial to become somewhat more spherical. Jacob-
i Lohman's formulae assumes a perfectly radial flow regime, whereas Moye's formulae is
i more adaptive to a radial-spherical flow regime (see Figure 5). Thus, for non-radial flow. regimes, results computed with Moye's and Jacob-Lohman's formulae do not necessarily
compare.
Following Barker (1988), the flow around the borehole may take any dimension includ-
' ' • ing fractional dimensions, see Figure 2. Geier and Doe (1992) compared interpretationsmade with Moye's formula with interpretations made with the fractional dimension theory
29
t.**i
for a number of double-packer test data from the Finnsjön study area. They concluded
\ that the two methods compare well in many cases but that significant deviations can occurI in situations where the flow dimension is close to unity, e.g., a situation where an imper-
j vious rock mass is intersected by a single channel of high conductivity. By way of con-7 elusion, the results obtained in this study together with the results of Braester and
A Thunvik (1982,1984), Barker (1988), and Geier and Doe (1992) suggest that the scatter-V ing of the data plotted in Figure 12 could be due to, besides skin effects, (i) interpretation* errors, and/or (u) non-radial flow regimes around the tested sections.
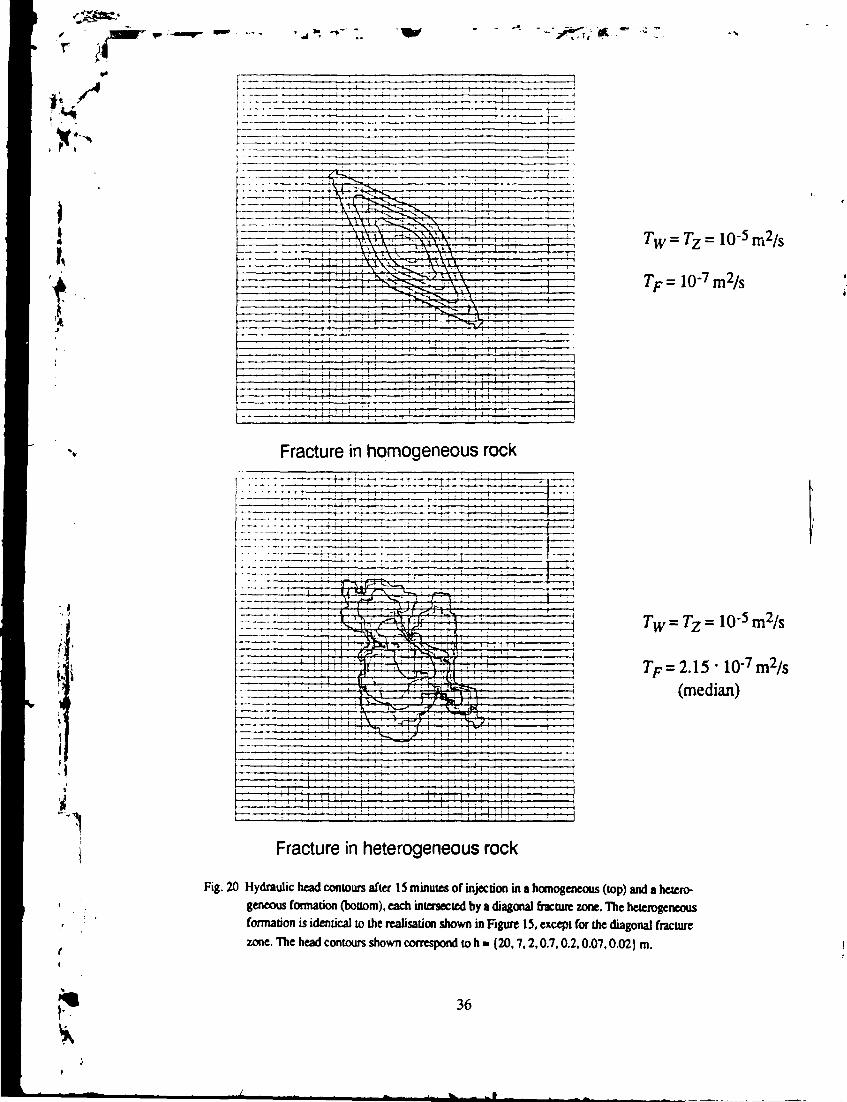
.' In Figure 20 the effects of a hypothetical diagonal fracture zone on the radius of influence
are shown. The purpose of this figure is to stimulate the imagination of how fractionaldimensions of flow may arise due to site specific conditions of heterogeneity. The forma-tion the upper plot in Figure 20 is homogeneous with TF = 1 0 7 m2/s except for adiagonal fracture zone (running from the upper left to the lower right comer), which has atransmissivity of Tz ~ 10~s m2/s. In the lower plot in Figure 20, the formation is identicalto that in shown Figure IS except for the diagonal fracture zone. Thus, the lower plot inFigure 20 should be compared with the lower plot in Figure 16.
•A
ji

»• -v
*•=
RANDOM TKANSM I «S 1 V 1 TY 1*1 KLI)
N < > .
\
k s : '> 1 ') 1
iR A S T K K L K t l K N D ( c l i m [ T | i n 2 / ; - ; )
H.HO]-;-
Fig. 15 Example of one of the realisations studied. Note the borehole block in the centre. The realisationis used as input to the numerical flow model three times with different values of the boreholeblock transmissivity corresponding to cases G-I in Table 2.
31
»
*t -V
i 4 fH
rrtrrt
Fig. 16 Hydraulic head contours after 15 minutes of injection for the realisation shown i Figure 15.
The upper coniour plot refers to case G, the middle plot to case H, and the lower plo' to case I,
see Table 2. The head contours shown correspond to h = {20,7,2,0.7,0.2,0.07,0.02] m.
32
~ -r
/
/-
I
-• :
. -!/
ess
1
"S
- e.min
_^
i r r
i» \
< ^
*̂e.max
\
^ ̂ \> v
/
- ^ v
i
/
f
/
h = 0.02 m I
- Borehole
il
i =0
V («2« -i)
2TC
i = 0
\e,ave200
200 4 f i
Fig. 17 The definitions of r,, r##mil, rtjnB, r,^, and r i ( 1 - refer to the position and the irregularity of thehead contour h = 0.02 m after 15 minutes of injection.
33
«- - - ^ W '
i « • r
i
# 3 r
W:
f: 1
#2
F
F: T-t.UE-7MM
#1
? 8E
if) «O
LJ• 4
C5
^ 2
ii----•
•
• •
•
i •| { é
i
1 10INJECTION TIME t m in
7V=10-9m2/s
•J
Tw=\0-1rn2/sw
#2o
#1
(B)0
-
K l
C
E -
•
oUJ
O -
0 -
p•
1
S
)
G
*
10 "INJECTION TIME, t min
#3o 3
F
W T»1E4m<
F
#2*
F
20 -j
* E,«ic
CM
o,0:
W: T«1C4«Vk # • :
r
#1»C)
T-llÄ-7-^. ^ ^_
F
^ « -
2-
• f
_
O
~n r
• - — u -
11
ft
1 10INJECTION TIME, t min
Fig. 18 Plou of l / g vs. logiet). The insets to the left of each plot show the flow situations studied. Tw
and TF are the transmissivities of the borehole block and the surrounding formation, respectively.
34
ö 2
2 &i, n
II
i
i
ti -" ci „~ il ^ii "_ :&.
•2 c
LLJ
O• I—
o
i I i I i 1 i I i h I 1 1 1 I 11 i 11 I i 1 1 1 1 1 i 1 1 I i l 1 1 1 1 1 1 i m 1 oN N -
1
[Fi "-
CO
tfe
•SS <n
E t"7 tv-
Uj UJ
i a
? ^E Tin ujUJ T-•i il
OJ
i lUJ 2i" I i
Fig. 19 Plot of l/Q vs. logi o(O (cf- the lower plot in Figure 18). The insets lo the left of the plot showthe flow situations studied. Tw and 7> denote the transmissivities of the borehole block and thesurrounding formation, respectively. Tm and 7) denote the transmissivities interpreted withMove's and Jacob-Lohman's formulae, respectively.
35
't
• - !
i-—
i i •• i i ! • | I
i ; ;uy\
I I r !I ; I i • ii 1 I I i l
Fracture in homogeneous rock
! ; ' I I
-J-5S
S^E
\! " >./
= TZ = 10-5 m2/s
=72= 10-5m2/s
= 2.15-10-7rn2/s(median)
Fracture in heterogeneous rock
Fig. 20 Hydraulic head contours after 15 minutes of injection in a homogeneous (top) and a hetero-geneous fonnation (bottom), each intersected by a diagonal fracture zone. The heterogeneousformation is identical to the realisation shown in Figure IS, except for the diagonal fracturezone. The head contours shown correspond to h « (20,7,2,0.7.0.2,0.07,0.02) m.
36
Chapter 6
i Monte Carlo results
The Monte Carlo method is used in this study to investigate (i) the sensitivity of Tm andrtave :o different statistical structures (RY), see cases D-F in Table 2, and (a) the relation-ship between Tm and rejmt for a given statistical structure, sec cases G-I in Table 2. Amultinomial distribution is assumed for the transmissivity fields generated with a linearrelationship between bglQ(T) and logl0(S), see Figure 14. The results are shown in Table3 and in Figures 21-25.
Table 3 shows that the different ensemble mean values of Tm and re/tve compare well witheach other, respectively, and that they also compare well with the values of Tm and re forthe corresponding homogeneous case B (ef. Table 1).
Tab. 3 Case B is a homogeneous formation (cf. Table 1). Cases D-F are studied by the Monte Carlomethod (200 realisations each). The realisations of case D are generated with an ordinary randomnumber generator, whereas the realisations in cases E and F are generated with the turning bandsmethod using an isotropic and exponential variogram model. For case D, Ry &x = åy = 3 m, andfor cases E and ¥,Ry3 Ay.
7
B:
D:
E:
F:
V(m2/s)
10-7
IO-7
io-7
io-7
7> (mVs)
io-7
~ 1 0 7 (median)
~ IO7(median)
- 10'7 (median)
Ay(m)
oo
-
6
12
RY (m)
oo
3
18
36
<7m>(m2/s)
8.58-10-8(7j
8.81 • IO8
8.15 IO-8
8.11 IO-8
<re^ (m)
US (r..
11.5
12.4
12.9
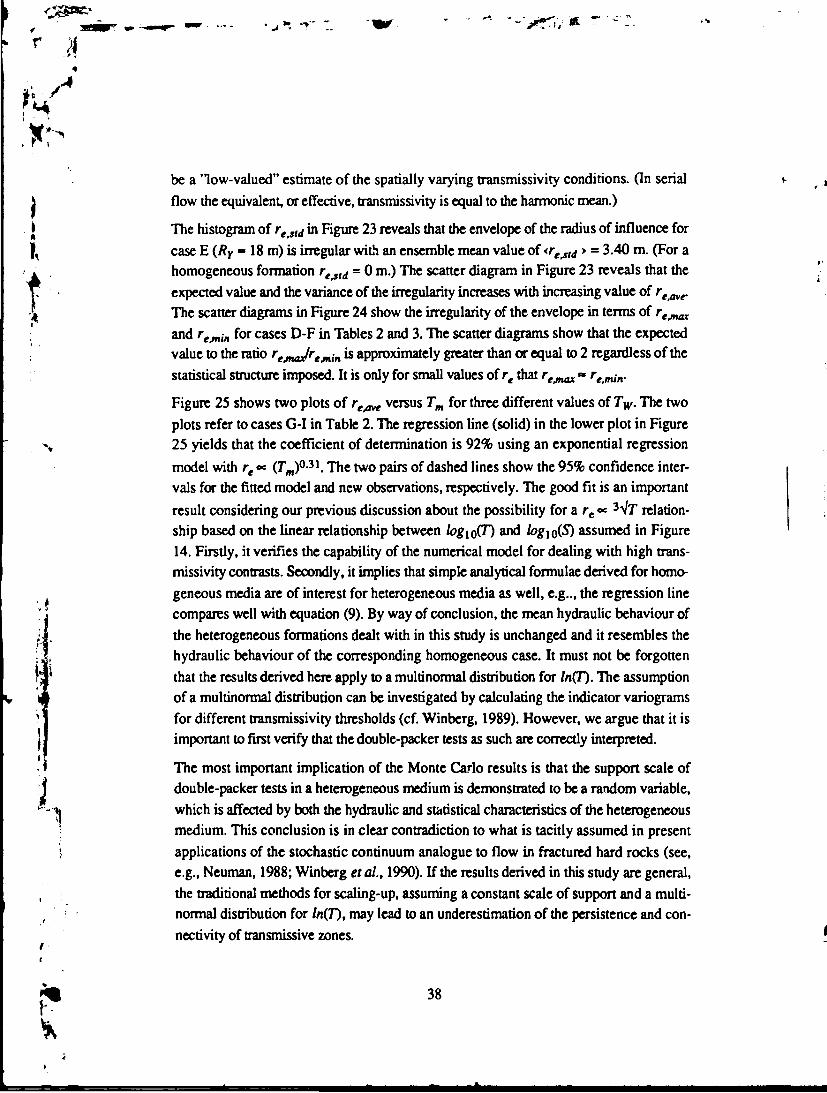
Figure 21 yields that: (0 the variability of reAve is sensitive to the value of Ry, whereas thevariability of Tm is comparatively insensitive, and (if) the distributions of reffve are fairlysymmetric or slightly skewed to the right, whereas the distributions of Tm are all clearlyskewed to the left. Figure 22 shows the three histograms of Tm in detail. The skewnesssuggests that the interpretation of Tm is sensitive to hydraulic resistances. In other words,radial flow to/from a point source is in some sense related to serial flow because Tm may
37
1
be a 'low-valued" estimate of the spatially varying transmissivity conditions. fln serial
flow the equivalent, or effective, transmissivity is equal to the harmonic mean.)
The histogram of restd in Figure 23 reveals that the envelope of the radius of influence for
case E (Ry - 18 m) is irregular with an ensemble mean value of <reAti > = 3.40 m. (For a
homogeneous formation restd = 0 m.) The scatter diagram in Figure 23 reveals that the
expected value and the variance of the irregularity increases with increasing value of refive.
The scatter diagrams in Figure 24 show the irregularity of the envelope in terms of re^nax
and rejnin for cases D-F in Tables 2 and 3. The scatter diagrams show that the expected
value to the ratio rejnajr€/nin is approximately greater than or equal to 2 regardless of the
statistical structure imposed It is only for small values of re that rejnax •* remin.
Figure 25 shows two plots of refive versus Tm for three different values of Tw. The two
plots refer to cases G-I in Table 2. The regression line (solid) in the lower plot in Figure% 25 yields that the coefficient of determination is 92% using an exponential regression
model with re « (Tm)0:il. The two pairs of dashed lines show the 95% confidence inter-
vals for the fitted model and new observations, respectively. The good fit is an important
result considering our previous discussion about the possibility for a r e « 3Vr relation-
ship based on the linear relationship between fogio(T) and iogio(S) assumed in Figure
14. Firstly, it verifies the capability of the numerical model for dealing with high trans-
missivity contrasts. Secondly, it implies that simple analytical formulae derived for homo-
geneous media are of interest for heterogeneous media as well, e.g.., the regression line
'J compares well with equation (9). By way of conclusion, the mean hydraulic behaviour of
the heterogeneous formations dealt with in this study is unchanged and it resembles the
hydraulic behaviour of the corresponding homogeneous case. It must not be forgotten
that the results derived here apply to a multinomial distribution for ln(T). The assumption
of a multinomial distribution can be investigated by calculating the indicator variograms
for different transmissivity thresholds (cf. Winberg, 1989). However, we argue that it is
important to first verify that the double-packer tests as such are correctly interpreted.
The most important implication of the Monte Carlo results is that the support scale of
double-packer tests in a heterogeneous medium is demonstrated to be a random variable,
which is affected by both the hydraulic and statistical characteristics of the heterogeneous
medium. This conclusion is in clear contradiction to what is tacitly assumed in present
applications of the stochastic continuum analogue to flow in fractured hard rocks (see,
e.g., Neuman, 1988; Winberg et al., 1990). If the results derived in this study are general,
the traditional methods for scaling-up, assuming a constant scale of support and a multi-
normal distribution for ln(T), may lead to an underestimation of the persistence and con-
nectivity of transmissive zones.
38

JT"
3x200obs. of reavevs RY
30
25
20
£15a
10
5
0
!
j
• m<IX
mn
75%
50%
25%
• . . . . i . . . . i . . . . i . . . . i . . . . i . . . . i
0 10 20 30 40 50 60Y '
(1E-7)3 x 200 obs. of Tm vs Ry
1.2
1
0.8
0.6
0.4
0.2
0
t - - • • i - - • • f • • . . , . - - - , . . . . . . . . . ,
•#
i . . . . i . . . . i . . . . i . . . . i . . . . i . . . . i
10 20 30 40 50 60
Fig. 21 Box plots of rtjnt vs. tfr and 7"w vs. RY for cases D-F (Rr - 3 m. 18 m, and 36 m), see Table 3.
39
iNumber ot observations Number ol observations Number ol observations
o
oK>
o
oo>
r»(B
to
o o c
1
zr:
T I
pn
it i
J
i ii t> c
. . . .
. Ol
> o. . . 1
1
mo
o
oIV}
o
Si1"
oos
m.-~
o
L
o
1
LJi . . .
1 ,1
wo
. 1 .
1
OJ Uo o
" • " '
i...i
*~
mi i
o
oro
o
oO)
oo
o o
..
•J
tiu—L,
1
1
Mo
O)o
" *
1
. . 1 . .
o
j . . .
1
o
1
1 T >
..t
A
fIIZ 9
BS 3n> ^ >3 "<T»
3
K>
IION
3
QCM
3g3n>o.5'3
A
3^c«
IIK->
O
3
50
II>„,C»
3
Ot*Vi
nm sr
?s3o;o*3enG.5'3
A•?VIt
l—u
o•ij
3to
CA
QVI
O
33

; j r
i,
t
il1
30 -'•
25 -
g 20ns5 15
10 -
5
0
20
16
12
• ^ n
• •--»• r i •—•—i
i—I ;
~n ^- 1
i . . . i . . .
i • • • i i
.1.1 :.1
8 10
Case E:
RY =18m
<7F>=10-7m2/s
(ensemble median)
<»o^
O o
• 0 ° , o d
6 12 16 20
Fig. 23 Histogram of rt/nå (top) and scatter diagram of rfjU vs. r,^, (bottom) for case E (fly - 18 m),see Table 3.
41

' 0
TM
i
S- I
il
o -
30
10/
O 10 20 30 40
Case D:
/?y = 3 m
<rF>=io-7m2/s(ensemble median)
Case E:
RY = 18m
<rF>=10"7rn2/s
(ensemble median)
Case F:
fy =36m
Tw=W7tn2/s
(ensemble median)
Fig. 24 Scatter plots of r,^, vs. r,,**fo» cases D-F (Rr • 3 m, 18 m, and 36 m), see Table 3
42
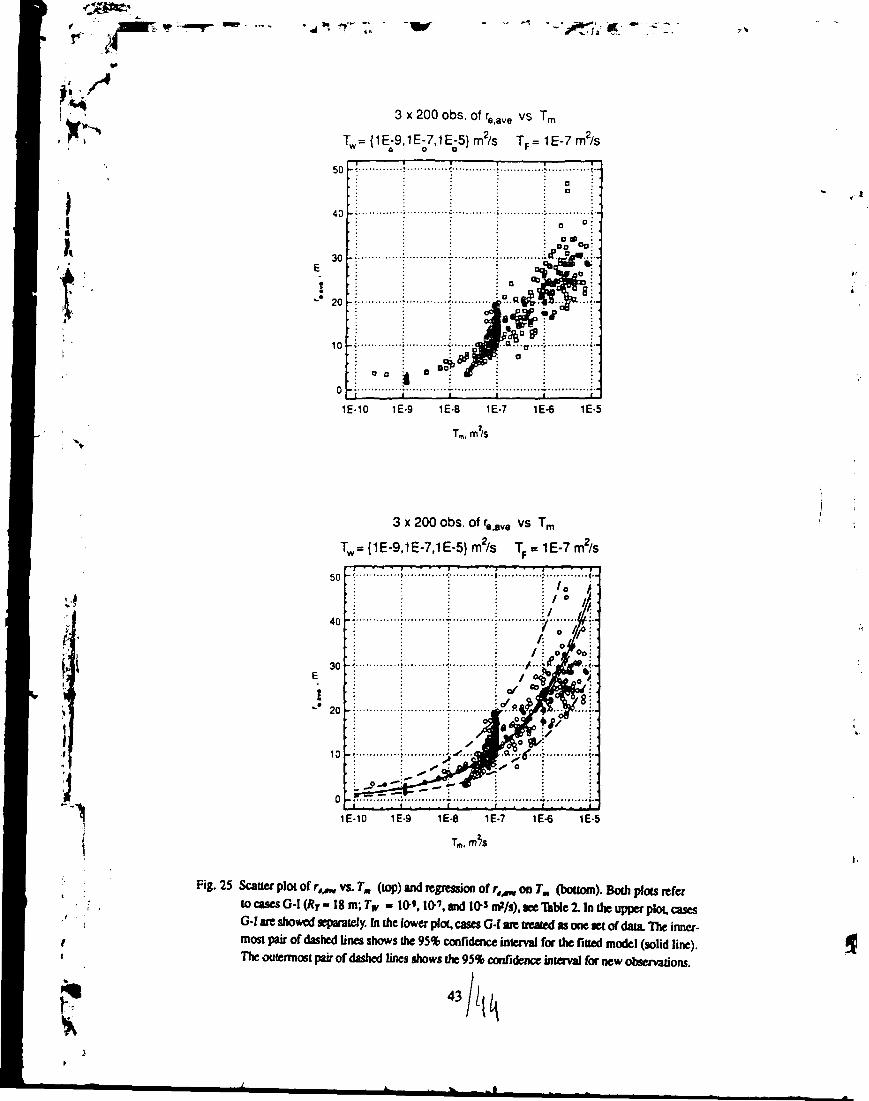
3 x 200 obs. of re ave vs Tm
7 = {1E-9.1E-7.1E-5} m2/s T- = 1E-7 m2/s
50
40
30
20
10
1E-10 1E-9 1E-8 1E-7 1E-6 1E-5
Tm, m'/s
3 x 200 obs. of rajve vs T
Tw= {1E-9.1E-7.1E-5} m2/s Jf » 1E-7 m2/s
1E-10 1E-9 1E-8 1E-7 1E-6 1E-5
10 -
0 -
Fig. 25 Scatter plot of rtjnt vs. Tm (top) and regression of r##TO on Tm (bottom). Both plots referto cases G-I (Rr - 1 8 m; Tw - 10*. 10-', and 10* irf/s), see Table 1 In the upper plot, casesG-I are showed separately. In the lower plot, cases G-I arc treated as one set of data. The inner-most pair of dashed lines shows the 95% confidence inlerval for the fitted model (solid line).The outermost pair of dashed lines shows the 95% confidence interval for new observations.
t /
t
Chapter 7
Conclusions
A two-dimensional numerical flow model is used to investigate the transmissivity and theradius of influence of single-hole double-packer tests in highly heterogeneous porousmedia. The spatial variability of ln(J) is assumed to be multinomial on a 3 m scale. Theexperimental set-up used corresponds to a 15 minutes long constant-head injection test ina slim core borehole, which is a common single-hole test procedure within the Swedishnuclear waste repository programme in fractured hard rocks. The conclusions drawn canbe summarised as follows:
(a) a positive borehole skin has severe effects on the transmissivity value interpretedas well as the corresponding radius of influence
(b) the transmissivity value interpreted is a complex average of the heterogeneity(c) the corresponding radius of influence is irregular and of random nature
(d) the a priori assumption of an essentially radial flow regime, as implied by thetraditional interpretation formulae used, e.g., Moye (1967), Cooper and Jacob(1946) and Jacob and Lohman (1952), is questioned
(e) the mean values of the transmissivity and the radius of influence of a double-packer test in a heterogeneous medium equal the transmissivity and the radiusof influence of a similar test in a comparative homogeneous medium
Beginning with the interpretation of transmissivity, we conclude that the hydraulic condi-
' (15 minutes). For a transmissivity value of 10 9 m2/s (or less) in the immediate vicinity ofthe borehole (£1.5 m), it is impossible to tell whether the surrounding formation is homo-
i geneous or heterogeneous. Thus, if the flow capacity close to the borehole is altered by1 features that cause a positive skin such as clogging drilling debris, subsequent discrete
j fracture network transmissivity calibrations as well as porous media transmissivity inter-pretations, geostatistical analyses and conditional simulations will be distorted. Con-
versely, if the flow capacity is altered by features that cause a negative skin such as1 • i , hydraulic fracturing, the aforementioned methods of analysis will reflect some kind of
average of nearby and distant hydraulic conditions. In other words, the scale of support ist varying.
' • * '
Xr-The sensitivity of transmissivity interpretations to hydraulically resistive regions demon-strated in this study suggests that flow to/from a point source in a two-dimensional het-erogeneous domain in some sense is related to serial flow. If this observation is correct itimplies that the transmissivity value interpreted in conjunction with a single-hole double-packer test may be 'low-valued" estimate of the spatially varying transmissivity condi-tions of the surrounding formation (cf. harmonic mean in serial flow). The implications ofthis conclusion are debatable from a safety assessment point of view, because the trans-missivity value interpreted may not be a conservative estimate of the transmissivity for anon-radial flow regime.
The fact that the lateral support scale of field measurements is not a constant but a randomvariable is clearly demonstrated in this study by means of the Monte Carlo method. Theresults show that the radius of influence is affected by both the hydraulic and statisticalcharacteristics of the heterogeneous medium. This conclusion is in clear contradiction towhat is tacitly assumed in present applications of stochastic continuum concepts for flowand mass transport in porous media as well as in fractured hard rocks. If the resultsderived in this study are general, the traditional methods used for scaling-up, assuming aconstant lateral scale of support and a multinomial distribution, may lead to an under-estimation of the persistence and connectivity of transmissive zones. This might perhapsbe of limited importance in conventional porous media applications of moderate hetero-geneity, but not for assessing the post-closure radiological safety of a deep repository forhigh-level nuclear waste in highly heterogeneous media such as fractured hard rocks.
The two methods used in this study for interpreting constant-head injection tests, namelyMoye's formula for steady-state analyses and Jacob-Lohman's formula for transientanalyses, should compare fairly well only for a truly radial flow regime to/from a boreholewithout skin effects in a perfectly homogeneous formation (see, e.g., Black and Barker,1987). This result is also reproduced in the present study using the numerical flow model.However, steady-state and transient interpretations of real tests differ in what seems to bea random fashion. For the particular borehole discussed in this study, namely KAS03 atthe Äspö Hard Rock Laboratory in Sweden, the maximum difference is about one orderof magnitude. The numerical simulations undertaken in this study show that varying skineffects alone cannot explain the random differences observed. Therefore, we conclude thatthe a priori assumption of an essentially radial flow regime, as implied by the interpre-tation formulae used, must be put in question.
This conclusion is supported by the results of, for example, Braester and Thunvik (1982,1984), Barker (1988), and Geier and Doe (1992). Braester and Thunvik (1982,1984)concluded that for short test section lengths, the flow regime around a borehole in aporous medium deviates from being radial to become somewhat more spherical. Transient
46
interpretation methods such as Jacob-Lohman's or Cooper-Jacob's formulae assume a
\ perfectly radial flow regime, whereas Moye's formula is more adaptive to a radial-! spherical flow regime. Thus, for non-radial flow regimes, results computed with Moye's
I and Jacob-Lohman's (or Cooper-Jacob's) formulae do not necessarily compare. Geier7 and Doe (1992) compared interpretations made with Moye's formula with interpretations
made with the fractional dimension theory (Barker, 1988) for a number of double-packertest data from the Finnsjön study area in Sweden. They concluded that the two methodscompare well in many cases but that significant deviations can occur in situations wherethe flow dimension is close to unity, e.g., a situation where an impervious rock mass isintersected by a single channel of high transmissivity.
An important result of the Monte Carlo simulations is that the mean values of the trans-missivity and the radius of influence of double-packer tests in a heterogeneous mediumequals the transmissivity and the radius of influence of a similar test in a comparativehomogeneous medium. This result suggests that analytical formulae derived for homo-geneous media are of interest. The difference between purely random and correlated fieldsshows up in terms of larger variances for the correlated fields. It is important to keep inmind that these observations are made for a multinomial type of heterogeneity.
47 ' < i 2

t
» • »
Chapter 8
iDiscussion
Many geostatistical concepts used for generating random fields as input to numerical flow
models origin from techniques developed for mineral exploration. In mining geostatistics,
basic statistical prerequisites such as independent observations and a constant scale of
support are fulfilled in the analyses of cores. However, in applications that use data of a
varying lateral support, which is the general case in hydrogeological problems that use
v hydraulic data frorr boreholes, the adaptat. : of the traditional geostatistical methods is
not evident Never. :eless, this is exactly what is tacitly assumed in many applications of
the stochastic continuum analogue to flow in fractured hard rocks (see, e.g., Neuman,
1988; Gustafson etal., 1989; Winberg etal., 1990; Svensson, 1991; Norman, 1992). In
the work of Norman (1992) an approach to deal with packer-test data on multiple scales is
suggested and applied to field data from fractured hard rocks. However, the approach
suggested does not take a varying lateral support into account. Follin (1992) showed that
statistical regularisation of hydraulic properties in highly heterogeneous porous media is a
delicate matter because the relation to the or:: ±. problem is easily lost
With reference to the results of the present study concerning the varying lateral scale of
support, i.e., radius of influence, we disagree with the traditional treatment for generating a
heterogeneous hydraulic conductivity field on a large scale. The technique used for gene-
rating a heterogeneous hydraulic conductivity field on a large scale is debatable. It is
based on the tacit assumption that the ' erogeneity observed on a small scale, as
determined by fixed-interval transmissivity measurements in single-hole core boreholes, is
of constant lateral support Furthermore, it is assumed that the transmissivities can be
transformed to hydraulic conductivities and correctly regularised to a simple log-normal
i frequency distribution with a support scale that fits a given numerical discretisation.
I Using the results obtained in this study means that statistical regularisation should be
| avoided, i.e., the heterogeneous observed on a small scale should be generated "as is".
Concerning the resulting computational constraints, we suggest that the coarser numerical
discretisation should be governed by hydraulic principles rather than, as now, by statistical
',.'•' assumptions and traditional numerical modelling techniques. We argue that groundwaterflow and advective mass transport from a repository located in a comparatively impervious
Ht 49
FT
rock mass to a major fracture zone is governed by the most transmissive structures on that\ scale. Thus, the most transmissive structures should not be smeared out but treated as ai second-order system of "fracture zones". (The second-order system is random, whereasI the first-order system is deterministic and defined by the conceptual geological model.)
, - The heterogeneous flow domain should be discretised numerically in a manner that main-Y: • tains the persistence and connectivity of the second-order zones, whereas the interveningA resistive regions are lumped into more or less impervious blocks. Because the configura-
tion of the second-order system is random, the Monte Carlo method must be used to.' evaluate the effect of the corresponding uncertainty. Moreover, as the configuration of the
heterogeneity varies between the realisations, the numerical discretisation will need to bespecified afresh.
There are two main problem with the approach suggested. The first problem is to develop
N a technique that takes a varying lateral support scale into account while generating the
random field. A tentative approach is to develop a hybrid of the sequential indicatorsimulation algorithm (Gömez-Hernåndez and Srivastava, 1990). One of the manyattractive features of this algorithm is that different correlation lengths can be used simul-taneously. Concerning the problem of numerical discretisation, Follin (1992) presented anumerical technique that automatically discretises a highly heterogeneous porous mediumin two- or three dimensions according to a prescribed cutoff conductivity value. For ahighly heterogeneous porous medium in two-dimensions, such as the one studied in this
-i study, Follin (1992) concluded that the main flow and transport properties are preserveddespite a frequency distribution cutoff of 25%. Further, the critical cutoff value for the atwo-dimensional flow problem was found to be about 38%, which compares well with thecritical probability for the two-dimensional site percolation problem on a square lattice,which is estimated to 38.2% (see, e.g., Piggott and Elsworth, 1992). For the three-dimensional site percolation problem on a cube lattice the critical probability is estimated
! to 71.8% (see, e.g., Piggott and Elsworth, 1992).
5 0
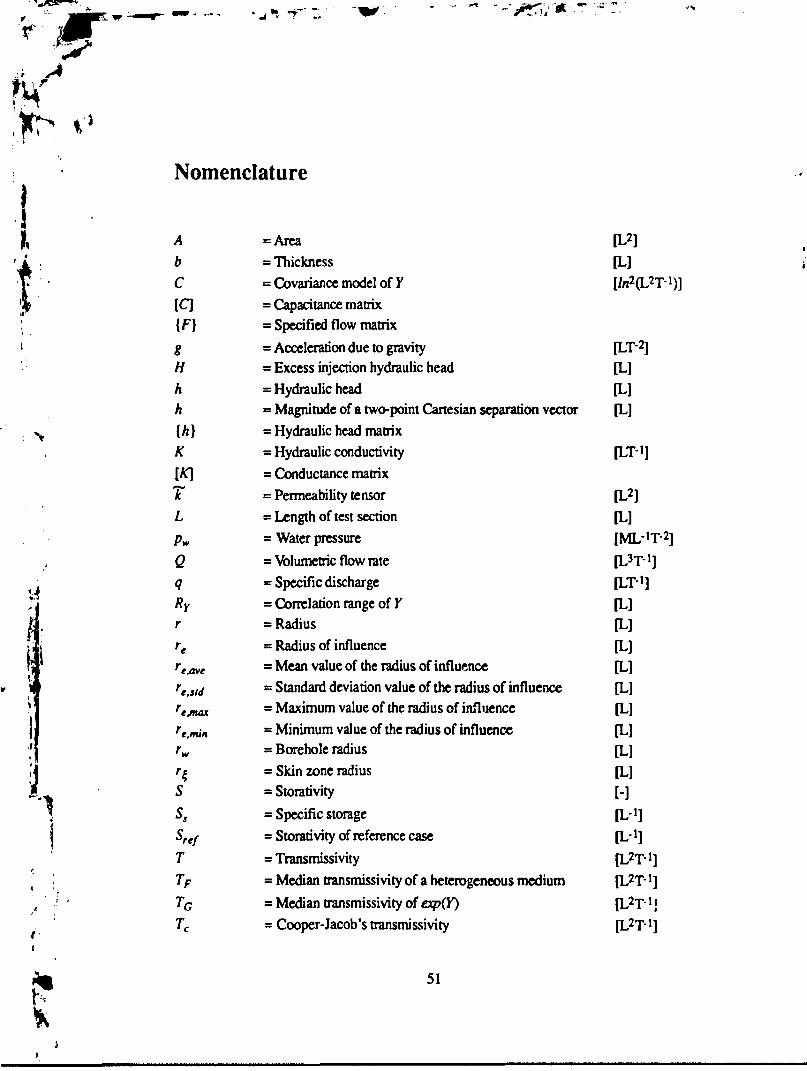
". "TT.
fr
I
Nomenclature
A =Area [L2]b = Thickness [L]C = Covariance model of Y
ty [C] = Capacitance matrix: {F} = Specified flow matrixi g = Acceleration due to gravity [LT2]• H = Excess injection hydraulic head [L]
/t = Hydraulic head [L]/i = Magnitude of a two-point Cartesian separation vector [L]
^ {/i} = Hydraulic head matrixK = Hydraulic conductivity [UP1][K] = Conductance matrixT = Permeability tensor [L2]L - Length of test section [L]pw = Water pressure [ML-'T2]Q =V3lumetric flow rate [pT1]
. q = Specific discharge [UP1]Ry = Correlation range of Y [L]r - Radius [L]re = Radius of influence [L]re,ave - Mean value of the radius of influence [L]re,$td - Standard deviation value of the radius of influence [L]
= Maximum value of the radius of influence [L]= Minimum value of the radius of influence [L]
rw - Borehole radius [L]r^ = Skin zone radius [L]S = Storativity [-]Ss = Specific storage [L-i]Sref - Storativity of reference case [L*l ]
T = Transmissivity [L2T>]TF = Median transmissivity of a heterogeneous medium [L2T-' ]TG = Median transmissivity of exp(Y) [L2T-1 jTc = Cooper-Jacob's transmissivity [L2^1]
* 5 1
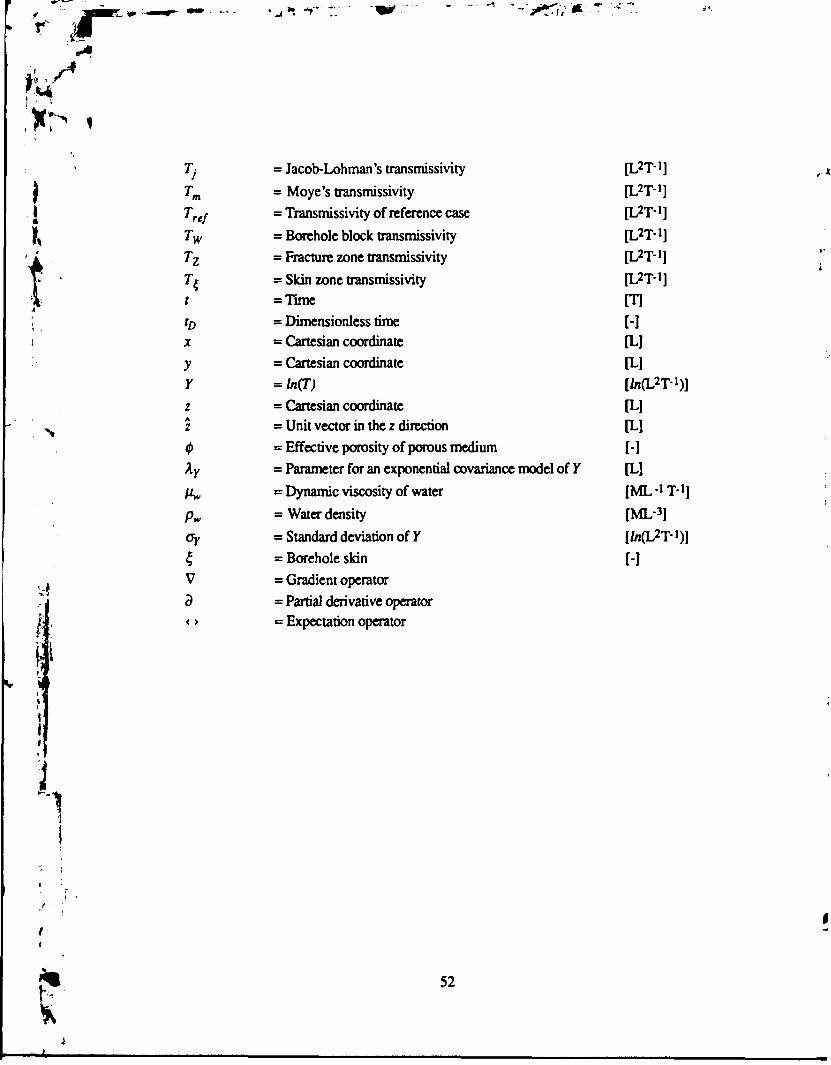
7
1 Tm
| Tref
•jp
tD
x
Y
zz
3< >
Jacob-Lohman's transmissivityMoye's transmissivity
Transmissivity of reference case
Borehole block transmissivity
Fracture zone transmissivity
Skin zone transmissivity
Time
Dimensionless timeCartesian coordinate
Cartesian coordinate
ln(T)Cartesian coordinateUnit vector in the 2 direction
Effective porosity of porous medium
Parameter for an exponential covariance model of Y
Dynamic viscosity of water
Water density
Standard deviation of Y
Borehole skin
Gradient operator
Partial derivative operatorExpectation operator
[L2T-!]
[L2T-i]n 2*r-l]
[L2T'!]
n^T"1]
m[-][L]
[L][/n(L2T-l)]
[L][L]
[-][L]
[ML-lT-i]
[ML-3]
[/n(L2T>)l
[-1
52
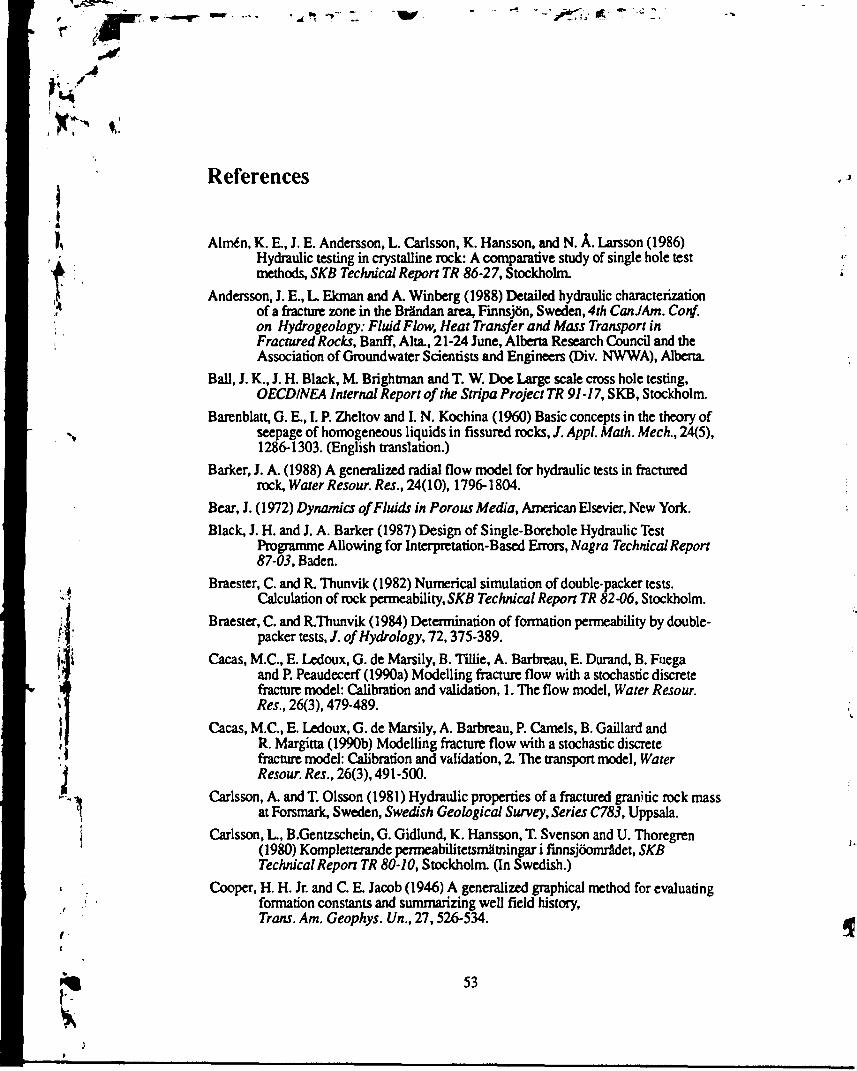
t- W Z.I,
f i • /
References
jI,
I
•J
i
Almén, K. E., J. E. Andersson, L. Carlsson, K. Hansson, and N. Å. Larsson (1986)Hydraulic testing in crystalline rock: A comparative study of single hole testmethods, SKB Technical Report TR 86-27, Stockholm.
Andersson, J. E., L. Ekman and A. Winberg (1988) Detailed hydraulic characterizationof a fracture zone in the Brändan area, Finnsjön, Sweden, 4th Can J Am. Conf.on Hydrogeology: Fluid Flow, Heat Transfer and Mass Transport inFractured Rocks, Banff, Alta., 21-24 June, Alberta Research Council and theAssociation of Groundwater Scientists and Engineers (Div. NWWA), Alberta.
Ball, J. K., J. H. Black, M Brightman and T. W. Doe Large scale cross hole testing,OECDINEA Internal Report of the Stripa Project TR 91-17, SKB, Stockholm.
Barenblatt, G. E., I. P. Zheltov and I. N. Kochina (1960) Basic concepts in the theory ofseepage of homogeneous liquids in fissured rocks, / . Appl. Math. Mech., 24(5),1286-1303. (English translation.)
Barker, J. A. (1988) A generalized radial flow model for hydraulic tests in fracturedrock, Water Resour. Res., 24(10), 1796-1804.
Bear, J. (1972) Dynamics of Fluids in Porous Media, American Elsevier, New York.
Black, J. H. and J. A. Barker (1987) Design of Single-Borehole Hydraulic TestProgramme Allowing for Interpretation-Based Errors, Nagra Technical Report87-03, Baden.
Braester, C. and R. Thunvik (1982) Numerical simulation of double-packer tests.Calculation of rock permeability, SKB Technical Report TR 82-06, Stockholm.
Braester, C. and RThunvik (1984) Determination of formation permeability by double-packer tests, J. of Hydrology, 72,375-389.
Cacas, M.C., E. Ledoux, G. de Marsily, B. Tillie, A. Barbreau, E. Durand, B. Fuegaand P. Peaudecerf (1990a) Modelling fracture flow with a stochastic discretefracture model: Calibration and validation, 1. The flow model, Water Resour.Res., 26(3), 479-489.
Cacas, M.C., E. Ledoux, G. de Marsily, A. Barbreau, P. Camels, B. Gaillard andR. Margitta (1990b) Modelling fracture flow with a stochastic discretefracture model: Calibration and validation, 2. The transport model, WaterResour. Res., 26(3), 491-500.
Carlsson, A. and T. Olsson (1981) Hydraulic properties of a fractured granitic rock massat Forsmark, Sweden, Swedish Geological Survey, Series C783, Uppsala.
Carlsson, L., B.Gentzschein, G. Gidlund, K. Hansson, T. Svenson and U. Thoregren(1980) Kompletterande permeabilitetsmätningar i finnsjöområdet, SKBTechnical Report TR 80-10, Stockholm. (In Swedish.)
Cooper, H. H. Jr. and C. E. Jacob (1946) A generalized graphical method for evaluatingformation constants and summarizing well field history,Trans. Am. Geophys. Un., 27,526-534.
53

< . .
v S!*> i
Cvetkovic, V. and C. S. Kung (1989) Variogram analysis of single-hole packer test datax from the Finnsjön site, SKB Arbetsrapport AR 89-17, Stockholm.1 Dagan, G. (1978) A note on packer, slug, and recovery tests in unconfined aquifers,! Water Resour. Res., 14(5), 929-934.« Dagan, G. (1982) Stochastic modeling of groundwater flow by unconditional and
' L conditional probabilities, 1. Conditional simulation and the direct problem,f . Water Resour. Res., 18(4), 813-833.£ Delhomme, J. P. (1979) Spatial variability and uncertainty in groundwater flow para-• meters: A geostatistical approach, Water Resour. Res., 15(2), 269-280.
Dershowitz, W. S. (1985) Rock joint systems, PhD thesis, Massachusetts Institute of1 Technology, Cambridge.
Doe, T. W. and J. E. Geier (1990) Interpretation of fracture system geometry using welltest data, OECD/NEA Internal Report of the Stripa Project TR 91-03, SKB,Stockholm.
Doe, T. W. and J.S. Remer (1981) Analysis of constant-pressure well tests in nonporous* fractured rock, Proc. of the Third Invitational Well-Testing Symposium - Well
Testing in Low-Permeability Environments, (March-26-28,1980), University ofCalifornia, Lawrence Berkeley, Laboratory, Berkeley.
Duguid, J. O. and P. C Y. Lee (1977) Flow in fractured porous media, Water Resour.Res., 13(3), 558-566.
Duff, I. S. (1981) MA32 - A package for solving sparse unsymmetric systems using thefronal method, UKAEA Report AERE - R10079, Oxfordshire.
Dverstorp, B. (1991) Analyzing flow and transport in fractured rock using the discrete, $ fracture network concept, PhD thesis, Royal Institute of Technology,
TRITA-VBI-151, Stockholm.Earlougher, R. C , Jr. (1977) Advances in Well Test Analysis, SPE AIME, Dallas.Follin, S. (1992) Numerical calculations on heterogeneity of groundwater flow, PhD
thesis, SKB Technical Report TR 92-14, Stockholm.Freeze, R. A. (1975) A stochastic-conceptual analysis of one-dimensional ground water
flow in nonuniform homogeneous media, Water Resour. Res, 11(5), 725-741.Freeze, R. A., J. Massman, L. Smith, T. Sperling and B. James (1990) Hydrogcological
decision analysis: 1. A framework, Ground Water, 28 (5), 738-766.Geier, J. E. and C. L. Axelsson (1991) Discrete fracture modelling of the Finnsjön rock
mass, Phase 1: Feasibility study, SKB Technical Report TR 91-13, Stockholm.•% Geier, J. E., C. L. Axelsson, L. Hässler and A. Benabderrahmane (1992) Discrete fracture1 modelling of the Finnsjön rock mass, Phase 2, SKB Technical Report TR 92-07,] Stockholm.
Geier, J. E. and T. W. Doe (1992).Discrete fracture modelling of the Finnsjön rock mass- Supplementary interpretations of actual and simulated well test data, SKBArbetsrapport AR 92-45, Stockholm.
1 Gömez-Hemändez, J. J. and R. M. Srivastava, ISIM3D: An ANSI-C three-dimensionalmultiple indicator conditional simulation program, Computer and Geosciences,16(4), 395-440,1990.
I 54

V i
• t • r
Gustafson, G., R. Stanfors and P. Wikberg (1989) Swedish Hard Rock Laboratoryi Evaluation of 1988 year preinvestigations and description of the target area off Äspö, SKB Technical Report TR 89-16, Stockholm.
i ' Holmes, D. C (1989) Site characterization and validation - Single borehole hydraulic1 testing, Stage 1, OECDINEA Internal Report of the Stripa Project TR 89-04," SKB.Stockholm.
Hvorslev, M. J. (1951) Time lag and soil permeability in groundwater observations,US. Army Corps Eng.,Bull. 36, Waterways Exp. Stn., Vicksburg, Miss.
Hubbert, M K. (1956) Darcy law and the field equations of flow of the undergroundfluids, Trans. Am. Inst. Min. Metall. Pet. Eng., 207,222-239.
Jacob, C E. (1950) Row of Groundwater, In: Rouse, H. (ed.) Engineering Hydraulics,Chap. 5,321-386, Wiley, New York.
Jacob, C. E. and S. Lohman (1952) Nonsteady flow to a well of constant drawdown inan extensive aquifer, Trans. Am. Geophys. Union, 33(4), 559-569.
Liedholm, M. (1991a) Conceptual Modeling of Äspö Technical Notes 1-17, SKBProgress Report 25-90-16a, Stockholm.
Liedholm, M. (1991b) Conceptual Modeling of Äspö Technical Notes 18-32, SKBProgress Report 25-90-16b, Stockholm.
Long, J. C. S., J. S. Remer, C. R. Wilson and P. A. Witherspoon (1982) Porous mediaequivalents for networks of discontinuous fractures, Water Resour. Res., 18(3),645-658.
Mantoglou, A. and J L. Wilson (1982) The turning bands method for simulation ofrandom fields using line generation by a spectral method, Water Resour. Res.,18(5), 1379-1394.
Marsily, G. de (1986) Quantitative Hydrogeology, Academic Press, Orlando.
Moye, D. G. (1967) Diamond drilling for foundation exploration. Civ. Eng. Trans. 7thInst. Eng. Australia, 95-100.
Neuman, S.P. (1987) Stochastic continuum representation of fractured rock permeabilityas an alternative to the REV and fracture network concepts, In: Farmer, I. W. etal. (eds.) Proc. 28th US. Symp. Rock Mech., 553-561, Balkema, Rotterdam.
Neuman, S.P. (1988) A proposed conceptual framework and methodology for investiga-tingflow and transport in Swedish crystalline rocks, SKB ArbetsrapportAR 88-37, Stockholm.
j Nilsson, L. (1989) Hydraulic tests at Äspö and Laxemar - Evaluation, SKB Progressi Report 25-88-14, Stockholm.
1 Nilsson, L. (1990) Hydraulic test at Äspö - KASO5-KASO8, HAS 13-HAS17, SKB; Progress Report 25-89-20, Stockholm.
Norman, S. (1992) Statistical inference and comparison of stochastic models for thehydraulic conductivity at the Finnsjön-sitc, SKB Technical Report TR 92-08,Stockholm.
, ; Peck, N.J., S. Gorelick, G.de Marsily, S.Foster and V. Kovalevsky (1988)Consequences of Spatial Variability in Aquifer Properties and Data Limitations
r for Groundwater Modelling Practice, 175, IAH Press, Oxfordshire.
* • 55
jr
t
Piggott, A. R. and D. Elsworth (1992) Analytical models for flow through obstructeddomains,/. Geoph. Res.,97(B2), 2085-2093.
Robinson, P. C. (1984) Connectivity, flow and transport in network models of fracturedmedia, PhD thesis, Theor. Phys. Div. TP. 1072, AERE Harwell, Oxfordshire.
Schrage, L. (1969) A more portable FORTRAN random number generator, ACM Trans,on Mathematical Software, 5(2), 132-138.
Stokes, J. (1980) On the description of the properties of fractured rock using the conceptof a porous medium, SKB Technical Report TR 80-05, SKB, Stockholm.
Svensson, U. (1991) Groundwater flow at Äspö and changes due to the excavation of thelaboratory, SKB Progress Report 25-91-03, Stockholm.
Tsang, Y. W. and C. F. Tsang (1989) Flow channeling in a single fracture as a two-dimensional strongly heterogeneous porous medium, Water Resour. Res., 25(9),1076-1080.
Thiem, G. (1906) Hydrologische Methoden, J. M. Gebhardt, Leibzig.
Warren, J.E. and P. J. Root (1963) The behaviour of naturally fractured reservoirs, Soc.Pet. Eng. J., 1,153-169.
Winberg, A. (1989) Project 90 - Analysis of spatial variability of hydraulic conductivitydata in the SKB data base GEOTAB, SKI Technical Report TR 89-12,Stockholm.
Winberg, A., C. S. Kung, X. H. Wen and V. Cyetkovic (1990) SKB 91 Stochastic Con-tinuum modelling of mass arrival at Finnsjön - Parametric and non-parametricapproaches, SKB Arbetsrapport AR 90-40, Stockholm.
Winberg, A. (1991) Analysis of spatial correlation of hydraulic conductivity data fromthe Stripa mine, OECD/NEA Internal Report of the Stripa Project TR 91-28,SKB, Stockholm.
56
I,
L/sf of SKB reportsAnnual Reports
1977-78TR121KBS Technical Reports 1-120SummariesStockholm, May 1979
1979TR 79-28The KBS Annual Report 1979KBS Technical Reports 79-01 - 79-27SummariesStockholm, March 1980
1980TR 80-26The KBS Annual Report 1980KBS Technical Reports 80-01 - 80-25SummariesStockholm, March 1981
1981TR 81-17The KBS Annual Report 1981KBS Technical Reports 81-01 -81-16SummariesStockholm, April 1982
1982TR 82-28The KBS Annual Report 1982KBS Technical Reports 82-01 - 82-27SummariesStockholm, July 1983
1983TR 83-77The KBS Annual Report 1983KBS Technical Reports 83-01 - 83-76SummariesStockholm, June 1984
1984TR 85-01Annual Research and DevelopmentReport 1984Including Summaries of Technical Reports Issuedduring 1984. (Technical Reports 84-01 - 84-19)Stockholm, June 1985
1985TR 85-20Annual Research and DevelopmentReport 1985Including Summaries of Technical Reports Issuedduring 1985. (Technical Reports 85-01 -85-19)Stockholm, May i986
1986TR 86-31SKB Annual Report 1986Including Summaries of Technical Reports Issuedduring 1986Stockholm, May 1987
1987TR 87-33SKB Annual Report 1987Including Summaries of Technical Reports Issuedduring 1987Stockholm, May 1988
1988TR 88-32SKB Annual Report 1988Including Summaries of Technical Reports Issuedduring 1988Stockholm, May 1989
1989TR 89-40SKB Annual Report 1989Including Summaries of Technical Reports Issuedduring 1989Stockholm, May 1990
1990TR 90-46SKB Annual Report 1990Including Summaries of Technical Reports Issuedduring 1990Stockholm, May 1991
1991TR 91-64SKB Annual Report 1991Including Summaries of Technical Reports Issuedduring 1991Stockholm, April 1992
Technical ReportsList of SKB Technical Reports 1992
TR 92-01GEOTAB. OverviewEbbe Eriksson1, Bertil Johansson2,Margareta Gerlach3, Stefan Magnusson2,Ann-Chatrin Nilsson4, Stefan Sehlstedt3,Tomas Stark1
^GAB, 2ERGODATA AB,3MRM Konsult AB4KTHJanuary 1992
r
'XT- i
I.
1
TR 92-02Sternö study site. Scope of activities andmain resultsKaj Ahlbom1, Jan-Erik Andersson2, Rune Nordqvist2,Christer Ljunggren3, Sven Tirén2, Clifford Voss4
'Conterra AB, 2Geosigma AB, 3Renco AB,4U.S. Geological SurveyJanuary 1992
TR 92-03Numerical groundwater flow calculationsat the Finnsjön study site - extendedregional areaBjörn Lindbom, Anders BoghammarKemakta Consultants Co, StockholmMarch 1992
TR 92-04Low temperature creep of copper intendedfor nuclear waste containersP J Henderson, J-0 Österberg, B IvarssonSwedish Institute for Metals Research, StockholmMarch 1992
TR 92-05Boyancy flow in fractured rock with a saltgradient in the groundwater - An inititalstudyJohan ClaessonDepartment of Building Physics, Lund University,SwedenFebruary 1992
TR 92-06Characterization of nearfield rock - A basisfor comparison of repository conceptsRoland Pusch, Harald HökmarkClay Technology AB and Lund University ofTechnologyDecember 1991
TR 92-07Discrete fracture modelling of the Finnsjönrock mass: Phase 2J E Geier, C-L Axelsson, L Hässler,A BenabderrahmaneGolden Geosystem AB, Uppsala, SwedenApril 1992
TR 92-08Statistical inference and comparison ofstochastic models for the hydraulicconductivity at the Finnsjön siteSven NormanStarprog ABApril 1992
TR 92-09Description of the transport mechanismsand pathways in the far field of a KBS-3type repositoryMark Elert1, Ivars Neretnieks2, Nils Kjellbert3,Anders Ström3
'Kemakta Konsult AB2Royal Institute of Technology'Swedish Nuclear Fuel and Waste Management CoApril 1992
TR 92-10Description of groundwater chemical datain the SKB database GEOTAB prior to1990Sif Laurent1, Stefan Magnusson2,Ann-Chatrin Nilsson3
WL, Stockholm2Ergodata AB, Göteborg3Dept. of Inorg. Chemistry, KTH, StockholmApril 1992
TR 92-11Numerical groundwter flow calculations atthe Finnsjön study site - the influence ofthe regional gradientBjörn Lindbom, Anders BoghammarKemakta Consultants Co., Stockholm, SwedenApril 1992
TR 92-12HYDRASTAR - a code for stochasticsimulation of groundwater flowSven NormanAbraxas KonsultMay 1992
TR 92-13Radionuclide solubilities to be used inSKB 91Jordi Bruno1, Patrik Sellin2
'MBT, Barcelona Spain*SKB, Stockholm, SwedenJune 1992
TR 92-14Numerical calculations onheterogeneity of groundwater flowSven FollinDepartment of Land and Water Resources,Royal Institute of TechnologyJune 1992

•
i TR 92-15Kamlunge study site.Scope of activities and main resultsKajAhlbom1, Jan-Erik Andersson2,Peter Andersson2, Thomas Ittner2,
Christer Ljunggren3, Sven Tirén2
'Conterra AB2Geosigma AB3Renco ABMay 1992
TR92 16Equipment for deployment of canisterswith spent nuclear fue and bentonitebuffer in horisontal holesVesa Henttonen, Miko SuikkiJP-Engineering Oy, Raisio, FinlandJune 1992
TR 92-17The implication of fractal dimension inhydrogeology and rock mechanicsVersion 1.1W Dershowitz1, K Redus1, P Wallmann',PLaPointe1, C L Axelsson2
'Golder Associates Inc., Seattle, Washington, USAbolder Associates Geosystem AB, Uppsala,SwedenFebruary 1992
TR 92-18Stochastic continuum simulation ofmass arrival using a synthetic data set.The effect of hard and soft conditioningKung Chen Shan1, Wen Xian Huan1, VladimirCvetkovic1, Anders Winberg2
1 Royal Institute of Technology, Stockholm2 Conterra AB, GothenburgJune 1992
TR 92-19Partitioning and transmutation.A review of the current state of the artMats Skålberg, Jan-Olov UljenzinDepartment of Nuclear Chemistry,Chalmers University of TechnologyOctober 1992
TR 92-20SKB91Final disposal of spent nuclear fuel.Importance of the bedrock for safetySKBMay 1992
TR92 21The Protogine Zone.Geology and mobility during the last1.5 GaPer-Gunnar Andréasson, Agnes RodheSeptember 1992
TR 92-22Klipperås study site.Scope of activities and main resultsKaj Ahlbom1, Jan-Erik Andersson2,Peter Andersson2, Tomas Ittner2,Christer Ljunggren3, Sven Tirén2
'Conterra AB^eosigma AB3Renco ABSeptember 1992
TR 92-23Bedrock stability in SoutheasternSweden. Evidence from fracturing inthe Ordovician limestones of NorthernÖlandAlan Geoffrey Milnes', David G Gee2
'Geological and Environmental Assessments(GEA), Zurich, Switzerlandteologiska Institutionen, Lund, SwedenSeptember 1992
TR 92-24Plan 92Costs for manager>pnt of theradioactive waste tu ~i nuclear powerproductionSwedish Nuclear Fuel and Waste Management CoJune 1992
TR 92-25Gabbro as a host rock for a nuclearwaste repositoryKaj Ahlbom1, Bengt Leijon1, Magnus Uedholm2,John Smellie1
1Conterra AB*VBB VIAKSeptember 1992
TR 92-26Copper canisters for nuclear high levelwaste disposal. Corrosion aspectsLars Werme, Patrik Sellin, Nils KjellbertSwedish Nuclear Fuel and Waste ManagementCo, Stockholm, SwedenOctober 1992

V"
ii
TR 92 27Thermo-mechanical FE-analysis of butt-welding of a Cu-Fe canister for spentnuclear fuelB L Josefson1, L Karlsson2, L-E Lindgren2,M Jonsson-'Chalmers University of Technology, Göteborg,Sweden'Division of Computer Aided Design, LuleåUniversity of Technology, Luleå, SwedenOctober 1992
TR 92 28A rock mechanics study of FractureZone 2 at the Finnsjön siteBengt Leijon1, Christer Ljunggren2
'Conterra ABJRenco ABJanuary 1992
TR 92-29Release calculations in a repository ofthe very long tunnel typeL Romero, L Moreno, I NeretnieksDepartment of Chemical Engineering,Royal Institute of Technology, Stockholm, SwedenNovember 1992
TR 92 30Interaction between rock, bentonitebuffer and canister. FEM calculationsof some mechanical effects on thecanister in different disposal conceptsLennart BörgessonClay Technology AB, Lund SwedenJuly 1992
TR 92-31The Äspö Hard Rock Laboratory:Final evaluation of the hydro-geochemical pre-investigations inrelation to existing geologic andhydraulic conditionsJohn Smellie1, Marcus Laaksoharju2
'Conterra AB, Uppsala, Sweden^eoPoint AB, Stockholm, SwedenNovember 1992
TR 92 32Äspö Hard Rock Laboratory:Evaluation of the combined longtermpumping and tracer test (LPT2)in borehole KAS06Ingvar Rhen' (ed.), Urban Svensson2 (ed.),Jan-Erik Andersson3, Peter Andersson3,Carl-Olof Eriksson3, Erik Gustafsson3,Thomas Ittner3, Rune Nordqvist3
'VBB VIAK ABComputer-aided Fluid Engineering3Geosigma ABNovember 1992
TR 92-33Finnsjö Study site. Scope of activitiesand main resultsKaj Ahlbom', Jan-Erik Andersson2,Peter Andersson2, Thomas Ittner2,Christer Ljunggren3, Sven Tirén2
'Conterra AB2Geosigma AB3Renco ABDecember 1992
TR 92-34Sensitivity study of rock massresponse to glaciation at Finnsjön,Central SwedenJan Israelsson1, Lars Rosengren',Ove Stephansson2
'Itasca Geomekanik AB, Falun, SwedenJRoyal Institute of Technology,Dept. of Engineering Geology, Stockholm, SwedenNovember 1992
TR 92-35Calibration and validation of astochastic continuum model using theFinnsjön Dipole Tracer Test. Acontribution to INTRAVAL Phase 2Kung Chen Shan', Vladimir Cvetkovic',Anders Winberg2
'Royal Institute of Technology, Stockholm2Conterra AB, GöteborgDecember 1992