Embed Size (px)
Citation preview
THE JOURNAL OF FINANCE • VOL. LX, NO. 4 • AUGUST 2005
On the Industry Concentration of ActivelyManaged Equity Mutual Funds
MARCIN KACPERCZYK, CLEMENS SIALM, and LU ZHENG∗
ABSTRACT
Mutual fund managers may decide to deviate from a well-diversified portfolio and con-centrate their holdings in industries where they have informational advantages. Inthis paper, we study the relation between the industry concentration and the perfor-mance of actively managed U.S. mutual funds from 1984 to 1999. Our results indicatethat, on average, more concentrated funds perform better after controlling for riskand style differences using various performance measures. This finding suggests thatinvestment ability is more evident among managers who hold portfolios concentratedin a few industries.
ACTIVELY MANAGED MUTUAL FUNDS are an important constituent of the financialsector. Despite the well-documented evidence that, on average, actively man-aged funds underperform passive benchmarks, mutual fund managers mightstill differ substantially in their investment abilities.1 In this paper, we exam-ine whether some fund managers create value by concentrating their portfoliosin industries where they have informational advantages.
Conventional wisdom suggests that investors should widely diversify theirholdings across industries to reduce their portfolios’ idiosyncratic risk. Fund
∗Kacperczyk is from the Sauder School of Business at the University of British Columbia. Sialmand Zheng are from the Stephen M. Ross School of Business at the University of Michigan. Wethank Sreedhar Bharath, Sugato Bhattacharyya, Fang Cai, Joel Dickson, William Goetzmann, RickGreen (the editor), Gautam Kaul, Lutz Kilian, Zbigniew Kominek, Francine Lafontaine, LubosPastor, Stefan Ruenzi, Tyler Shumway, Matthew Spiegel, Laura Starks, Steve Todd, Zhi Wang,Russ Wermers, Toni Whited, and especially an anonymous referee. We also benefited from helpfulcomments by seminar participants at the 2002 CIRANO seminar in Montreal, the 2003 EuropeanFinancial Management Association Meeting in Helsinki, the 2003 Summer Meeting of the Econo-metric Society, the 2004 European Finance Association Meeting in Maastricht, the 2005 AmericanFinance Association Meeting in Philadelphia, Michigan State University, the University of Col-orado at Boulder, the University of Florida, the University of Michigan, and the University of St.Gallen. We are grateful to Paul Michaud for his support with the CDA/Spectrum database. Wethank the authors of DGTW (1997) for providing us with the characteristic-adjusted stock returnsreported in their paper. We acknowledge the financial support from Mitsui Life Center in acquiringthe CDA/Spectrum data.
1 For evidence on fund performance, see, for example, Jensen (1968), Grinblatt and Titman(1989), Elton, Gruber, Das, and Hlavka (1993), Hendricks, Patel, and Zeckhauser (1993), Malkiel(1995), Brown and Goetzmann (1995), Ferson and Schadt (1996), Gruber (1996), Daniel, Grinblatt,Titman, and Wermers (DGTW) (1997), Baks, Metrick, and Wachter (2001), Kosowski, Timmer-mann, White, and Wermers (2001), Carhart, Carpenter, Lynch, and Musto (2002), Lynch, Wachter,and Boudry (2004), Cohen, Coval, and Pastor (2005), and Mamaysky, Spiegel, and Zhang (2005).
1983
1984 The Journal of Finance
managers, however, might want to hold concentrated portfolios if they believesome industries will outperform the overall market or if they have superiorinformation to select profitable stocks in specific industries.2 Consistent withthis hypothesis, we would expect funds with skilled managers to hold more con-centrated portfolios. As a result, we should observe a positive relation betweenfund performance and industry concentration.
Mutual fund managers may also hold concentrated portfolios due to a poten-tial conflict of interest between fund managers and investors. Several studiesindicate that investors reward stellar performance with disproportionately highmoney inflows but do not penalize poor performance equivalently.3 This behav-ior results in a convex option-like payoff profile for mutual funds. Consequently,some managers, especially those with lower investment abilities, may have anincentive to adopt volatile investment strategies to increase their chances ofhaving extreme performance. Consistent with this hypothesis, funds pursuingsuch gaming strategies would hold more concentrated portfolios. In this case,we should not observe a positive relation between fund performance and indus-try concentration.
The literature analyzing the net returns of mutual funds documents that mu-tual funds, on average, underperform passive benchmarks by a statistically andeconomically significant margin. However, several studies based on the grossreturns of the portfolio holdings of mutual funds conclude that managers whofollow active investment strategies have stock-picking abilities. For example,Grinblatt and Titman (1989, 1993), Grinblatt, Titman, and Wermers (1995),Daniel, Grinblatt, Titman, and Wermers (DGTW) (1997), Wermers (2000), andFrank, Poterba, Shackelford, and Shoven (2004) find evidence that mutual fundmanagers outperform their benchmarks based on the returns of fund holdings.
Coval and Moskowitz (1999, 2001) show that mutual funds exhibit a strongpreference for investing in locally headquartered firms where they appear tohave informational advantages. Nanda, Wang, and Zheng (2004) provide evi-dence that fund families following more focused investment strategies acrossfunds perform better, likely due to their informational advantages. To furtherinvestigate the informational advantages or investment abilities of mutual fundmanagers, we analyze in this paper whether some fund managers can createvalue by holding portfolios concentrated in specific industries.
Recent studies suggest that the size of a fund affects its ability to outperformthe benchmark. In a theoretical paper, Berk and Green (2004) explain manystylized facts related to fund performance using a model with rational agents.In their model, skilled active managers do not outperform passive benchmarks
2 Levy and Livingston (1995) show in a mean-variance framework that managers with superiorinformation should hold a relatively concentrated portfolio. Van Nieuwerburgh and Veldkamp(2005) argue that optimal under-diversification arises because of increasing returns to scale inlearning.
3 Numerous studies have called attention to the performance-flow relation, for example, Ippolito(1992), Brown, Harlow, and Starks (1996), Gruber (1996), Chevalier and Ellison (1997), Goetzmannand Peles (1997), Sirri and Tufano (1998), Del Guercio and Tkac (2002), and Nanda, Wang, andZheng (2004).
Industry Concentration of Actively Managed Equity Mutual Funds 1985
after deducting expenses because of a competitive market for capital provisioncombined with decreasing returns to scale in active management. In a relatedempirical study, Chen, Hong, Huang, and Kubik (2004) find that smaller fundstend to outperform larger funds due to diseconomies of scale. While the size ofthe fund negatively affects its performance, it is possible that a wide dispersionof holdings across many industries also may erode its performance. Our paperinvestigates whether such diseconomies of scope have important implicationsfor asset management.
This paper evaluates a fund’s performance conditioned upon its industry con-centration. The rationale for selecting industry concentration as the condition-ing variable is that skilled fund managers may exhibit superior performanceby holding more concentrated portfolios to exploit their informational advan-tages. To date, there has been no research on whether portfolio concentrationis related to fund performance.
Using U.S. mutual fund data from 1984 to 1999, we construct portfolios offunds with different industry concentration levels. We develop our measure, theIndustry Concentration Index (ICI), to quantify the extent of portfolio concen-tration in 10 broadly defined industries. This index is based on the differencebetween the industry weights of a mutual fund and the industry weights of thetotal market portfolio. Our analysis indicates that mutual funds differ substan-tially in their industry concentration and that concentrated funds tend to fol-low distinct investment styles. Managers of more concentrated funds overweighgrowth and small-cap stocks, whereas managers of more diversified funds holdportfolios that closely resemble the total market portfolio.
We find that more concentrated funds perform better after adjusting for riskand style differences using the four-factor model of Carhart (1997). Mutualfunds with above-median industry concentration yield an average abnormalreturn of 1.58% per year before deducting expenses and 0.33% per year afterdeducting expenses, whereas mutual funds with below-median industry con-centration yield an average abnormal return of 0.36% before and −0.77% afterexpenses. We confirm the relation between fund concentration and performanceusing panel regressions controlling for other fund characteristics. Using the con-ditional measures of Ferson and Schadt (1996), we establish that the superiorperformance of concentrated funds is not due to their greater responsivenessto macro-economic conditions.
To investigate the causes of the abnormal performance of concentrated port-folios, we follow DGTW (1997) and measure the performance of mutual fundsbased on their portfolio holdings using characteristic-based benchmarks. Theresults indicate that the superior performance of concentrated mutual fundsis primarily due to their stock selection ability. Furthermore, we find that con-centrated funds are able to select better stocks even after controlling for theaverage industry performance.
We also examine the trades of mutual funds and find that the stocks pur-chased tend to significantly outperform the stocks sold. Moreover, we showthat the return difference between the buys and the sells by mutual funds in-creases significantly with industry concentration. This finding indicates that
1986 The Journal of Finance
concentrated mutual funds are more successful in selecting securities than di-versified funds.
The remainder of the paper proceeds as follows. We describe the data in Sec-tion I. Sections II and III define the concentration and performance measures,respectively. Section IV documents the empirical results and reports severalrobustness tests. Section V concludes.
I. Data
The main data set has been created by merging the CRSP Survivorship BiasFree Mutual Fund Database with the CDA/Spectrum holdings database and theCRSP stock price data. The CRSP Mutual Fund Database includes informationon fund returns, total net assets, different types of fees, investment objectives,and other fund characteristics. One major constraint imposed on researchersusing CRSP is that it does not provide detailed information about fund holdings.We follow Wermers (2000) and merge the CRSP database with the stockhold-ings database published by CDA Investments Technologies. The CDA databaseprovides stockholdings of U.S. mutual funds. The data are collected both fromreports filed by mutual funds with the SEC and from voluntary reports gen-erated by the funds. We link each reported stock holding to the CRSP stockdatabase in order to find its price and industry classification code. The vastmajority of funds have holdings of companies listed on the NYSE, NASDAQ,or AMEX stock exchanges. However, there also are funds for which we are notable to identify the price and the industry code of certain holdings. The missingdata, however, constitute less than 1% of all holdings. The Appendix providesfurther details pertaining to the merging process.
Our final sample spans the period between January 1984 and December1999. We eliminate balanced, bond, index, international, and sector funds, andfocus our analysis on actively managed diversified equity funds. In addition,we include funds with multiple share classes only once. We also eliminate allobservations where fewer than 11 stock holdings could be identified. Finally, weexclude all fund observations where the size of the fund in the previous quarterdoes not exceed $1 million. With all the exclusions, our final sample includes1,771 actively managed diversified equity funds. Panel A of Table I presentssummary statistics of the data.
II. Industry Concentration Index
We define our measure of industry concentration, the Industry ConcentrationIndex, based on the fund holdings. Specifically, we assign each stock held by amutual fund to one of 10 industries. In the Appendix, we present the detailedcomposition of the industries. The Industry Concentration Index at time t fora mutual fund is defined as the sum of the squared deviations of the valueweights for each of the 10 different industries held by the mutual fund, wj ,t ,relative to the industry weights of the total stock market, w j ,t :
Industry Concentration of Actively Managed Equity Mutual Funds 1987
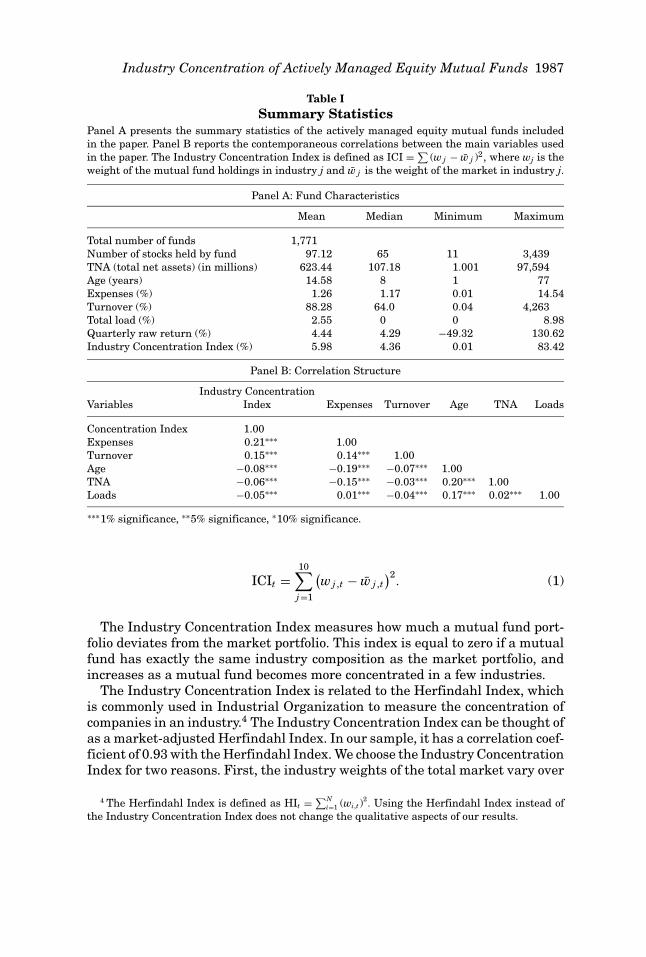
Table ISummary Statistics
Panel A presents the summary statistics of the actively managed equity mutual funds includedin the paper. Panel B reports the contemporaneous correlations between the main variables usedin the paper. The Industry Concentration Index is defined as ICI = ∑
(w j − w j )2, where wj is theweight of the mutual fund holdings in industry j and w j is the weight of the market in industry j.
Panel A: Fund Characteristics
Mean Median Minimum Maximum
Total number of funds 1,771Number of stocks held by fund 97.12 65 11 3,439TNA (total net assets) (in millions) 623.44 107.18 1.001 97,594Age (years) 14.58 8 1 77Expenses (%) 1.26 1.17 0.01 14.54Turnover (%) 88.28 64.0 0.04 4,263Total load (%) 2.55 0 0 8.98Quarterly raw return (%) 4.44 4.29 −49.32 130.62Industry Concentration Index (%) 5.98 4.36 0.01 83.42
Panel B: Correlation Structure
Industry ConcentrationVariables Index Expenses Turnover Age TNA Loads
Concentration Index 1.00Expenses 0.21∗∗∗ 1.00Turnover 0.15∗∗∗ 0.14∗∗∗ 1.00Age −0.08∗∗∗ −0.19∗∗∗ −0.07∗∗∗ 1.00TNA −0.06∗∗∗ −0.15∗∗∗ −0.03∗∗∗ 0.20∗∗∗ 1.00Loads −0.05∗∗∗ 0.01∗∗∗ −0.04∗∗∗ 0.17∗∗∗ 0.02∗∗∗ 1.00
∗∗∗1% significance, ∗∗5% significance, ∗10% significance.
ICIt =10∑
j=1
(wj ,t − w j ,t
)2. (1)
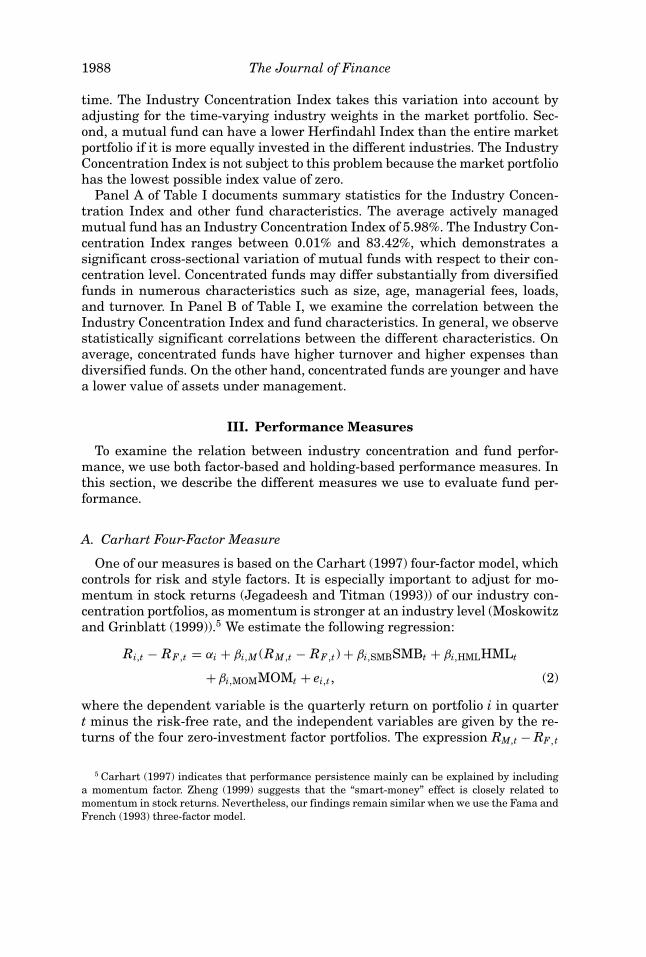
The Industry Concentration Index measures how much a mutual fund port-folio deviates from the market portfolio. This index is equal to zero if a mutualfund has exactly the same industry composition as the market portfolio, andincreases as a mutual fund becomes more concentrated in a few industries.
The Industry Concentration Index is related to the Herfindahl Index, whichis commonly used in Industrial Organization to measure the concentration ofcompanies in an industry.4 The Industry Concentration Index can be thought ofas a market-adjusted Herfindahl Index. In our sample, it has a correlation coef-ficient of 0.93 with the Herfindahl Index. We choose the Industry ConcentrationIndex for two reasons. First, the industry weights of the total market vary over
4 The Herfindahl Index is defined as HIt = ∑Ni=1 (wi,t )
2. Using the Herfindahl Index instead of
the Industry Concentration Index does not change the qualitative aspects of our results.
1988 The Journal of Finance
time. The Industry Concentration Index takes this variation into account byadjusting for the time-varying industry weights in the market portfolio. Sec-ond, a mutual fund can have a lower Herfindahl Index than the entire marketportfolio if it is more equally invested in the different industries. The IndustryConcentration Index is not subject to this problem because the market portfoliohas the lowest possible index value of zero.
Panel A of Table I documents summary statistics for the Industry Concen-tration Index and other fund characteristics. The average actively managedmutual fund has an Industry Concentration Index of 5.98%. The Industry Con-centration Index ranges between 0.01% and 83.42%, which demonstrates asignificant cross-sectional variation of mutual funds with respect to their con-centration level. Concentrated funds may differ substantially from diversifiedfunds in numerous characteristics such as size, age, managerial fees, loads,and turnover. In Panel B of Table I, we examine the correlation between theIndustry Concentration Index and fund characteristics. In general, we observestatistically significant correlations between the different characteristics. Onaverage, concentrated funds have higher turnover and higher expenses thandiversified funds. On the other hand, concentrated funds are younger and havea lower value of assets under management.
III. Performance Measures
To examine the relation between industry concentration and fund perfor-mance, we use both factor-based and holding-based performance measures. Inthis section, we describe the different measures we use to evaluate fund per-formance.
A. Carhart Four-Factor Measure
One of our measures is based on the Carhart (1997) four-factor model, whichcontrols for risk and style factors. It is especially important to adjust for mo-mentum in stock returns (Jegadeesh and Titman (1993)) of our industry con-centration portfolios, as momentum is stronger at an industry level (Moskowitzand Grinblatt (1999)).5 We estimate the following regression:
Ri,t − RF ,t = αi + βi,M (RM ,t − RF ,t) + βi,SMBSMBt + βi,HMLHMLt
+ βi,MOMMOMt + ei,t , (2)
where the dependent variable is the quarterly return on portfolio i in quartert minus the risk-free rate, and the independent variables are given by the re-turns of the four zero-investment factor portfolios. The expression RM,t − RF , t
5 Carhart (1997) indicates that performance persistence mainly can be explained by includinga momentum factor. Zheng (1999) suggests that the “smart-money” effect is closely related tomomentum in stock returns. Nevertheless, our findings remain similar when we use the Fama andFrench (1993) three-factor model.
Industry Concentration of Actively Managed Equity Mutual Funds 1989
denotes the excess return of the market portfolio over the risk-free rate;6 SMB isthe return difference between small and large capitalization stocks; HML is thereturn difference between high and low book-to-market stocks; and MOM is thereturn difference between stocks with high and low past returns.7 The interceptof the model, αi, is the Carhart measure of abnormal performance.
To account for possible differences in idiosyncratic risk exposure, we alsocompute the appraisal ratio of Treynor and Black (1973), defined as the ratioof the intercept from the regression equation (2) and the standard deviation ofthe residuals from the same regression.
B. Ferson–Schadt Conditional Measure
Ferson and Schadt (1996) argue that the traditional unconditional measuresof abnormal performance might be unreliable because common variation inrisk levels and risk premia will be confounded with average performance. Theyargue that a managed portfolio strategy that can be replicated using readilyavailable public information should not be judged as having superior perfor-mance. They advocate a model based on conditional performance, which usespredetermined instruments to capture the time-varying factor loadings. Ourspecification of the conditional model follows Wermers (2003) and includes in-teraction terms between the excess market returns and various macro-economicvariables:
Ri,t − RF ,t = αi + βi,M (RM ,t − RF ,t) + βi,SMBSMBt + βi,HMLHMLt
+ βi,MOMMOMt +4∑
j=1
βi, j [zj ,t−1(RM ,t − RF ,t)] + ei,t , (3)
where zj, t−1 is the demeaned value of the lagged macro-economic variable j. Con-sistent with the previous studies, we consider the following four macro-economicvariables: the 1-month Treasury bill yield, the dividend yield of the S&P 500Index, the Treasury yield spread (long- minus short-term bonds), and the qual-ity spread in the corporate bond market (low- minus high-grade bonds).8 Theintercept of the model, αi, is the conditional measure of performance.
C. DGTW Measures
To investigate the causes of the abnormal performance, we use an alternativeset of measures based on the fund holdings rather than the time-series of fund
6 The market return is calculated as the value-weighted return on all NYSE, AMEX, and NAS-DAQ stocks using the CRSP database. The monthly return of the 1-month Treasury bill rate isobtained from Ibbotson Associates.
7 The size, the value, and the momentum factor returns were taken from Kenneth French’s Website http://mba.tuck.dartmouth.edu/pages/faculty/ken.french/Data Library.
8 Ferson and Schadt (1996) also include an indicator variable for January. We exclude this in-dicator variable because our data are at a quarterly frequency and because the coefficient on theinteraction term between the excess market return and an indicator variable for the first quarteris usually not statistically significantly different from zero.
1990 The Journal of Finance
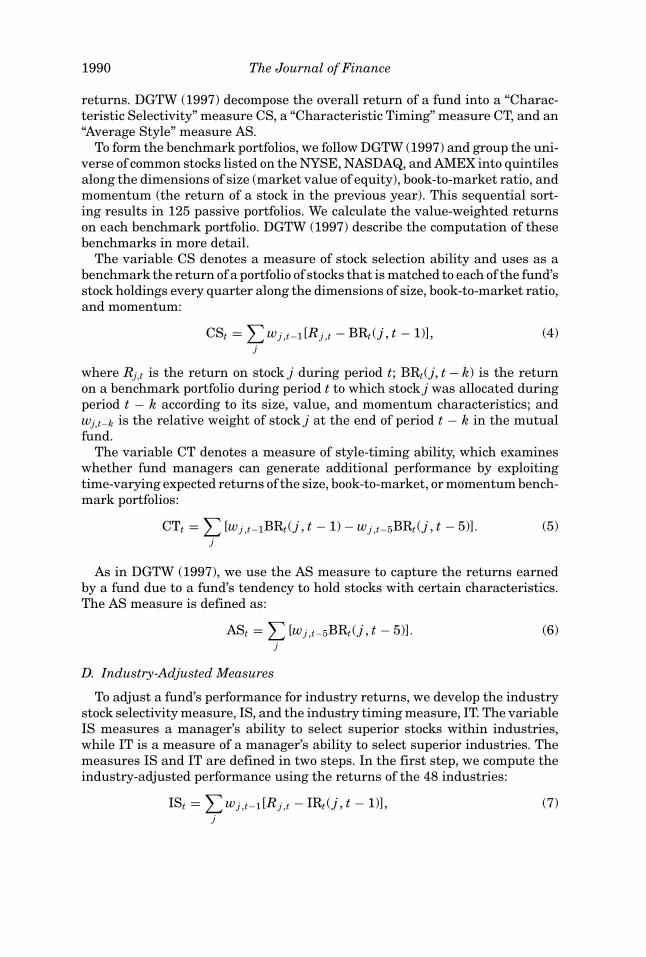
returns. DGTW (1997) decompose the overall return of a fund into a “Charac-teristic Selectivity” measure CS, a “Characteristic Timing” measure CT, and an“Average Style” measure AS.
To form the benchmark portfolios, we follow DGTW (1997) and group the uni-verse of common stocks listed on the NYSE, NASDAQ, and AMEX into quintilesalong the dimensions of size (market value of equity), book-to-market ratio, andmomentum (the return of a stock in the previous year). This sequential sort-ing results in 125 passive portfolios. We calculate the value-weighted returnson each benchmark portfolio. DGTW (1997) describe the computation of thesebenchmarks in more detail.
The variable CS denotes a measure of stock selection ability and uses as abenchmark the return of a portfolio of stocks that is matched to each of the fund’sstock holdings every quarter along the dimensions of size, book-to-market ratio,and momentum:
CSt =∑
j
w j ,t−1[R j ,t − BRt( j , t − 1)], (4)
where Rj,t is the return on stock j during period t; BRt( j, t − k) is the returnon a benchmark portfolio during period t to which stock j was allocated duringperiod t − k according to its size, value, and momentum characteristics; andwj,t−k is the relative weight of stock j at the end of period t − k in the mutualfund.
The variable CT denotes a measure of style-timing ability, which examineswhether fund managers can generate additional performance by exploitingtime-varying expected returns of the size, book-to-market, or momentum bench-mark portfolios:
CTt =∑
j
[wj ,t−1BRt( j , t − 1) − wj ,t−5BRt( j , t − 5)]. (5)
As in DGTW (1997), we use the AS measure to capture the returns earnedby a fund due to a fund’s tendency to hold stocks with certain characteristics.The AS measure is defined as:
ASt =∑
j
[wj ,t−5BRt( j , t − 5)]. (6)
D. Industry-Adjusted Measures
To adjust a fund’s performance for industry returns, we develop the industrystock selectivity measure, IS, and the industry timing measure, IT. The variableIS measures a manager’s ability to select superior stocks within industries,while IT is a measure of a manager’s ability to select superior industries. Themeasures IS and IT are defined in two steps. In the first step, we compute theindustry-adjusted performance using the returns of the 48 industries:
ISt =∑
j
w j ,t−1[R j ,t − IRt( j , t − 1)], (7)
Industry Concentration of Actively Managed Equity Mutual Funds 1991
ITt =∑
j
[wj ,t−1IRt( j , t − 1) − wj ,t−5IRt( j , t − 5)], (8)
where IRt( j, t − k) is the return on an industry portfolio during period t, to whichstock j was allocated during period t − k. The variables R and w are the sameas defined previously. In the second step, we regress the IS and IT measures onthe Carhart four-factor model to obtain industry-adjusted abnormal returns.
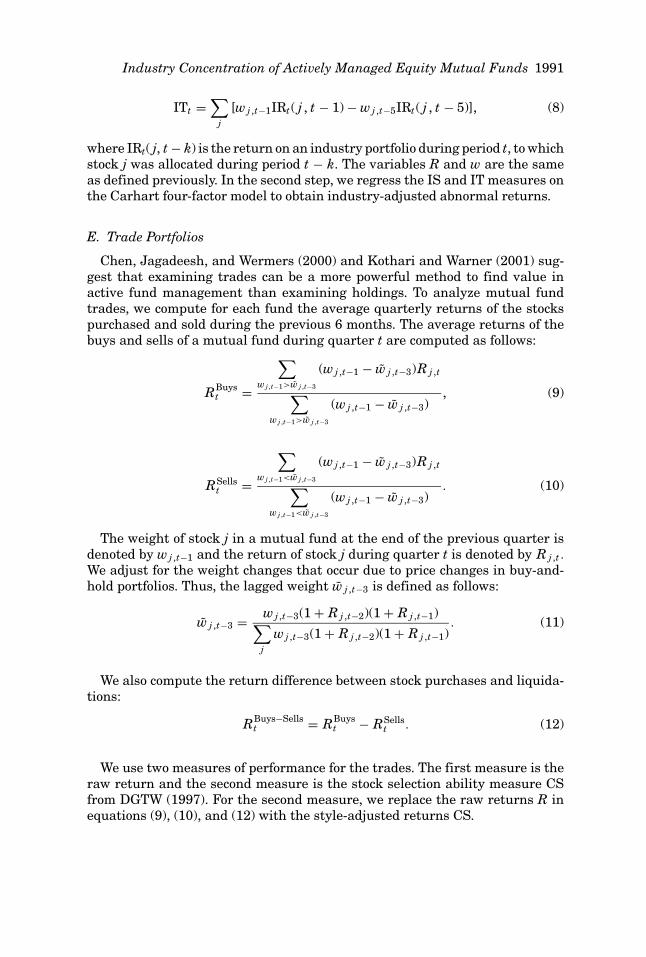
E. Trade Portfolios
Chen, Jagadeesh, and Wermers (2000) and Kothari and Warner (2001) sug-gest that examining trades can be a more powerful method to find value inactive fund management than examining holdings. To analyze mutual fundtrades, we compute for each fund the average quarterly returns of the stockspurchased and sold during the previous 6 months. The average returns of thebuys and sells of a mutual fund during quarter t are computed as follows:
RBuyst =
∑
wj ,t−1>w j ,t−3
(wj ,t−1 − w j ,t−3)R j ,t
∑
wj ,t−1>w j ,t−3
(wj ,t−1 − w j ,t−3), (9)
RSellst =
∑
wj ,t−1<w j ,t−3
(wj ,t−1 − w j ,t−3)R j ,t
∑
wj ,t−1<w j ,t−3
(wj ,t−1 − w j ,t−3). (10)
The weight of stock j in a mutual fund at the end of the previous quarter isdenoted by wj ,t−1 and the return of stock j during quarter t is denoted by R j ,t .
We adjust for the weight changes that occur due to price changes in buy-and-hold portfolios. Thus, the lagged weight w j ,t−3 is defined as follows:
w j ,t−3 = wj ,t−3(1 + R j ,t−2)(1 + R j ,t−1)∑
j
w j ,t−3(1 + R j ,t−2)(1 + R j ,t−1). (11)
We also compute the return difference between stock purchases and liquida-tions:
RBuys−Sellst = RBuys
t − RSellst . (12)
We use two measures of performance for the trades. The first measure is theraw return and the second measure is the stock selection ability measure CSfrom DGTW (1997). For the second measure, we replace the raw returns R inequations (9), (10), and (12) with the style-adjusted returns CS.
1992 The Journal of Finance
IV. Empirical Evidence
In this section, we present the empirical results. First, we investigate therelation between industry concentration and fund performance using both aportfolio and a regression approach. We then examine how fund size and invest-ment style interact with the observed relation. Finally, we analyze the tradesof mutual funds to further explore the relation between industry concentrationand fund performance.
A. Portfolio Evidence
To gauge the relative performance of funds with different concentration lev-els, we sort all mutual funds into 10 portfolios according to their Industry Con-centration Index at the beginning of each quarter. For each decile portfolio, wecompute the equally weighted average return for each quarter. For this estima-tion, we use the performance information from all funds, including funds withshort return histories, thus mitigating a potential selection bias.
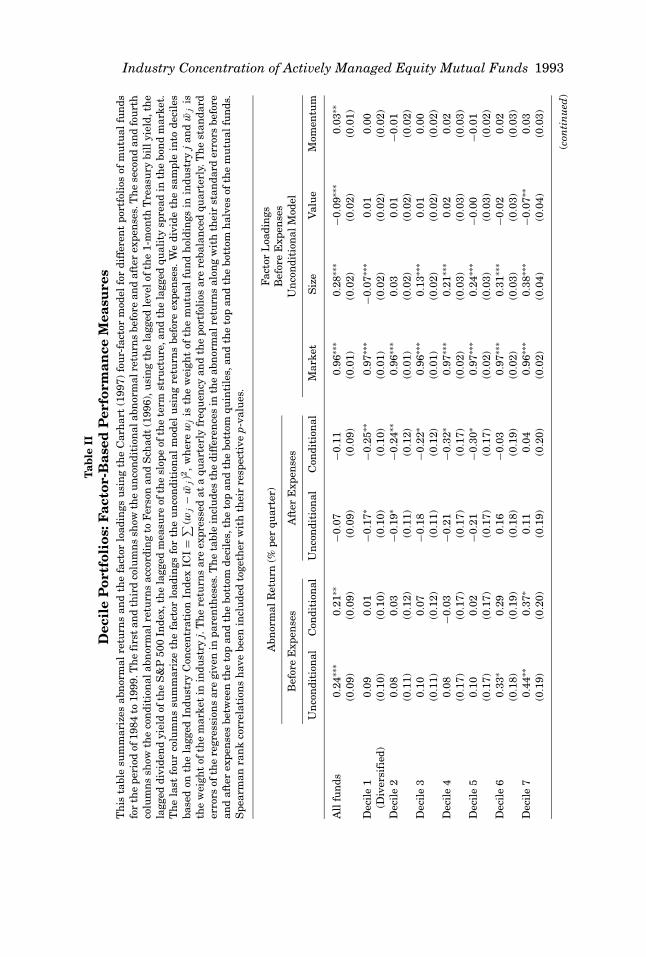
A.1. Factor-Based Performance Measures
Table II summarizes the results of the unconditional and conditional four-factor models, as in equations (2) and (3). We examine the factor-adjusted re-turns before and after subtracting expenses. Looking at the returns before ex-penses enables us to better evaluate the investment ability of mutual fundmanagers, since managers with better skills may charge higher expenses toextract rents, as discussed in Berk and Green (2004). On the other hand, thereturns after expenses are important for mutual fund investors.
The unconditional abnormal returns before expenses are summarized in thefirst column. The results indicate that the most diversified fund portfolio gen-erates an abnormal return of 0.09% per quarter, while the most concentratedfund portfolio generates an abnormal return of 0.53% per quarter. The abnor-mal returns of the five most concentrated portfolios are all significantly positiveat the 10% level. In contrast, the abnormal returns of the five most diversifiedportfolios are all not significantly different from zero. The difference in thequarterly abnormal returns between the five most and the five least concen-trated deciles equals 0.30% points per quarter, which is statistically significantat the 5% level. The magnitude of the performance difference increases furtherif we compare the top and the bottom quintiles or deciles. The Spearman rankcorrelation between fund concentration and performance equals 0.87 and is sig-nificant at the 1% level. Hence, the evidence indicates that concentrated fundsperform better than diversified funds before deducting expenses.
The second column summarizes the abnormal performance using the condi-tional four-factor model. In general, the results of the conditional model arestronger and statistically more significant than the results using the uncon-ditional model. Thus, the performance difference between the concentratedand the diversified funds is not driven by their responses to macro-economicconditions.
Industry Concentration of Actively Managed Equity Mutual Funds 1993T
able
IID
ecil
eP
ortf
olio
s:F
acto
r-B
ased
Per
form
ance
Mea
sure
sT
his
tabl
esu
mm
ariz
esab
nor
mal
retu
rns
and
the
fact
orlo
adin
gsu
sin
gth
eC
arh
art
(199
7)fo
ur-
fact
orm
odel
for
diff
eren
tpo
rtfo
lios
ofm
utu
alfu
nds
for
the
peri
odof
1984
to19
99.T
he
firs
tan
dth
ird
colu
mn
ssh
owth
eu
nco
ndi
tion
alab
nor
mal
retu
rns
befo
rean
daf
ter
expe
nse
s.T
he
seco
nd
and
fou
rth
colu
mn
ssh
owth
eco
ndi
tion
alab
nor
mal
retu
rns
acco
rdin
gto
Fer
son
and
Sch
adt
(199
6),u
sin
gth
ela
gged
leve
loft
he
1-m
onth
Tre
asu
rybi
llyi
eld,
the
lagg
eddi
vide
nd
yiel
dof
the
S&
P50
0In
dex,
the
lagg
edm
easu
reof
the
slop
eof
the
term
stru
ctu
re,a
nd
the
lagg
edqu
alit
ysp
read
inth
ebo
nd
mar
ket.
Th
ela
stfo
ur
colu
mn
ssu
mm
ariz
eth
efa
ctor
load
ings
for
the
un
con
diti
onal
mod
elu
sin
gre
turn
sbe
fore
expe
nse
s.W
edi
vide
the
sam
ple
into
deci
les
base
don
the
lagg
edIn
dust
ryC
once
ntr
atio
nIn
dex
ICI
=∑
(wj−
wj)
2,
wh
ere
wj
isth
ew
eigh
tof
the
mu
tual
fun
dh
oldi
ngs
inin
dust
ryj
and
wj
isth
ew
eigh
tof
the
mar
ket
inin
dust
ryj.
Th
ere
turn
sar
eex
pres
sed
ata
quar
terl
yfr
equ
ency
and
the
port
foli
osar
ere
bala
nce
dqu
arte
rly.
Th
est
anda
rder
rors
ofth
ere
gres
sion
sar
egi
ven
inpa
ren
thes
es.T
he
tabl
ein
clu
des
the
diff
eren
ces
inth
eab
nor
mal
retu
rns
alon
gw
ith
thei
rst
anda
rder
rors
befo
rean
daf
ter
expe
nse
sbe
twee
nth
eto
pan
dth
ebo
ttom
deci
les,
the
top
and
the
bott
omqu
inti
les,
and
the
top
and
the
bott
omh
alve
sof
the
mu
tual
fun
ds.
Spe
arm
anra
nk
corr
elat
ion
sh
ave
been
incl
ude
dto
geth
erw
ith
thei
rre
spec
tive
p-va
lues
.
Fact
orL
oadi
ngs
Abn
orm
alR
etu
rn(%
per
quar
ter)
Bef
ore
Exp
ense
sB
efor
eE
xpen
ses
Aft
erE
xpen
ses
Un
con
diti
onal
Mod
el
Un
con
diti
onal
Con
diti
onal
Un
con
diti
onal
Con
diti
onal
Mar
ket
Siz
eV
alu
eM
omen
tum
All
fun
ds0.
24∗∗
∗0.
21∗∗
−0.0
7−0
.11
0.96
∗∗∗
0.28
∗∗∗
−0.0
9∗∗∗
0.03
∗∗(0
.09)
(0.0
9)(0
.09)
(0.0
9)(0
.01)
(0.0
2)(0
.02)
(0.0
1)
Dec
ile
10.
090.
01−0
.17∗
−0.2
5∗∗
0.97
∗∗∗
−0.0
7∗∗∗
0.01
0.00
(Div
ersi
fied
)(0
.10)
(0.1
0)(0
.10)
(0.1
0)(0
.01)
(0.0
2)(0
.02)
(0.0
2)D
ecil
e2
0.08
0.03
−0.1
9∗−0
.24∗
∗0.
96∗∗
∗0.
030.
01−0
.01
(0.1
1)(0
.12)
(0.1
1)(0
.12)
(0.0
1)(0
.02)
(0.0
2)(0
.02)
Dec
ile
30.
100.
07−0
.18
−0.2
2∗0.
96∗∗
∗0.
13∗∗
∗0.
010.
00(0
.11)
(0.1
2)(0
.11)
(0.1
2)(0
.01)
(0.0
2)(0
.02)
(0.0
2)D
ecil
e4
0.08
−0.0
3−0
.21
−0.3
2∗0.
97∗∗
∗0.
21∗∗
∗0.
020.
02(0
.17)
(0.1
7)(0
.17)
(0.1
7)(0
.02)
(0.0
3)(0
.03)
(0.0
3)D
ecil
e5
0.10
0.02
−0.2
1−0
.30∗
0.97
∗∗∗
0.24
∗∗∗
−0.0
0−0
.01
(0.1
7)(0
.17)
(0.1
7)(0
.17)
(0.0
2)(0
.03)
(0.0
3)(0
.02)
Dec
ile
60.
33∗
0.29
0.16
−0.0
30.
97∗∗
∗0.
31∗∗
∗−0
.02
0.02
(0.1
8)(0
.19)
(0.1
8)(0
.19)
(0.0
2)(0
.03)
(0.0
3)(0
.03)
Dec
ile
70.
44∗∗
0.37
∗0.
110.
040.
96∗∗
∗0.
38∗∗
∗−0
.07∗
∗0.
03(0
.19)
(0.2
0)(0
.19)
(0.2
0)(0
.02)
(0.0
4)(0
.04)
(0.0
3)
(con
tin
ued
)
1994 The Journal of Finance
Tab
leII
—C
onti
nu
ed
Fact
orL
oadi
ngs
Abn
orm
alR
etu
rn(%
per
quar
ter)
Bef
ore
Exp
ense
sB
efor
eE
xpen
ses
Aft
erE
xpen
ses
Un
con
diti
onal
Mod
el
Un
con
diti
onal
Con
diti
onal
Un
con
diti
onal
Con
diti
onal
Mar
ket
Siz
eV
alu
eM
omen
tum
Dec
ile
80.
26∗
0.30
∗−0
.08
−0.0
40.
97∗∗
∗0.
49∗∗
∗−0
.16∗
∗∗0.
05∗∗
(0.1
6)(0
.16)
(0.1
6)(0
.16)
(0.0
2)(0
.03)
(0.0
3)(0
.02)
Dec
ile
90.
42∗∗
0.41
∗∗0.
070.
070.
99∗∗
∗0.
49∗∗
∗−0
.25∗
∗∗0.
07∗∗
(0.1
8)(0
.20)
(0.1
8)(0
.20)
(0.0
2)(0
.04)
(0.0
3)(0
.03)
Dec
ile
100.
53∗
0.59
∗∗0.
150.
220.
93∗∗
∗0.
64∗∗
∗−0
.47∗
∗∗0.
12∗∗
∗(C
once
ntr
ated
)(0
.29)
(0.3
0)(0
.29)
(0.3
0)(0
.04)
(0.0
5)(0
.05)
(0.0
4)
2nd
hal
f–1st
hal
f0.
30∗∗
0.37
∗∗∗
0.24
∗0.
32∗∗
−0.0
00.
35∗∗
∗−0
.20∗
∗∗0.
06∗∗
∗(0
.14)
(0.1
4)(0
.14)
(0.1
4)(0
.02)
(0.0
3)(0
.03)
(0.0
2)5th
quin
tile
–1st
quin
tile
0.39
∗∗0.
48∗∗
0.29
0.39
∗−0
.01
0.58
∗∗∗
−0.3
7∗∗∗
0.10
∗∗∗
(0.2
0)(0
.21)
(0.2
0)(0
.21)
(0.0
3)(0
.04)
(0.0
4)(0
.03)
10th
deci
le–1
stde
cile
0.44
0.58
∗0.
320.
47−0
.04
0.70
∗∗∗
−0.4
8∗∗∗
0.12
∗∗(0
.30)
(0.3
2)(0
.30)
(0.3
2)(0
.04)
(0.0
6)(0
.06)
(0.0
5)S
pear
man
ran
kco
rrel
atio
n0.
87∗∗
∗0.
85∗∗
∗0.
71∗∗
0.78
∗∗∗
−0.0
40.
99∗∗
∗−0
.92∗
∗∗0.
82∗∗
∗(0
.00)
(0.0
0)(0
.02)
(0.0
1)(0
.91)
(0.0
0)(0
.00)
(0.0
0)
∗∗∗ 1
%si
gnif
ican
ce,∗
∗ 5%
sign
ific
ance
,∗10
%si
gnif
ican
ce.
Industry Concentration of Actively Managed Equity Mutual Funds 1995
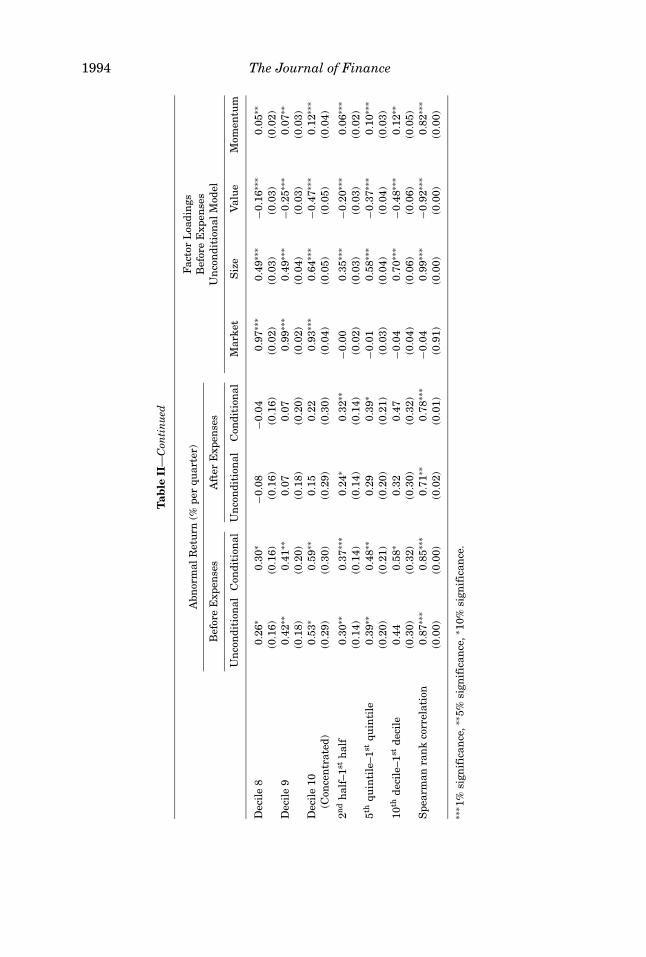
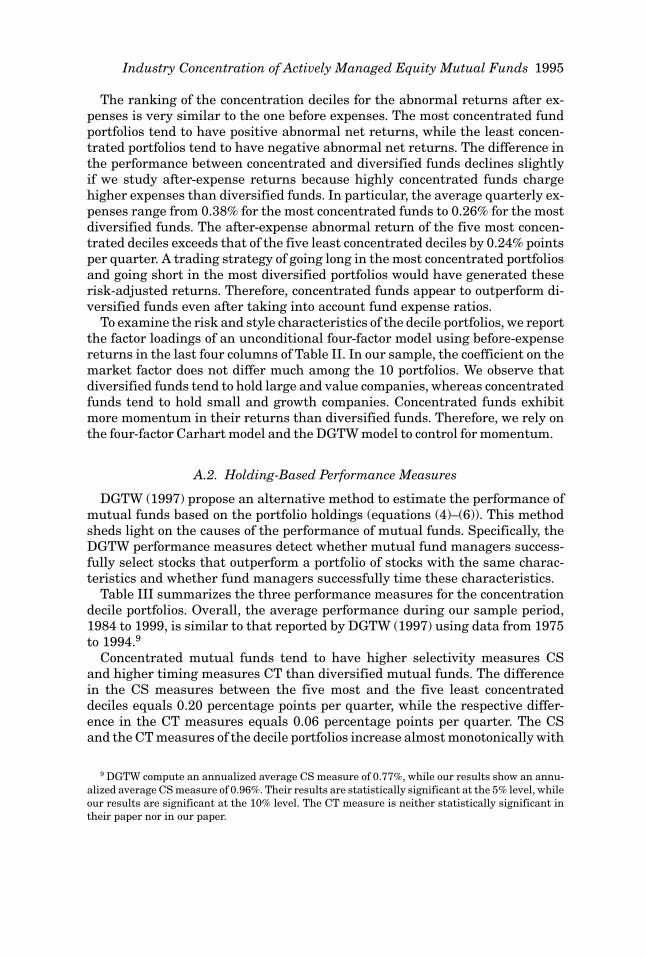
The ranking of the concentration deciles for the abnormal returns after ex-penses is very similar to the one before expenses. The most concentrated fundportfolios tend to have positive abnormal net returns, while the least concen-trated portfolios tend to have negative abnormal net returns. The difference inthe performance between concentrated and diversified funds declines slightlyif we study after-expense returns because highly concentrated funds chargehigher expenses than diversified funds. In particular, the average quarterly ex-penses range from 0.38% for the most concentrated funds to 0.26% for the mostdiversified funds. The after-expense abnormal return of the five most concen-trated deciles exceeds that of the five least concentrated deciles by 0.24% pointsper quarter. A trading strategy of going long in the most concentrated portfoliosand going short in the most diversified portfolios would have generated theserisk-adjusted returns. Therefore, concentrated funds appear to outperform di-versified funds even after taking into account fund expense ratios.
To examine the risk and style characteristics of the decile portfolios, we reportthe factor loadings of an unconditional four-factor model using before-expensereturns in the last four columns of Table II. In our sample, the coefficient on themarket factor does not differ much among the 10 portfolios. We observe thatdiversified funds tend to hold large and value companies, whereas concentratedfunds tend to hold small and growth companies. Concentrated funds exhibitmore momentum in their returns than diversified funds. Therefore, we rely onthe four-factor Carhart model and the DGTW model to control for momentum.
A.2. Holding-Based Performance Measures
DGTW (1997) propose an alternative method to estimate the performance ofmutual funds based on the portfolio holdings (equations (4)–(6)). This methodsheds light on the causes of the performance of mutual funds. Specifically, theDGTW performance measures detect whether mutual fund managers success-fully select stocks that outperform a portfolio of stocks with the same charac-teristics and whether fund managers successfully time these characteristics.
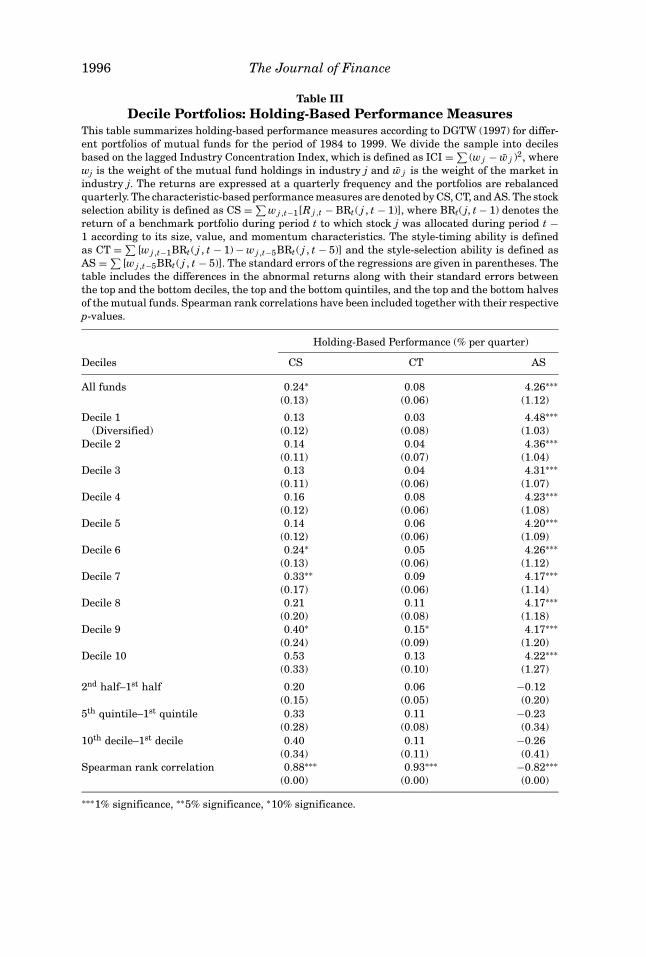
Table III summarizes the three performance measures for the concentrationdecile portfolios. Overall, the average performance during our sample period,1984 to 1999, is similar to that reported by DGTW (1997) using data from 1975to 1994.9
Concentrated mutual funds tend to have higher selectivity measures CSand higher timing measures CT than diversified mutual funds. The differencein the CS measures between the five most and the five least concentrateddeciles equals 0.20 percentage points per quarter, while the respective differ-ence in the CT measures equals 0.06 percentage points per quarter. The CSand the CT measures of the decile portfolios increase almost monotonically with
9 DGTW compute an annualized average CS measure of 0.77%, while our results show an annu-alized average CS measure of 0.96%. Their results are statistically significant at the 5% level, whileour results are significant at the 10% level. The CT measure is neither statistically significant intheir paper nor in our paper.
1996 The Journal of Finance
Table IIIDecile Portfolios: Holding-Based Performance Measures
This table summarizes holding-based performance measures according to DGTW (1997) for differ-ent portfolios of mutual funds for the period of 1984 to 1999. We divide the sample into decilesbased on the lagged Industry Concentration Index, which is defined as ICI = ∑
(w j − w j )2, wherewj is the weight of the mutual fund holdings in industry j and w j is the weight of the market inindustry j. The returns are expressed at a quarterly frequency and the portfolios are rebalancedquarterly. The characteristic-based performance measures are denoted by CS, CT, and AS. The stockselection ability is defined as CS = ∑
w j ,t−1[R j ,t − BRt ( j , t − 1)], where BRt( j, t − 1) denotes thereturn of a benchmark portfolio during period t to which stock j was allocated during period t −1 according to its size, value, and momentum characteristics. The style-timing ability is definedas CT = ∑
[w j ,t−1BRt ( j , t − 1) − w j ,t−5BRt ( j , t − 5)] and the style-selection ability is defined asAS = ∑
[w j ,t−5BRt ( j , t − 5)]. The standard errors of the regressions are given in parentheses. Thetable includes the differences in the abnormal returns along with their standard errors betweenthe top and the bottom deciles, the top and the bottom quintiles, and the top and the bottom halvesof the mutual funds. Spearman rank correlations have been included together with their respectivep-values.
Holding-Based Performance (% per quarter)
Deciles CS CT AS
All funds 0.24∗ 0.08 4.26∗∗∗(0.13) (0.06) (1.12)
Decile 1 0.13 0.03 4.48∗∗∗(Diversified) (0.12) (0.08) (1.03)
Decile 2 0.14 0.04 4.36∗∗∗(0.11) (0.07) (1.04)
Decile 3 0.13 0.04 4.31∗∗∗(0.11) (0.06) (1.07)
Decile 4 0.16 0.08 4.23∗∗∗(0.12) (0.06) (1.08)
Decile 5 0.14 0.06 4.20∗∗∗(0.12) (0.06) (1.09)
Decile 6 0.24∗ 0.05 4.26∗∗∗(0.13) (0.06) (1.12)
Decile 7 0.33∗∗ 0.09 4.17∗∗∗(0.17) (0.06) (1.14)
Decile 8 0.21 0.11 4.17∗∗∗(0.20) (0.08) (1.18)
Decile 9 0.40∗ 0.15∗ 4.17∗∗∗(0.24) (0.09) (1.20)
Decile 10 0.53 0.13 4.22∗∗∗(0.33) (0.10) (1.27)
2nd half–1st half 0.20 0.06 −0.12(0.15) (0.05) (0.20)
5th quintile–1st quintile 0.33 0.11 −0.23(0.28) (0.08) (0.34)
10th decile–1st decile 0.40 0.11 −0.26(0.34) (0.11) (0.41)
Spearman rank correlation 0.88∗∗∗ 0.93∗∗∗ −0.82∗∗∗(0.00) (0.00) (0.00)
∗∗∗1% significance, ∗∗5% significance, ∗10% significance.
Industry Concentration of Actively Managed Equity Mutual Funds 1997
the Industry Concentration Index, which results in statistically significantSpearman rank correlations. Consistent with our earlier results, concentratedfunds exhibit better stock-picking and style-timing abilities than diversifiedfunds.
B. Multivariate Regression Evidence
In this section, we further extend our analysis using multivariate regres-sions. This approach differs from the portfolio approach in three major respects.First, the decile portfolio analysis does not control for mutual fund characteris-tics that are related to fund performance. For example, well-diversified mutualfunds are, on average, larger than concentrated funds. It might be that smallerfunds perform better than larger funds, and that the concentration level mat-ters only because it is correlated with size. A multivariate regression frame-work simultaneously controls for these different factors. Second, the portfolioapproach aggregates mutual funds of similar concentration levels into differentgroups. Here, we take advantage of the rich panel of individual mutual funds.Third, in the previous section we assume constant factor loadings across time.To take into account possible time variations in the factor loadings of individ-ual funds, the regressions use past data to estimate the four-factor model anddetermine the abnormal returns during a subsequent period. In the regressionanalyses, we examine the concentration–performance relation using the uncon-ditional and conditional four-factor as well as the holding-based performancemeasures.
B.1. Factor-Based Performance Measures
We use 3 years of past monthly returns to estimate the coefficients of theunconditional and conditional factor models. Subsequently, we subtract theexpected return from the realized fund return to determine the abnormal returnof a fund in each quarter.10
Next, we regress the abnormal return of each mutual fund in each quarter onthe Industry Concentration Index and on other fund characteristics. We lag allexplanatory variables by one quarter, except for expenses and turnover, whichare lagged by 1 year due to data availability. Using the lagged explanatoryvariables mitigates potential endogeneity problems. We take the natural loga-rithms of the age and the size variables because both variables are skewed tothe right. Wermers (2003) shows that flows by mutual fund investors can havean impact on asset prices. To control for the effect of lagged inflows, we includethe lagged-quarter flows into each mutual fund as an additional explanatoryvariable.11 Each regression additionally includes time fixed effects.
We estimate the regressions with panel-corrected standard errors (PCSE).The PCSE specification adjusts for the contemporaneous correlation and
10 One limitation of this approach is that we have to exclude young mutual funds that do nothave a sufficiently long return history.
11 We calculate quarter flows following Gruber (1996) and Zheng (1999).
1998 The Journal of Finance
Table IVRegression Evidence
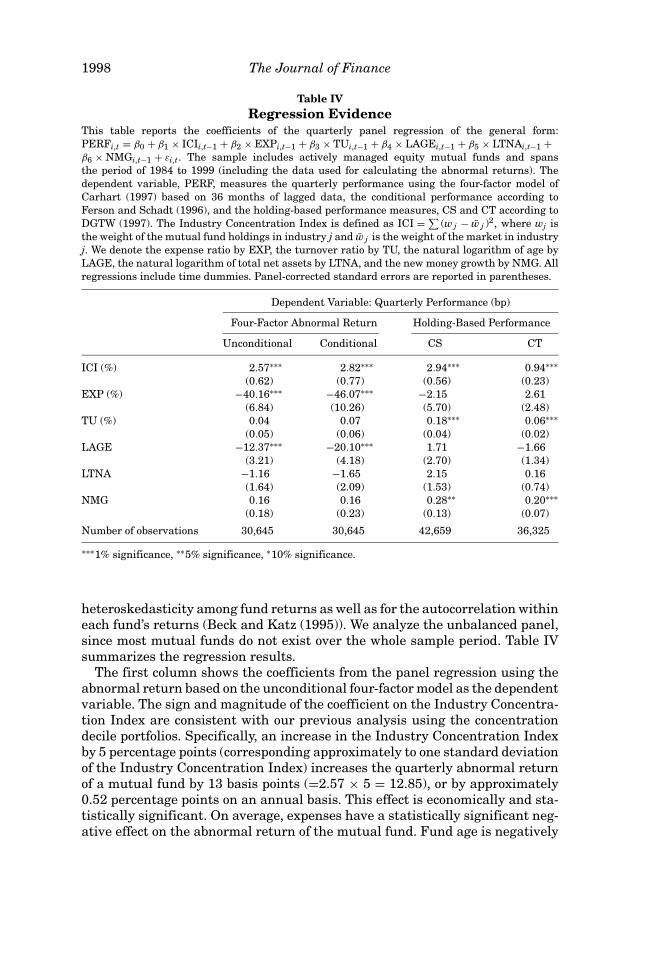
This table reports the coefficients of the quarterly panel regression of the general form:PERFi,t = β0 + β1 × ICIi,t−1 + β2 × EXPi,t−1 + β3 × TUi,t−1 + β4 × LAGEi,t−1 + β5 × LTNAi,t−1 +β6 × NMGi,t−1 + εi,t. The sample includes actively managed equity mutual funds and spansthe period of 1984 to 1999 (including the data used for calculating the abnormal returns). Thedependent variable, PERF, measures the quarterly performance using the four-factor model ofCarhart (1997) based on 36 months of lagged data, the conditional performance according toFerson and Schadt (1996), and the holding-based performance measures, CS and CT according toDGTW (1997). The Industry Concentration Index is defined as ICI = ∑
(w j − w j )2, where wj isthe weight of the mutual fund holdings in industry j and w j is the weight of the market in industryj. We denote the expense ratio by EXP, the turnover ratio by TU, the natural logarithm of age byLAGE, the natural logarithm of total net assets by LTNA, and the new money growth by NMG. Allregressions include time dummies. Panel-corrected standard errors are reported in parentheses.
Dependent Variable: Quarterly Performance (bp)
Four-Factor Abnormal Return Holding-Based Performance
Unconditional Conditional CS CT
ICI (%) 2.57∗∗∗ 2.82∗∗∗ 2.94∗∗∗ 0.94∗∗∗(0.62) (0.77) (0.56) (0.23)
EXP (%) −40.16∗∗∗ −46.07∗∗∗ −2.15 2.61(6.84) (10.26) (5.70) (2.48)
TU (%) 0.04 0.07 0.18∗∗∗ 0.06∗∗∗(0.05) (0.06) (0.04) (0.02)
LAGE −12.37∗∗∗ −20.10∗∗∗ 1.71 −1.66(3.21) (4.18) (2.70) (1.34)
LTNA −1.16 −1.65 2.15 0.16(1.64) (2.09) (1.53) (0.74)
NMG 0.16 0.16 0.28∗∗ 0.20∗∗∗(0.18) (0.23) (0.13) (0.07)
Number of observations 30,645 30,645 42,659 36,325
∗∗∗1% significance, ∗∗5% significance, ∗10% significance.
heteroskedasticity among fund returns as well as for the autocorrelation withineach fund’s returns (Beck and Katz (1995)). We analyze the unbalanced panel,since most mutual funds do not exist over the whole sample period. Table IVsummarizes the regression results.
The first column shows the coefficients from the panel regression using theabnormal return based on the unconditional four-factor model as the dependentvariable. The sign and magnitude of the coefficient on the Industry Concentra-tion Index are consistent with our previous analysis using the concentrationdecile portfolios. Specifically, an increase in the Industry Concentration Indexby 5 percentage points (corresponding approximately to one standard deviationof the Industry Concentration Index) increases the quarterly abnormal returnof a mutual fund by 13 basis points (=2.57 × 5 = 12.85), or by approximately0.52 percentage points on an annual basis. This effect is economically and sta-tistically significant. On average, expenses have a statistically significant neg-ative effect on the abnormal return of the mutual fund. Fund age is negatively
Industry Concentration of Actively Managed Equity Mutual Funds 1999
related to fund performance, and lagged cash flow is positively related to fundperformance.
In the second column of Table IV, we use the conditional abnormal return asthe dependent variable. The coefficient on the Industry Concentration Indexremains similar and is statistically significant at the 1% level. This result indi-cates that the superior performance of concentrated funds cannot be attributedto their greater responsiveness to macro-economic conditions.
B.2. Holding-Based Performance Measures
Columns 3 and 4 of Table IV summarize estimation results using holding-based performance measures, CS or CT, as the dependent variable, respectively.The results show that mutual funds with a high Industry Concentration Indexhave better stock selection and better style-timing abilities. Specifically, a onestandard deviation increase in the Industry Concentration Index increases thequarterly CS measure by 14.7 basis points, and the CT measure by 4.7 basispoints. Compared to the previous portfolio results, taking advantage of the richpanel structure of our data set and controlling for other mutual fund character-istics result in a significant relation between mutual fund concentration andcharacteristic-based performance measures.
Overall, the regression results confirm our earlier evidence using decile port-folios that concentrated funds outperform diversified funds by an economicallysignificant margin during our sample period.
B.3. Industry-Adjusted Abnormal Performance
One explanation for the superior performance of concentrated funds is thatthey select industries with high returns. We test this hypothesis using thepreviously defined IS and IT measures (equations (7) and (8)). The measureIS evaluates the stock-picking ability of a fund within industries, while ITcaptures the ability of the fund to time industries. The first two columns ofTable V summarize the results of adjusting the portfolio returns for industry,risk, and style. A one standard deviation increase in the Industry ConcentrationIndex increases the quarterly IS measure by 9.5 basis points. Likewise, a onestandard deviation increase in the Industry Concentration Index increases thequarterly IT measure by 7.3 basis points. Both effects are significant at the 1%level.
These results indicate that concentrated funds outperform diversified fundseven after adjusting for the industry performance. Concentrated funds appearto have the ability to select better performing stocks within industries andselect better performing industries.
B.4. Appraisal Ratio
As a portfolio deviates from the market portfolio, it will be exposed to idiosyn-cratic risk. To take into account the different amounts of unique risk across oursample of funds, we use as a performance measure a modified appraisal ratio
2000 The Journal of Finance
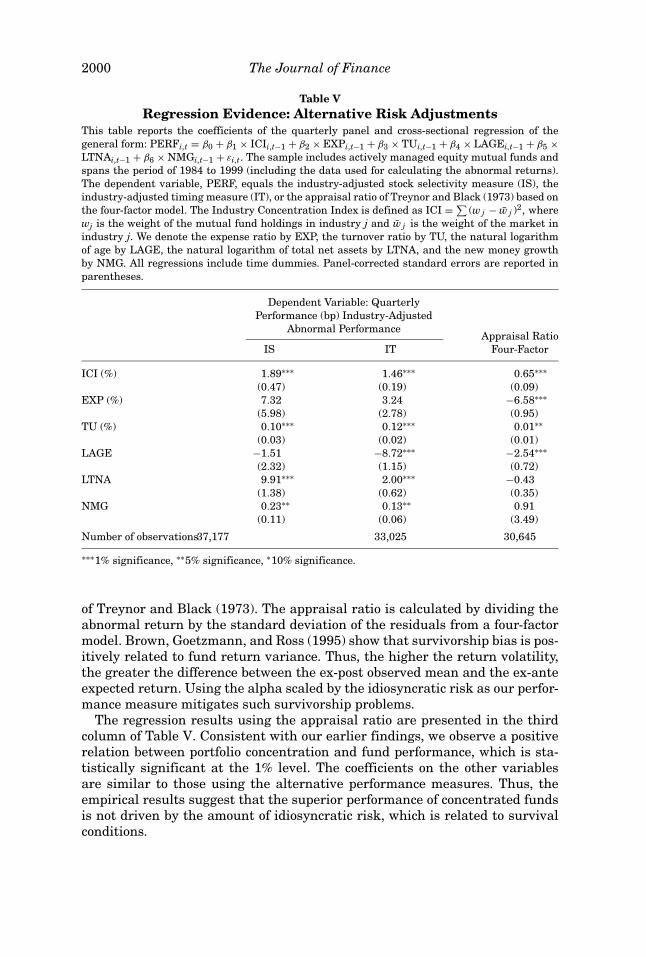
Table VRegression Evidence: Alternative Risk Adjustments
This table reports the coefficients of the quarterly panel and cross-sectional regression of thegeneral form: PERFi,t = β0 + β1 × ICIi,t−1 + β2 × EXPi,t−1 + β3 × TUi,t−1 + β4 × LAGEi,t−1 + β5 ×LTNAi,t−1 + β6 × NMGi,t−1 + εi,t. The sample includes actively managed equity mutual funds andspans the period of 1984 to 1999 (including the data used for calculating the abnormal returns).The dependent variable, PERF, equals the industry-adjusted stock selectivity measure (IS), theindustry-adjusted timing measure (IT), or the appraisal ratio of Treynor and Black (1973) based onthe four-factor model. The Industry Concentration Index is defined as ICI = ∑
(w j − w j )2, wherewj is the weight of the mutual fund holdings in industry j and w j is the weight of the market inindustry j. We denote the expense ratio by EXP, the turnover ratio by TU, the natural logarithmof age by LAGE, the natural logarithm of total net assets by LTNA, and the new money growthby NMG. All regressions include time dummies. Panel-corrected standard errors are reported inparentheses.
Dependent Variable: QuarterlyPerformance (bp) Industry-Adjusted
Abnormal PerformanceAppraisal Ratio
IS IT Four-Factor
ICI (%) 1.89∗∗∗ 1.46∗∗∗ 0.65∗∗∗(0.47) (0.19) (0.09)
EXP (%) 7.32 3.24 −6.58∗∗∗(5.98) (2.78) (0.95)
TU (%) 0.10∗∗∗ 0.12∗∗∗ 0.01∗∗(0.03) (0.02) (0.01)
LAGE −1.51 −8.72∗∗∗ −2.54∗∗∗(2.32) (1.15) (0.72)
LTNA 9.91∗∗∗ 2.00∗∗∗ −0.43(1.38) (0.62) (0.35)
NMG 0.23∗∗ 0.13∗∗ 0.91(0.11) (0.06) (3.49)
Number of observations37,177 33,025 30,645
∗∗∗1% significance, ∗∗5% significance, ∗10% significance.
of Treynor and Black (1973). The appraisal ratio is calculated by dividing theabnormal return by the standard deviation of the residuals from a four-factormodel. Brown, Goetzmann, and Ross (1995) show that survivorship bias is pos-itively related to fund return variance. Thus, the higher the return volatility,the greater the difference between the ex-post observed mean and the ex-anteexpected return. Using the alpha scaled by the idiosyncratic risk as our perfor-mance measure mitigates such survivorship problems.
The regression results using the appraisal ratio are presented in the thirdcolumn of Table V. Consistent with our earlier findings, we observe a positiverelation between portfolio concentration and fund performance, which is sta-tistically significant at the 1% level. The coefficients on the other variablesare similar to those using the alternative performance measures. Thus, theempirical results suggest that the superior performance of concentrated fundsis not driven by the amount of idiosyncratic risk, which is related to survivalconditions.
Industry Concentration of Actively Managed Equity Mutual Funds 2001
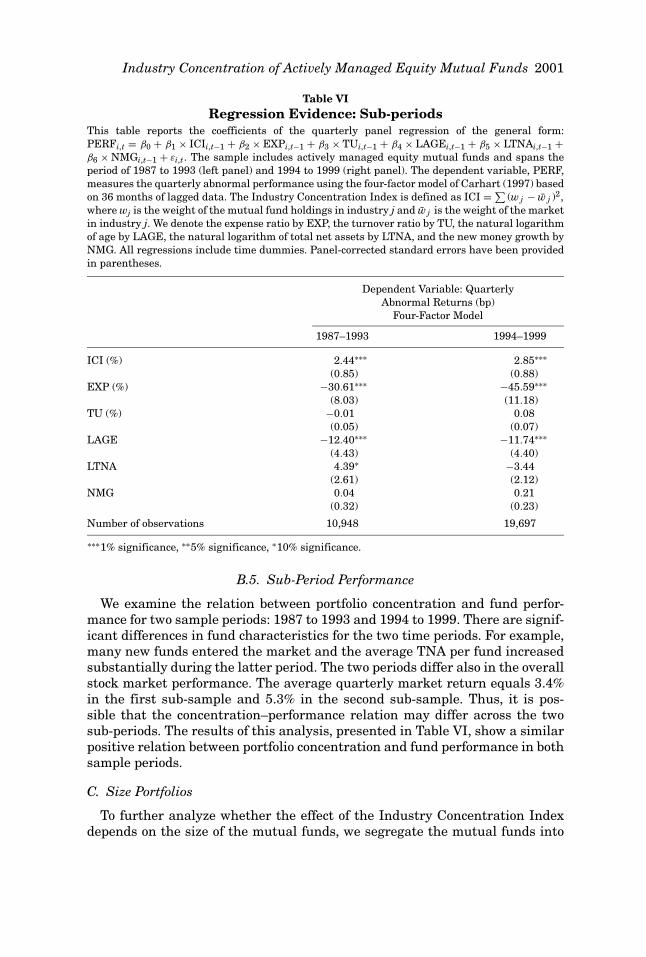
Table VIRegression Evidence: Sub-periods
This table reports the coefficients of the quarterly panel regression of the general form:PERFi,t = β0 + β1 × ICIi,t−1 + β2 × EXPi,t−1 + β3 × TUi,t−1 + β4 × LAGEi,t−1 + β5 × LTNAi,t−1 +β6 × NMGi,t−1 + εi,t. The sample includes actively managed equity mutual funds and spans theperiod of 1987 to 1993 (left panel) and 1994 to 1999 (right panel). The dependent variable, PERF,measures the quarterly abnormal performance using the four-factor model of Carhart (1997) basedon 36 months of lagged data. The Industry Concentration Index is defined as ICI = ∑
(w j − w j )2,where wj is the weight of the mutual fund holdings in industry j and w j is the weight of the marketin industry j. We denote the expense ratio by EXP, the turnover ratio by TU, the natural logarithmof age by LAGE, the natural logarithm of total net assets by LTNA, and the new money growth byNMG. All regressions include time dummies. Panel-corrected standard errors have been providedin parentheses.
Dependent Variable: QuarterlyAbnormal Returns (bp)
Four-Factor Model
1987–1993 1994–1999
ICI (%) 2.44∗∗∗ 2.85∗∗∗(0.85) (0.88)
EXP (%) −30.61∗∗∗ −45.59∗∗∗(8.03) (11.18)
TU (%) −0.01 0.08(0.05) (0.07)
LAGE −12.40∗∗∗ −11.74∗∗∗(4.43) (4.40)
LTNA 4.39∗ −3.44(2.61) (2.12)
NMG 0.04 0.21(0.32) (0.23)
Number of observations 10,948 19,697
∗∗∗1% significance, ∗∗5% significance, ∗10% significance.
B.5. Sub-Period Performance
We examine the relation between portfolio concentration and fund perfor-mance for two sample periods: 1987 to 1993 and 1994 to 1999. There are signif-icant differences in fund characteristics for the two time periods. For example,many new funds entered the market and the average TNA per fund increasedsubstantially during the latter period. The two periods differ also in the overallstock market performance. The average quarterly market return equals 3.4%in the first sub-sample and 5.3% in the second sub-sample. Thus, it is pos-sible that the concentration–performance relation may differ across the twosub-periods. The results of this analysis, presented in Table VI, show a similarpositive relation between portfolio concentration and fund performance in bothsample periods.
C. Size Portfolios
To further analyze whether the effect of the Industry Concentration Indexdepends on the size of the mutual funds, we segregate the mutual funds into
2002 The Journal of Finance
different size portfolios and compare the performance of concentrated and di-versified funds within these size portfolios.
The distribution of the assets under management by mutual funds is highlyskewed to the right. For example, the median mutual fund in our sample has aTNA of $104 million, while the largest mutual fund (Fidelity Magellan) reacheda TNA of $97,594 million in 1999. Diseconomies of scale in money management,as discussed by Berk and Green (2004), make it difficult for very large funds tooutperform passive benchmarks even if fund managers are skilled.
To gauge the impact of fund size on the concentration–performance relation,we first sort funds into size quintiles based on the TNAs at the end of the previ-ous quarter. Subsequently, we sort the mutual funds within each size quintileinto two equally sized groups according to their Industry Concentration Index.Mutual funds in the first quintile manage on average $10.19 million, whilefunds in the fifth quintile manage on average $2,604 million.
Our findings, reported in Table VII, confirm the results in Chen et al. (2004)that small mutual funds outperform large funds. Specifically, mutual funds inthe small size quintile have an abnormal return before expenses of 0.48% perquarter using the unconditional four-factor model, while funds in the large sizequintile have an abnormal return of 0.16% per quarter. This difference in theabnormal performance is statistically significantly different from zero at the5% level.
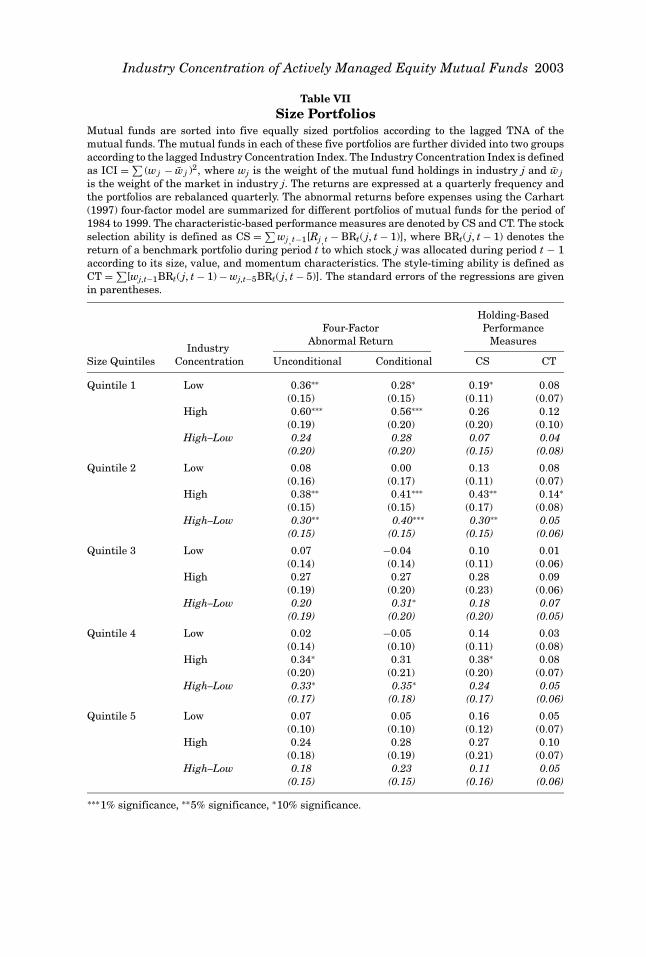
Table VII focuses primarily on the effects of the Industry Concentration In-dex on abnormal performance within the size quintiles. We observe a positiveperformance difference between the high and low concentration funds in allsize quintiles using the various performance measures. The concentration ef-fect does not differ significantly between the different size quintiles. This find-ing indicates that our results are not primarily driven by the smallest mutualfunds.
D. Style Portfolios
Funds frequently concentrate their holdings in specific investment styles,for example, value versus growth or small versus large capitalization stocks.In this section, we investigate to what extent our concentration results arerelated to funds’ investment styles. We sort our sample of mutual funds intofour investment styles based on the characteristics of their stock holdings.
Each stock traded on the major U.S. exchanges is grouped into respectivequintiles according to its market value and its book-to-market ratio. Subse-quently, using the quintile information, we compute the value-weighted sizescore and value score for each mutual fund in each period. For example, a mu-tual fund that invests only in stocks in the smallest size quintile would have asize score of one, while a mutual fund that invests only in the largest size quin-tile would have a size score of five. Next, we group all mutual funds according totheir size scores and value scores into four portfolios. The small-growth portfolioincludes mutual funds with below-median size scores and below-median valuescores. Similarly, we define the large-growth, small-value, and large-value
Industry Concentration of Actively Managed Equity Mutual Funds 2003
Table VIISize Portfolios
Mutual funds are sorted into five equally sized portfolios according to the lagged TNA of themutual funds. The mutual funds in each of these five portfolios are further divided into two groupsaccording to the lagged Industry Concentration Index. The Industry Concentration Index is definedas ICI = ∑
(w j − w j )2, where wj is the weight of the mutual fund holdings in industry j and w jis the weight of the market in industry j. The returns are expressed at a quarterly frequency andthe portfolios are rebalanced quarterly. The abnormal returns before expenses using the Carhart(1997) four-factor model are summarized for different portfolios of mutual funds for the period of1984 to 1999. The characteristic-based performance measures are denoted by CS and CT. The stockselection ability is defined as CS = ∑
wj , t−1[Rj , t − BRt( j, t − 1)], where BRt( j, t − 1) denotes thereturn of a benchmark portfolio during period t to which stock j was allocated during period t − 1according to its size, value, and momentum characteristics. The style-timing ability is defined asCT = ∑
[wj,t−1BRt( j, t − 1) − wj,t−5BRt( j, t − 5)]. The standard errors of the regressions are givenin parentheses.
Holding-BasedFour-Factor Performance
Abnormal Return MeasuresIndustry
Size Quintiles Concentration Unconditional Conditional CS CT
Quintile 1 Low 0.36∗∗ 0.28∗ 0.19∗ 0.08(0.15) (0.15) (0.11) (0.07)
High 0.60∗∗∗ 0.56∗∗∗ 0.26 0.12(0.19) (0.20) (0.20) (0.10)
High–Low 0.24 0.28 0.07 0.04(0.20) (0.20) (0.15) (0.08)
Quintile 2 Low 0.08 0.00 0.13 0.08(0.16) (0.17) (0.11) (0.07)
High 0.38∗∗ 0.41∗∗∗ 0.43∗∗ 0.14∗
(0.15) (0.15) (0.17) (0.08)High–Low 0.30∗∗ 0.40∗∗∗ 0.30∗∗ 0.05
(0.15) (0.15) (0.15) (0.06)
Quintile 3 Low 0.07 −0.04 0.10 0.01(0.14) (0.14) (0.11) (0.06)
High 0.27 0.27 0.28 0.09(0.19) (0.20) (0.23) (0.06)
High–Low 0.20 0.31∗ 0.18 0.07(0.19) (0.20) (0.20) (0.05)
Quintile 4 Low 0.02 −0.05 0.14 0.03(0.14) (0.10) (0.11) (0.08)
High 0.34∗ 0.31 0.38∗ 0.08(0.20) (0.21) (0.20) (0.07)
High–Low 0.33∗ 0.35∗ 0.24 0.05(0.17) (0.18) (0.17) (0.06)
Quintile 5 Low 0.07 0.05 0.16 0.05(0.10) (0.10) (0.12) (0.07)
High 0.24 0.28 0.27 0.10(0.18) (0.19) (0.21) (0.07)
High–Low 0.18 0.23 0.11 0.05(0.15) (0.15) (0.16) (0.06)
∗∗∗1% significance, ∗∗5% significance, ∗10% significance.
2004 The Journal of Finance
Table VIIIStyle Portfolios
Mutual funds are sorted into four portfolios according to the lagged market values (small vs. largecap) and the lagged book-to-market ratios (growth vs. value) of their holdings. The mutual fundsin each of these four portfolios are further divided into two groups according to the lagged IndustryConcentration Index. The Industry Concentration Index is defined as ICI = ∑
(w j − w j )2, where wjis the weight of the mutual fund holdings in industry j and w j is the weight of the market in industryj. The returns are expressed at a quarterly frequency and the portfolios are rebalanced quarterly.The abnormal returns before expenses using the Carhart (1997) four-factor model are summarizedfor different portfolios of mutual funds for the period of 1984 to 1999. The characteristic-basedperformance measures are denoted by CS and CT. The stock selection ability is defined as CS =∑
wj,t−1[Rj,t − BRt( j, t − 1)], where BRt( j, t − 1) denotes the return of a benchmark portfolio duringperiod t to which stock j was allocated during period t − 1 according to its size, value, and momentumcharacteristics. The style-timing ability is defined as CT = ∑
[wj,t−1BRt( j, t − 1) − wj,t−5BRt( j, t −5)]. The standard errors of the regressions are given in parentheses.
Four-Factor Holding-BasedAbnormal Return Performance Measures
IndustryStyle Concentration Unconditional Conditional CS CT
Small growth Low 0.18 0.02 0.21 0.08(0.21) (0.20) (0.16) (0.08)
High 0.59∗∗ 0.72∗∗ 0.62∗ 0.19(0.28) (0.29) (0.37) (0.14)
High–Low 0.40 0.70∗∗ 0.41 0.11(0.33) (0.31) (0.28) (0.11)
Small value Low 0.06 0.04 0.09 0.03(0.20) (0.22) (0.13) (0.05)
High 0.41∗∗ 0.41∗ 0.14 0.08(0.20) (0.21) (0.17) (0.05)
High–Low 0.35∗∗ 0.37∗∗ 0.05 0.05(0.15) (0.15) (0.11) (0.04)
Large growth Low 0.12 −0.01 0.18 0.08(0.14) (0.13) (0.13) (0.09)
High 0.41∗∗ 0.39∗ 0.41∗ 0.16(0.20) (0.20) (0.24) (0.10)
High–Low 0.29 0.41∗∗ 0.24 0.07(0.21) (0.20) (0.20) (0.06)
Large value Low 0.06 0.01 0.09 0.01(0.17) (0.18) (0.13) (0.09)
High −0.08 −0.14 0.06 −0.02(0.20) (0.21) (0.16) (0.09)
High–Low −0.14 −0.15 −0.03 −0.03(0.12) (0.12) (0.09) (0.05)
∗∗∗1% significance, ∗∗5% significance, ∗10% significance.
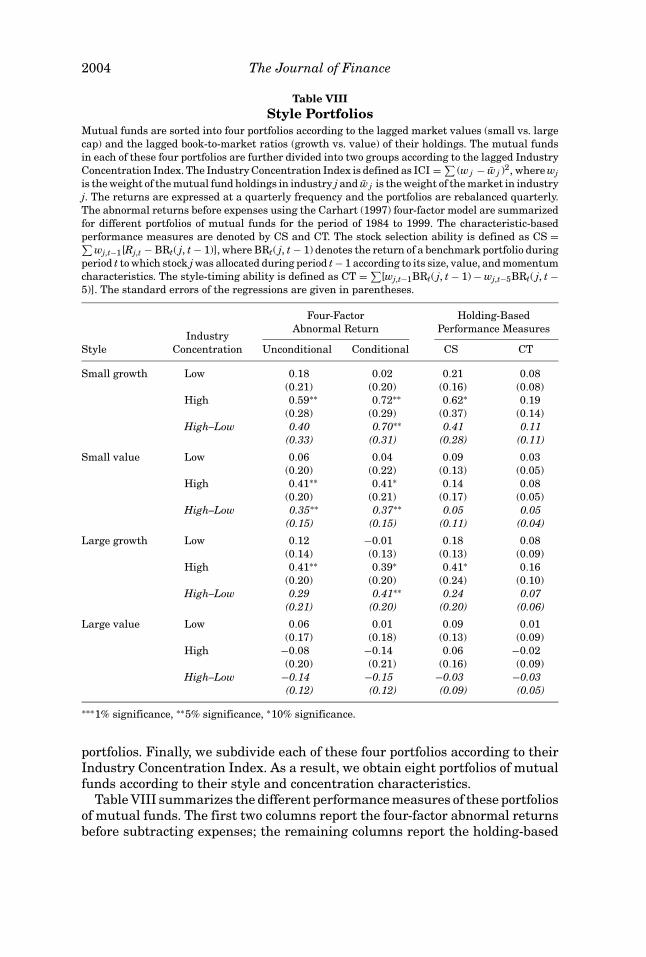
portfolios. Finally, we subdivide each of these four portfolios according to theirIndustry Concentration Index. As a result, we obtain eight portfolios of mutualfunds according to their style and concentration characteristics.
Table VIII summarizes the different performance measures of these portfoliosof mutual funds. The first two columns report the four-factor abnormal returnsbefore subtracting expenses; the remaining columns report the holding-based
Industry Concentration of Actively Managed Equity Mutual Funds 2005
DGTW performance measures. Consistent with the findings in DGTW (1997)and Chen et al. (2000), we observe that mutual funds investing primarily insmall or growth stocks outperform other mutual funds with respect to all perfor-mance measures. On the other hand, mutual funds specializing in large-valuestocks tend to perform the worst according to all measures. Specifically, mu-tual funds focusing on small-growth stocks outperform mutual funds special-izing in large-value stocks by 0.39% per quarter, using the unconditional four-factor model. This performance difference is statistically significant at the 10%level.
Consistent with our earlier findings, mutual funds with a higher industryconcentration tend to generate higher abnormal returns before expenses withinstyle categories, unless they specialize in large-value stocks. The least con-centrated 50% of small-growth mutual funds have an abnormal return beforeexpenses of 0.18% per quarter, while the most concentrated 50% have an ab-normal return of 0.59% per quarter using the unconditional four-factor model.On the other hand, the least concentrated 50% of large-value mutual fundshave an abnormal return before expenses of 0.06% per quarter, while the mostconcentrated 50% have an abnormal return of −0.08% per quarter. The effect ofthe Industry Concentration Index on the abnormal returns and the statisticalsignificance of the return differences strengthen if we compute conditional in-stead of unconditional abnormal returns. The results using the holding-basedperformance measures are also consistent with the results using the abnormalfour-factor performance.
E. Trade Portfolios
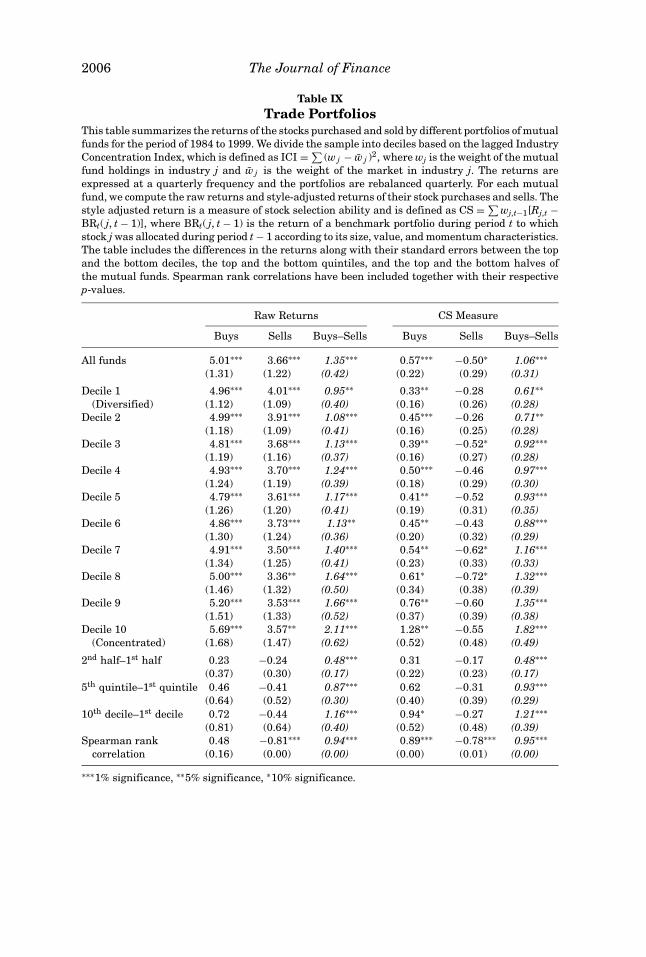
To further examine whether concentrated funds have informational advan-tages, we study the performance of mutual fund trades. Specifically, for eachfund, we compute the average quarterly returns of the stocks purchased andsold during the previous 6 months, as described in Section III.E. In our test,we sort the mutual funds according to their Industry Concentration Index andgroup them into 10 portfolios, as in Tables II and III.
Table IX summarizes the two performance measures for the portfolios basedon stock trades by mutual funds in different concentration deciles. The stockspurchased tend to perform significantly better than the stocks sold. Overall,the stocks purchased have a raw return that exceeds the return of the stockssold by 1.35% per quarter. This return difference is significant at the 1% level.The difference between the buy and the sell portfolio tends to increase with theIndustry Concentration Index. The return difference equals 0.95% for the mostdiversified decile and 2.11% for the most concentrated decile. The differencein the differences is both statistically and economically highly significant. Thesuperior performance of the trades of the concentrated funds is due to higherreturns of the stocks purchased and lower returns of the stocks sold.
The last three columns of Table IX summarize the return differences for thecharacteristic-adjusted CS measure. These results confirm the earlier findingsusing the raw returns that the trades of concentrated funds create significantlymore value than the trades of diversified funds.
2006 The Journal of Finance
Table IXTrade Portfolios
This table summarizes the returns of the stocks purchased and sold by different portfolios of mutualfunds for the period of 1984 to 1999. We divide the sample into deciles based on the lagged IndustryConcentration Index, which is defined as ICI = ∑
(w j − w j )2, where wj is the weight of the mutualfund holdings in industry j and w j is the weight of the market in industry j. The returns areexpressed at a quarterly frequency and the portfolios are rebalanced quarterly. For each mutualfund, we compute the raw returns and style-adjusted returns of their stock purchases and sells. Thestyle adjusted return is a measure of stock selection ability and is defined as CS = ∑
wj,t−1[Rj,t −BRt( j, t − 1)], where BRt( j, t − 1) is the return of a benchmark portfolio during period t to whichstock j was allocated during period t − 1 according to its size, value, and momentum characteristics.The table includes the differences in the returns along with their standard errors between the topand the bottom deciles, the top and the bottom quintiles, and the top and the bottom halves ofthe mutual funds. Spearman rank correlations have been included together with their respectivep-values.
Raw Returns CS Measure
Buys Sells Buys–Sells Buys Sells Buys–Sells
All funds 5.01∗∗∗ 3.66∗∗∗ 1.35∗∗∗ 0.57∗∗∗ −0.50∗ 1.06∗∗∗(1.31) (1.22) (0.42) (0.22) (0.29) (0.31)
Decile 1 4.96∗∗∗ 4.01∗∗∗ 0.95∗∗ 0.33∗∗ −0.28 0.61∗∗(Diversified) (1.12) (1.09) (0.40) (0.16) (0.26) (0.28)
Decile 2 4.99∗∗∗ 3.91∗∗∗ 1.08∗∗∗ 0.45∗∗∗ −0.26 0.71∗∗(1.18) (1.09) (0.41) (0.16) (0.25) (0.28)
Decile 3 4.81∗∗∗ 3.68∗∗∗ 1.13∗∗∗ 0.39∗∗ −0.52∗ 0.92∗∗∗(1.19) (1.16) (0.37) (0.16) (0.27) (0.28)
Decile 4 4.93∗∗∗ 3.70∗∗∗ 1.24∗∗∗ 0.50∗∗∗ −0.46 0.97∗∗∗(1.24) (1.19) (0.39) (0.18) (0.29) (0.30)
Decile 5 4.79∗∗∗ 3.61∗∗∗ 1.17∗∗∗ 0.41∗∗ −0.52 0.93∗∗∗(1.26) (1.20) (0.41) (0.19) (0.31) (0.35)
Decile 6 4.86∗∗∗ 3.73∗∗∗ 1.13∗∗ 0.45∗∗ −0.43 0.88∗∗∗(1.30) (1.24) (0.36) (0.20) (0.32) (0.29)
Decile 7 4.91∗∗∗ 3.50∗∗∗ 1.40∗∗∗ 0.54∗∗ −0.62∗ 1.16∗∗∗(1.34) (1.25) (0.41) (0.23) (0.33) (0.33)
Decile 8 5.00∗∗∗ 3.36∗∗ 1.64∗∗∗ 0.61∗ −0.72∗ 1.32∗∗∗(1.46) (1.32) (0.50) (0.34) (0.38) (0.39)
Decile 9 5.20∗∗∗ 3.53∗∗∗ 1.66∗∗∗ 0.76∗∗ −0.60 1.35∗∗∗(1.51) (1.33) (0.52) (0.37) (0.39) (0.38)
Decile 10 5.69∗∗∗ 3.57∗∗ 2.11∗∗∗ 1.28∗∗ −0.55 1.82∗∗∗(Concentrated) (1.68) (1.47) (0.62) (0.52) (0.48) (0.49)
2nd half–1st half 0.23 −0.24 0.48∗∗∗ 0.31 −0.17 0.48∗∗∗(0.37) (0.30) (0.17) (0.22) (0.23) (0.17)
5th quintile–1st quintile 0.46 −0.41 0.87∗∗∗ 0.62 −0.31 0.93∗∗∗(0.64) (0.52) (0.30) (0.40) (0.39) (0.29)
10th decile–1st decile 0.72 −0.44 1.16∗∗∗ 0.94∗ −0.27 1.21∗∗∗(0.81) (0.64) (0.40) (0.52) (0.48) (0.39)
Spearman rank 0.48 −0.81∗∗∗ 0.94∗∗∗ 0.89∗∗∗ −0.78∗∗∗ 0.95∗∗∗correlation (0.16) (0.00) (0.00) (0.00) (0.01) (0.00)
∗∗∗1% significance, ∗∗5% significance, ∗10% significance.
Industry Concentration of Actively Managed Equity Mutual Funds 2007
V. Conclusions
The value of active fund management has been a long-standing debateamong researchers and practitioners. Mutual fund managers may deviatefrom the passive market portfolio by concentrating their holdings in spe-cific industries. We investigate whether mutual fund managers hold concen-trated portfolios because they have investment skills that are linked to specificindustries.
Using U.S. mutual fund data from 1984 to 1999, we find that mutual funds dif-fer substantially in their industry concentration, and that concentrated fundstend to follow distinct investment styles. In particular, managers of more con-centrated funds overweigh growth and small stocks, whereas managers ofmore diversified funds hold portfolios that closely resemble the total marketportfolio.
We find that funds with concentrated portfolios perform better than fundswith diversified portfolios. This finding is robust to various risk-adjusted per-formance measures, including the four-factor model of Carhart (1997), the con-ditional factor model of Ferson and Schadt (1996), and the holding-based per-formance measures of DGTW (1997). Analyzing the buy and sell decisions ofmutual funds, we find evidence that the trades of concentrated portfolios addmore value than the trades of diversified portfolios.
In summary, this paper finds that investment ability is more evident amongmanagers who hold portfolios concentrated in a few industries. The evidencelends support to the value of active fund management.
Appendix
A. Matching of the CRSP and the CDA Data Sets
We match funds in the CRSP mutual fund database to the CDA mutual fundholdings database manually by name. In cases where matching by name is notconclusive, we verify our matching with additional information about the TNAand the investment objective of the fund.
At the outset, our matched data set includes 4,253 different funds identifiedboth in the CRSP and the CDA databases, which existed at any time betweenJanuary 1984 and December 1999.12 For this sample, we apply another filter, inwhich we exclude all bond, balanced, money market, index, international, andsector funds.13 We also eliminate fund observations where the TNA of a fundin the previous quarter is less than $1 million or where fewer than 11 stockholdings are identified. In summary, our final sample includes 1,771 distinctequity funds with complete characteristics of returns, total net assets, age,
12 For funds with multiple share classes, we include the dominant class of shares in CRSP.13 We exclude funds that do not predominantly hold U.S. equities.
2008 The Journal of Finance
expenses, loads, turnover, portfolio holdings, style objective, and full name inat least one quarter between 1984 and 1999.
B. Industry Composition
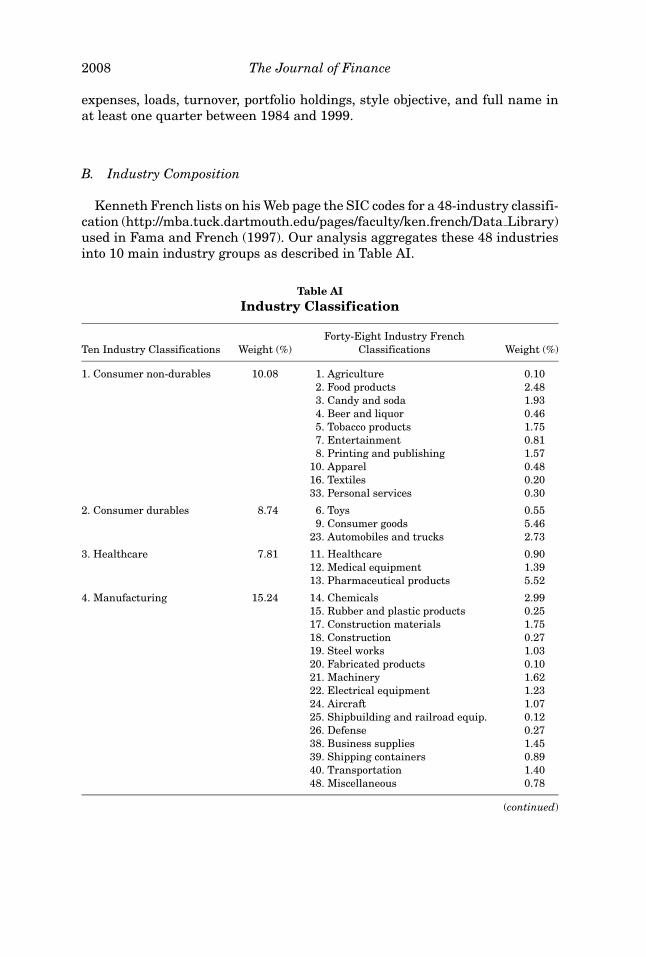
Kenneth French lists on his Web page the SIC codes for a 48-industry classifi-cation (http://mba.tuck.dartmouth.edu/pages/faculty/ken.french/Data Library)used in Fama and French (1997). Our analysis aggregates these 48 industriesinto 10 main industry groups as described in Table AI.
Table AIIndustry Classification
Forty-Eight Industry FrenchTen Industry Classifications Weight (%) Classifications Weight (%)
1. Consumer non-durables 10.08 1. Agriculture 0.102. Food products 2.483. Candy and soda 1.934. Beer and liquor 0.465. Tobacco products 1.757. Entertainment 0.818. Printing and publishing 1.57
10. Apparel 0.4816. Textiles 0.2033. Personal services 0.30
2. Consumer durables 8.74 6. Toys 0.559. Consumer goods 5.46
23. Automobiles and trucks 2.73
3. Healthcare 7.81 11. Healthcare 0.9012. Medical equipment 1.3913. Pharmaceutical products 5.52
4. Manufacturing 15.24 14. Chemicals 2.9915. Rubber and plastic products 0.2517. Construction materials 1.7518. Construction 0.2719. Steel works 1.0320. Fabricated products 0.1021. Machinery 1.6222. Electrical equipment 1.2324. Aircraft 1.0725. Shipbuilding and railroad equip. 0.1226. Defense 0.2738. Business supplies 1.4539. Shipping containers 0.8940. Transportation 1.4048. Miscellaneous 0.78
(continued)
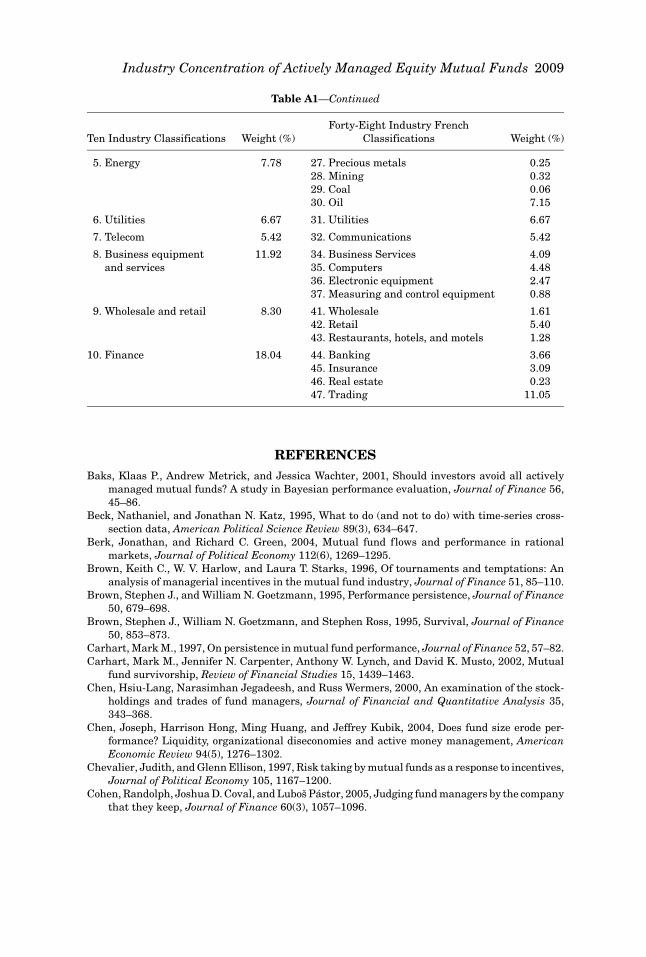
Industry Concentration of Actively Managed Equity Mutual Funds 2009
Table A1—Continued
Forty-Eight Industry FrenchTen Industry Classifications Weight (%) Classifications Weight (%)
5. Energy 7.78 27. Precious metals 0.2528. Mining 0.3229. Coal 0.0630. Oil 7.15
6. Utilities 6.67 31. Utilities 6.67
7. Telecom 5.42 32. Communications 5.42
8. Business equipment 11.92 34. Business Services 4.09and services 35. Computers 4.48
36. Electronic equipment 2.4737. Measuring and control equipment 0.88
9. Wholesale and retail 8.30 41. Wholesale 1.6142. Retail 5.4043. Restaurants, hotels, and motels 1.28
10. Finance 18.04 44. Banking 3.6645. Insurance 3.0946. Real estate 0.2347. Trading 11.05
REFERENCESBaks, Klaas P., Andrew Metrick, and Jessica Wachter, 2001, Should investors avoid all actively
managed mutual funds? A study in Bayesian performance evaluation, Journal of Finance 56,45–86.
Beck, Nathaniel, and Jonathan N. Katz, 1995, What to do (and not to do) with time-series cross-section data, American Political Science Review 89(3), 634–647.
Berk, Jonathan, and Richard C. Green, 2004, Mutual fund flows and performance in rationalmarkets, Journal of Political Economy 112(6), 1269–1295.
Brown, Keith C., W. V. Harlow, and Laura T. Starks, 1996, Of tournaments and temptations: Ananalysis of managerial incentives in the mutual fund industry, Journal of Finance 51, 85–110.
Brown, Stephen J., and William N. Goetzmann, 1995, Performance persistence, Journal of Finance50, 679–698.
Brown, Stephen J., William N. Goetzmann, and Stephen Ross, 1995, Survival, Journal of Finance50, 853–873.
Carhart, Mark M., 1997, On persistence in mutual fund performance, Journal of Finance 52, 57–82.Carhart, Mark M., Jennifer N. Carpenter, Anthony W. Lynch, and David K. Musto, 2002, Mutual
fund survivorship, Review of Financial Studies 15, 1439–1463.Chen, Hsiu-Lang, Narasimhan Jegadeesh, and Russ Wermers, 2000, An examination of the stock-
holdings and trades of fund managers, Journal of Financial and Quantitative Analysis 35,343–368.
Chen, Joseph, Harrison Hong, Ming Huang, and Jeffrey Kubik, 2004, Does fund size erode per-formance? Liquidity, organizational diseconomies and active money management, AmericanEconomic Review 94(5), 1276–1302.
Chevalier, Judith, and Glenn Ellison, 1997, Risk taking by mutual funds as a response to incentives,Journal of Political Economy 105, 1167–1200.
Cohen, Randolph, Joshua D. Coval, and Lubos Pastor, 2005, Judging fund managers by the companythat they keep, Journal of Finance 60(3), 1057–1096.
2010 The Journal of Finance
Coval, Joshua D., and Tobias J. Moskowitz, 1999, Home bias at home: Local equity preference indomestic portfolios, Journal of Finance 54, 2045–2074.
Coval, Joshua D., and Tobias J. Moskowitz, 2001, The geography of investment: Informed tradingand asset prices, Journal of Political Economy 109(4), 811–841.
Daniel, Kent, Mark Grinblatt, Sheridan Titman, and Russ Wermers, 1997, Measuring mutual fundperformance with characteristic-based benchmarks, Journal of Finance 52, 1035–1058.
Del Guercio, Diane, and Paula A. Tkac, 2002, The determinants of the flow of funds of managedportfolios: Mutual funds versus pension funds, Journal of Financial and Quantitative Analysis37, 523–557.
Elton, Edwin J., Martin J. Gruber, Sanjiv Das, and Matthew Hlavka, 1993, Efficiency with costlyinformation: A reinterpretation of evidence for managed portfolios, Review of Financial Studies6, 1–22.
Fama, Eugene F., and Kenneth R. French, 1993, Common risk factors in the return on bonds andstocks, Journal of Financial Economics 33, 3–53.
Fama, Eugene F., and Kenneth R. French, 1997, Industry costs of equity, Journal of FinancialEconomics 43, 153–193.
Ferson, Wayne, and Rudi Schadt, 1996, Measuring fund strategy and performance in changingeconomic conditions, Journal of Finance 51, 425–462.
Frank, Mary M., James M. Poterba, Douglas A. Shackelford, and John B. Shoven, 2004, Copycatfunds: Information disclosure regulation and the returns to active management in the mutualfund industry, Journal of Law and Economics 47, 515–541.
Goetzmann, William N., and Nadev Peles, 1997, Cognitive dissonance and mutual fund investors,Journal of Financial Research 20, 145–158.
Grinblatt, Mark, and Sheridan Titman, 1989, Mutual fund performance: An analysis of quarterlyportfolio holdings, Journal of Business 62, 393–416.
Grinblatt, Mark, and Sheridan Titman, 1993, Performance measurement without benchmarks: Anexamination of mutual fund returns, Journal of Business 66, 47–68.
Grinblatt, Mark, Sheridan Titman, and Russ Wermers, 1995, Momentum investment strategies,portfolio performance, and herding: A study of mutual fund behavior, American EconomicReview 85, 1088–1105.
Gruber, Martin J., 1996, Another puzzle: The growth in actively managed mutual funds, Journalof Finance 51, 783–810.
Hendricks, Darryll, Jayendu Patel, and Richard Zeckhauser, 1993, Hot hands in mutual funds:The persistence of performance 1974–1988, Journal of Finance 48, 93–130.
Ippolito, Richard A., 1992, Consumer reaction to measures of poor quality: Evidence from themutual fund industry, Journal of Law and Economics 35, 45–70.
Jegadeesh, Narasimhan, and Sheridan Titman, 1993, Returns to buying winners and selling losers:Implication for stock market efficiency, Journal of Finance 48, 65–91.
Jensen, Michael C., 1968, The performance of mutual funds in the period 1945–1964, Journal ofFinance 23, 389–416.
Kosowski, Robert, Allan Timmermann, Hal White, and Russ Wermers, 2001, Can mutual fund“stars” really pick stocks? New evidence from a bootstrap analysis, Working paper, INSEAD.
Kothari, S. P., and Jerold B. Warner, 2001, Evaluating mutual fund performance, Journal of Finance56, 1985–2010.
Levy, Azriel, and Miles Livingston, 1995, The gains from diversification reconsidered: Transac-tion costs and superior information, Financial Markets, Institutions, and Instruments 4(3), 1–60.
Lynch, Anthony W., Jessica Wachter, and Walter Boudry, 2004, Does mutual fund performancevary over the business cycle? Working paper, New York University.
Malkiel, Burton G., 1995, Returns from investing in equity mutual funds 1971–1991, Journal ofFinance 50, 549–572.
Mamaysky, Harry, Matthew Spiegel, and Hong Zhang, 2005, Improved forecasting of mutual fundalphas and betas, Working paper, Yale University.
Moskowitz, Tobias J., and Mark Grinblatt, 1999, Do industries explain momentum? Journal ofFinance 54, 1249–1290.

Industry Concentration of Actively Managed Equity Mutual Funds 2011
Nanda, Vikram, Zhi Wang, and Lu Zheng, 2004, Family values and the star phenomenon, Reviewof Financial Studies 17(3), 667–698.
Sirri, Erik, and Peter Tufano, 1998, Costly search and mutual fund flows, Journal of Finance 53,1589–1622.
Treynor, Jack L., and Fisher Black, 1973, How to use security analysis to improve portfolio selection,Journal of Business 46, 66–86.
Van Nieuwerburgh, Stijn, and Laura Veldkamp, 2005, Information acquisition and portfolio under-diversification, Working paper, New York University.
Wermers, Russ, 2000, Mutual fund performance: An empirical decomposition into stock-pickingtalent, style, transaction costs, and expenses, Journal of Finance 55, 1655–1703.
Wermers, Russ, 2003, Is money really “smart”? New evidence on the relation between mutualfund flows, manager behavior, and performance persistence, Working paper, University ofMaryland.
Zheng, Lu, 1999, Is money smart? A study of mutual fund investors’ fund selection ability, Journalof Finance 54, 901–933.