Embed Size (px)
Citation preview

On the Impacts of Mega Regionals: the case of TTIP
Lucas Ferraz (São Paulo School of Economics - FGV)
October/2015Centre for Global Trade and Investment – EESP/FGV

October/2015Centre for Global Trade and Investment – EESP/FGV
Motivation in 4 Points
October/2015São Paulo School of Economics – EESP/FGV
1. An important trend in trade policy over the last decades is the remarkable reduction in tariff barriers worldwide, particularly in developed countries…
(Kee et al, 2009)
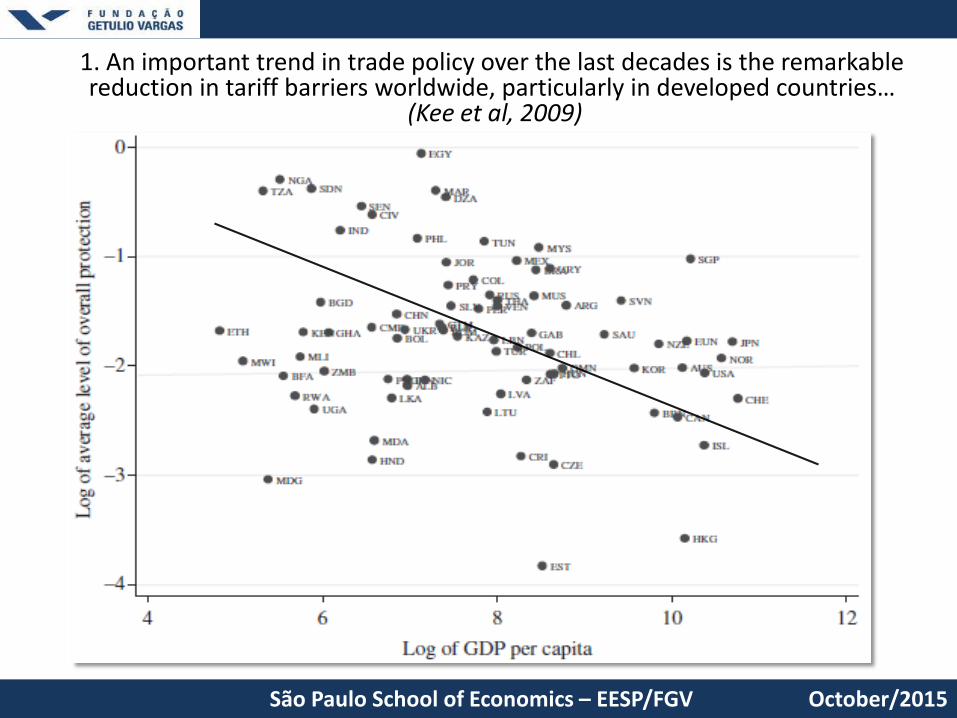
2. This process seems to be correlated with the explosion PTAs and the increasingfragmentation of production, creating pressure for new regulatory arrangements associatedwith the so called “supply-chain trade”. Over the last two decades, nearly 400 new PTAs werenotified at the WTO.
October/2015São Paulo School of Economics – EESP/FGV
October/2015Centre for Global Trade and Investment – EESP/FGV
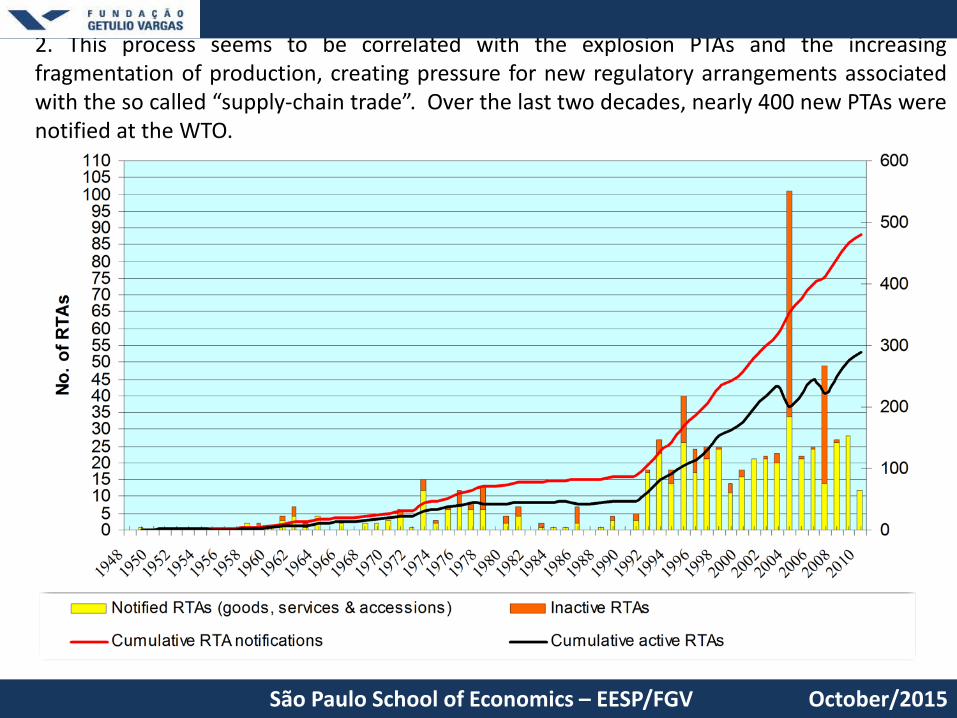
3. As the most integrated economies in the global system, the imposition of nontariff barrierssuch as TBT/SPS measures, new investment and intellectual property rights arrangements isrelatively concentrated in developed and some newly industrialized economies (Kee et al,2009).
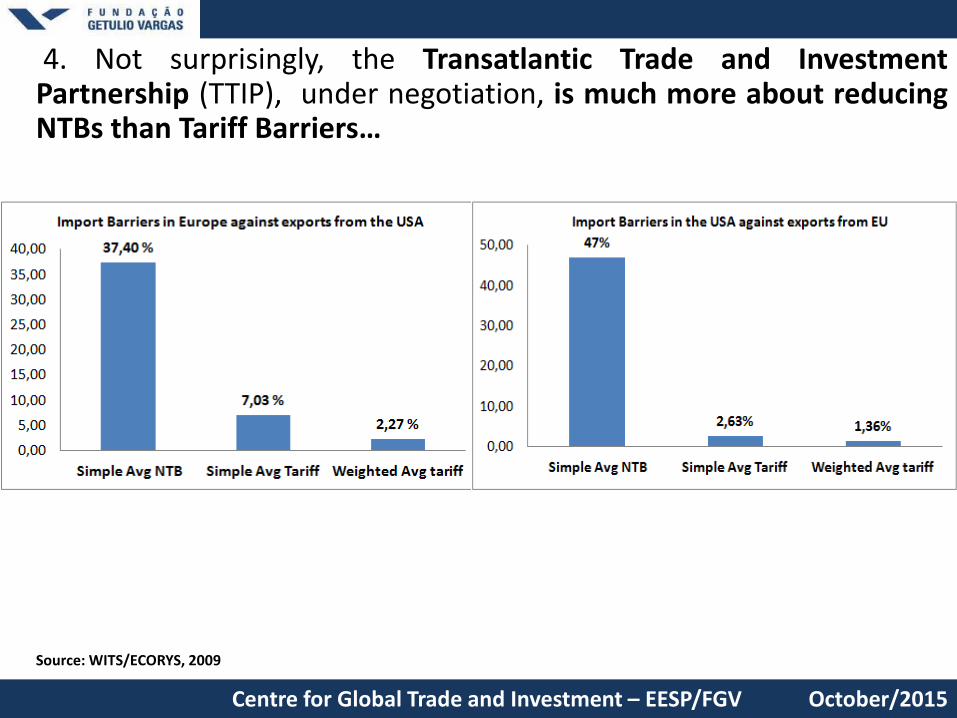
4. Not surprisingly, the Transatlantic Trade and InvestmentPartnership (TTIP), under negotiation, is much more about reducingNTBs than Tariff Barriers…
October/2015Centre for Global Trade and Investment – EESP/FGV
Source: WITS/ECORYS, 2009
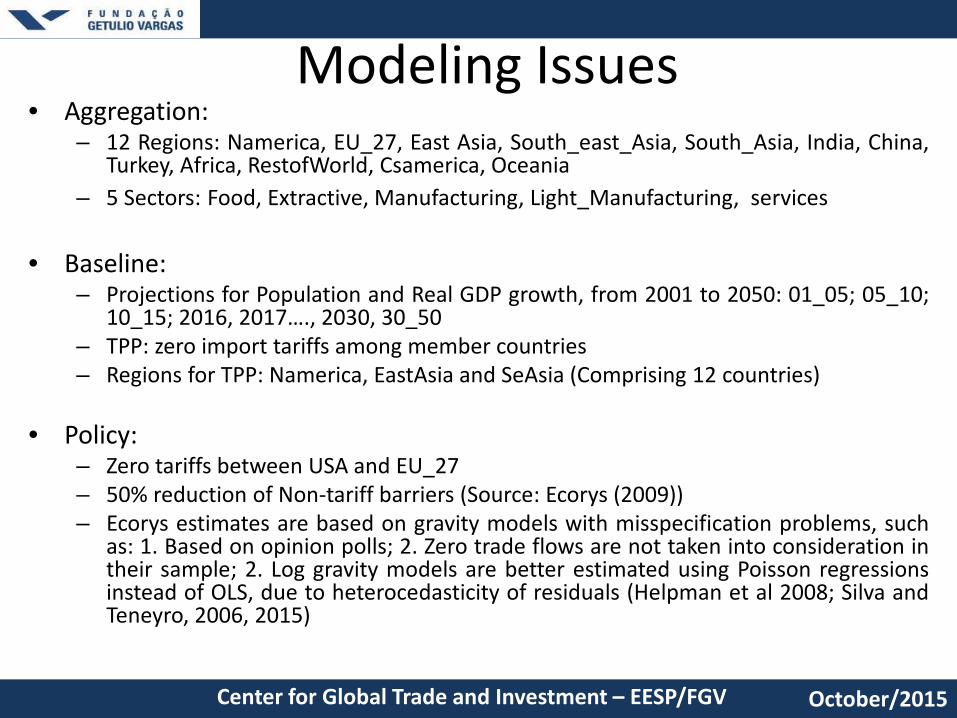
Modeling Issues• Aggregation:
– 12 Regions: Namerica, EU_27, East Asia, South_east_Asia, South_Asia, India, China,Turkey, Africa, RestofWorld, Csamerica, Oceania
– 5 Sectors: Food, Extractive, Manufacturing, Light_Manufacturing, services
• Baseline:– Projections for Population and Real GDP growth, from 2001 to 2050: 01_05; 05_10;
10_15; 2016, 2017…., 2030, 30_50– TPP: zero import tariffs among member countries– Regions for TPP: Namerica, EastAsia and SeAsia (Comprising 12 countries)
• Policy:– Zero tariffs between USA and EU_27– 50% reduction of Non-tariff barriers (Source: Ecorys (2009))– Ecorys estimates are based on gravity models with misspecification problems, such
as: 1. Based on opinion polls; 2. Zero trade flows are not taken into consideration intheir sample; 2. Log gravity models are better estimated using Poisson regressionsinstead of OLS, due to heterocedasticity of residuals (Helpman et al 2008; Silva andTeneyro, 2006, 2015)
October/2015Center for Global Trade and Investment – EESP/FGV

Modeling Issues
October/2015Center for Global Trade and Investment – EESP/FGV
• The GTAP model does not include a explicit representation of nontariff barriers;
• The methodology adopted in this work follows Hertel et al (2001) and assumes thatthe reduction in NTBs takes the form of technical progress in trading activities;
• CES type demand equation for good “i”, exported from country “r” to destinationcountry “s” is written i the GTAP model as follows:
• A technical progress in trading activities due to reduction in NTBs may be represented by a positive shock on the variable AMSIRS. This corresponds to an upward shift in import demand;
Cumulative Macro – Results (2030)
October/2015Center for Global Trade and Investment – EESP/FGV
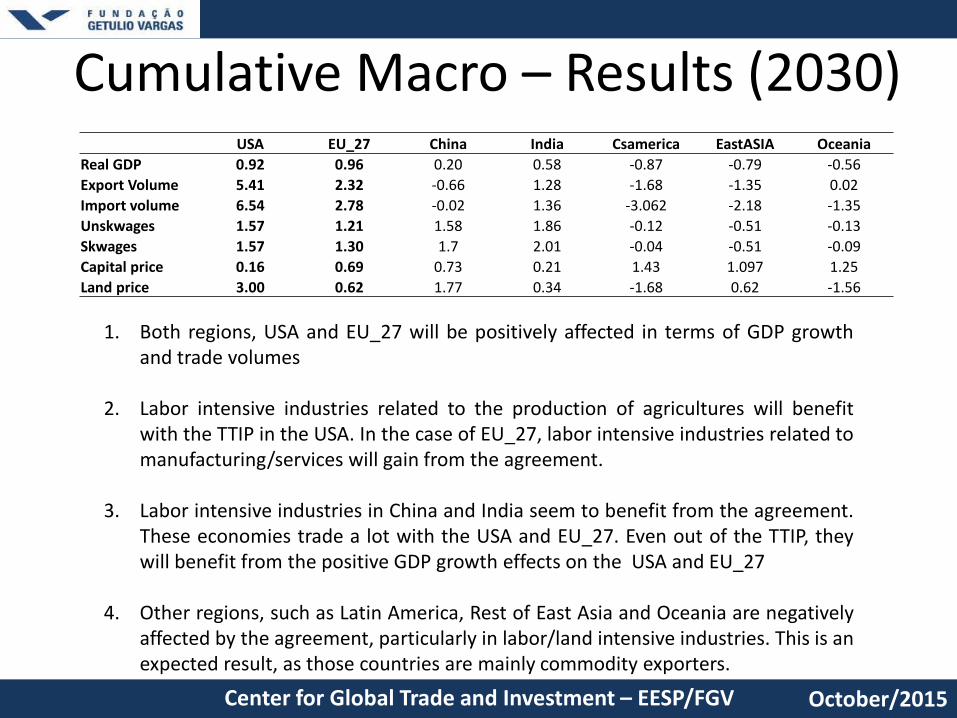
USA EU_27 China India Csamerica EastASIA OceaniaReal GDP 0.92 0.96 0.20 0.58 -0.87 -0.79 -0.56Export Volume 5.41 2.32 -0.66 1.28 -1.68 -1.35 0.02Import volume 6.54 2.78 -0.02 1.36 -3.062 -2.18 -1.35Unskwages 1.57 1.21 1.58 1.86 -0.12 -0.51 -0.13Skwages 1.57 1.30 1.7 2.01 -0.04 -0.51 -0.09Capital price 0.16 0.69 0.73 0.21 1.43 1.097 1.25Land price 3.00 0.62 1.77 0.34 -1.68 0.62 -1.56
1. Both regions, USA and EU_27 will be positively affected in terms of GDP growthand trade volumes
2. Labor intensive industries related to the production of agricultures will benefitwith the TTIP in the USA. In the case of EU_27, labor intensive industries related tomanufacturing/services will gain from the agreement.
3. Labor intensive industries in China and India seem to benefit from the agreement.These economies trade a lot with the USA and EU_27. Even out of the TTIP, theywill benefit from the positive GDP growth effects on the USA and EU_27
4. Other regions, such as Latin America, Rest of East Asia and Oceania are negativelyaffected by the agreement, particularly in labor/land intensive industries. This is anexpected result, as those countries are mainly commodity exporters.
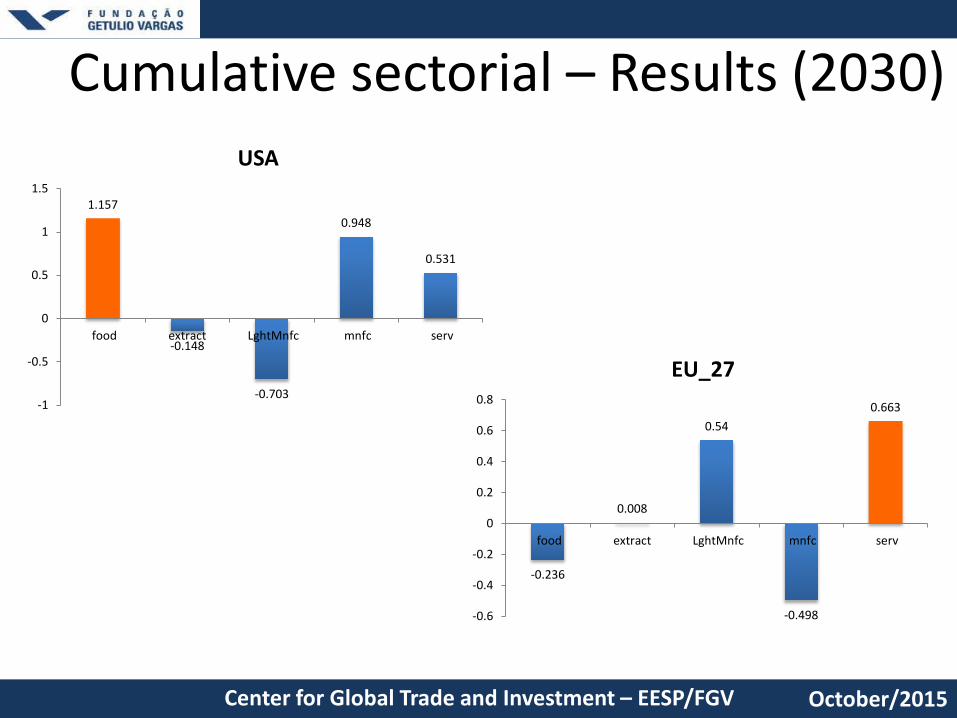
Cumulative sectorial – Results (2030)
October/2015Center for Global Trade and Investment – EESP/FGV
1.157
-0.148
-0.703
0.948
0.531
-1
-0.5
0
0.5
1
1.5
food extract LghtMnfc mnfc serv
USA
-0.236
0.008
0.54
-0.498
0.663
-0.6
-0.4
-0.2
0
0.2
0.4
0.6
0.8
food extract LghtMnfc mnfc serv
EU_27
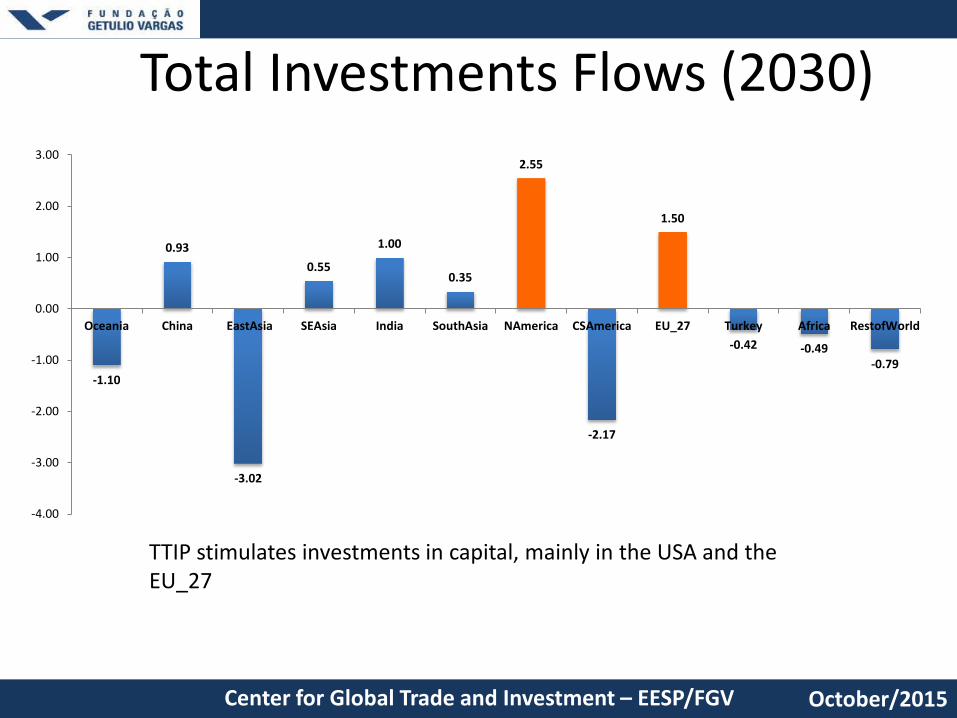
Total Investments Flows (2030)
October/2015Center for Global Trade and Investment – EESP/FGV
-1.10
0.93
-3.02
0.55
1.00
0.35
2.55
-2.17
1.50
-0.42 -0.49-0.79
-4.00
-3.00
-2.00
-1.00
0.00
1.00
2.00
3.00
Oceania China EastAsia SEAsia India SouthAsia NAmerica CSAmerica EU_27 Turkey Africa RestofWorld
TTIP stimulates investments in capital, mainly in the USA and theEU_27
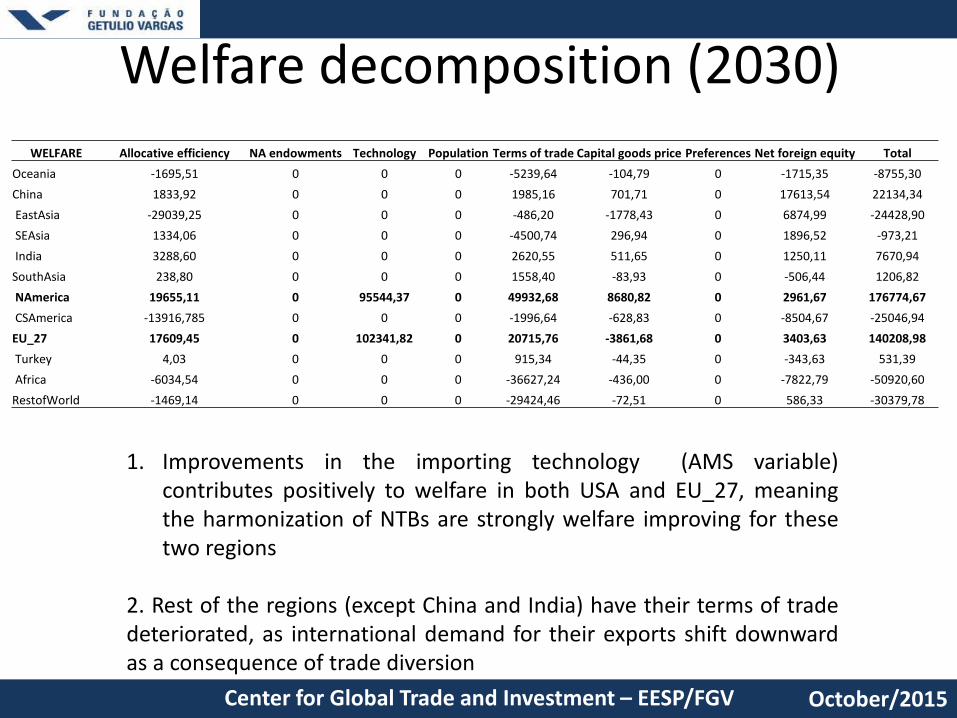
Welfare decomposition (2030)
October/2015Center for Global Trade and Investment – EESP/FGV
WELFARE Allocative efficiency NA endowments Technology Population Terms of trade Capital goods price Preferences Net foreign equity TotalOceania -1695,51 0 0 0 -5239,64 -104,79 0 -1715,35 -8755,30China 1833,92 0 0 0 1985,16 701,71 0 17613,54 22134,34EastAsia -29039,25 0 0 0 -486,20 -1778,43 0 6874,99 -24428,90SEAsia 1334,06 0 0 0 -4500,74 296,94 0 1896,52 -973,21India 3288,60 0 0 0 2620,55 511,65 0 1250,11 7670,94
SouthAsia 238,80 0 0 0 1558,40 -83,93 0 -506,44 1206,82NAmerica 19655,11 0 95544,37 0 49932,68 8680,82 0 2961,67 176774,67CSAmerica -13916,785 0 0 0 -1996,64 -628,83 0 -8504,67 -25046,94
EU_27 17609,45 0 102341,82 0 20715,76 -3861,68 0 3403,63 140208,98Turkey 4,03 0 0 0 915,34 -44,35 0 -343,63 531,39Africa -6034,54 0 0 0 -36627,24 -436,00 0 -7822,79 -50920,60
RestofWorld -1469,14 0 0 0 -29424,46 -72,51 0 586,33 -30379,78
1. Improvements in the importing technology (AMS variable)contributes positively to welfare in both USA and EU_27, meaningthe harmonization of NTBs are strongly welfare improving for thesetwo regions
2. Rest of the regions (except China and India) have their terms of tradedeteriorated, as international demand for their exports shift downwardas a consequence of trade diversion
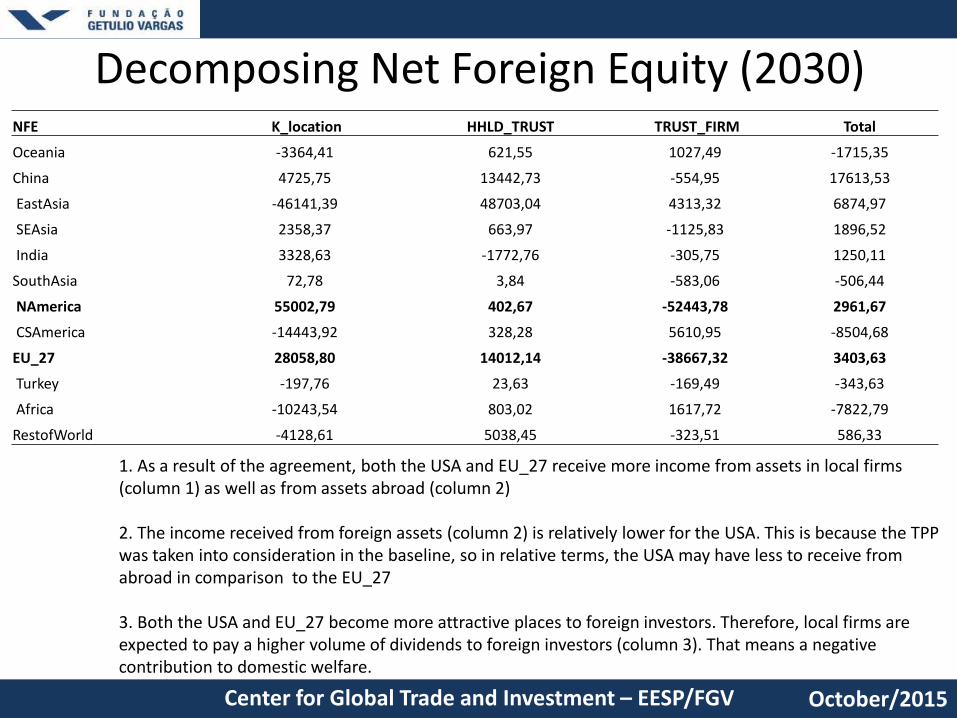
Decomposing Net Foreign Equity (2030)
October/2015Center for Global Trade and Investment – EESP/FGV
1. As a result of the agreement, both the USA and EU_27 receive more income from assets in local firms(column 1) as well as from assets abroad (column 2)
2. The income received from foreign assets (column 2) is relatively lower for the USA. This is because the TPP was taken into consideration in the baseline, so in relative terms, the USA may have less to receive fromabroad in comparison to the EU_27
3. Both the USA and EU_27 become more attractive places to foreign investors. Therefore, local firms are expected to pay a higher volume of dividends to foreign investors (column 3). That means a negative contribution to domestic welfare.
NFE K_location HHLD_TRUST TRUST_FIRM Total
Oceania -3364,41 621,55 1027,49 -1715,35
China 4725,75 13442,73 -554,95 17613,53
EastAsia -46141,39 48703,04 4313,32 6874,97
SEAsia 2358,37 663,97 -1125,83 1896,52
India 3328,63 -1772,76 -305,75 1250,11
SouthAsia 72,78 3,84 -583,06 -506,44
NAmerica 55002,79 402,67 -52443,78 2961,67
CSAmerica -14443,92 328,28 5610,95 -8504,68
EU_27 28058,80 14012,14 -38667,32 3403,63
Turkey -197,76 23,63 -169,49 -343,63
Africa -10243,54 803,02 1617,72 -7822,79
RestofWorld -4128,61 5038,45 -323,51 586,33

What if the TPP doesn’t become a reality??
October/2015Center for Global Trade and Investment – EESP/FGV
TPP No TPP TPP No TPP
USA EU_27
Real GDP 0.92 0.88 0.96 0.97
Export Volume 5.41 5.95 2.32 2.45
Import volume 6.54 6.82 2.78 3.00
1. Impacts on real GDP are lower for the USA and are basically the same for theEU_27. The consideration of TPP in the baseline potentializes relative GDP gains for the USA from TTIP
2. However, when it comes to trade flows, less stimulus to trade in the “No TPP” counter factual scenario magnifies the impact of TTIP for both regions
Final remarks
• Both USA and EU_27 will be better off (welfare) as a consequence of TTIP
• The rest of the world will be worse off, with the exception ofChina and India
• The main transmission channel for the rest of the world willbe through international prices (terms of trade)
• When it comes to the USA and UE_27, it turns out that theharmonization of NTBs are a key factor for mutual welfaregains stemming from the agreement
October/2015Center for Global Trade and Investment – EESP/FGV