Embed Size (px)
Citation preview

- 1 -
ECR, Paris, France – February 08, 2018
Christoph Glock, Yacine Rekik, Aris A. Syntetos
On the impact of inventory accuracy
improvements on sales
- 2 -
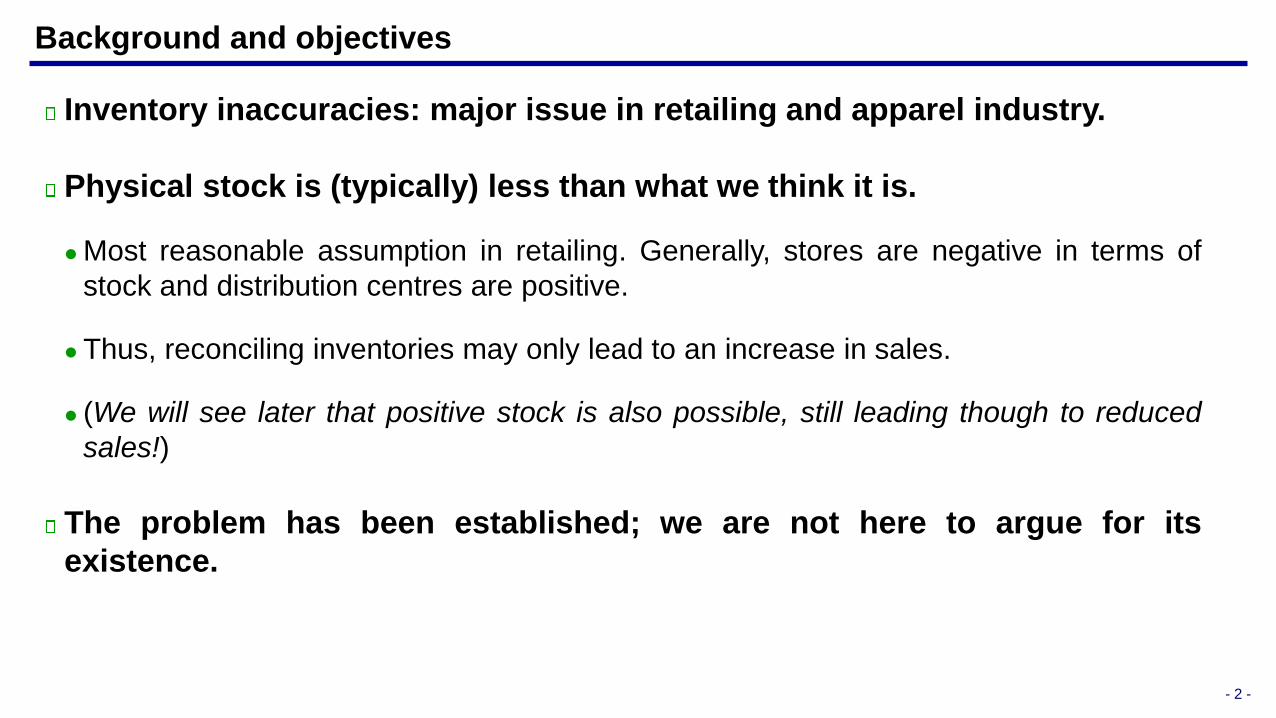
Background and objectives
Inventory inaccuracies: major issue in retailing and apparel industry.
Physical stock is (typically) less than what we think it is.
Most reasonable assumption in retailing. Generally, stores are negative in terms of
stock and distribution centres are positive.
Thus, reconciling inventories may only lead to an increase in sales.
(We will see later that positive stock is also possible, still leading though to reduced
sales!)
The problem has been established; we are not here to argue for its
existence.
- 3 -
Background and objectives
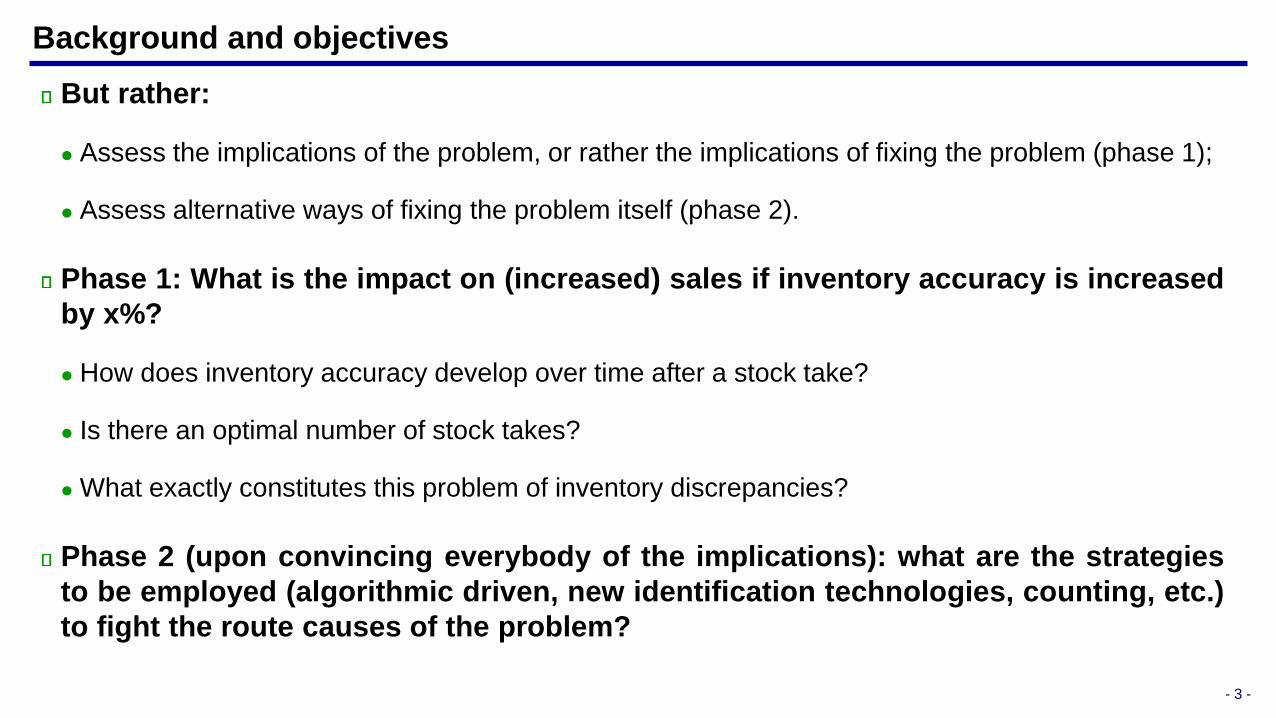
But rather:
Assess the implications of the problem, or rather the implications of fixing the problem (phase 1);
Assess alternative ways of fixing the problem itself (phase 2).
Phase 1: What is the impact on (increased) sales if inventory accuracy is increased
by x%?
How does inventory accuracy develop over time after a stock take?
Is there an optimal number of stock takes?
What exactly constitutes this problem of inventory discrepancies?
Phase 2 (upon convincing everybody of the implications): what are the strategies
to be employed (algorithmic driven, new identification technologies, counting, etc.)
to fight the route causes of the problem?
- 4 -
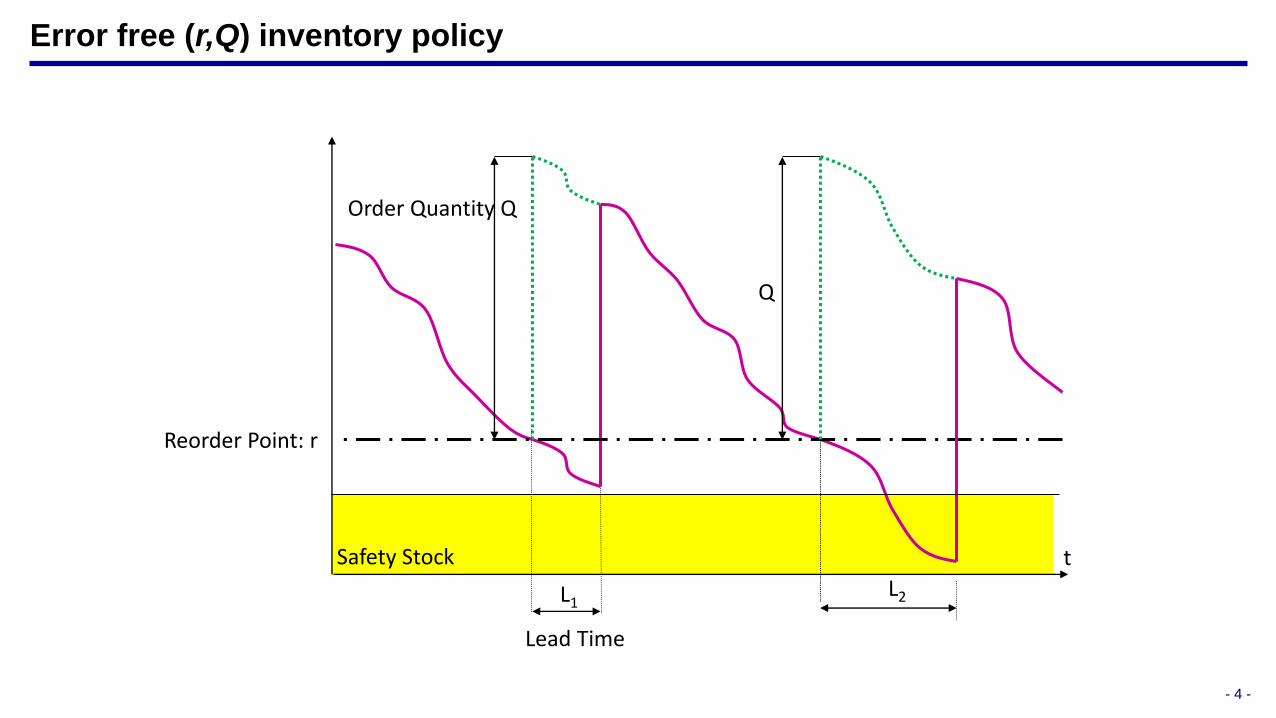
Error free (r,Q) inventory policy
Safety Stock
L1L2
t
Reorder Point: r
Order Quantity Q
Q
Lead Time
- 5 -
Safety Stock
L1L2
t
Order Quantity Q
Q
Lead Time
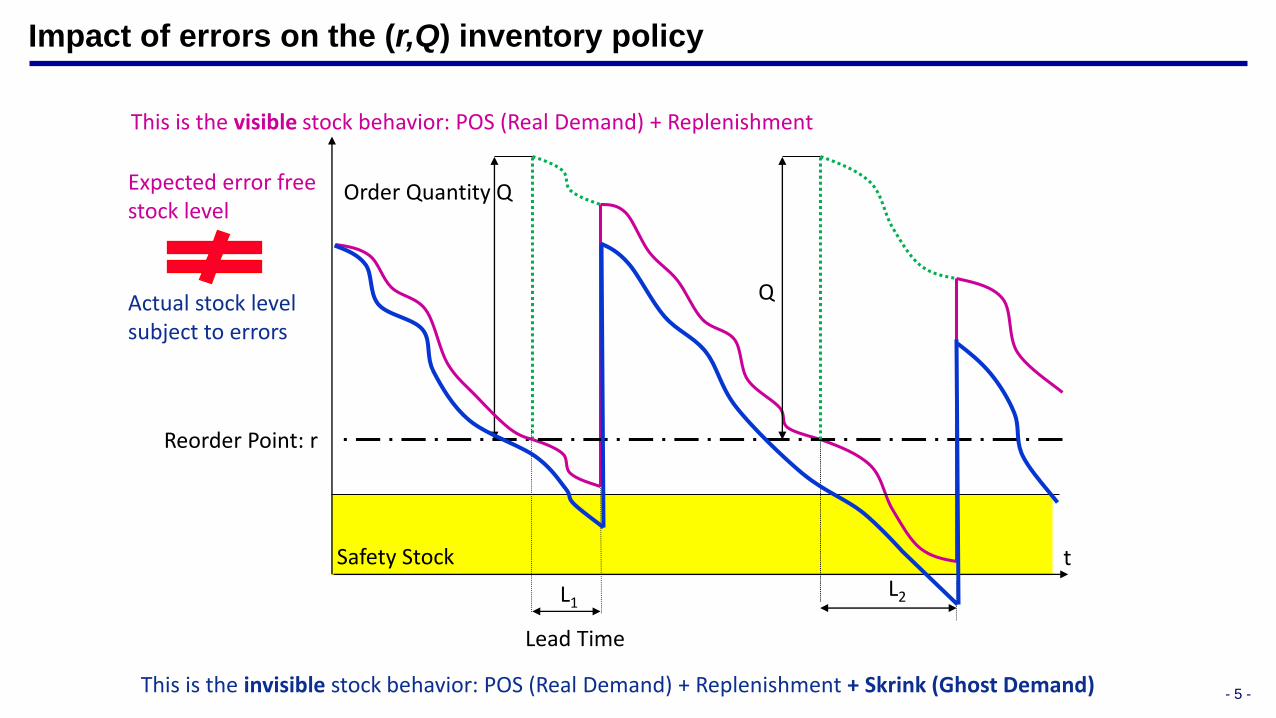
Expected error free stock level
Impact of errors on the (r,Q) inventory policy
Reorder Point: r
This is the visible stock behavior: POS (Real Demand) + Replenishment
This is the invisible stock behavior: POS (Real Demand) + Replenishment + Skrink (Ghost Demand)
Actual stock level subject to errors
- 6 -
Safety Stock
L1L2
t
Order Quantity Q
Q
Lead Time
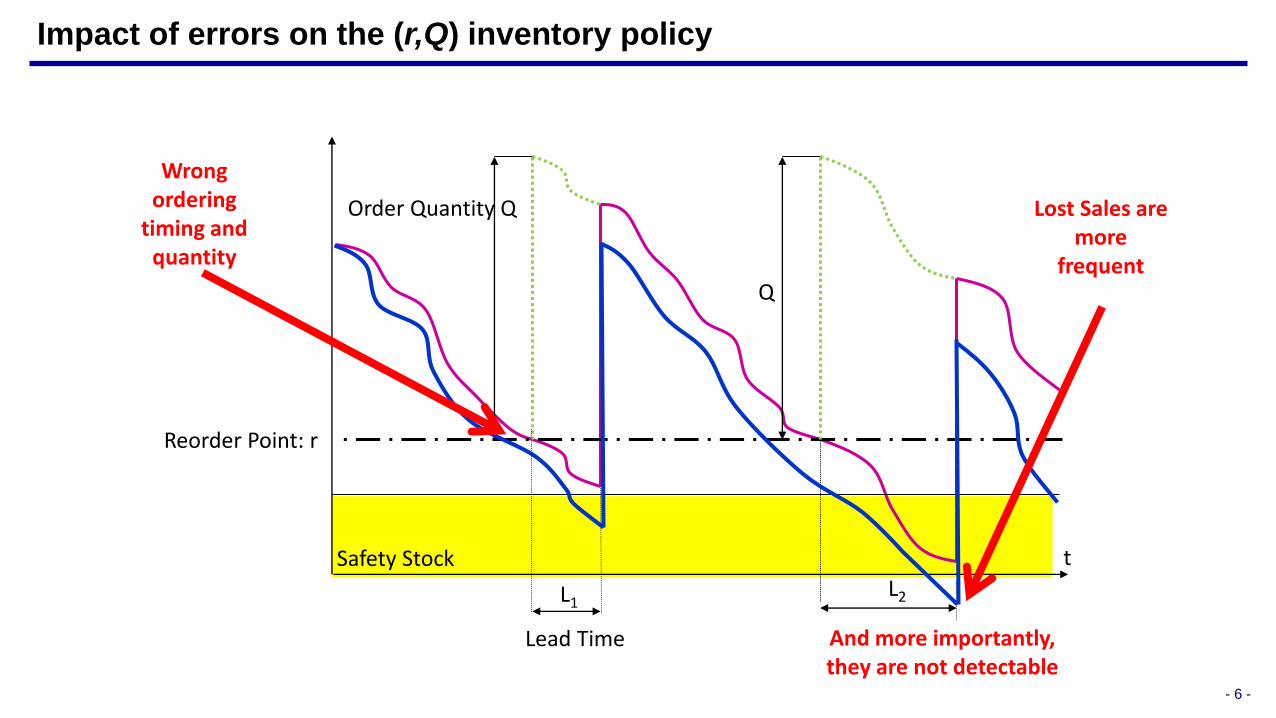
Wrong ordering
timing and quantity
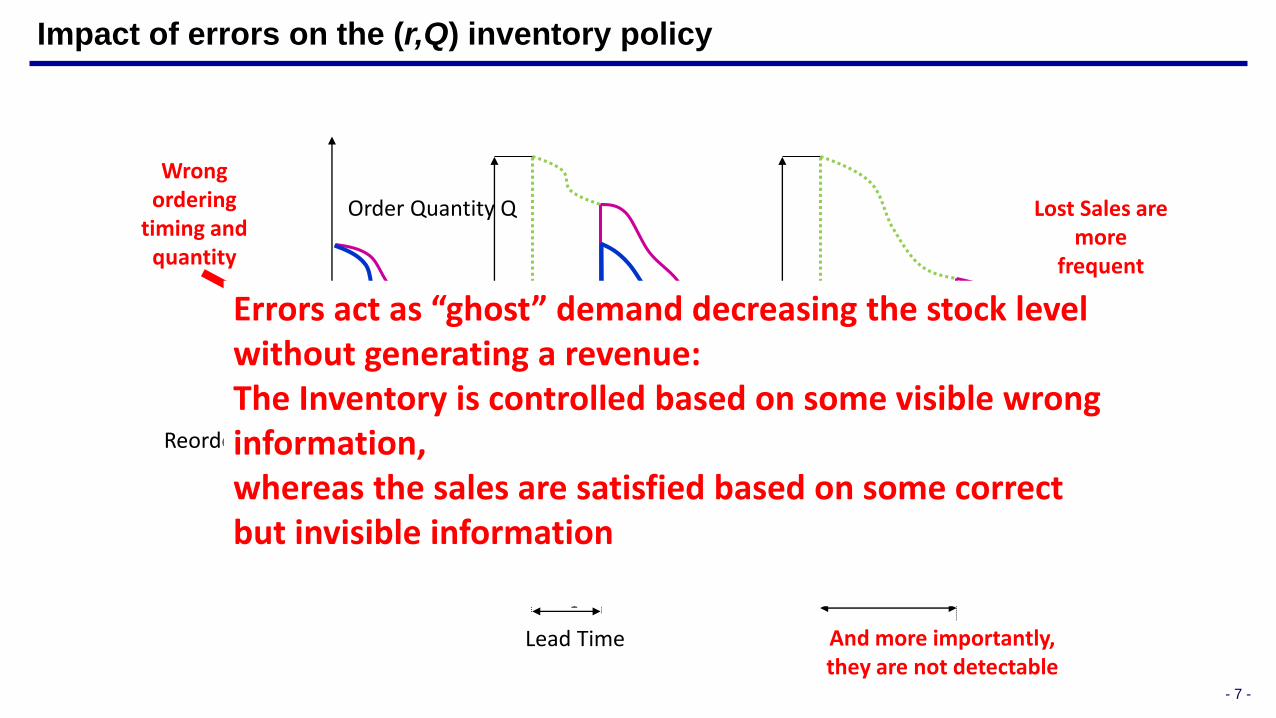
Impact of errors on the (r,Q) inventory policy
Lost Sales are more
frequent
Reorder Point: r
And more importantly, they are not detectable
- 7 -
Safety Stock
L1L2
t
Order Quantity Q
Q
Lead Time
Wrong ordering
timing and quantity
Impact of errors on the (r,Q) inventory policy
Lost Sales are more
frequent
Reorder Point: r
And more importantly, they are not detectable
Errors act as “ghost” demand decreasing the stock level without generating a revenue:The Inventory is controlled based on some visible wrong information,whereas the sales are satisfied based on some correct but invisible information
- 8 -
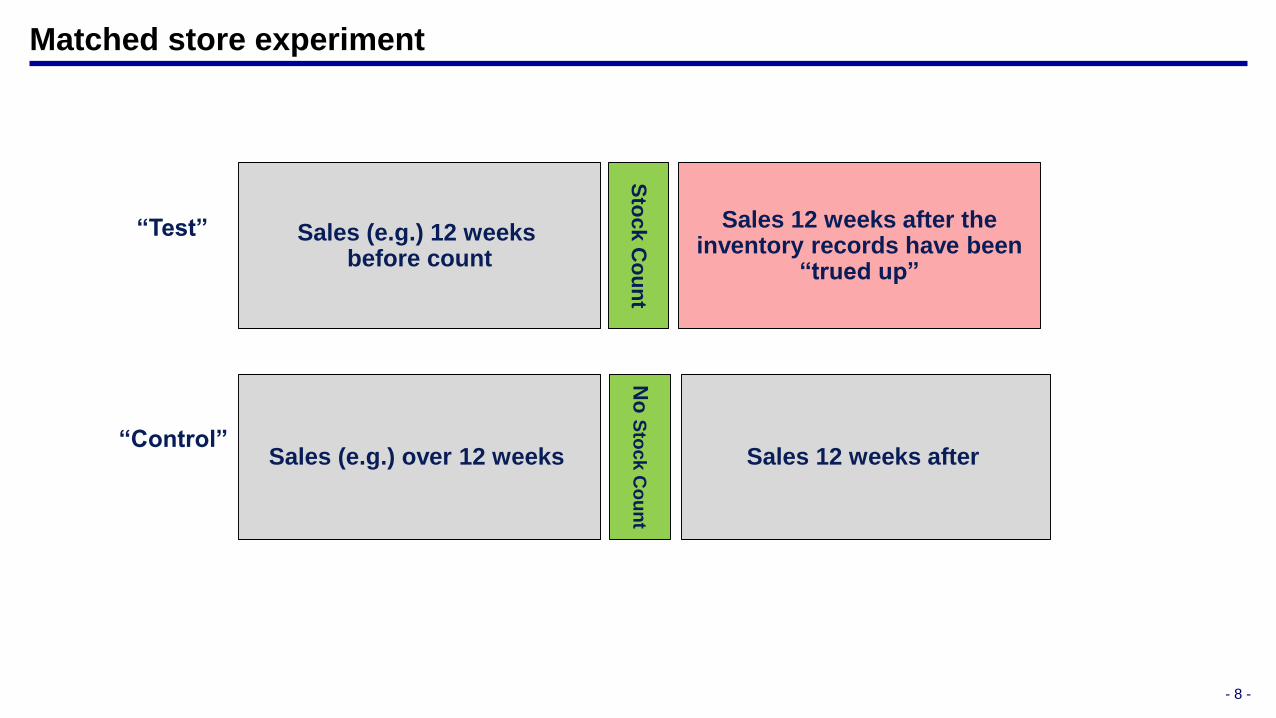
Matched store experiment
Sales (e.g.) 12 weeks before count
Sales (e.g.) over 12 weeks
“Test”
“Control”
Sto
ck C
ou
nt
Sales 12 weeks after the inventory records have been
“trued up”
No
Sto
ck
Co
un
t
Sales 12 weeks after
- 9 -
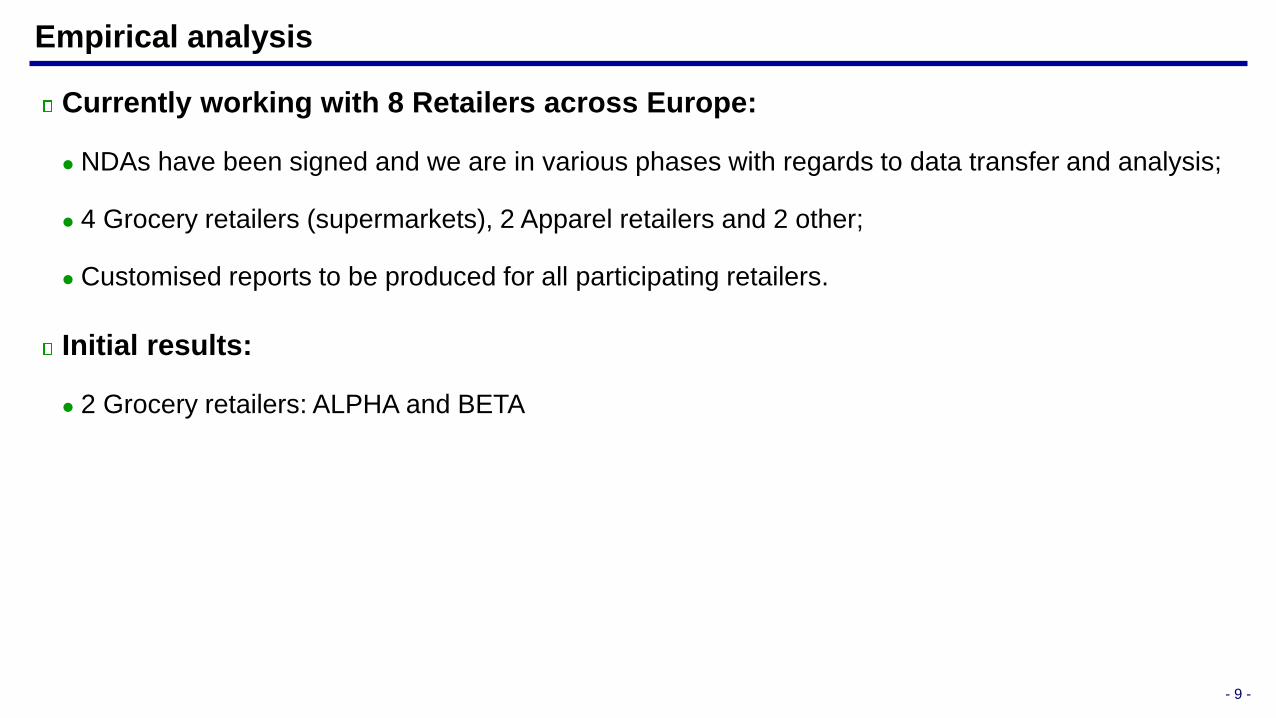
Empirical analysis
Currently working with 8 Retailers across Europe:
NDAs have been signed and we are in various phases with regards to data transfer and analysis;
4 Grocery retailers (supermarkets), 2 Apparel retailers and 2 other;
Customised reports to be produced for all participating retailers.
Initial results:
2 Grocery retailers: ALPHA and BETA
- 10 -
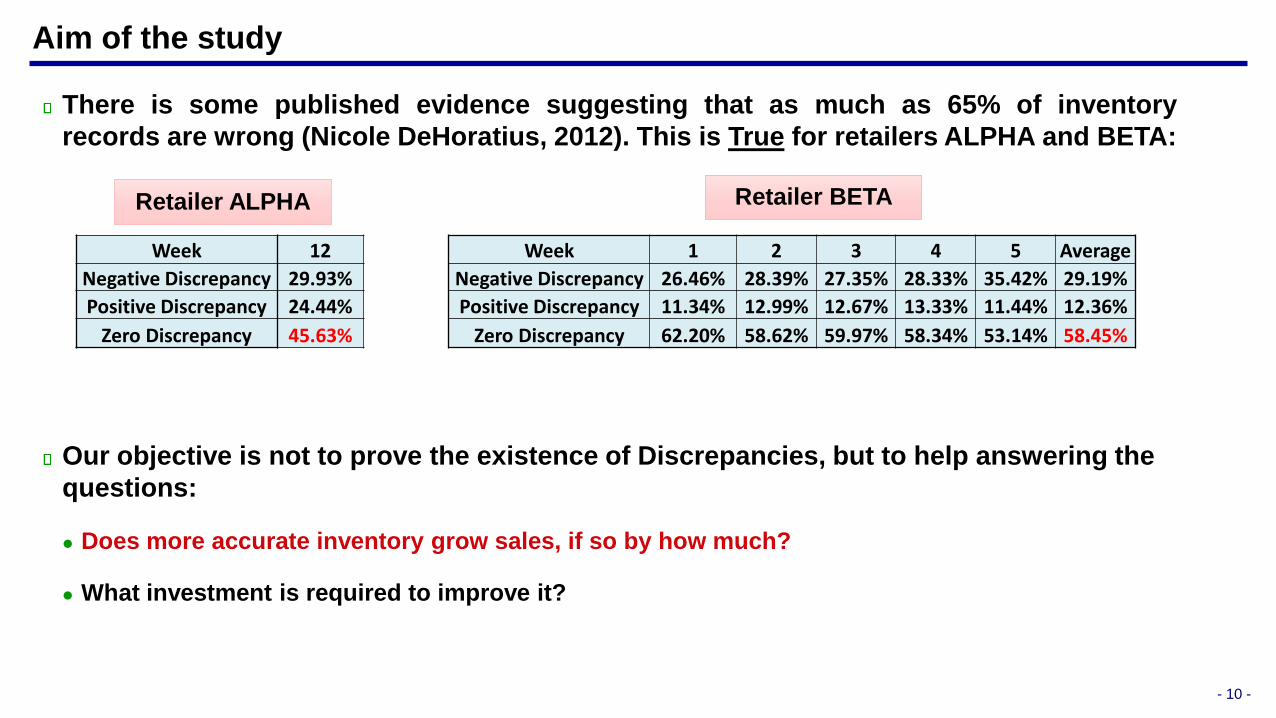
Aim of the study
There is some published evidence suggesting that as much as 65% of inventory
records are wrong (Nicole DeHoratius, 2012). This is True for retailers ALPHA and BETA:
Our objective is not to prove the existence of Discrepancies, but to help answering the
questions:
Does more accurate inventory grow sales, if so by how much?
What investment is required to improve it?
Week 1 2 3 4 5 Average
Negative Discrepancy 26.46% 28.39% 27.35% 28.33% 35.42% 29.19%
Positive Discrepancy 11.34% 12.99% 12.67% 13.33% 11.44% 12.36%
Zero Discrepancy 62.20% 58.62% 59.97% 58.34% 53.14% 58.45%
Week 12
Negative Discrepancy 29.93%
Positive Discrepancy 24.44%
Zero Discrepancy 45.63%
Retailer ALPHA Retailer BETA
- 11 -
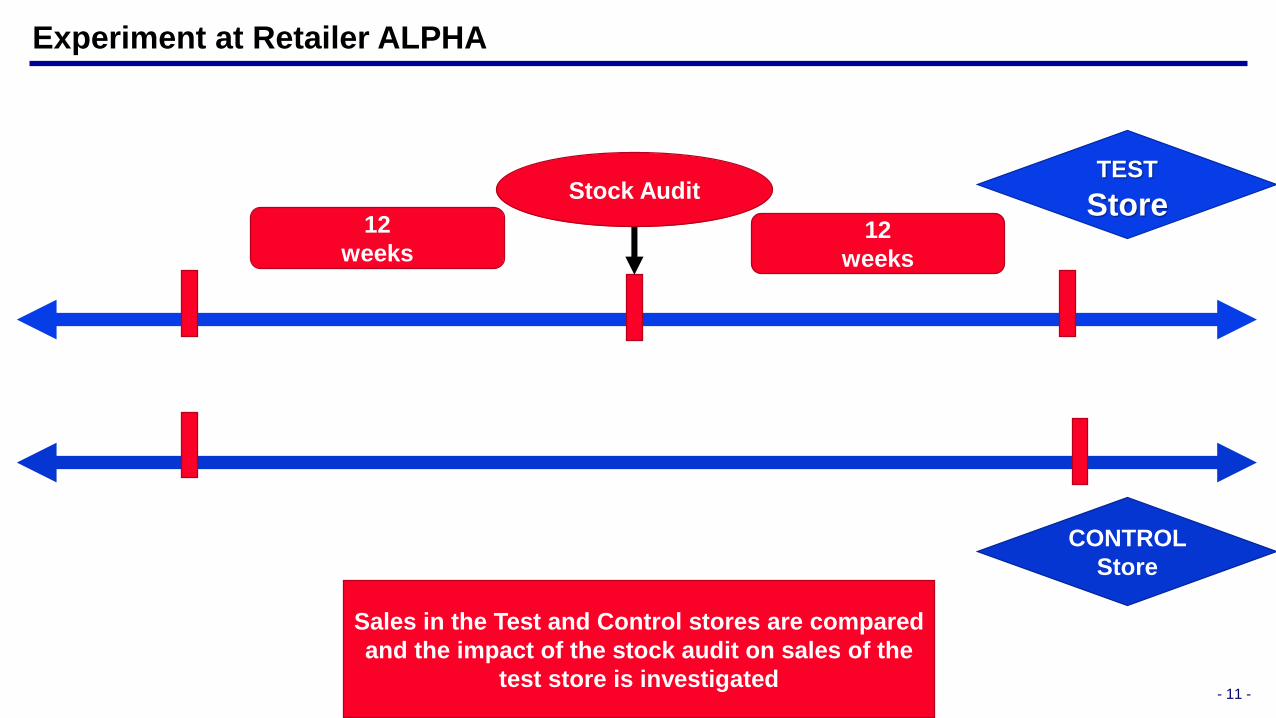
Experiment at Retailer ALPHA
12
weeks
Stock Audit
Sales in the Test and Control stores are compared
and the impact of the stock audit on sales of the
test store is investigated
12
weeks
CONTROL
Store
TEST
Store
- 12 -
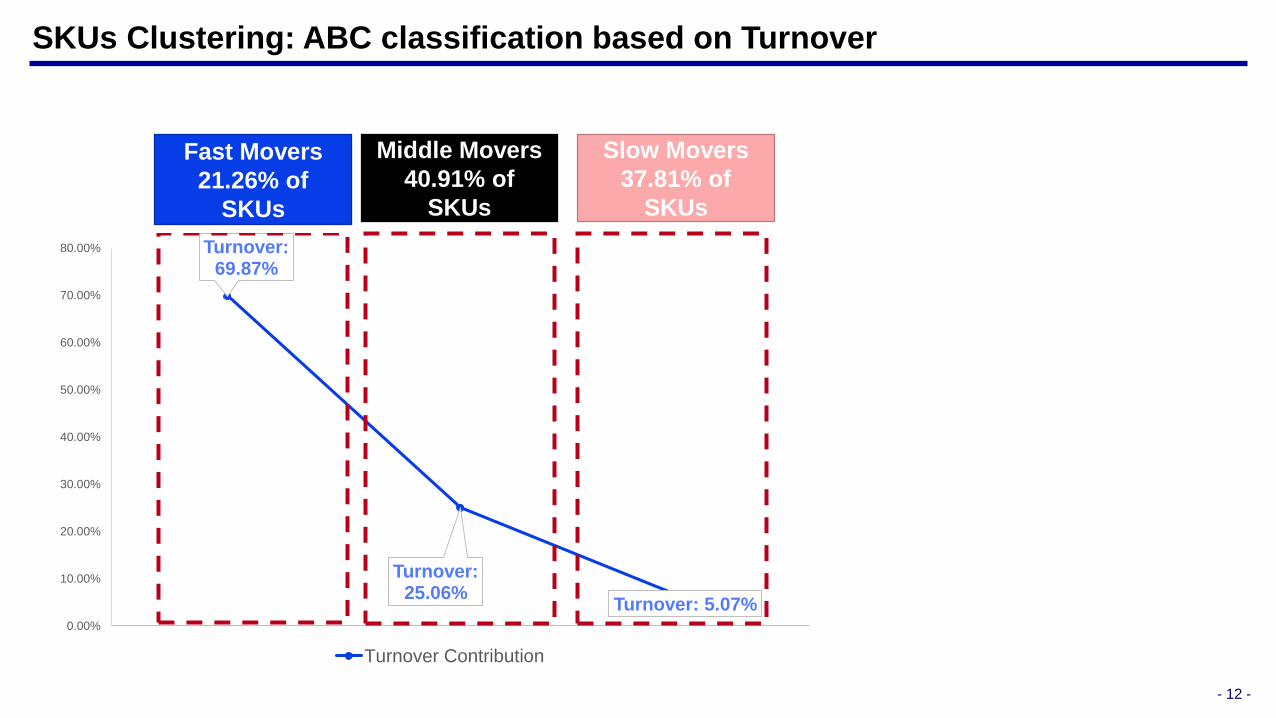
SKUs Clustering: ABC classification based on Turnover
Turnover: 69.87%
Turnover: 25.06%
Turnover: 5.07%0.00%
10.00%
20.00%
30.00%
40.00%
50.00%
60.00%
70.00%
80.00%
Turnover Contribution
Fast Movers
21.26% of
SKUs
Middle Movers
40.91% of
SKUs
Slow Movers
37.81% of
SKUs
- 13 -
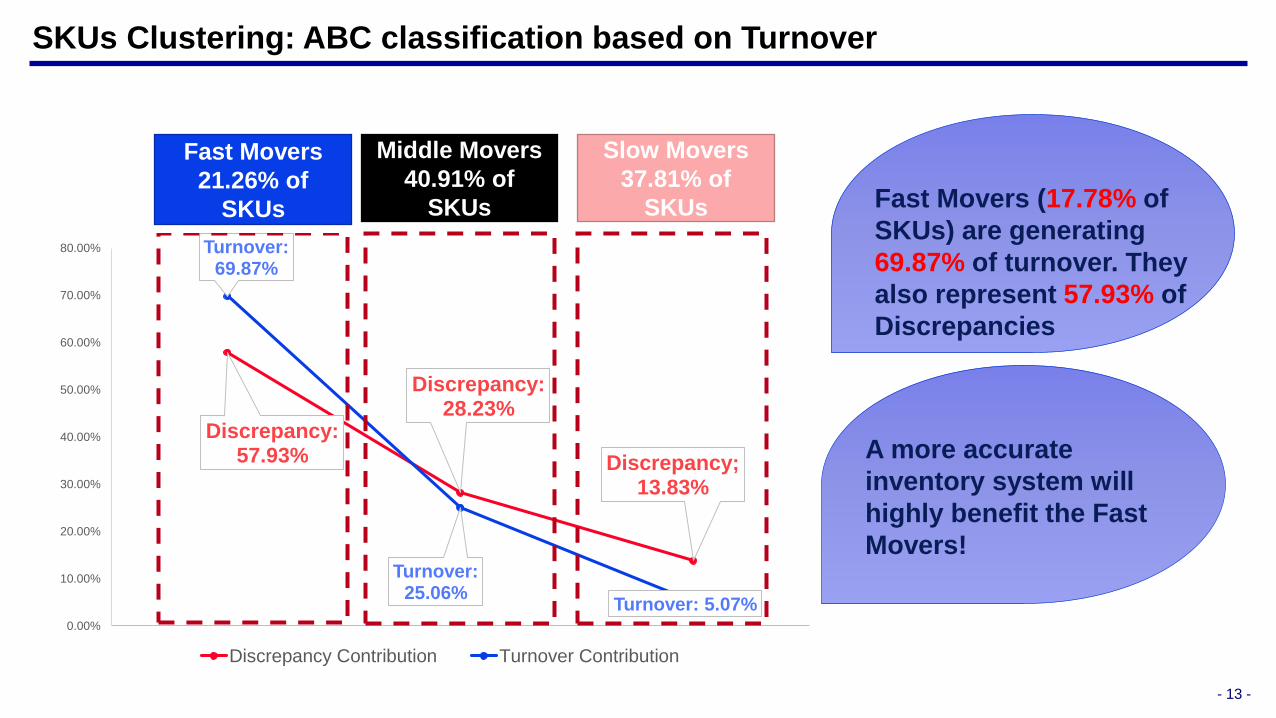
SKUs Clustering: ABC classification based on Turnover
Discrepancy: 57.93%
Discrepancy: 28.23%
Discrepancy; 13.83%
Turnover: 69.87%
Turnover: 25.06%
Turnover: 5.07%0.00%
10.00%
20.00%
30.00%
40.00%
50.00%
60.00%
70.00%
80.00%
Discrepancy Contribution Turnover Contribution
Fast Movers (17.78% of
SKUs) are generating
69.87% of turnover. They
also represent 57.93% of
Discrepancies
Fast Movers
21.26% of
SKUs
Middle Movers
40.91% of
SKUs
Slow Movers
37.81% of
SKUs
A more accurate
inventory system will
highly benefit the Fast
Movers!
- 14 -
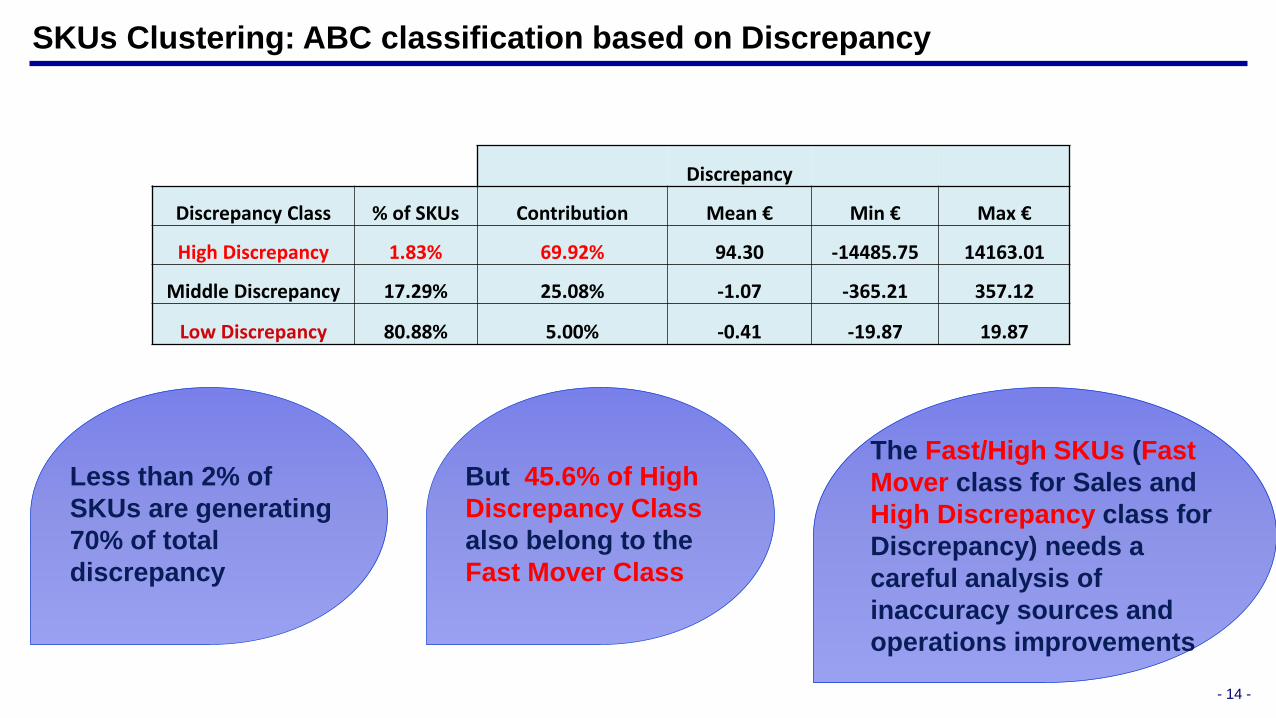
SKUs Clustering: ABC classification based on Discrepancy
Less than 2% of
SKUs are generating
70% of total
discrepancy
But 45.6% of High
Discrepancy Class
also belong to the
Fast Mover Class
The Fast/High SKUs (Fast
Mover class for Sales and
High Discrepancy class for
Discrepancy) needs a
careful analysis of
inaccuracy sources and
operations improvements
Discrepancy
Discrepancy Class % of SKUs Contribution Mean € Min € Max €
High Discrepancy 1.83% 69.92% 94.30 -14485.75 14163.01
Middle Discrepancy 17.29% 25.08% -1.07 -365.21 357.12
Low Discrepancy 80.88% 5.00% -0.41 -19.87 19.87
- 15 -
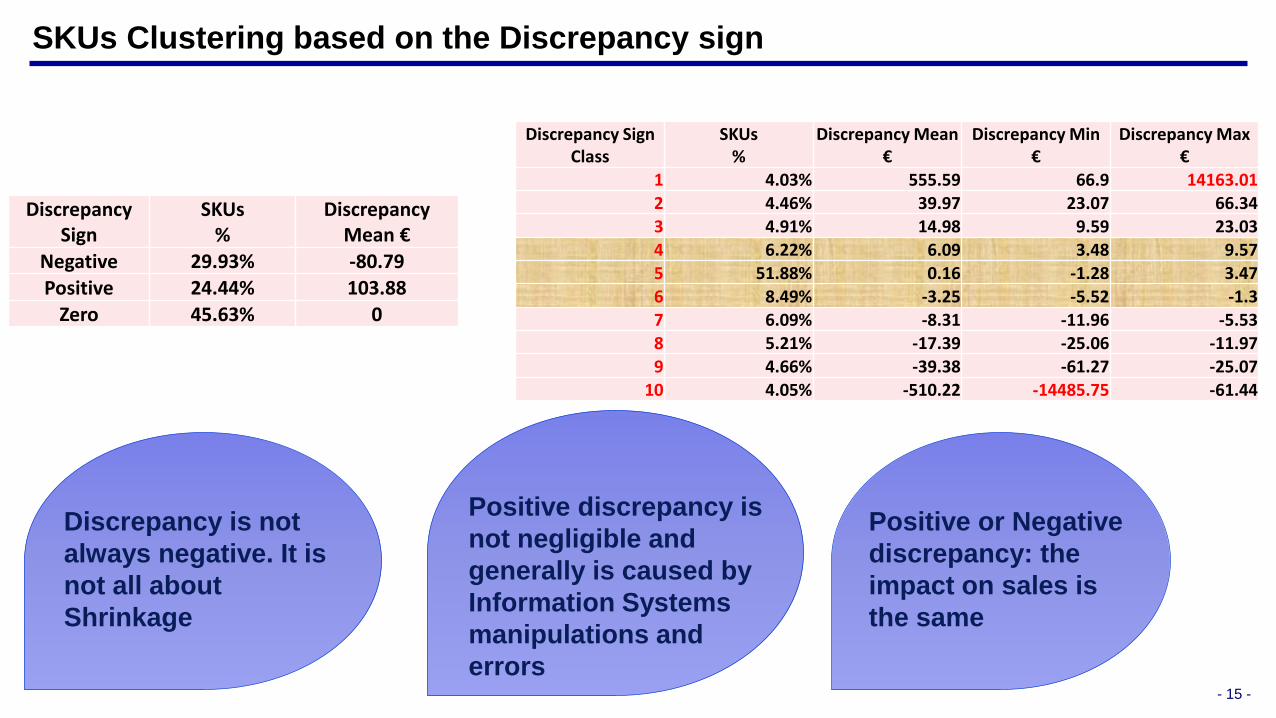
SKUs Clustering based on the Discrepancy sign
Discrepancy is not
always negative. It is
not all about
Shrinkage
Positive discrepancy is
not negligible and
generally is caused by
Information Systems
manipulations and
errors
Positive or Negative
discrepancy: the
impact on sales is
the same
Discrepancy Sign
SKUs %
Discrepancy Mean €
Negative 29.93% -80.79Positive 24.44% 103.88
Zero 45.63% 0
Discrepancy Sign Class
SKUs %
Discrepancy Mean €
Discrepancy Min €
Discrepancy Max €
1 4.03% 555.59 66.9 14163.012 4.46% 39.97 23.07 66.34
3 4.91% 14.98 9.59 23.034 6.22% 6.09 3.48 9.575 51.88% 0.16 -1.28 3.47
6 8.49% -3.25 -5.52 -1.37 6.09% -8.31 -11.96 -5.538 5.21% -17.39 -25.06 -11.979 4.66% -39.38 -61.27 -25.07
10 4.05% -510.22 -14485.75 -61.44
- 16 -
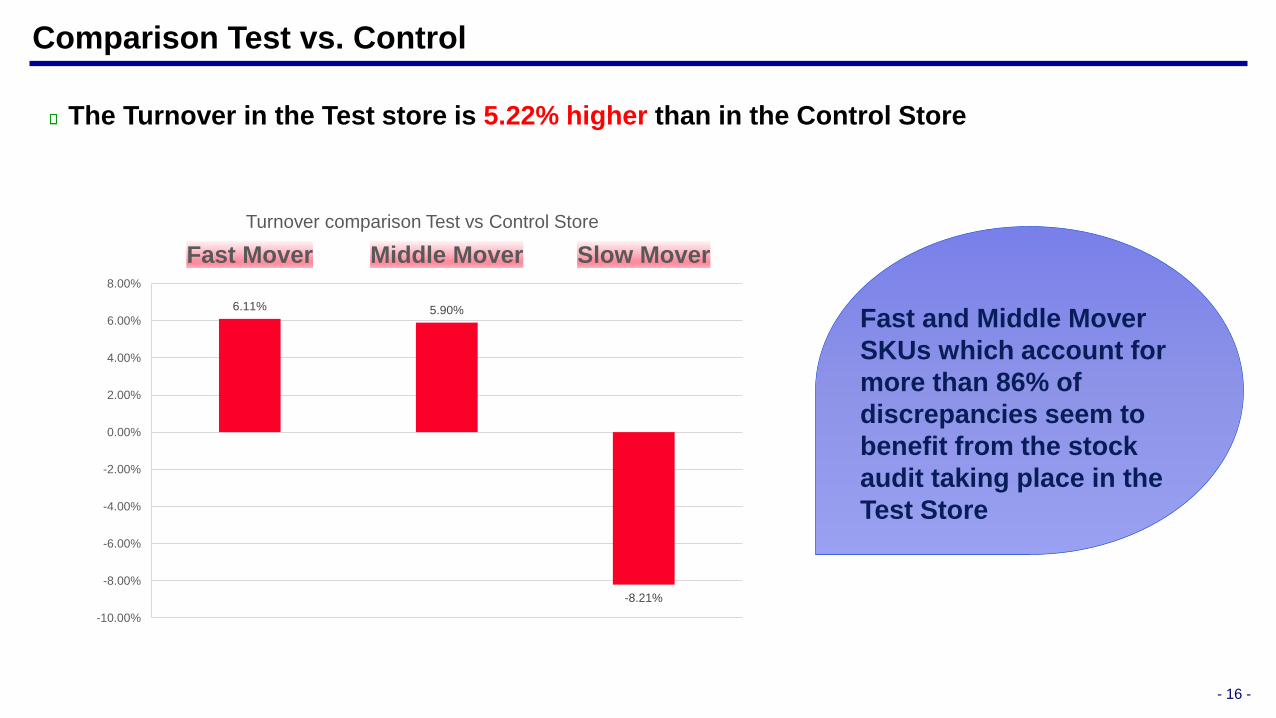
Comparison Test vs. Control
The Turnover in the Test store is 5.22% higher than in the Control Store
6.11% 5.90%
-8.21%
-10.00%
-8.00%
-6.00%
-4.00%
-2.00%
0.00%
2.00%
4.00%
6.00%
8.00%
Fast Mover Middle Mover Slow Mover
Turnover comparison Test vs Control Store
Fast and Middle Mover
SKUs which account for
more than 86% of
discrepancies seem to
benefit from the stock
audit taking place in the
Test Store
- 17 -
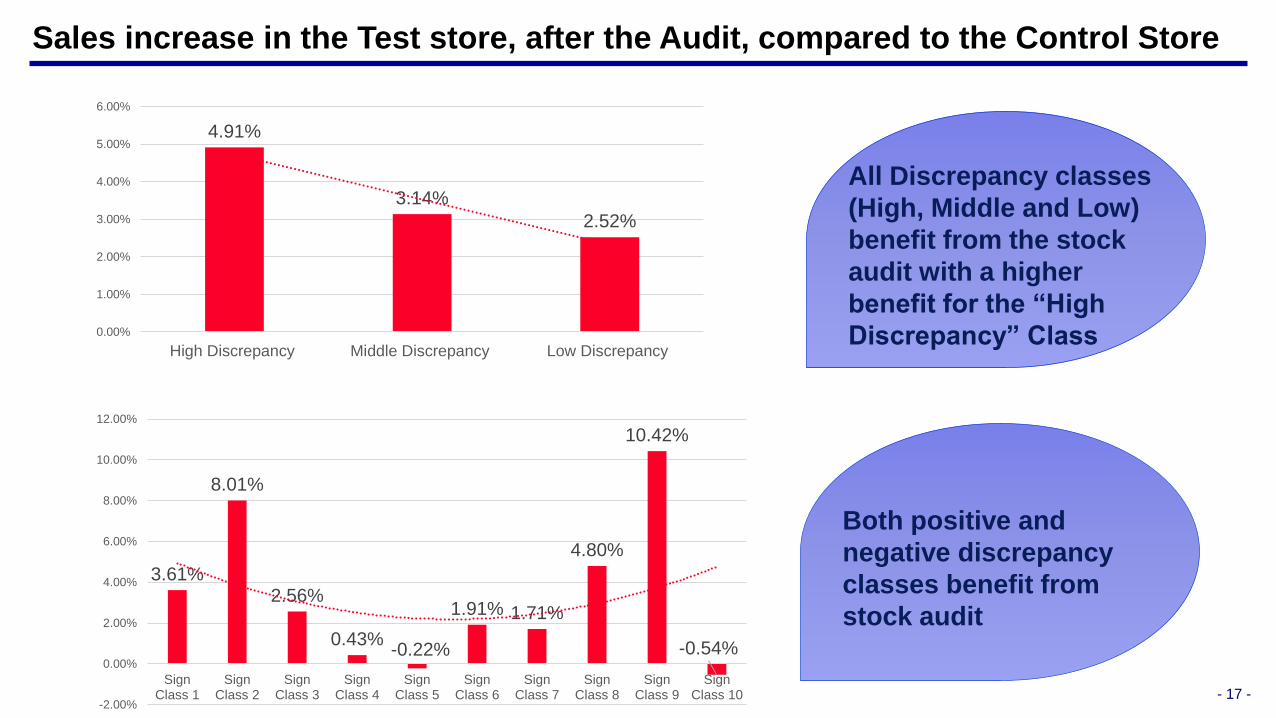
Sales increase in the Test store, after the Audit, compared to the Control Store
4.91%
3.14%
2.52%
0.00%
1.00%
2.00%
3.00%
4.00%
5.00%
6.00%
High Discrepancy Middle Discrepancy Low Discrepancy
Both positive and
negative discrepancy
classes benefit from
stock audit
3.61%
8.01%
2.56%
0.43%-0.22%
1.91% 1.71%
4.80%
10.42%
-0.54%
-2.00%
0.00%
2.00%
4.00%
6.00%
8.00%
10.00%
12.00%
SignClass 1
SignClass 2
SignClass 3
SignClass 4
SignClass 5
SignClass 6
SignClass 7
SignClass 8
SignClass 9
SignClass 10
All Discrepancy classes
(High, Middle and Low)
benefit from the stock
audit with a higher
benefit for the “High
Discrepancy” Class
- 18 -
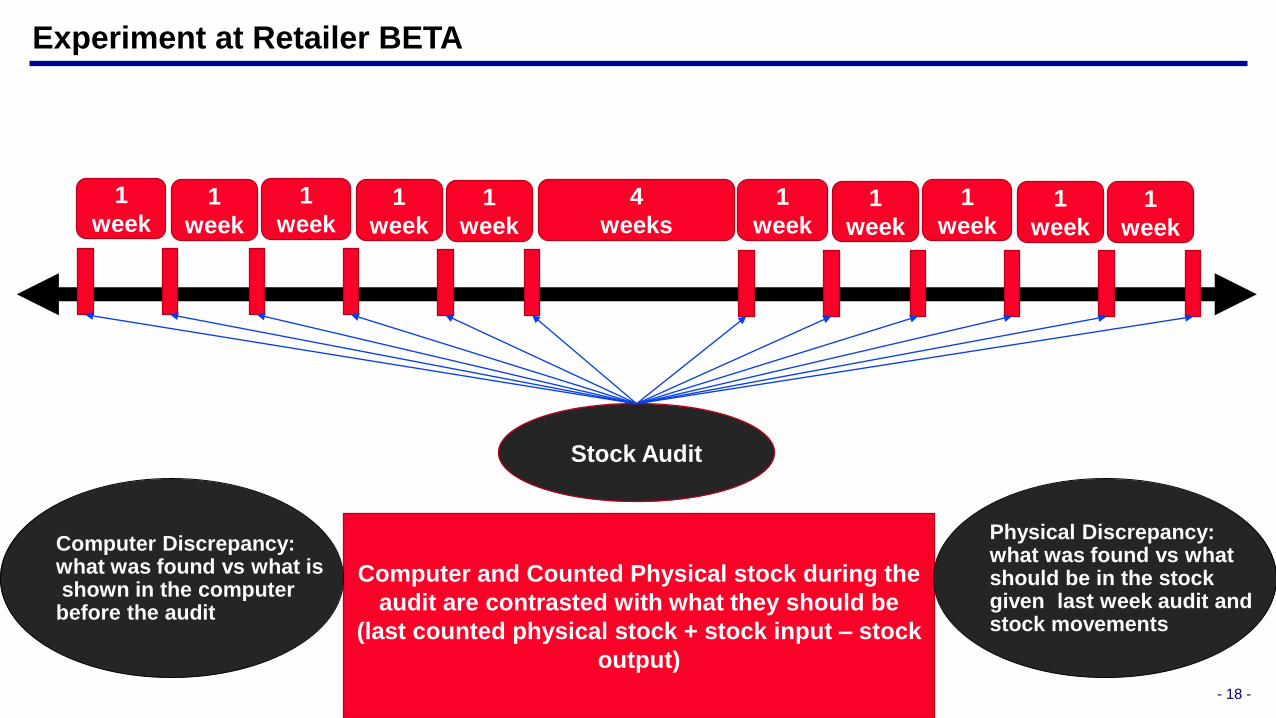
Experiment at Retailer BETA
4
weeks
1
week1
week
1
week1
week
1
week
1
week1
week
1
week1
week
1
week
Stock Audit
Computer and Counted Physical stock during the
audit are contrasted with what they should be
(last counted physical stock + stock input – stock
output)
Computer Discrepancy: what was found vs what isshown in the computer
before the audit
Physical Discrepancy: what was found vs what should be in the stock given last week audit andstock movements
- 19 -
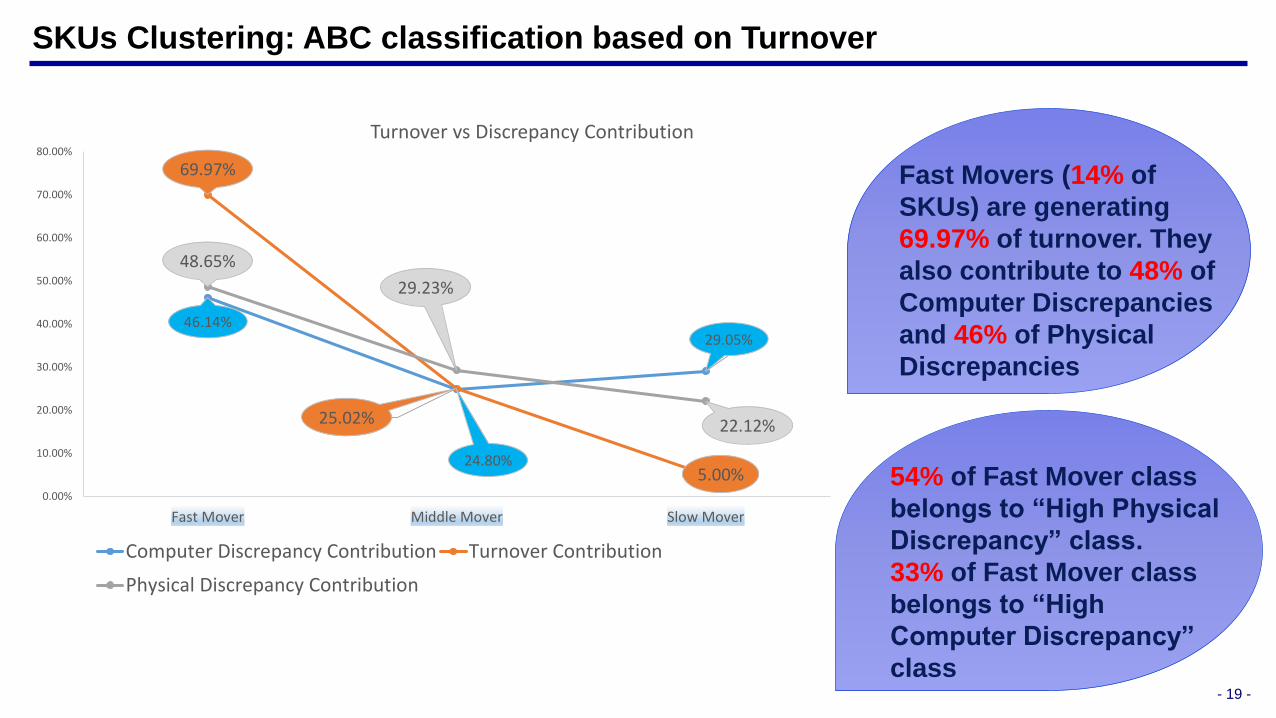
SKUs Clustering: ABC classification based on Turnover
Fast Movers (14% of
SKUs) are generating
69.97% of turnover. They
also contribute to 48% of
Computer Discrepancies
and 46% of Physical
Discrepancies
46.14%
24.80%
29.05%
69.97%
25.02%
5.00%
48.65%
29.23%
22.12%
0.00%
10.00%
20.00%
30.00%
40.00%
50.00%
60.00%
70.00%
80.00%
Fast Mover Middle Mover Slow Mover
Turnover vs Discrepancy Contribution
Computer Discrepancy Contribution Turnover Contribution
Physical Discrepancy Contribution
54% of Fast Mover class
belongs to “High Physical
Discrepancy” class.
33% of Fast Mover class
belongs to “High
Computer Discrepancy”
class
- 20 -
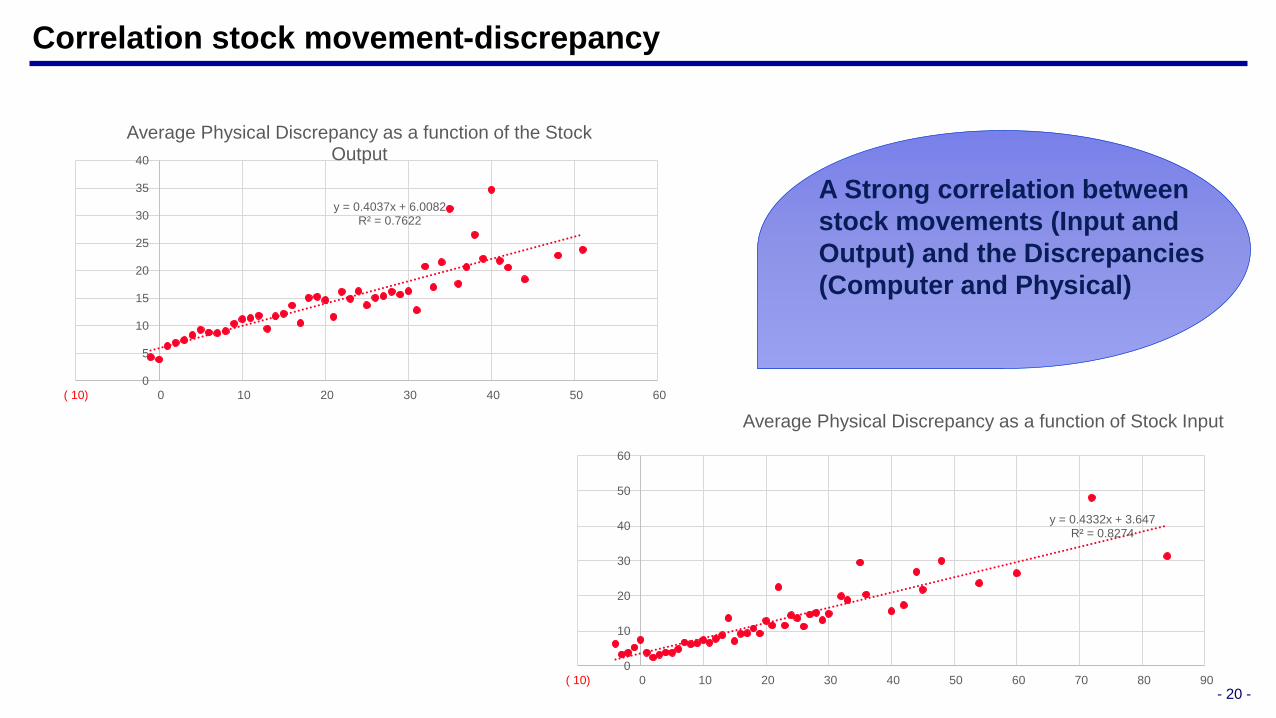
Correlation stock movement-discrepancy
A Strong correlation between
stock movements (Input and
Output) and the Discrepancies
(Computer and Physical)
y = 0.4037x + 6.0082R² = 0.7622
0
5
10
15
20
25
30
35
40
( 10) 0 10 20 30 40 50 60
Average Physical Discrepancy as a function of the Stock Output
y = 0.4332x + 3.647R² = 0.8274
0
10
20
30
40
50
60
( 10) 0 10 20 30 40 50 60 70 80 90
Average Physical Discrepancy as a function of Stock Input
- 21 -
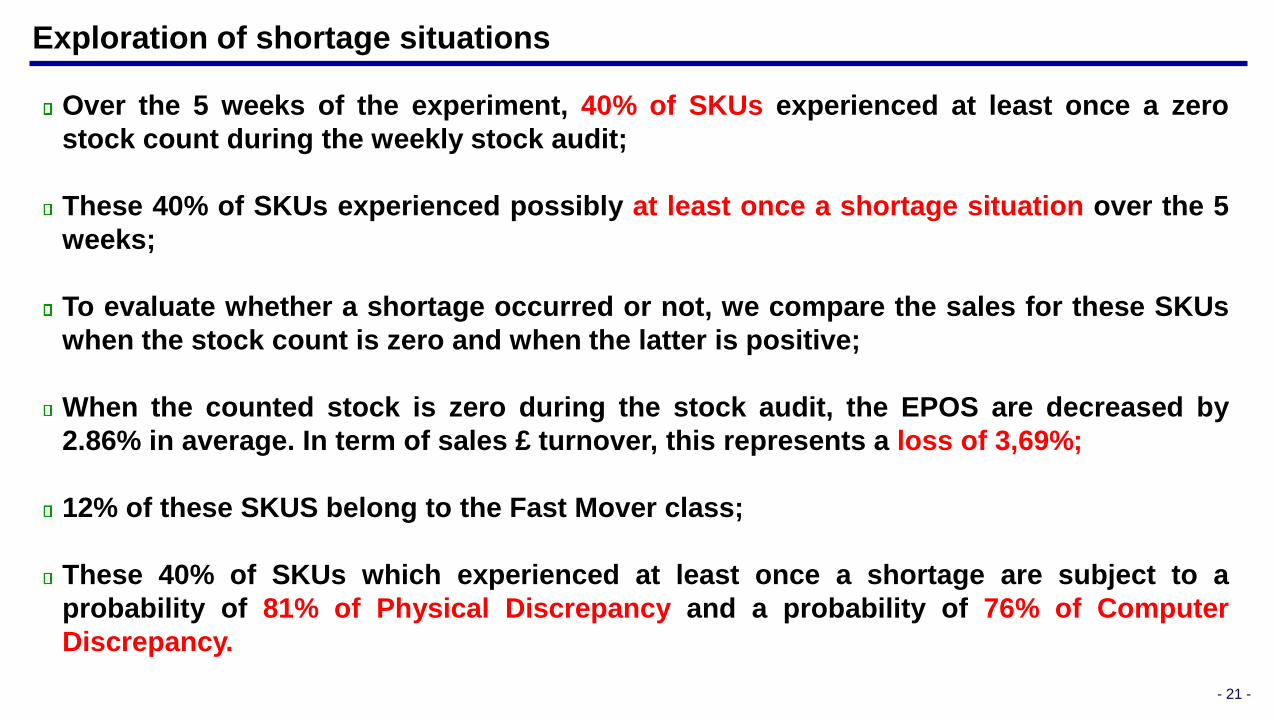
Exploration of shortage situations
Over the 5 weeks of the experiment, 40% of SKUs experienced at least once a zero
stock count during the weekly stock audit;
These 40% of SKUs experienced possibly at least once a shortage situation over the 5
weeks;
To evaluate whether a shortage occurred or not, we compare the sales for these SKUs
when the stock count is zero and when the latter is positive;
When the counted stock is zero during the stock audit, the EPOS are decreased by
2.86% in average. In term of sales £ turnover, this represents a loss of 3,69%;
12% of these SKUS belong to the Fast Mover class;
These 40% of SKUs which experienced at least once a shortage are subject to a
probability of 81% of Physical Discrepancy and a probability of 76% of Computer
Discrepancy.
- 22 -
Exploration of “Frozen SKUs” cases
Some SKUs faced a situation during some weeks where the computer stock record
was positive whereas the counted physical record showed a stock level equal to
zero. With a positive computer stock level, the replenishment process does not
trigger an order from suppliers leading to a physical stock level equal to zero in the
forthcoming week and consequently leading to lost sales.
Each week, approximatively 10% of SKUs faced this situation and it could be
verified that the EPOS for these SKUs is approximately equal to zero in the
forthcoming week.
6% of SKUs faced this situation each week and a big majority of them end up as
"frozen SKUs" without any EPOS signal during the 5 weeks experiment.
- 23 -
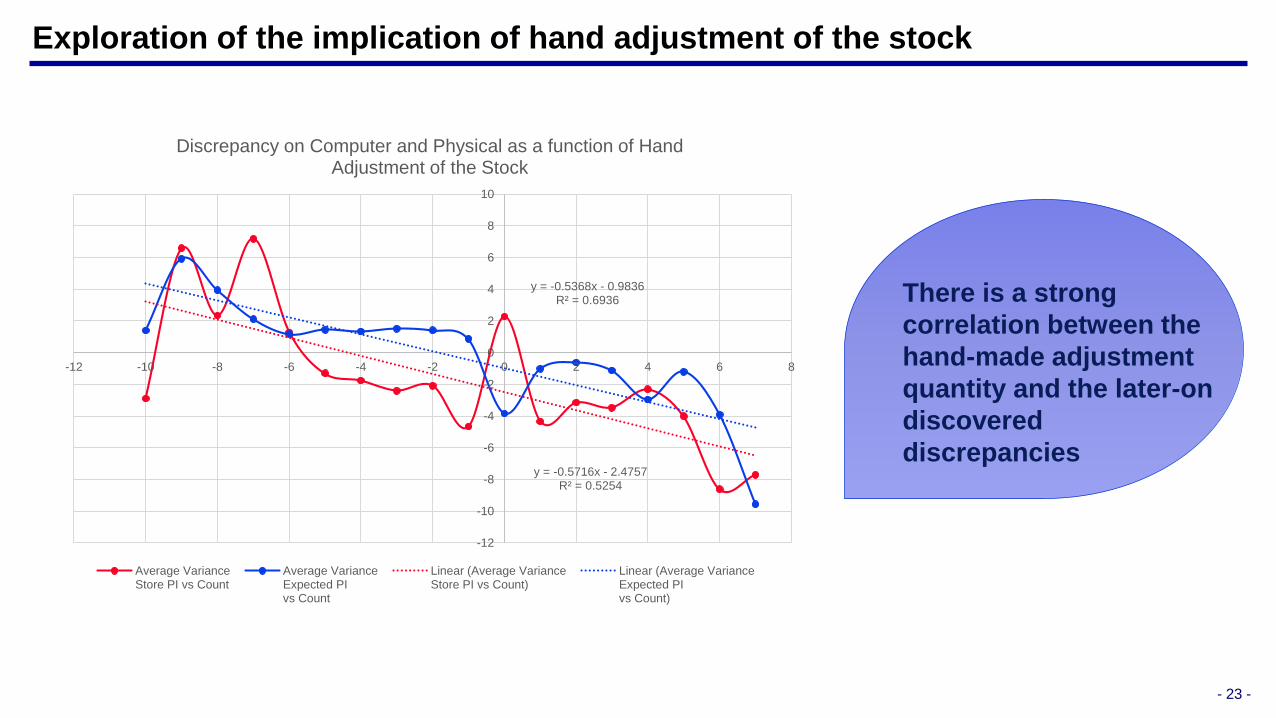
Exploration of the implication of hand adjustment of the stock
y = -0.5716x - 2.4757R² = 0.5254
y = -0.5368x - 0.9836R² = 0.6936
-12
-10
-8
-6
-4
-2
0
2
4
6
8
10
-12 -10 -8 -6 -4 -2 0 2 4 6 8
Discrepancy on Computer and Physical as a function of Hand Adjustment of the Stock
Average VarianceStore PI vs Count
Average VarianceExpected PIvs Count
Linear (Average VarianceStore PI vs Count)
Linear (Average VarianceExpected PIvs Count)
There is a strong
correlation between the
hand-made adjustment
quantity and the later-on
discovered
discrepancies
- 24 -
Next steps
Extending and finalizing the analysis for the rest of stores for Retailers Alpha
and Beta;
Completing the analysis for the rest of retailers;
Producing customized reports for each of the participating retailers;
Synthesizing the results in the form of a white paper to be hopefully useful for
the retailing industry (and sectors within it).