Embed Size (px)
Citation preview
Transportation Research Part A 44 (2010) 766–770
Contents lists available at ScienceDirect
Transportation Research Part A
journal homepage: www.elsevier .com/locate / t ra
On the identification of the effect of prohibiting hand-held cell phone usewhile driving: Comment
Breno Sampaio *
Department of Economics, University of Illinois at Urbana-Champaign, 410 David Kinley Hall, Urbana, IL 61801, United States
a r t i c l e i n f o a b s t r a c t
Article history:Received 19 March 2010Received in revised form 28 April 2010Accepted 26 July 2010
Keywords:Cell phoneDriving safetyLegislationIdentification
0965-8564/$ - see front matter � 2010 Elsevier Ltddoi:10.1016/j.tra.2010.07.011
* Mobile: +1 217 819 6799.E-mail address: [email protected]
In a paper recently published in this journal (Nikolaev, A.G., Robbins, M.J., Jacobson, S.H.,2010. Evaluating the impact of legislation prohibiting hand-held cell phone use while driv-ing. Transportation Research Part A 44, 182–193.), Nikolaev et al. (2010) provide evidenceson the effect of hand-held cell phone bans on driving safety. More specifically, they analyzethe impact of a state-wide ban on hand-held cell phone use while driving on the number offatal automobile and personal injury accidents per 100,000 licensed drivers per year andconclude that the ban had a significant negative impact on both the mean fatal accidentrate and the mean personal injury accident rate. In this paper I argue that they lack of agood identification strategy that enables them to correctly identify the causal effect ofthe ban. I also provide evidence that the effect they find is a combination of the ban effectand of unobservable variables not accounted for in their analysis. Finally, I provide a waywhere one can control for unobservables when estimating the causal effect of the ban andfind that indeed that ban appears to have a negative effect on fatal automobile accidents.
� 2010 Elsevier Ltd. All rights reserved.
1. Introduction
In a recent paper, Nikolaev et al. (2010), recognizing the importance of analyzing how hand-held cell phone usage whiledriving can cause distractions leading to accidents, present evidences of a negative effect of cell phone usage on fatalautomobile and personal injury accidents. According to the authors, ‘‘[t]he analysis strongly suggests that the mean fatalaccident rate measure decreased at a significant level” as also did ‘‘[t]he mean personal injury rate measure . . . at a significantlevel”.
The authors correctly recognize the limitations for the validity of the results they obtain suggesting further analysis isneeded. Since they use data for only the state of New York, a first important point one has to be cautious about is with re-spect to extrapolating the conclusions obtained in their study to other states, since the effect of a policy may differ substan-tially across states and even counties, which is a valid concern. Hence, studies looking at the same policy for different statesshould definitely be the next step to insure the validity of the ban on accident reduction. In a second and more importantpoint, they argue that other confounding factors, such as ‘‘road construction, safety education, introduction of new automo-bile safety features, and/or changes in alcohol and illegal substance control policies”, might be driving the negative effect ofthe ban. If this is the case, then the effect they estimate should not in any way be interpreted as the causal effect of the ban.
In this paper I argue that the approach taken by Nikolaev et al. would not correctly identify the causal effect of the ban.Two concerns are important and should be accounted for. First, their analysis do not account for any unobservable variable atthe county level, which could harm the estimation if counties present different trends or if significant changes occurred in
. All rights reserved.
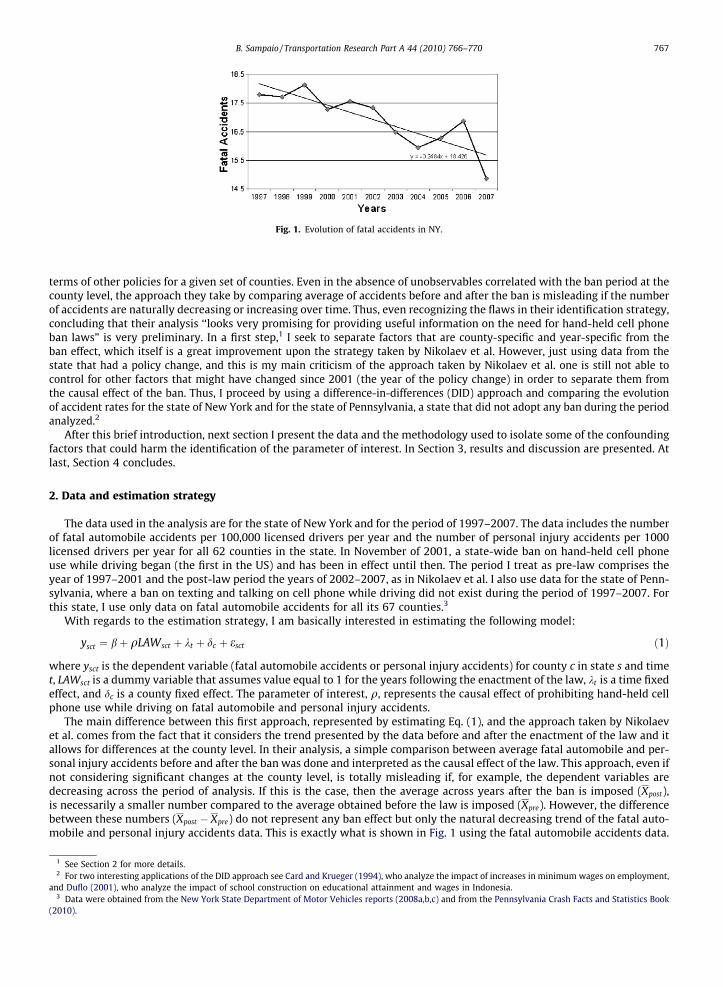
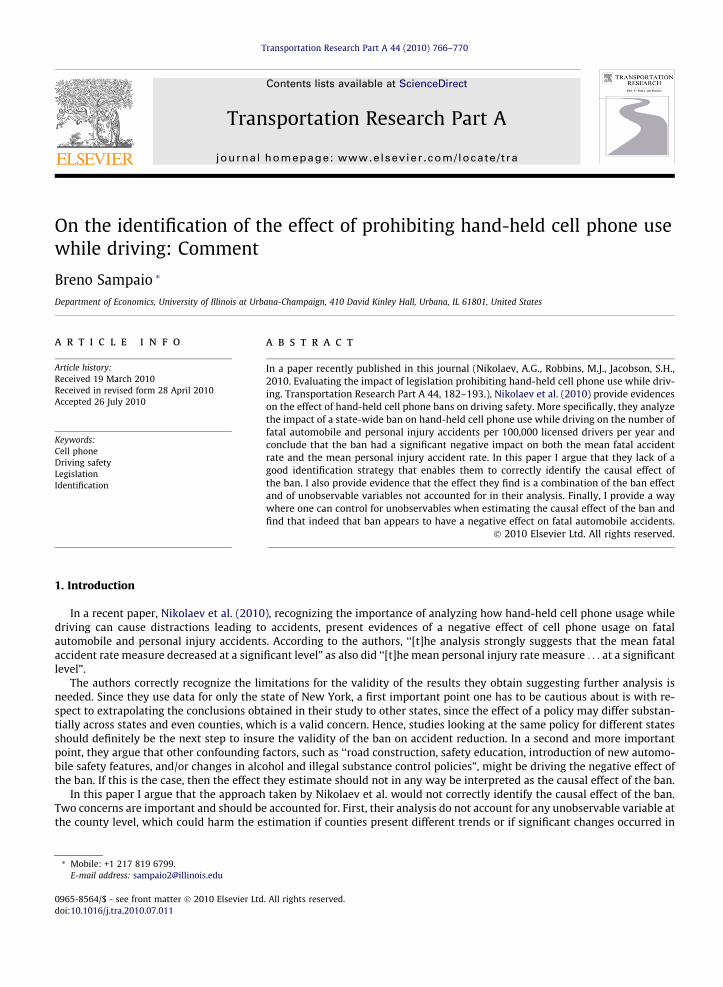
Fig. 1. Evolution of fatal accidents in NY.
B. Sampaio / Transportation Research Part A 44 (2010) 766–770 767
terms of other policies for a given set of counties. Even in the absence of unobservables correlated with the ban period at thecounty level, the approach they take by comparing average of accidents before and after the ban is misleading if the numberof accidents are naturally decreasing or increasing over time. Thus, even recognizing the flaws in their identification strategy,concluding that their analysis ‘‘looks very promising for providing useful information on the need for hand-held cell phoneban laws” is very preliminary. In a first step,1 I seek to separate factors that are county-specific and year-specific from theban effect, which itself is a great improvement upon the strategy taken by Nikolaev et al. However, just using data from thestate that had a policy change, and this is my main criticism of the approach taken by Nikolaev et al. one is still not able tocontrol for other factors that might have changed since 2001 (the year of the policy change) in order to separate them fromthe causal effect of the ban. Thus, I proceed by using a difference-in-differences (DID) approach and comparing the evolutionof accident rates for the state of New York and for the state of Pennsylvania, a state that did not adopt any ban during the periodanalyzed.2
After this brief introduction, next section I present the data and the methodology used to isolate some of the confoundingfactors that could harm the identification of the parameter of interest. In Section 3, results and discussion are presented. Atlast, Section 4 concludes.
2. Data and estimation strategy
The data used in the analysis are for the state of New York and for the period of 1997–2007. The data includes the numberof fatal automobile accidents per 100,000 licensed drivers per year and the number of personal injury accidents per 1000licensed drivers per year for all 62 counties in the state. In November of 2001, a state-wide ban on hand-held cell phoneuse while driving began (the first in the US) and has been in effect until then. The period I treat as pre-law comprises theyear of 1997–2001 and the post-law period the years of 2002–2007, as in Nikolaev et al. I also use data for the state of Penn-sylvania, where a ban on texting and talking on cell phone while driving did not exist during the period of 1997–2007. Forthis state, I use only data on fatal automobile accidents for all its 67 counties.3
With regards to the estimation strategy, I am basically interested in estimating the following model:
1 See2 For
and Du3 Dat
(2010).
ysct ¼ bþ qLAWsct þ kt þ dc þ esct ð1Þ
where ysct is the dependent variable (fatal automobile accidents or personal injury accidents) for county c in state s and timet, LAWsct is a dummy variable that assumes value equal to 1 for the years following the enactment of the law, kt is a time fixedeffect, and dc is a county fixed effect. The parameter of interest, q, represents the causal effect of prohibiting hand-held cellphone use while driving on fatal automobile and personal injury accidents.
The main difference between this first approach, represented by estimating Eq. (1), and the approach taken by Nikolaevet al. comes from the fact that it considers the trend presented by the data before and after the enactment of the law and itallows for differences at the county level. In their analysis, a simple comparison between average fatal automobile and per-sonal injury accidents before and after the ban was done and interpreted as the causal effect of the law. This approach, even ifnot considering significant changes at the county level, is totally misleading if, for example, the dependent variables aredecreasing across the period of analysis. If this is the case, then the average across years after the ban is imposed (Xpost),is necessarily a smaller number compared to the average obtained before the law is imposed (Xpre). However, the differencebetween these numbers (Xpost � Xpre) do not represent any ban effect but only the natural decreasing trend of the fatal auto-mobile and personal injury accidents data. This is exactly what is shown in Fig. 1 using the fatal automobile accidents data.
Section 2 for more details.two interesting applications of the DID approach see Card and Krueger (1994), who analyze the impact of increases in minimum wages on employment,flo (2001), who analyze the impact of school construction on educational attainment and wages in Indonesia.a were obtained from the New York State Department of Motor Vehicles reports (2008a,b,c) and from the Pennsylvania Crash Facts and Statistics Book
Table 1Regression estimates using New York data.
Variables Estimates
(1) (2) (3) (4) (5) (6)
LAW �1.399*** �2.932** �2.932*** �1.887*** �3.632*** �3.727***
(.518) (1.274) (1.188) (.112) (.641) (.263)Time FE NO YES YES NO YES YESCounty FE NO NO YES NO NO YES
N 682 682 682 682 682 682
Note: Standard deviations clustered at the county level presented in parenthesis.** Indicates p < 0.05.*** Indicates p < 0.01.
768 B. Sampaio / Transportation Research Part A 44 (2010) 766–770
Estimation of Eq. (1), besides greatly improving upon the approach taken by Nikolaev et al. still suffers from identificationissues. For example, there are unobservable variables contained in esct that one can easily argue to be correlated with LAWsct,which makes the model unable to identify q.4 Thus, it should be emphasized that conclusions cannot be drawn regarding thevalidity of the policy only by estimating q from Eq. (1). In order to do so, one has to isolate confounding factors which can bedone by using a difference-in-differences (DID) approach.5
The difference-in-differences method works in the following way. If only data from one state is used, say New York, then,as described in the paragraph above, it is impossible to isolate the causal effect of the ban from other changes that occurredexactly in the same period when the ban was imposed. Thus, let the equation of interest be (1) but now suppose data fromanother state is available, say Pennsylvania, where no ban was imposed in the same time period.6 For simplicity the countyfixed effect is dropped. Then,
4 Onechangedassumpmacroe
5 SeeImbens
6 The7 In t
controlthat cou
ycts ¼ bþ qLAWcts þ kt þus þ ects ð2Þ
where s denotes states and us is a state fixed effect. Let the year fixed effect, common to both states, capture specific changesthat occurred each year, and the state fixed effect capture changes that occurred at the level of the state. In this case,E[ects|t, s] = 0. Thus, the following is true:
E½yctsjt < 2002; s ¼ PA� � E½yctsjt P 2002; s ¼ PA� ¼X
t<2002
kt �X
tP2002
kt
E½yctsjt < 2002; s ¼ NY � � E½yctsjt P 2002; s ¼ NY � ¼X
t<2002
kt �X
tP2002
kt þ qð3Þ
Both equations represent the differences in the outcome before and after the law was imposed. The differences of the twodifferences given in Eq. (3) represent the population difference-in-differences and is given by
fE½yctsjt < 2002; s ¼ NY � � E½yctsjt P 2002; s ¼ NY �g � fE½yctsjt < 2002; s ¼ PA� � E½yctsjt P 2002; s ¼ PA�g
¼X
t<2002
kt �X
tP2002
kt þ q
!�
Xt<2002
kt �X
tP2002
kt � !
¼ q
which shows that the causal effect of interest can be identified.7 This can be formulated in a regression type model where thecausal effect can be estimated using fixed effects models:
ycts ¼ aþ cNYs þ /LAWt þ qðNYs � LAWtÞ þX2007
t¼1997
kt1T¼t þ ects ð4Þ
where NYs is a dummy variable that equals 1 if the county belongs to the state of New York and 0 otherwise, LAWt is a dum-my variable that equals 1 for the years following the enactment of the law, and 1T=t is an indicator variable that equals 1 foreach t e (1997, 2007). The estimated parameter of interest is the coefficient of the interaction term NYs � LAWt, q.
example would be the September 11. If one argues that after the September 11 drivers across the country started to drive more carefully or policeits behavior and increased enforcement, then the parameter estimated in biased due to covðLAWct ; �ickt; cÞ– 0. See Meyer (1995) for more on the
tions required for the use the one group before and after design. See also Meyer (1990). We do, however, rely on the assumption that anyconomic shock affected both states included in the analysis equally.the seminal work by Ashenfelter (1978) and Ashenfelter and Card (1985). For a more recent description of the difference-in-differences method seeand Wooldridge (2008) or Angrist and Pischke (2009).state of Pennsylvania, which was never exposed to the treatment, will work as a control group for the treated state, New York.
he works of Imbens and Wooldridge (2008) ‘‘[t]his double differencing removes biases in” period after law ‘‘comparisons between the treatment andgroup that could be the result from permanent differences between those groups, as well as biases from comparisons over time in the treatment groupld be the result of time trends unrelated to the treatment.”
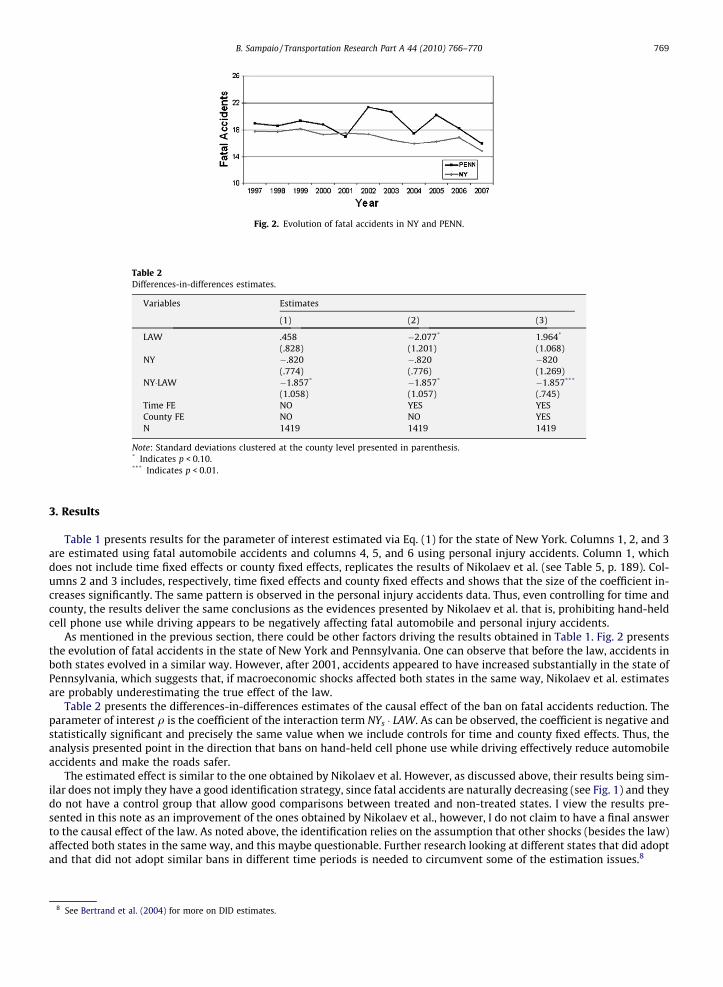
Fig. 2. Evolution of fatal accidents in NY and PENN.
Table 2Differences-in-differences estimates.
Variables Estimates
(1) (2) (3)
LAW .458 �2.077* 1.964*
(.828) (1.201) (1.068)NY �.820 �.820 �820
(.774) (.776) (1.269)NY�LAW �1.857* �1.857* �1.857***
(1.058) (1.057) (.745)Time FE NO YES YESCounty FE NO NO YESN 1419 1419 1419
Note: Standard deviations clustered at the county level presented in parenthesis.* Indicates p < 0.10.*** Indicates p < 0.01.
B. Sampaio / Transportation Research Part A 44 (2010) 766–770 769
3. Results
Table 1 presents results for the parameter of interest estimated via Eq. (1) for the state of New York. Columns 1, 2, and 3are estimated using fatal automobile accidents and columns 4, 5, and 6 using personal injury accidents. Column 1, whichdoes not include time fixed effects or county fixed effects, replicates the results of Nikolaev et al. (see Table 5, p. 189). Col-umns 2 and 3 includes, respectively, time fixed effects and county fixed effects and shows that the size of the coefficient in-creases significantly. The same pattern is observed in the personal injury accidents data. Thus, even controlling for time andcounty, the results deliver the same conclusions as the evidences presented by Nikolaev et al. that is, prohibiting hand-heldcell phone use while driving appears to be negatively affecting fatal automobile and personal injury accidents.
As mentioned in the previous section, there could be other factors driving the results obtained in Table 1. Fig. 2 presentsthe evolution of fatal accidents in the state of New York and Pennsylvania. One can observe that before the law, accidents inboth states evolved in a similar way. However, after 2001, accidents appeared to have increased substantially in the state ofPennsylvania, which suggests that, if macroeconomic shocks affected both states in the same way, Nikolaev et al. estimatesare probably underestimating the true effect of the law.
Table 2 presents the differences-in-differences estimates of the causal effect of the ban on fatal accidents reduction. Theparameter of interest q is the coefficient of the interaction term NYs � LAW. As can be observed, the coefficient is negative andstatistically significant and precisely the same value when we include controls for time and county fixed effects. Thus, theanalysis presented point in the direction that bans on hand-held cell phone use while driving effectively reduce automobileaccidents and make the roads safer.
The estimated effect is similar to the one obtained by Nikolaev et al. However, as discussed above, their results being sim-ilar does not imply they have a good identification strategy, since fatal accidents are naturally decreasing (see Fig. 1) and theydo not have a control group that allow good comparisons between treated and non-treated states. I view the results pre-sented in this note as an improvement of the ones obtained by Nikolaev et al., however, I do not claim to have a final answerto the causal effect of the law. As noted above, the identification relies on the assumption that other shocks (besides the law)affected both states in the same way, and this maybe questionable. Further research looking at different states that did adoptand that did not adopt similar bans in different time periods is needed to circumvent some of the estimation issues.8
8 See Bertrand et al. (2004) for more on DID estimates.
770 B. Sampaio / Transportation Research Part A 44 (2010) 766–770
4. Concluding remarks
In a recently published paper, Nikolaev et al. (2010) provide evidences on the effect of hand-held cell phone bans on driv-ing safety. Using data for the state of New York, they analyze the impact of a state-wide ban on hand-held cell phone usewhile driving and find that the ban had a significant negative impact on both the mean fatal accident rate and the mean per-sonal injury accident rate. In this paper I argue that the strategy they adopt do not allow them to conclude that their analysis‘‘[l]ooks very promising for providing useful information on the need for hand-held cell phone ban laws”. Indeed they high-light that their analysis has ‘‘several issues that limit the statistical validity” of their results and point that ‘‘more substantiveand conclusive analysis” need to be done in order to isolate confounding factors from the causal effect of the ban. In thistechnical note I try to address some of the shortcomings presented in their analysis and find that the ban appears to havea negative effect on the number of fatal automobile accidents in the state of New York. However, further research lookingat different states that did adopt and that did not adopt similar bans in different time periods is needed to arrive at moreconcluse results.
Acknowledgement
I thank the Editor, Leonardo Lucchetti, Monserrat Bustelo, and Yony Sampaio for providing very helpful comments on aearlier version of the paper.
References
Angrist, J.D., Pischke, J.-S., 2009. Mostly Harmless Econometrics: an Empiricist’s Companion. Princeton University Press. 373p.Ashenfelter, O., 1978. Estimating the effect of training programs on earnings. Review of Economics and Statistics 60, 47–57.Ashenfelter, O., Card, D., 1985. Using the longitudinal structure of earnings to estimate the effect of training programs. Review of Economics and Statistics
67, 648–660.Bertrand, M., Duflo, E., Mullainathan, S., 2004. How much should we trust differences-in-differences estimates? Quarterly Journal of Economics 119 (1),
249–275.Card, D., Krueger, A.B., 1994. Minimum wages and employment: a case study of the fast-food industry in New Jersey and Pennsylvania. The American
Economic Review 84 (4), 772–793.Duflo, S., 2001. Schooling and labor market consequences of school construction in Indonesia: evidence from an unusual policy experiment. The American
Economic Review 91 (4), 795–813.Imbens, G.M., Wooldridge, J.M., 2008. Recent Developments in the Econometrics of Program Evaluation. NBER Working Paper Series, Number 14251.
<http://www.nber.org/papers/w14251> (accessed 19.02.2010).Meyer, B.D., 1995. Natural and quasi-experiments in economics. Journal of Business and Economics Statistics 13 (2), 151–161.Meyer, B.D., 1990. Unemployment insurance and unemployment spells. Econometrica 58 (4), 757–782.New York State Department of Motor Vehicles, 2008a. Ticket and Crash Data Reports by County in 2001–2006. <http://www.nysgtsc.state.ny.us/
hsdata.htm> (accessed 18.03.2010).New York State Department of Motor Vehicles, 2008b. The Number of All New York States Vehicle Registrations Considered Active in 1997–2006. <http://
www.nydmv.state.ny.us/stats-arc.htm> (accessed 18.03.2010).New York State Department of Motor Vehicles, 2008c. Driver Licenses and Vehicle Registrations by County in 1997–2006. <http://www.nydmv.state.ny.us/
stats-arc.htm> (accessed 18.03.2010).Nikolaev, A.G., Robbins, J.M., Jacobson, S.H., 2010. Evaluating the impact of legislation prohibiting hand-held cell phone use while driving. Transportation
Research Part A: Policy and Practice 44, 182–193.Pennsylvania Crash Facts and Statistics Book, 1997–2007, 2010. <http://www.dot.state.pa.us/Internet/Bureaus/pdBHSTE.nsf/
BHSTEHomepage?OpenFrameset> (accessed 18.03.2010).


![ORDER PROHIBITING PUBLICATION EXCEPT IN REDACTED FORM … · ANZ Bank New Zealand Limited v Financial Markets Authority [2018] NZHC 691 [17 April 2018] ORDER PROHIBITING PUBLICATION](https://img.pdfslide.us/doc/110x75/5f0917c17e708231d425322d/order-prohibiting-publication-except-in-redacted-form-anz-bank-new-zealand-limited.jpg)