Embed Size (px)
Citation preview
COLLEGE OF ENGINEERING
DEPARTMENT OF CIVIL ENGINEERING (CVEG)
STEEL STRUCTURES RESEARCH LABORATORY (SSRL)
November, 2015
On the Fatigue Capacity of Headed Shear Studs in Composite Bridge Girders
Brianna Ovuoba Gary S. Prinz, Ph.D., P.E.
SSRL Project N° 0392-16028-22-0000
SSRL Report N° 2015-1
Final report submitted to W&W | AFCO Steel


COLLEGE OF ENGINEERING
DEPARTMENT OF CIVIL ENGINEERING (CVEG)
STEEL STRUCTURES RESEARCH LABORATORY (SSRL)
University of Arkansas Department of Civil Engineering 4190 Bell Engineering Center Fayetteville, AR 72701
Telephone : Fax : E-mail : Website :
+ 1 (479) 575-2494 + 1 (479) 575-7168 [email protected] www.ssrl-uark.com
V/ref : Fayetteville, AR, November 2015 N/ref : CVEG Report SSRL No 2015-1
On the Fatigue Capacity of Headed Shear Studs in Composite Bridge Girders
Mandate: W&W | AFCO Steel Mandate Description: Experimental and analytical investigation into the fatigue
capacity of headed shear studs, with a focus on evaluating the location of the CAFL.
Date of Mandate: December, 2015
Specimens: 6 composite push-out specimens were tested.
Reception of the Specimens: December, 2014
Testing Dates: January 2015 – November 2015
Project PI: G.S. Prinz
Collaborators: B. Ovuoba, C. Dang, W.M. Hale
Report Authors: B. Ovuoba and G.S. Prinz
SSRL Director: G.S. Prinz
Signatures : Project PI
Gary S. Prinz, PhD, PE
This report contains 54 pages (13 pages of front matter) This report may not be reproduced in whole or in part without written authorization from the SSRL director

B. Ovuoba and G.S. Prinz
SSRL – 0392-16028-22-0000 SSRL, November 2015
ii
i On the Fatigue Capacity of Headed Shear Studs in Composite Bridge Girders
SSRL – 0392-16028-22-0000 SSRL, November 2015
ACKNOWLEDGEMENTS
This report presents the results of a research project sponsored by W&W|AFCO Steel. We acknowledge the financial and material support provided by W&W|AFCO Steel as well as the assistance and encouragement of the project lead, Mr. Grady Harvell. Expert advice provided throughout the project by Professor W. Micah Hale and Mr. Dennis Noernberg is also recognized. The research was conducted in the Steel Structures Research Laboratory (SSRL) at the University of Arkansas. Laboratory staff and graduate students instrumental in the completion of this work include: David Peachee, Ryan Hagedorn, Richard Deschenes, and Canh Dang. Although many individuals contributed to the research findings presented herein, the authors accept full responsibility for the conclusions presented.

B. Ovuoba and G.S. Prinz
SSRL – 0392-16028-22-0000 SSRL, November 2015
ii
iii On the Fatigue Capacity of Headed Shear Studs in Composite Bridge Girders
SSRL – 0392-16028-22-0000 SSRL, November 2015
TABLE OF CONTENTS
FRONT MATTER
Acknowledgements ....................................................................................................... i List of Figures .............................................................................................................. v List of Tables ............................................................................................................. vii Notation ....................................................................................................................... ix Report Summary ........................................................................................................ xi
FATIGUE TESTING REPORT
1. Introduction ............................................................................................................. 1 1.1. Background ................................................................................................... 1 1.2. Report Overview ........................................................................................... 2
2. Experimental Program ........................................................................................... 3 2.1. Test Specimen Geometry and Fabrication .................................................... 3 2.2. Test Configuration, Instrumentation, and Loading ....................................... 4
3. Experimental Results .............................................................................................. 5 3.1. Observations and Measured Fatigue Life ..................................................... 5 3.2. Stud Fatigue-Crack Investigations ................................................................ 7
4. Probabilistic Approach to Shear Stud Fatigue Capacity Evaluation ................ 8 4.1. Overview of MLE ......................................................................................... 8 4.2. Influence of Run-Outs on CAFL ................................................................. 10 4.3. Shear Stud Fatigue Dataset and Analysis using MLE................................. 10
5. Proposed Design S-N Curve for Predicting Shear Stud Fatigue Capacity ...... 11 6. Effect of New Shear Stud Fatigue-Life Equation on Composite
Bridge Design ........................................................................................................ 13 6.1. Prototype Bridge Geometries & Considered Traffic Levels ....................... 13 6.2. Design Approach ......................................................................................... 13
6.2.1. Brief Background on Determining the Required Stud Pitch for Fatigue .............................................................................. 13
6.2.2. Background on Determining the Required Stud Pitch for Strength ............................................................................................ 14
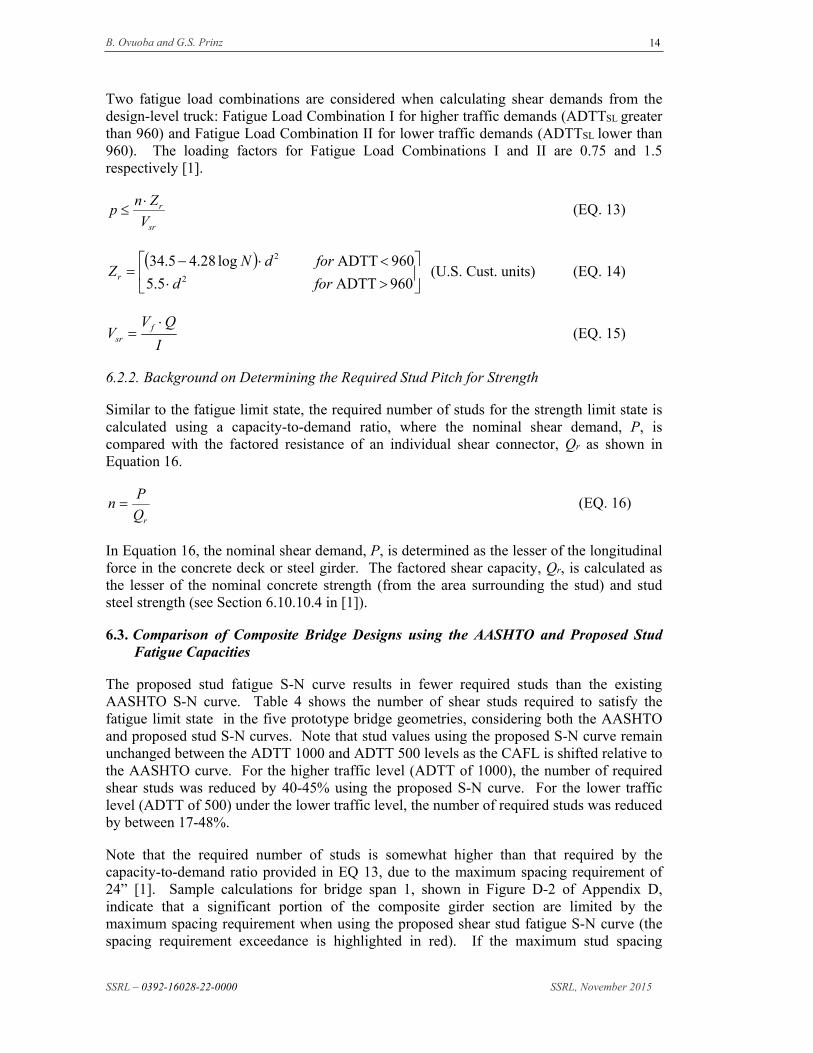
6.3. Comparison of Composite Bridge Designs using the AASHTO and Proposed Stud Fatigue Capacities ................................................................ 14
7. Summary and Conclusions .................................................................................. 15 8. References .............................................................................................................. 16 Appendix A. Shear Stud Fatigue Dataset ............................................................... 19 Appendix B. Material Test Data .............................................................................. 23 Appendix C. Verification of Negligible Inertial Effects under High
Frequency Loading ............................................................................. 25 Appendix D. Stud Design Example Calculations for Prototype Bridges ............. 27 Appendix E. Additional Slip and Separation Measurements ............................... 41
B. Ovuoba and G.S. Prinz
SSRL – 0392-16028-22-0000 SSRL, November 2015
iv
v On the Fatigue Capacity of Headed Shear Studs in Composite Bridge Girders
SSRL – 0392-16028-22-0000 SSRL, November 2015
LIST OF FIGURES
Figure 1. (a) Shear stud mechanism for load transfer across the steel-concrete interface, and (b) shop installed shear studs on a plate girder................................................. 1
Figure 2. Comparison of S-N curves for shear stud fatigue capacity between the AASHTO and Eurocode standards ......................................................................... 2
Figure 3. Push-out specimen geometry and slab rebar locations (all dimensions provided in mm) [7]. ............................................................................................... 3
Figure 4. Casting of concrete slabs on double sided push-out specimens .............................. 4
Figure 5. (a) Experimental setup and (b) specimen instrumentation ...................................... 5
Figure 6. Shear stud failure mode observations for Specimen 1 (failure observed after 12,803,000 cycles at an applied stress range per stud of 60MPa) .................. 6
Figure 7. Average slip versus number of applied cycles for Specimens 1 and 5. ................... 7
Figure 8. Fatigue crack investigation of polished stud sections from (a) Specimen 2 and (b) Specimen 5 .................................................................................................. 8
Figure 9. Fatigue-life curve representation through MLE fitting ............................................ 9
Figure 10. Comparison of AASHTO S-N curve and MLE regression (data in red represent fatigue test results presented in Section 3) ............................................ 11
Figure 11. (a) Comparison of proposed design S-N curve, MLE regression, fatigue data, and current AASHTO curve. (b) Comparison of proposed design S-N curve and existing AASHTO fatigue details. ........................................................ 12
Appendix Figures:
Figure A-1. Common (type A, B, and C) fatigue fractures within shear stud connectors
Figure B-1. Concrete testing machine and cylinder dimensions
Figure C-1. Comparison of slab slip measurements for Specimen 5 during high frequency dynamic loading. Comparisons presented represent (a) 1Hz and 10Hz loading rates, and (b) 1Hz and 20Hz loading rates
Figure D-1. Fatigue Limit State under finite loading for the bridge located in Jackson, Arkansas on US 67 Northbound at the intersection of State Highway 161.
Figure D-2. Fatigue Limit State under infinite loading for bridge located in Jackson, Arkansas on US 67 Northbound at the intersection of State Highway 161.
Figure D-3. Fatigue Limit State under finite loading for bridge located at the intersection of Interstate 540 and the UN PAC Railroad near Van Buren, Arkansas.
Figure D-4. Fatigue Limit State under infinite loading for bridge located at the intersection of Interstate 540 and the UN PAC Railroad near Van Buren, Arkansas.
Figure D-5. Fatigue Limit State under finite loading for bridge located in Sandy Springs, Oklahoma on US 64 at the intersection of S97th W Ave. Two different spans from this bridge are used in these design examples.
B. Ovuoba and G.S. Prinz
SSRL – 0392-16028-22-0000 SSRL, November 2015
vi
Figure D-6. Fatigue Limit State under infinite loading for bridge located in Sandy Springs, Oklahoma on US 64 at the intersection of S97th W Ave. Two different spans from this bridge are used in these design examples.
Figure D-7. Fatigue Limit State under finite loading for bridge located in Sandy Springs, Oklahoma on US 64 at the intersection of S97th W Ave. Two different spans from this bridge are used in these design examples.
Figure D-8. Fatigue Limit State under infinite loading for bridge located in Sandy Springs, Oklahoma on US 64 at the intersection of S97th W Ave. Two different spans from this bridge are used in these design examples.
Figure D-9. Fatigue Limit State under finite loading for bridge located at the intersection of Interstate-540 and Flat Rock Creek near Van Buren, Arkansas.
Figure D-10. Fatigue Limit State under infinite loading for bridge located at the intersection of Interstate-540 and Flat Rock Creek near Van Buren, Arkansas.
Figure D-11. Strength Limit State for the bridge located in Jackson, Arkansas on US 67 Northbound at the intersection of State Highway 161.
Figure D-12. Fatigue Limit State under finite loading for bridge located at the intersection of Interstate 540 and the UN PAC Railroad near Van Buren, Arkansas.
Figure D-13. Strength Limit State for the bridge located in Sandy Springs, Oklahoma on US 64 at the intersection of S97th W Ave. Two different spans from this bridge are used in these design examples.
Figure D-14. Strength Limit State for the bridge located in Sandy Springs, Oklahoma on US 64 at the intersection of S97th W Ave. Two different spans from this bridge are used in these design examples.
Figure D-15. Strength Limit State for the bridge located at the intersection of Interstate-540 and Flat Rock Creek near Van Buren, Arkansas.
Figure E-1. (a) Slip and (b) separation data from external LVDT measurements
vii On the Fatigue Capacity of Headed Shear Studs in Composite Bridge Girders
SSRL – 0392-16028-22-0000 SSRL, November 2015
LIST OF TABLES
Table 1. Specimen Testing Matrix and Fatigue Results .......................................................... 5
Table 2: Proposed detail category description for shear stud fatigue capacity ...................... 12
Table 3. Considered Bridge Geometries ................................................................................ 13
Table 4 Required number of studs for the AASHTO fatigue capacity, proposed fatigue capacity, and strength limit state. ................................................................. 15
Appendix Tables:
Table A-1: Fatigue dataset for 3/4" diameter shear studs
Table A-2: Fatigue dataset for 7/8" diameter shear studs
Table B-1: Concrete compression test data for push-out specimen slabs

B. Ovuoba and G.S. Prinz
SSRL – 0392-16028-22-0000 SSRL, November 2015
viii

ix On the Fatigue Capacity of Headed Shear Studs in Composite Bridge Girders
SSRL – 0392-16028-22-0000 SSRL, November 2015
NOTATION
The following terms are used in the text of this report: (ΔF)n = design load-induced fatigue resistance; (ΔF)TH = the constant amplitude fatigue limit; A = constant representing the intercept of the fatigue S-N curve; ADTTSL = single-lane average daily truck traffic (trucks); BM = base metal; CAFL = constant amplitude fatigue limit; CDFNi,Si|γ’ = cumulative density function assuming γ’; d = diameter of shear stud; f’c = concrete compressive strength; fNi = probability of predicting failure at an individual data point; fNi|γ’ = probability of having failure at each given data point; FZ = weld fusion zone; fγ’ = probability that γ’ exists; HAZ = weld heat affected zone; I = moment of inertia of the short-term composite section; L = joint probability or likelihood; LVDT = linear variable differential transducers; m = constant representing the slope of the fatigue S-N curve; MLE = maximum likelihood estimation; N = number of cycles; n = number of shear studs across the flange width; n = required number of studs for the strength limit state; Nf = number of cycles to failure; nf = total number of failure points; nr = total number of run-out points; p = pitch (or spacing) of the row of shear studs along the length of the steel beam; P = total nominal shear force; PDFNi,Si|γ’ = probability density function of failure at each given point; PDFNi,i = probability density function at fatigue test data point (Ni,i); PDFNi = marginal probability density function; Q = first moment of the transformed short-term area of the concrete deck about
the neutral axis of the short-term composite section; Qr = factored shear resistance of one shear connector; RNi = probability of run-out; RNi|γ’ = probability of predicting run-out; S = applied stress range; Vf = vertical shear force range under the applicable fatigue loads; Vsr = applied shear demand at the steel-concrete interface; z* = number of standard deviations shifted from the mean; Zr = fatigue shear resistance of an individual shear stud; maximum likelihood fatigue-life curve parameter (power law constant); = maximum likelihood fatigue-life curve parameter (power law constant); Δσ = applied stress range; γ’ = assumed constant amplitude fatigue limit;

B. Ovuoba and G.S. Prinz
SSRL – 0392-16028-22-0000 SSRL, November 2015
x
xi On the Fatigue Capacity of Headed Shear Studs in Composite Bridge Girders
SSRL – 0392-16028-22-0000 SSRL, November 2015
REPORT SUMMARY
Shear connectors are commonly used in steel bridges to join the concrete deck and steel superstructure, providing a mechanism for shear transfer across the steel-concrete interface. The most common type of shear connector is the headed shear stud. In the current AASHTO LRFD bridge specifications on composite design, shear stud fatigue often governs over static strength, and a large number of shear connectors often result. The stud fatigue capacities presented in the AASHTO standard are largely based on a limited sample of composite fatigue tests performed in the 1960s, with limited fatigue test data at lower stress ranges leading to a somewhat arbitrary constant amplitude fatigue limit (CAFL). The somewhat arbitrary CAFL often governs the composite design for bridges with moderate-to-high traffic demands. This report presents results from an experimental and analytical study into the fatigue behavior of headed shear studs, to address the lack of existing experimental data near the assumed CAFL, and to better characterize the effects of fatigue uncertainty on predicted response. Results from composite push-out specimens tested at stress ranges near the existing AASHTO CAFL suggest an increase of the CAFL to 6.5ksi. Recommendations for modification to the existing AASHTO shear stud S-N fatigue capacity curve are proposed.
xii On the Fatigue Capacity of Headed Shear Studs in Composite Bridge Girders
SSRL – 0392-16028-22-0000 SSRL, November 2015
1 On the Fatigue Capacity of Headed Shear Studs in Composite Bridge Girders
SSRL – 0392-16028-22-0000 SSRL, November 2015
FATIGUE TESTING REPORT
1. Introduction
1.1. Background
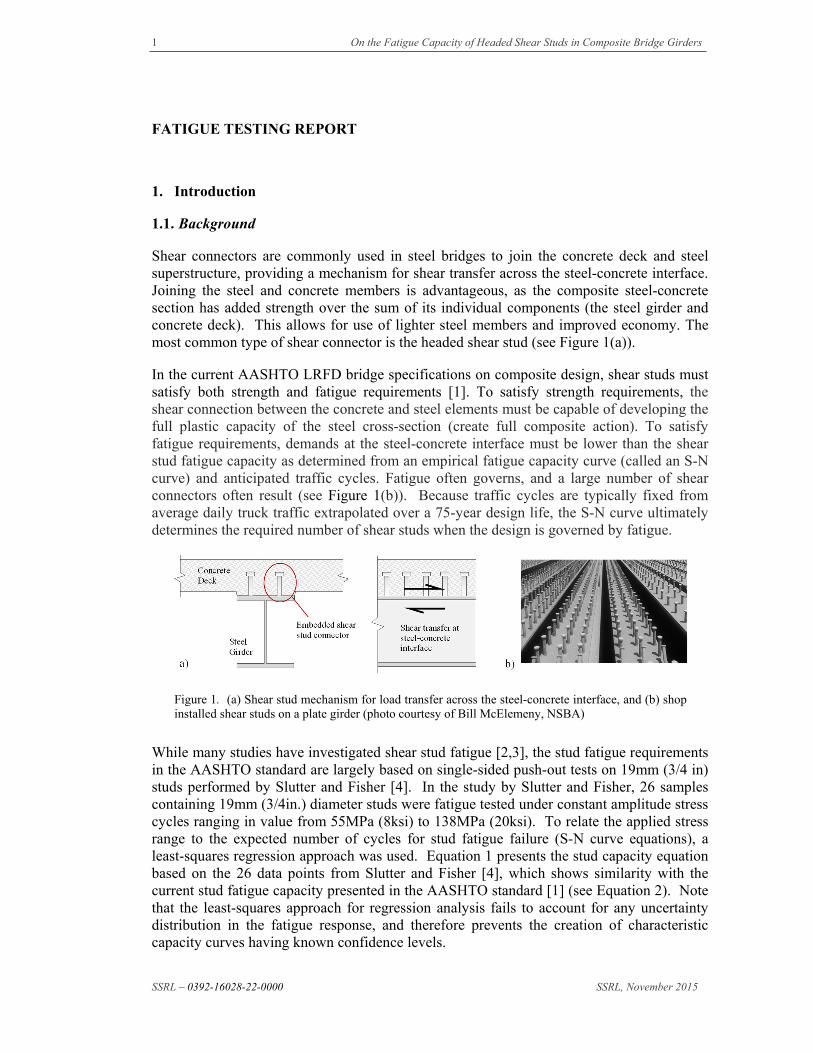
Shear connectors are commonly used in steel bridges to join the concrete deck and steel superstructure, providing a mechanism for shear transfer across the steel-concrete interface. Joining the steel and concrete members is advantageous, as the composite steel-concrete section has added strength over the sum of its individual components (the steel girder and concrete deck). This allows for use of lighter steel members and improved economy. The most common type of shear connector is the headed shear stud (see Figure 1(a)).
In the current AASHTO LRFD bridge specifications on composite design, shear studs must satisfy both strength and fatigue requirements [1]. To satisfy strength requirements, the shear connection between the concrete and steel elements must be capable of developing the full plastic capacity of the steel cross-section (create full composite action). To satisfy fatigue requirements, demands at the steel-concrete interface must be lower than the shear stud fatigue capacity as determined from an empirical fatigue capacity curve (called an S-N curve) and anticipated traffic cycles. Fatigue often governs, and a large number of shear connectors often result (see Figure 1(b)). Because traffic cycles are typically fixed from average daily truck traffic extrapolated over a 75-year design life, the S-N curve ultimately determines the required number of shear studs when the design is governed by fatigue.
Figure 1. (a) Shear stud mechanism for load transfer across the steel-concrete interface, and (b) shop installed shear studs on a plate girder (photo courtesy of Bill McElemeny, NSBA)
While many studies have investigated shear stud fatigue [2,3], the stud fatigue requirements in the AASHTO standard are largely based on single-sided push-out tests on 19mm (3/4 in) studs performed by Slutter and Fisher [4]. In the study by Slutter and Fisher, 26 samples containing 19mm (3/4in.) diameter studs were fatigue tested under constant amplitude stress cycles ranging in value from 55MPa (8ksi) to 138MPa (20ksi). To relate the applied stress range to the expected number of cycles for stud fatigue failure (S-N curve equations), a least-squares regression approach was used. Equation 1 presents the stud capacity equation based on the 26 data points from Slutter and Fisher [4], which shows similarity with the current stud fatigue capacity presented in the AASHTO standard [1] (see Equation 2). Note that the least-squares approach for regression analysis fails to account for any uncertainty distribution in the fatigue response, and therefore prevents the creation of characteristic capacity curves having known confidence levels.
B. Ovuoba and G.S. Prinz
SSRL – 0392-16028-22-0000 SSRL, November 2015
2
1753.0072.8)log( N (Eq. 1) Slutter and Fisher [4]
1834.0061.8)log( N (Eq. 2) AASHTO [1]
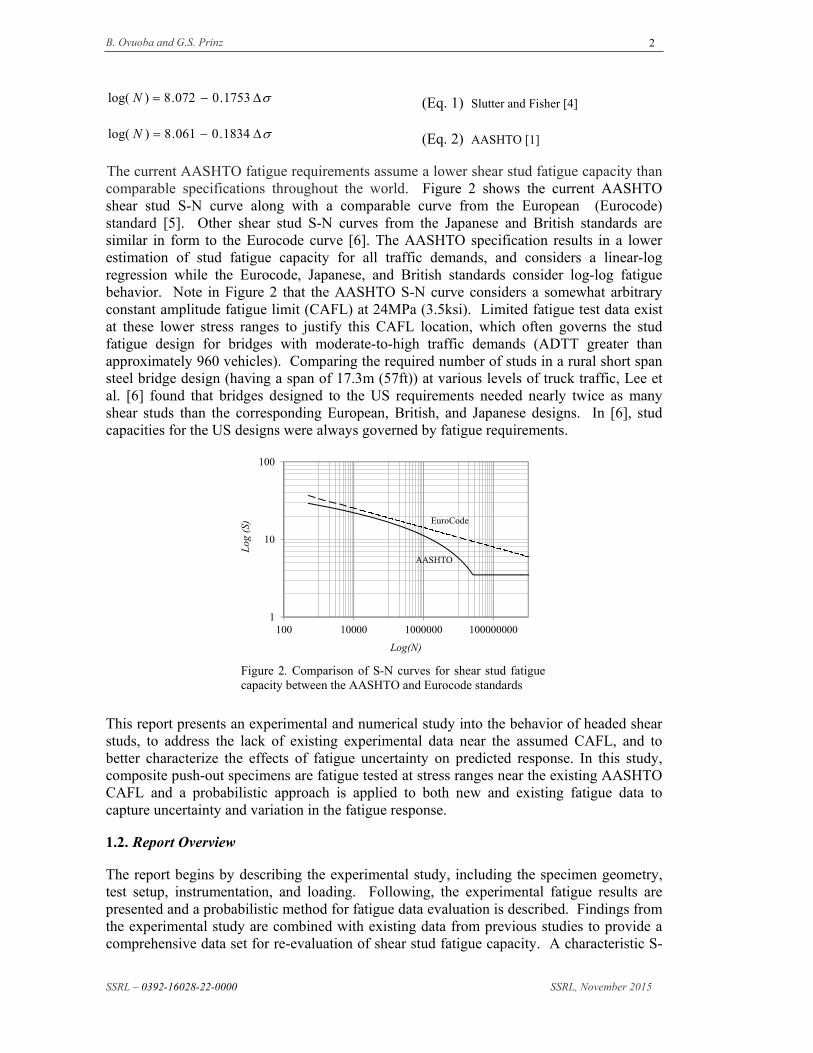
The current AASHTO fatigue requirements assume a lower shear stud fatigue capacity than comparable specifications throughout the world. Figure 2 shows the current AASHTO shear stud S-N curve along with a comparable curve from the European (Eurocode) standard [5]. Other shear stud S-N curves from the Japanese and British standards are similar in form to the Eurocode curve [6]. The AASHTO specification results in a lower estimation of stud fatigue capacity for all traffic demands, and considers a linear-log regression while the Eurocode, Japanese, and British standards consider log-log fatigue behavior. Note in Figure 2 that the AASHTO S-N curve considers a somewhat arbitrary constant amplitude fatigue limit (CAFL) at 24MPa (3.5ksi). Limited fatigue test data exist at these lower stress ranges to justify this CAFL location, which often governs the stud fatigue design for bridges with moderate-to-high traffic demands (ADTT greater than approximately 960 vehicles). Comparing the required number of studs in a rural short span steel bridge design (having a span of 17.3m (57ft)) at various levels of truck traffic, Lee et al. [6] found that bridges designed to the US requirements needed nearly twice as many shear studs than the corresponding European, British, and Japanese designs. In [6], stud capacities for the US designs were always governed by fatigue requirements.
Figure 2. Comparison of S-N curves for shear stud fatigue capacity between the AASHTO and Eurocode standards
This report presents an experimental and numerical study into the behavior of headed shear studs, to address the lack of existing experimental data near the assumed CAFL, and to better characterize the effects of fatigue uncertainty on predicted response. In this study, composite push-out specimens are fatigue tested at stress ranges near the existing AASHTO CAFL and a probabilistic approach is applied to both new and existing fatigue data to capture uncertainty and variation in the fatigue response.
1.2. Report Overview
The report begins by describing the experimental study, including the specimen geometry, test setup, instrumentation, and loading. Following, the experimental fatigue results are presented and a probabilistic method for fatigue data evaluation is described. Findings from the experimental study are combined with existing data from previous studies to provide a comprehensive data set for re-evaluation of shear stud fatigue capacity. A characteristic S-
1
10
100
100 10000 1000000 100000000
Log
(S)
Log(N)
AASHTO
EuroCode
3 On the Fatigue Capacity of Headed Shear Studs in Composite Bridge Girders
SSRL – 0392-16028-22-0000 SSRL, November 2015
N curve for estimating shear stud fatigue capacity is proposed and applied to five prototype bridge designs to provide comparison.
2. Experimental Program
The primary objectives of the experimental program are to 1) characterize stud fatigue capacity at low applied stress ranges, 2) re-evaluate the existing CAFL considering both run-out and failure test results, and 3) investigate stud crack formation during low-stress high-cycle fatigue loading.
2.1. Test Specimen Geometry and Fabrication
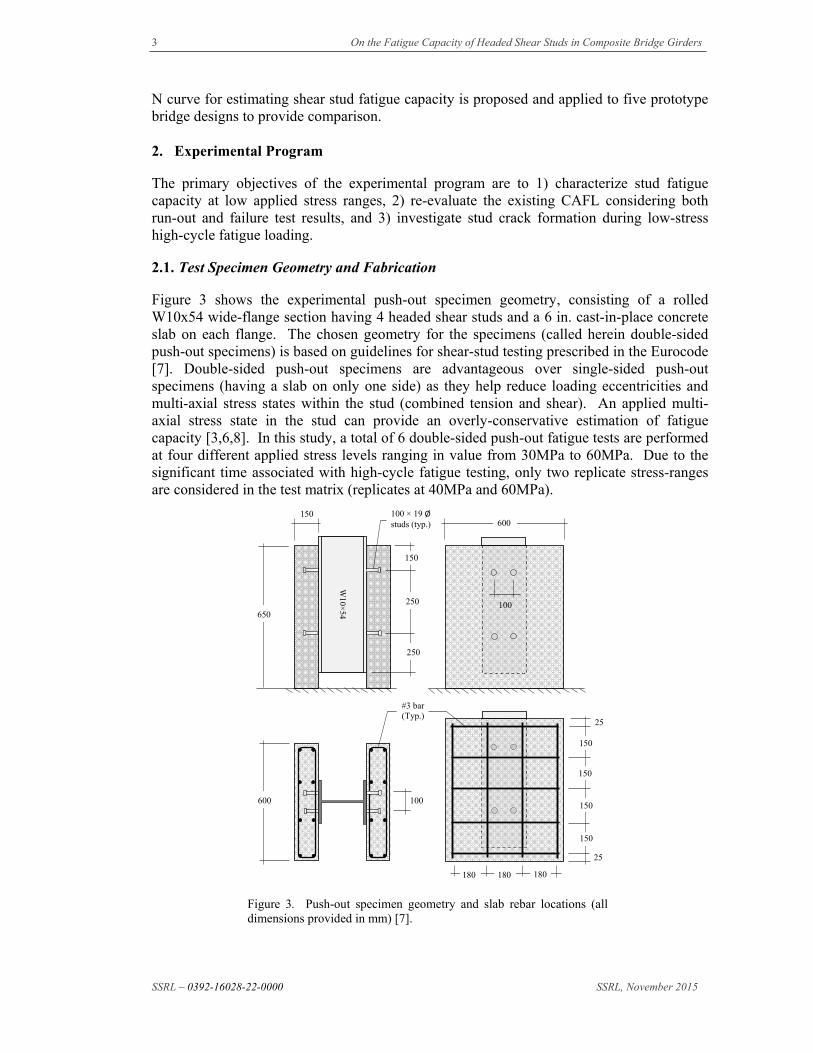
Figure 3 shows the experimental push-out specimen geometry, consisting of a rolled W10x54 wide-flange section having 4 headed shear studs and a 6 in. cast-in-place concrete slab on each flange. The chosen geometry for the specimens (called herein double-sided push-out specimens) is based on guidelines for shear-stud testing prescribed in the Eurocode [7]. Double-sided push-out specimens are advantageous over single-sided push-out specimens (having a slab on only one side) as they help reduce loading eccentricities and multi-axial stress states within the stud (combined tension and shear). An applied multi-axial stress state in the stud can provide an overly-conservative estimation of fatigue capacity [3,6,8]. In this study, a total of 6 double-sided push-out fatigue tests are performed at four different applied stress levels ranging in value from 30MPa to 60MPa. Due to the significant time associated with high-cycle fatigue testing, only two replicate stress-ranges are considered in the test matrix (replicates at 40MPa and 60MPa).
Figure 3. Push-out specimen geometry and slab rebar locations (all dimensions provided in mm) [7].
W10×
54
150
650
250
250
150
600
100
100 × 19 Østuds (typ.)
150
150
150
150
180 180 180
25
25
600 100
#3 bar (Typ.)
B. Ovuoba and G.S. Prinz
SSRL – 0392-16028-22-0000 SSRL, November 2015
4
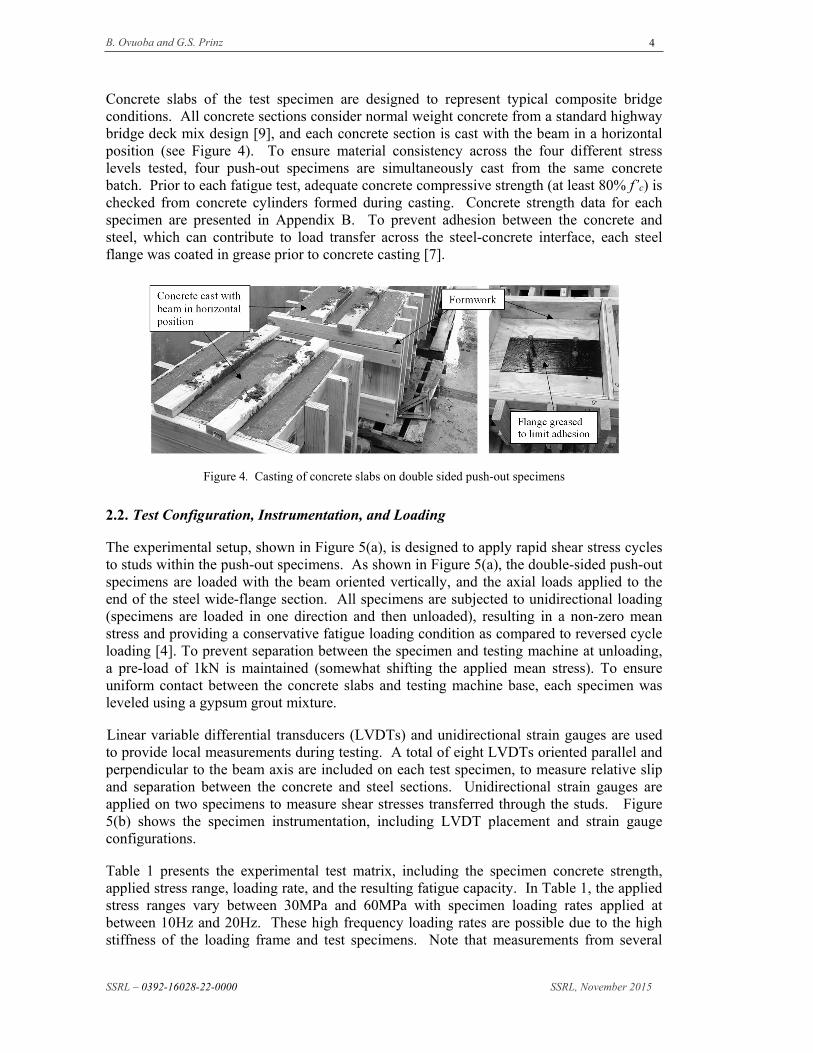
Concrete slabs of the test specimen are designed to represent typical composite bridge conditions. All concrete sections consider normal weight concrete from a standard highway bridge deck mix design [9], and each concrete section is cast with the beam in a horizontal position (see Figure 4). To ensure material consistency across the four different stress levels tested, four push-out specimens are simultaneously cast from the same concrete batch. Prior to each fatigue test, adequate concrete compressive strength (at least 80% f’c) is checked from concrete cylinders formed during casting. Concrete strength data for each specimen are presented in Appendix B. To prevent adhesion between the concrete and steel, which can contribute to load transfer across the steel-concrete interface, each steel flange was coated in grease prior to concrete casting [7].
Figure 4. Casting of concrete slabs on double sided push-out specimens
2.2. Test Configuration, Instrumentation, and Loading
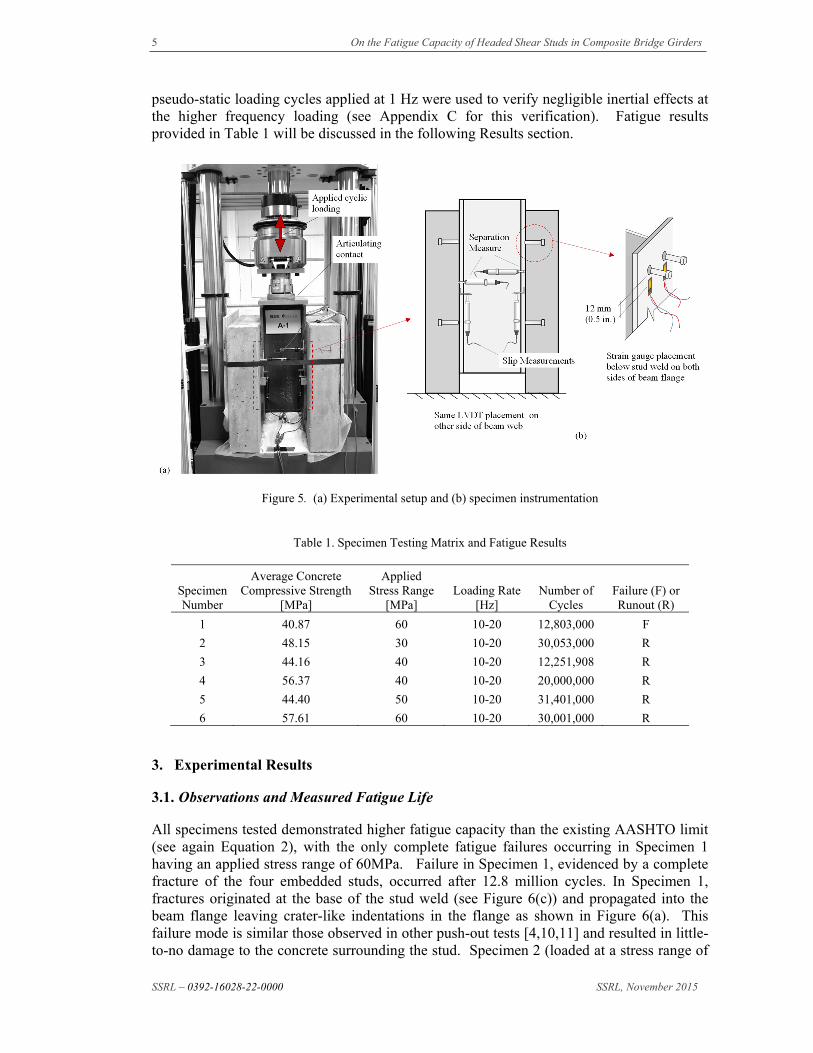
The experimental setup, shown in Figure 5(a), is designed to apply rapid shear stress cycles to studs within the push-out specimens. As shown in Figure 5(a), the double-sided push-out specimens are loaded with the beam oriented vertically, and the axial loads applied to the end of the steel wide-flange section. All specimens are subjected to unidirectional loading (specimens are loaded in one direction and then unloaded), resulting in a non-zero mean stress and providing a conservative fatigue loading condition as compared to reversed cycle loading [4]. To prevent separation between the specimen and testing machine at unloading, a pre-load of 1kN is maintained (somewhat shifting the applied mean stress). To ensure uniform contact between the concrete slabs and testing machine base, each specimen was leveled using a gypsum grout mixture.
Linear variable differential transducers (LVDTs) and unidirectional strain gauges are used to provide local measurements during testing. A total of eight LVDTs oriented parallel and perpendicular to the beam axis are included on each test specimen, to measure relative slip and separation between the concrete and steel sections. Unidirectional strain gauges are applied on two specimens to measure shear stresses transferred through the studs. Figure 5(b) shows the specimen instrumentation, including LVDT placement and strain gauge configurations.
Table 1 presents the experimental test matrix, including the specimen concrete strength, applied stress range, loading rate, and the resulting fatigue capacity. In Table 1, the applied stress ranges vary between 30MPa and 60MPa with specimen loading rates applied at between 10Hz and 20Hz. These high frequency loading rates are possible due to the high stiffness of the loading frame and test specimens. Note that measurements from several
5 On the Fatigue Capacity of Headed Shear Studs in Composite Bridge Girders
SSRL – 0392-16028-22-0000 SSRL, November 2015
pseudo-static loading cycles applied at 1 Hz were used to verify negligible inertial effects at the higher frequency loading (see Appendix C for this verification). Fatigue results provided in Table 1 will be discussed in the following Results section.
Figure 5. (a) Experimental setup and (b) specimen instrumentation
Table 1. Specimen Testing Matrix and Fatigue Results
Specimen Number
Average Concrete Compressive Strength
[MPa]
Applied Stress Range
[MPa] Loading Rate
[Hz] Number of
Cycles Failure (F) or Runout (R)
1 40.87 60 10-20 12,803,000 F
2 48.15 30 10-20 30,053,000 R
3 44.16 40 10-20 12,251,908 R
4 56.37 40 10-20 20,000,000 R
5 44.40 50 10-20 31,401,000 R
6 57.61 60 10-20 30,001,000 R
3. Experimental Results
3.1. Observations and Measured Fatigue Life
All specimens tested demonstrated higher fatigue capacity than the existing AASHTO limit (see again Equation 2), with the only complete fatigue failures occurring in Specimen 1 having an applied stress range of 60MPa. Failure in Specimen 1, evidenced by a complete fracture of the four embedded studs, occurred after 12.8 million cycles. In Specimen 1, fractures originated at the base of the stud weld (see Figure 6(c)) and propagated into the beam flange leaving crater-like indentations in the flange as shown in Figure 6(a). This failure mode is similar those observed in other push-out tests [4,10,11] and resulted in little-to-no damage to the concrete surrounding the stud. Specimen 2 (loaded at a stress range of

B. Ovuoba and G.S. Prinz
SSRL – 0392-16028-22-0000 SSRL, November 2015
6
30 MPa) and Specimen 5 (loaded at a stress range of 50 MPa) survived more than 30 million cycles prior to being declared runouts. Specimens 3 and 4 loaded at 40 MPa were also declared runouts after 12.25 million and 20 million cycles respectively. The resulting fatigue capacities for all eight double-sided push-out specimens are provided in Table 1.
Slip between the concrete slab and steel beam was observed for all test specimens; however, for specimens loaded at stress ranges at or below 50MPa this slip was minor over then entire cycle history. Figure 7 shows the average slip for each slab of specimens 5 and 1 (loaded at 50MPa and 60MPa respectively). Slip measurements for other specimens having lower applied stress ranges were similar to Specimen 5, and are presented in the Appendix. The slip values presented in Figure 7 are computed by averaging the two LVDTs on each beam flange, providing a single slip value for each slab. In Figure 7 a noticeable slip in slab 1 of Specimen 1 occurs near 3 million cycles, followed by an increase in the slip-per-cycle rate up to failure of the studs at 12.8 million cycles. Slip between the concrete slab and steel beam is an indication of stiffness loss and possible stud damage. Specimen 5, subjected to a lower applied stress range, experienced minimal slip (suggesting little stud damage) over the entire 30 million cycle loading. While slip measurements are helpful in estimating damage within the embedded studs over time, more detailed investigations are required to determine whether fatigue cracks actually exist.
Figure 6. Shear stud failure mode observations for Specimen 1 (failure observed after 12,803,000 cycles at an applied stress range per stud of 60MPa)

7 On the Fatigue Capacity of Headed Shear Studs in Composite Bridge Girders
SSRL – 0392-16028-22-0000 SSRL, November 2015
Figure 7. Average slip versus number of applied cycles for Specimens 1 and 5.
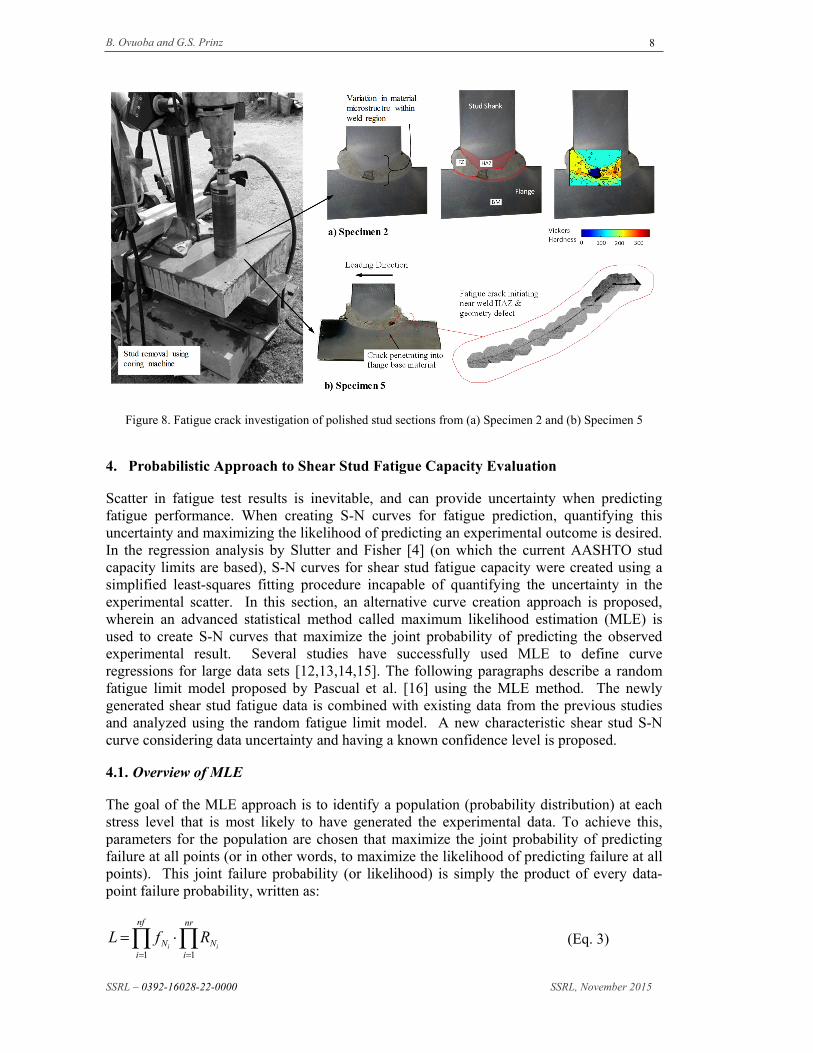
3.2. Stud Fatigue-Crack Investigations
Metallographic investigation and micro-hardness testing of stud cross-sections cored from completed tests indicate fatigue crack initiations within runout specimens and a critical fracture location near the stud-to-flange weld heat affected zone (HAZ). Stud samples cored from runout Specimens 2 and 5, were sectioned, polished with abrasive paper and diamond powder of increasing fineness (mirror polished to a surface roughness of 1m), and then surface etched with a Nitol solution (5ml HNO3 per 100ml of ethanol). Figure 8 shows the polished stud cross-sections taken from the specimens with the various weld features highlighted, including the weld HAZ, base metals (BM), and fusion zone (FZ). Vickers micro-hardness measurements (shown as contours in Figure 8) highlight material property changes (potential changes in material toughness) within the welded stud-to-flange zone and confirm the location of the HAZ, FZ, and BM. Stud sections taken from Specimen 2 (declared a runout after more than 30 million cycles at 30MPa) show no indication of fatigue crack initiation (see Figure 8(a)); however, samples taken from Specimen 5 (declared a runout after more than 30 million cycles at 50MPa) indicate fatigue cracks initiating near the weld HAZ at the stud-to-flange interface (see Figure 8(b)). The initiated fracture observed in Specimen 5 closely resembles the fracture path shown in Figure 6(c) for failure Specimen 1. These initiated fatigue cracks were present in all studs cored from Specimen 5.
0
0.05
0.1
0.15
0.2
0.25
0.3
0.35
0.4
100000 1000000 10000000
Ave
rage
Slip
[m
m]
Cycles
Failure at 12.8×10⁶
cycles
0
0.05
0.1
0.15
0.2
0.25
0.3
0.35
0.4
100000 1000000 10000000
Ave
rage
Slip
[m
m]
Cycles
Slab 1 Slab 2
Specimen 5 (= 50MPa)
Specimen 1 (= 60MPa)
1 2
B. Ovuoba and G.S. Prinz
SSRL – 0392-16028-22-0000 SSRL, November 2015
8
Figure 8. Fatigue crack investigation of polished stud sections from (a) Specimen 2 and (b) Specimen 5
4. Probabilistic Approach to Shear Stud Fatigue Capacity Evaluation
Scatter in fatigue test results is inevitable, and can provide uncertainty when predicting fatigue performance. When creating S-N curves for fatigue prediction, quantifying this uncertainty and maximizing the likelihood of predicting an experimental outcome is desired. In the regression analysis by Slutter and Fisher [4] (on which the current AASHTO stud capacity limits are based), S-N curves for shear stud fatigue capacity were created using a simplified least-squares fitting procedure incapable of quantifying the uncertainty in the experimental scatter. In this section, an alternative curve creation approach is proposed, wherein an advanced statistical method called maximum likelihood estimation (MLE) is used to create S-N curves that maximize the joint probability of predicting the observed experimental result. Several studies have successfully used MLE to define curve regressions for large data sets [12,13,14,15]. The following paragraphs describe a random fatigue limit model proposed by Pascual et al. [16] using the MLE method. The newly generated shear stud fatigue data is combined with existing data from the previous studies and analyzed using the random fatigue limit model. A new characteristic shear stud S-N curve considering data uncertainty and having a known confidence level is proposed.
4.1. Overview of MLE
The goal of the MLE approach is to identify a population (probability distribution) at each stress level that is most likely to have generated the experimental data. To achieve this, parameters for the population are chosen that maximize the joint probability of predicting failure at all points (or in other words, to maximize the likelihood of predicting failure at all points). This joint failure probability (or likelihood) is simply the product of every data-point failure probability, written as:
nr
iN
nf
iN ii
RfL11
(Eq. 3)
9 On the Fatigue Capacity of Headed Shear Studs in Composite Bridge Girders
SSRL – 0392-16028-22-0000 SSRL, November 2015
where, L, fNi, RNi, nf and nr are the likelihood, probability of predicting failure at an individual data point (i), the probability of predicting run-out at an individual data point (i), the total number of failure data-points, and the total number of run-out points respectively.
In this study, a nonlinear generalized reduced gradient optimization algorithm is used to maximize the likelihood given by the variable parameters in the regression model. In determining the individual failure probabilities required in Equation 3, a power-law relationship is assumed to appropriately represent the fatigue data [17,18]. This power-law relationship is given in Equation 4,
)'(loglog SN ee (Eq. 4)
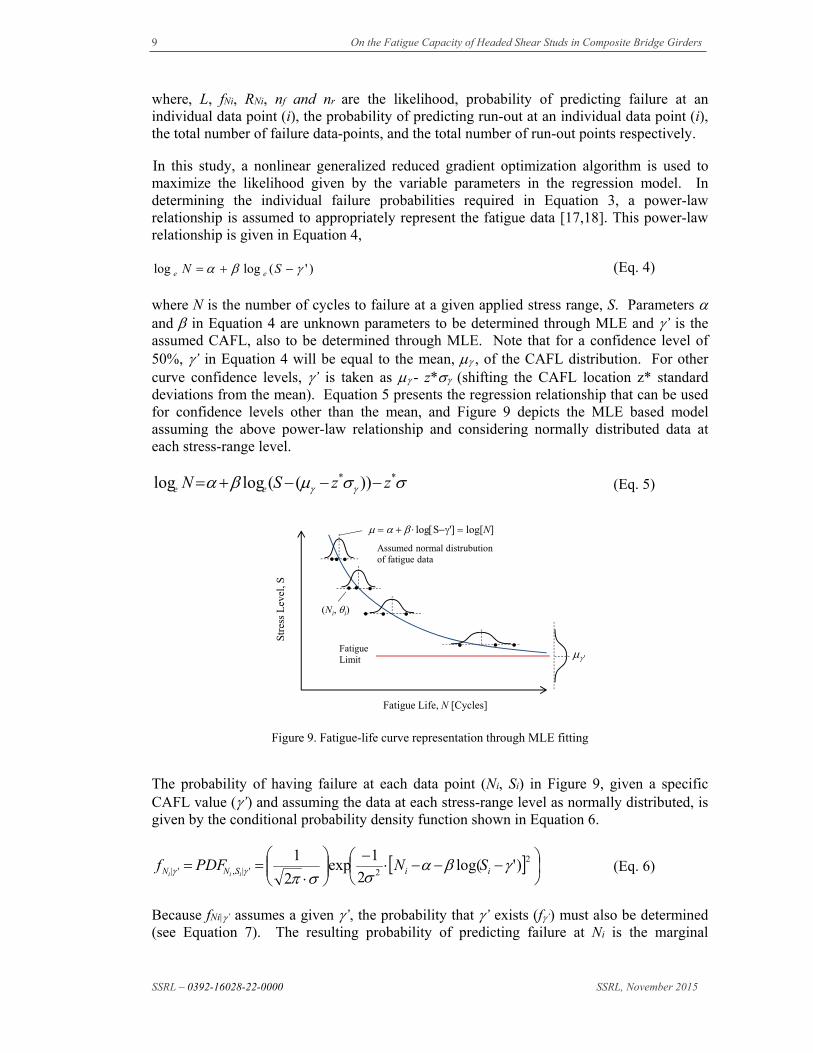
where N is the number of cycles to failure at a given applied stress range, S. Parameters and in Equation 4 are unknown parameters to be determined through MLE and ’ is the assumed CAFL, also to be determined through MLE. Note that for a confidence level of 50%, ’ in Equation 4 will be equal to the mean, , of the CAFL distribution. For other curve confidence levels, ’ is taken as - z* (shifting the CAFL location z* standard deviations from the mean). Equation 5 presents the regression relationship that can be used for confidence levels other than the mean, and Figure 9 depicts the MLE based model assuming the above power-law relationship and considering normally distributed data at each stress-range level.
** ))((loglog zzSN ee (Eq. 5)
Figure 9. Fatigue-life curve representation through MLE fitting
The probability of having failure at each data point (Ni, Si) in Figure 9, given a specific CAFL value (’) and assuming the data at each stress-range level as normally distributed, is given by the conditional probability density function shown in Equation 6.
2
2'|,'| )'log(2
1exp
2
1 iiSNN SNPDFf
iii (Eq. 6)
Because fNi|’ assumes a given ’, the probability that ’ exists (f’) must also be determined (see Equation 7). The resulting probability of predicting failure at Ni is the marginal
Stre
ssL
evel
, S
Fatigue Life, N [Cycles]
Fatigue Limit '
logS'log[N]
Assumed normal distrubution of fatigue data
(Ni, i)
B. Ovuoba and G.S. Prinz
SSRL – 0392-16028-22-0000 SSRL, November 2015
10
probability density function representing the joint probability between fNi|’ and f’ as given in Equation 8.
2
2''
' )'2
1exp
2
1
f (Eq. 7)
i
ii
S
NNNi dffPDFf0
''| ' (Eq. 8)
4.2. Influence of Run-Outs on CAFL
Many S-N curves often only consider failure test results in identifying regression parameters, neglecting run-out test results and their potential influence on curve features such as the CAFL. At certain low stress levels, such as those considered in this study, the possibility exists for run-out test results to occur. MLE allows these run-out test results to influence the S-N curve through the population cumulative distribution function, since run-out simply indicates the absence of failure. In the case of run-outs, the probability of predicting run-out given an assumed CAFL (’) is given by:
'|,'| 1 iii SNN CDFR (Eq. 9)
where CDFNi,Si|’ is the cumulative density function assuming ’. The resulting probability of run-out, RNi, is the marginal probability density function between Equation 9 and Equation 7, given by equation 10.
')1( '0 '|, dfCDFRi
iii
S
SNN (Eq. 10)
4.3. Shear Stud Fatigue Dataset and Analysis using MLE
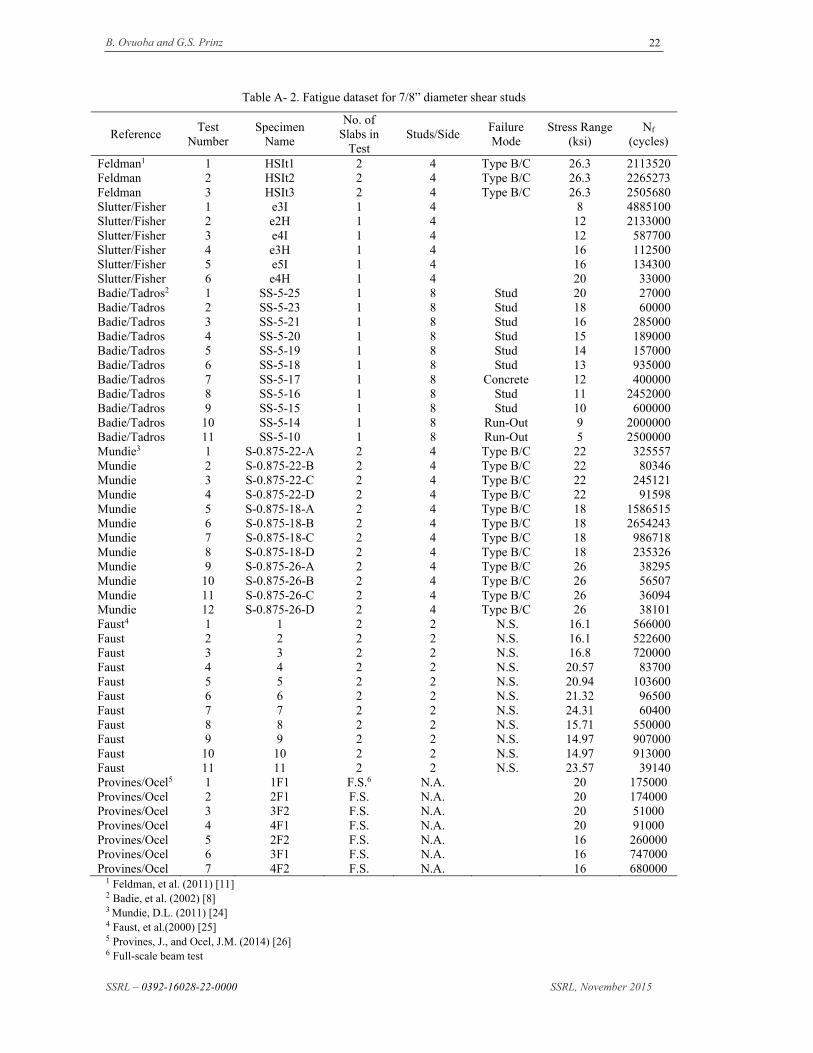
The complete fatigue data set considered in this study is presented in Table A- 1 of Appendix A, and consists of the six fatigue results described earlier and 100 fatigue results from existing comparable testing found in the literature. The 100 fatigue results taken from the literature were from a total of seven shear stud fatigue studies conducted between 1959 and 1988 [4,10,19,20,21,22,23]. All existing fatigue data presented in Table A- 1 were selected based on four criteria, including: 1) a stud shank diameter of 19mm (3/4 in.); 2) constant amplitude loading; 3) unidirectional loading (no reversed cycles), and 4) failure occurring in the stud shank or weld (i.e. no concrete crushing failures). For conservancy, test results from reversed cycle loading were not included, as they typically result in higher fatigue capacities due to the reduced applied mean stress [4]. Fatigue results from both single-sided and double-sided push-out tests were considered. Additional test data for 7/8” studs from more recent studies (conducted between 2000 and 2014) are used in comparisons (see Table A- 2) [4,8,11,24,25,26].
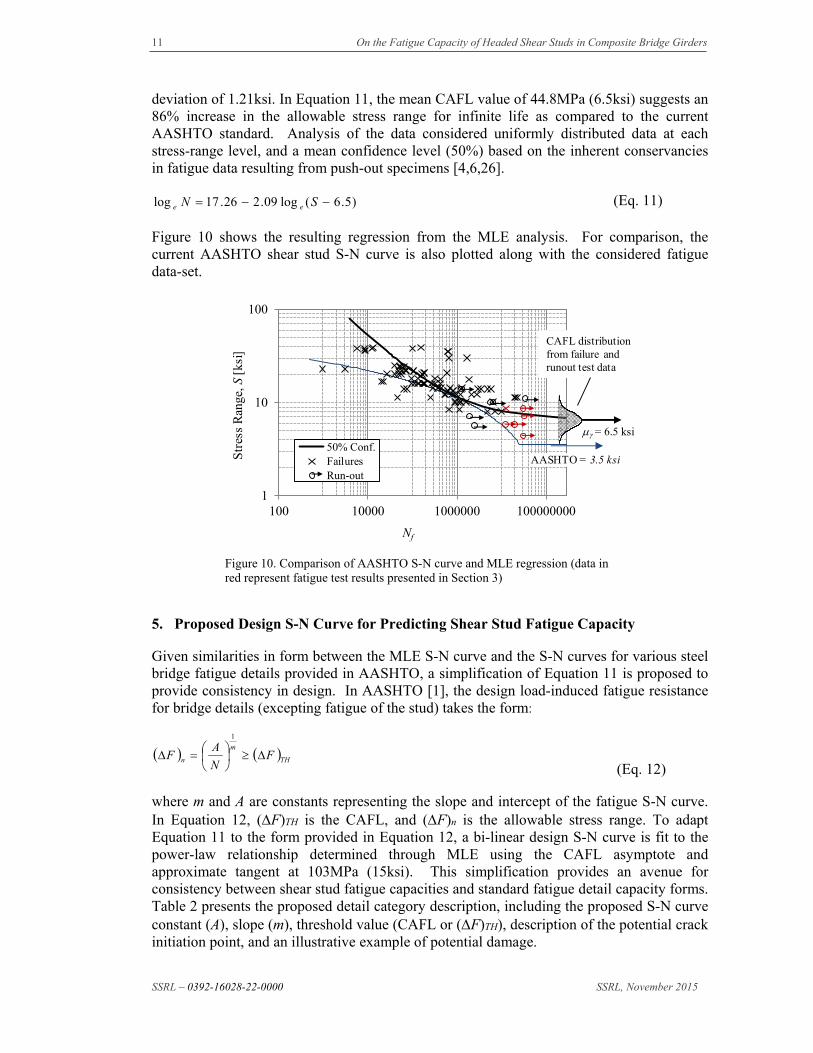
Analysis of the fatigue dataset presented in Table A- 1 suggests an increase in the CAFL and higher fatigue capacity within the finite-life region for stress-ranges over 117MPa (17ksi). Equation 11 presents the stud fatigue capacity equation resulting from the MLE analysis, with the optimized parameters of , , , , and being 17.26, -2.09, 6.5ksi, 1.45, and 1.21ksi respectively. Note that the stress range parameter in Equation 11 is based on units of ksi. The resulting distribution for the CAFL is characterized by a standard
11 On the Fatigue Capacity of Headed Shear Studs in Composite Bridge Girders
SSRL – 0392-16028-22-0000 SSRL, November 2015
deviation of 1.21ksi. In Equation 11, the mean CAFL value of 44.8MPa (6.5ksi) suggests an 86% increase in the allowable stress range for infinite life as compared to the current AASHTO standard. Analysis of the data considered uniformly distributed data at each stress-range level, and a mean confidence level (50%) based on the inherent conservancies in fatigue data resulting from push-out specimens [4,6,26].
)5.6(log09.226.17log SN ee (Eq. 11)
Figure 10 shows the resulting regression from the MLE analysis. For comparison, the current AASHTO shear stud S-N curve is also plotted along with the considered fatigue data-set.
Figure 10. Comparison of AASHTO S-N curve and MLE regression (data in red represent fatigue test results presented in Section 3)
5. Proposed Design S-N Curve for Predicting Shear Stud Fatigue Capacity
Given similarities in form between the MLE S-N curve and the S-N curves for various steel bridge fatigue details provided in AASHTO, a simplification of Equation 11 is proposed to provide consistency in design. In AASHTO [1], the design load-induced fatigue resistance for bridge details (excepting fatigue of the stud) takes the form:
TH
m
n FN
AF
1
(Eq. 12)
where m and A are constants representing the slope and intercept of the fatigue S-N curve. In Equation 12, (F)TH is the CAFL, and (F)n is the allowable stress range. To adapt Equation 11 to the form provided in Equation 12, a bi-linear design S-N curve is fit to the power-law relationship determined through MLE using the CAFL asymptote and approximate tangent at 103MPa (15ksi). This simplification provides an avenue for consistency between shear stud fatigue capacities and standard fatigue detail capacity forms. Table 2 presents the proposed detail category description, including the proposed S-N curve constant (A), slope (m), threshold value (CAFL or (F)TH), description of the potential crack initiation point, and an illustrative example of potential damage.
1
10
100
100 10000 1000000 100000000
Str
ess
Ran
ge, S
[ks
i]
Nf
50% Conf.FailuresRun-out
= 6.5 ksi
CAFL distributionfrom failure and runout test data
AASHTO = 3.5 ksi

B. Ovuoba and G.S. Prinz
SSRL – 0392-16028-22-0000 SSRL, November 2015
12
Table 2: Proposed detail category description for shear stud fatigue capacity
Description Category
Constant A
(ksi4)
Threshold (ΔF)TH
ksi Potential Crack Initiation Point Illustrative Examples
9.2 Connection weld or shank of stud-type shear connector attached by fillet or automatic stud welding subjected to shear loading
D' [m = 4]
150 ×108 6.5
Toe of stud-to-flange welds, propagating through the stud shank or into the flange base metal
Figure 11(a) plots the proposed design S-N curve along with the MLE regression and fatigue data, and Figure 11(b) compares the proposed bi-linear design S-N curve with the current AASHTO fatigue detail categories. Note in Figure 11(b), that the proposed stud fatigue design S-N curve indicates a lower fatigue capacity than the curve for fracture in the base metal outside the stud weld, but a higher capacity than the current AASHTO stud fatigue limit. While the proposed design S-N curve is derived from the MLE analysis on ¾” stud fatigue tests, data from other fatigue tests on 7/8” studs fits the general trend of the curve. For comparison, Figure 11(c) is provided to show the proposed design S-N curve with data from both ¾” and 7/8” stud fatigue tests (see Appendix A for the stud fatigue values considered).
(a) (b)
(c)
Figure 11. (a) Comparison of proposed design S-N curve, MLE regression, fatigue data, and current AASHTO curve. (b) Comparison of proposed design S-N curve and existing AASHTO fatigue details.
ff
1
10
100
100 10000 1000000 100000000
Str
ess
Ran
ge, S
[ks
i]
Nf
50% Conf.FailuresRun-out
Proposed Design Curve
= 6.5 ksi THn FN
F
4
1810150
1
10
100
100 10000 1000000 100000000
Str
ess
Ran
ge, S
[ks
i]
Nf
Proposed: D'
A
B
C'CD
E
E'
Detail Category
1
1m = 3
ff
m = 4
1.00
10.00
100.00
100 10000 1000000 100000000
Str
ess
Ran
ge, S
[ks
i]
Nf
Failures
Run-out7/8" Stud data
13 On the Fatigue Capacity of Headed Shear Studs in Composite Bridge Girders
SSRL – 0392-16028-22-0000 SSRL, November 2015
6. Effect of New Shear Stud Fatigue-Life Equation on Composite Bridge Design
To compare the effect of the proposed shear stud fatigue life equation on the existing composite design requirements, design calculations investigating the required number of studs are performed. All design examples in this report use existing bridge geometries of varying span lengths and consider both strength and fatigue limit states.
6.1. Prototype Bridge Geometries & Considered Traffic Levels
Five multi-girder highway bridge span geometries, two levels of single-lane average daily truck traffic (ADTTSL), and two fatigue criteria (the proposed and existing stud fatigue capacities) are considered for a total of 20 composite designs. The two ADTTSL values considered are 500 and 1000, representing low and high traffic demands for both finite and infinite life stud designs under the current AASHTO S-N curve. The five bridge span geometries are taken from existing multi-girder highway bridges located within Arkansas and Oklahoma. Each existing bridge span is simply-supported and originally designed to be composite. Details on span length, concrete deck depth, girder spacing, and girder geometry, for each of the five spans are provided in Table 3. All designs in this study consider ¾ × 4” shear studs.
Table 3. Considered Bridge Geometries
Location Span Length
(ft) Concrete Deck
Depth (in) Girder
Spacing (ft) Girder Section
1a 64 6.5 6.5 W36x150 2 77 6.5 6.5 W36x150 3 65 7.5 8.5 W36x135 4 32 7.5 8.5 W27x84 5 40 6.5 6.25 W21x62
a See calculation examples provided in Appendix D for site-specific bridge location information
6.2. Design Approach
Excepting the designs considering the proposed shear stud fatigue capacity, all shear studs in the prototype bridge geometries are designed in accordance with AASHTO Article 6.10.10. Following typical design practices, shear demands at the steel-concrete interface are calculated at every 10th point along the bridge span (allowing the stud pitch to change along the span). The following sections provide a brief background on Article 6.10.10 in the AASHTO standard.
6.2.1. Brief Background on Determining the Required Stud Pitch for Fatigue
Under fatigue loading, the required pitch (or spacing) of shear studs in a composite bridge girder is dependent on a capacity-to-demand ratio between the individual stud capacity (Zr) and the applied shear demand at the steel-concrete interface (Vsr). Equation 13 presents the capacity-to-demand ratio used by [1], with n being the number of shear studs across the flange width. While the stud fatigue capacity (Zr) is calculated as described earlier (shown again in Equation 14), the demand at the steel-concrete interface is calculated as a shear flow resulting from the girder shear (Vf) caused by the passage of a design-level fatigue truck (see Equation 15).
B. Ovuoba and G.S. Prinz
SSRL – 0392-16028-22-0000 SSRL, November 2015
14
Two fatigue load combinations are considered when calculating shear demands from the design-level truck: Fatigue Load Combination I for higher traffic demands (ADTTSL greater than 960) and Fatigue Load Combination II for lower traffic demands (ADTTSL lower than 960). The loading factors for Fatigue Load Combinations I and II are 0.75 and 1.5 respectively [1].
sr
r
V
Znp
(EQ. 13)
960 ADTT 5.5
960 ADTT log28.45.342
2
ford
fordNZr (U.S. Cust. units) (EQ. 14)
I
QVV f
sr
(EQ. 15)
6.2.2. Background on Determining the Required Stud Pitch for Strength
Similar to the fatigue limit state, the required number of studs for the strength limit state is calculated using a capacity-to-demand ratio, where the nominal shear demand, P, is compared with the factored resistance of an individual shear connector, Qr as shown in Equation 16.
rQ
Pn (EQ. 16)
In Equation 16, the nominal shear demand, P, is determined as the lesser of the longitudinal force in the concrete deck or steel girder. The factored shear capacity, Qr, is calculated as the lesser of the nominal concrete strength (from the area surrounding the stud) and stud steel strength (see Section 6.10.10.4 in [1]).
6.3. Comparison of Composite Bridge Designs using the AASHTO and Proposed Stud Fatigue Capacities
The proposed stud fatigue S-N curve results in fewer required studs than the existing AASHTO S-N curve. Table 4 shows the number of shear studs required to satisfy the fatigue limit state in the five prototype bridge geometries, considering both the AASHTO and proposed stud S-N curves. Note that stud values using the proposed S-N curve remain unchanged between the ADTT 1000 and ADTT 500 levels as the CAFL is shifted relative to the AASHTO curve. For the higher traffic level (ADTT of 1000), the number of required shear studs was reduced by 40-45% using the proposed S-N curve. For the lower traffic level (ADTT of 500) under the lower traffic level, the number of required studs was reduced by between 17-48%.
Note that the required number of studs is somewhat higher than that required by the capacity-to-demand ratio provided in EQ 13, due to the maximum spacing requirement of 24” [1]. Sample calculations for bridge span 1, shown in Figure D-2 of Appendix D, indicate that a significant portion of the composite girder section are limited by the maximum spacing requirement when using the proposed shear stud fatigue S-N curve (the spacing requirement exceedance is highlighted in red). If the maximum stud spacing
15 On the Fatigue Capacity of Headed Shear Studs in Composite Bridge Girders
SSRL – 0392-16028-22-0000 SSRL, November 2015
requirement were increased, further reductions in the number of required shear studs would be achieved.
Table 4 Required number of studs from the AASHTO and proposed fatigue capacity curves
AASHTO Proposed ADTT 1000 ADTT 500 ADTT 1000 ADTT 500
191 137 114 114 250 176 144 144 236 165 133 133 104 108 56 56 149 153 81 81
Note: Values presented are adjusted to satisfy maximum stud spacing requirements
7. Summary and Conclusions
In this study, six composite push-out specimens were fatigue tested under repeated cyclic loads at stress ranges varying between 30MPa and 60MPa. These composite push-out specimens represent a conservative estimation of stud fatigue damage as the adhesion and friction at the steel-concrete interface were inhibited by greasing of the steel flanges prior to concrete casting. Measured fatigue life from the eight specimens were combined with existing shear stud fatigue data sets in the literature, and analyzed using a probabilistic method called maximum likelihood estimation. Results from the eight fatigue tests and analysis of the new and existing fatigue data provide the following conclusions:
1) The current AASHTO CAFL for headed shear studs provides an overly-conservative estimation of fatigue capacity. Analysis of existing data along with the additional high-cycle fatigue test results suggests an increase in the CAFL from 3.5ksi to 6.5ksi.
2) The current AASHTO S-N curve for finite life of the shear stud underestimates fatigue capacity and is not representative of the larger considered fatigue dataset. An alternative design S-N curve of similar form to the existing AASHTO detail categories (log-log) is proposed. The proposed curve has an m=4 and A= 150x108 and provides a known level of confidence in the estimated fatigue capacity (based on the MLE analysis with a confidence level of 50%) while providing a unification in the fatigue design procedure.
3) For bridge designs subjected to high traffic levels, the number of required shear studs may be reasonably reduced by 40-45% using the proposed design S-N curve. These stud savings vary due to the maximum stud spacing requirement. If the maximum stud spacing requirement were increased, further reductions in the number of required shear studs could be achieved.
B. Ovuoba and G.S. Prinz
SSRL – 0392-16028-22-0000 SSRL, November 2015
16
8. References
[1] AASHTO (2012). "AASHTO LRFD bridge design specifications (6th edition)." American Association of State Highway and Transportation Officials, Washington, DC.
[2] Oehlers, D. J. (1990). "Methods of estimating the fatigue enduraces of stud shear connections." IABSE Proceedings P-145/90, p. 65-84.
[3] Johnson, R. P. (2000). "Resistance of stud shear connectors to fatigue." J. Constructional Steel Research 56(2000), 101-116.
[4] Slutter, R. G., and Fisher, J.W. (1966). "Fatigue strength of shear connectors " Highway Research Record No. 147, Highway Research Board, p. 65-88.
[5] Eurocode_4 (1994). "Design of composite steel and concrete structures - Part 2: General rules and rules for bridges." ENV 1994-2, European Committee for Standardization, Brussels, Belgium.
[6] Lee, K.-C., Abbas, H.H., and Ramey, G.E. (2010). "Review of current AASHTO fatigue design specifications for stud shear connectors." ASCE Structures Congress Proceedings, p. 310-321.
[7] Eurocode_4 (1994). "Design of composite steel and concrete structures - Part 1-1: General rules and rules for buildings." ENV 1994-1-1, European Committee for Standardization, Brussels, Belgium.
[8] Badie, S. S., Tadros, M.K., Kakish, H.F., Splittgerber, D.L., and Baishya, M.C. (2002). "Large shear studs for composite action in steel bridges." J. Bridge Engineering, ASCE 7(3), p.195-203.
[9] AHTD (2014). "Division 800, Section 802: Concrete for structures." The Arkansas Standard Specification for Highway Construction
[10] Hallam, M. W. (1976). "The behaviour of stud shear connectors under repeated loading." Research Report No, R281, University of Sydney, School of Civil Engineering, Sydney, Austrailia.
[11] Feldmann, M., Hechler, O., Hegger, J., and Rauscher, S. (2011). "Fatigue behavior of shear connectors in high performance concrete." Composite Construction in Steel and Concrete VI, pp. 39-51, doi: 10.1061/41142(41396)41144
[12] D'Angelo, L., Rocha, M., Nussbaumer, A., and Bruhwiler, E. (2014). "Creation of S-N-P curves for reinforcing steel bars using a maximum likelihood approach." Proc. Eurosteel, Naples, Italy.
[13] Myers, A. T., Kanvinde, A.M., and Ibarra, L. (2012). "Maximum likelihood based parameter estimation of constitutive models for earthquake engineering." 15th World Conference on Earthquake Engineering, Lisbon, Portugal.
[14] Prinz, G. S., and Nussbaumer, A. (2014). "Effect of radial base-plate welds on ULCF capacity of unanchored tank connections." J. Constructional Steel Research 103(2014), 131-139.
[15] Ling, J., and Pan, J. (1997). "A maximum likelihood method for estimating P-S-N curves." International J. of Fatigue 19(5), 415-419.
[16] Pascual, F. G., and Meeker, W.Q. (1999). "Estimating fatigue curves with the random fatigue-limit model: 1 Introduction." Technometrics 1999
[17] Coffin, L. F. (1954). "A study of the effects of cyclic thermal stresses in ductile metals." ASME, 76, 931-950.

17 On the Fatigue Capacity of Headed Shear Studs in Composite Bridge Girders
SSRL – 0392-16028-22-0000 SSRL, November 2015
[18] Manson, S. S. (1954). Behavior of materials under conditions of thermal stress. National Advisory Committee for Aeronautics,. Technical note 2933. Tennessee (USA).
[19] Mainstone, R. J., and Menzies, J.B. (1967). "Shear connectors in steel-concrete composte beams for bridges, Part I." Concrete 1(9), pp. 291-302.
[20] Lehman, H. G., Lew, H.S., and Toprac, A.A. (1965). "Fatigue strength of 3/4 inch studs in lightweight concrete." Research Report No. 76-1F, Center for Highway Research, The University of Texas, Austin, Texas.
[21] Naithani, K. C., Gupta, V.K., and Gadh, A.D. (1988). "Behaviour of shear connectors under dynamic loads." Materials and Structures 21
[22] Roderick, J. W., and Ansorian, P. (1976). "Repeated loading of composite beams." Civil Engineering Transactions CE18(2), pp. 109-116.
[23] Thurlimann, B. (1959). "Fatigue and static strength of steel shear connectors, Lehigh University, 1959 Reprint No. 144(59-8)." (1959) Fritz Laboratory Reports. Paper 1253.
[24] Mundie, D. L. (2011). "Fatigue testing and design of large diameter shear studs used in highway bridges." Masters Thesis, Auburn University, Auburn, AL.
[25] Faust, T., Leffer, A., and Mesinger, M. (2000). "Fatigue of headed studs embedded in LWAC." Second International Symposium on Structural Lightweight Aggregate Concrete 2(2000), pp.212-220.
[26] Provines, J., and Ocel, J.M. (2014). "Strength and fatigue resistance of shear stud connectors." National Accelerated Bridge Construction Conference (ABC), December, 4-5, Miami, Florida.
[27] ASTM (2008). Standard practice for making and curing concrete test specimens in the field. C31/C31M-09. West Conshohicken, Pa.
[28] ASTM (2015). Standard test method for compressive strength of cyllidrical concrete specimens. C39/C39M-15a. West Conshohicken, Pa.

B. Ovuoba and G.S. Prinz
SSRL – 0392-16028-22-0000 SSRL, November 2015
18

19 On the Fatigue Capacity of Headed Shear Studs in Composite Bridge Girders
SSRL – 0392-16028-22-0000 SSRL, November 2015
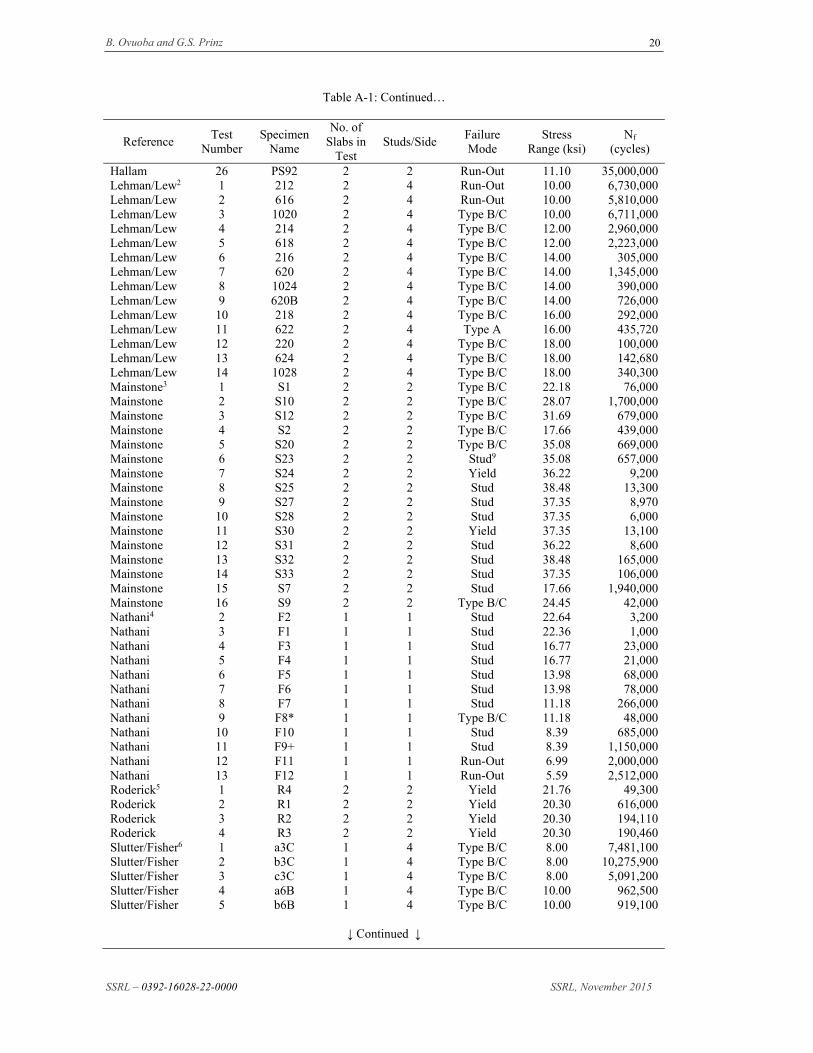
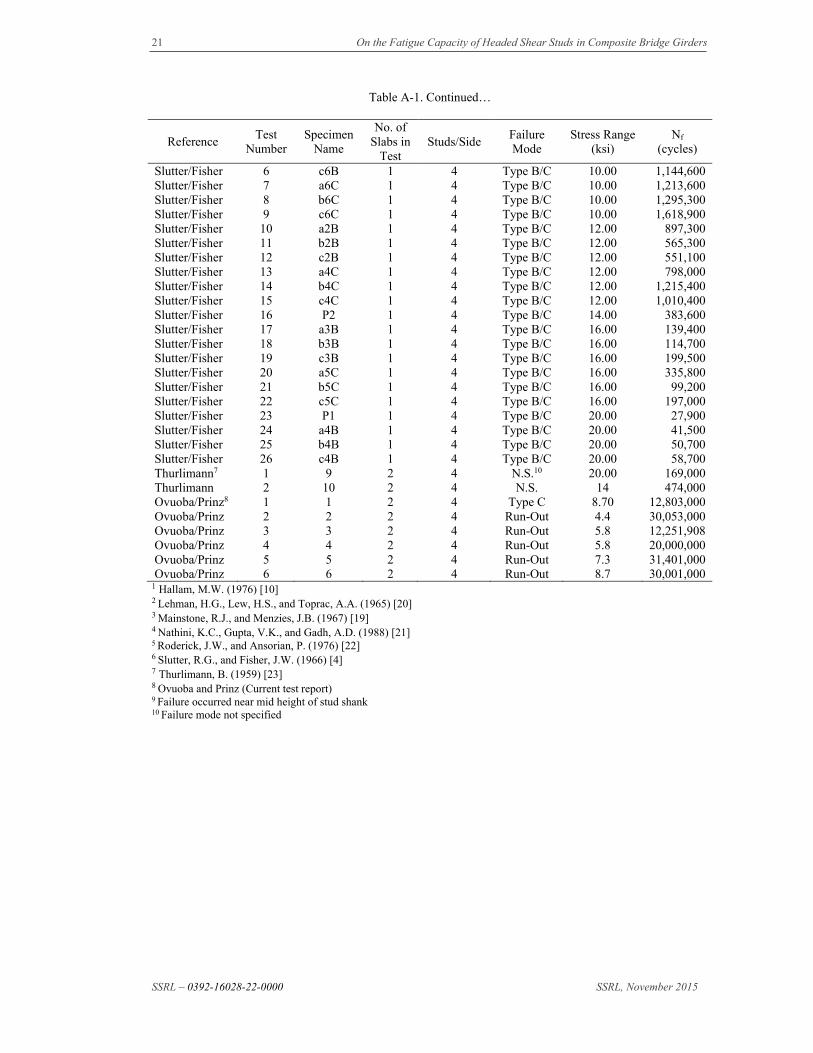
Appendix A. Shear Stud Fatigue Dataset
Table A- 1 provides the ¾” stud fatigue data set values used in determining the proposed design S-N curve. Table A- 2 provides the 7/8” stud fatigue values used in comparison. Failure modes described in Tables A-1 and A-2 refer to type A, B, or C fractures as shown in Figure A- 1.
Figure A- 1. Common (type A, B, and C) fatigue fractures within shear stud connectors.
Table A- 1. Fatigue dataset for ¾” diameter shear studs
Reference Test
Number Specimen
Name
No. of Slabs in
Test Studs/Side
Failure Mode
Stress Range (ksi)
Nf (cycles)
Hallam1 1 PS4 2 2 Type A 24.19 52,801 Hallam 2 PS42 2 2 Type A 24.19 52,836 Hallam 3 PS5 2 2 Type A 24.19 58,630 Hallam 4 PS52 2 2 Type A 24.19 67,877 Hallam 5 PS10 2 2 Type A 21.39 61,700 Hallam 6 PS102 2 2 Type A 21.39 75,500Hallam 7 PS11 2 2 Type A 21.39 110,000 Hallam 8 PS112 2 2 Type A 21.39 110,000 Hallam 9 PS12 2 2 Type A 15.99 148,700Hallam 10 PS122 2 2 Type A 15.99 174,800 Hallam 11 PS13 2 2 Type A 15.99 182,600 Hallam 12 PS132 2 2 Type A 15.99 182,600Hallam 13 PS12 2 2 Run-Out 13.89 1,303,669 Hallam 14 PS1 2 2 Type A 13.89 1,303,669 Hallam 15 PS3 2 2 Type A 13.30 652,300Hallam 16 PS32 2 2 Type A 13.30 652,300 Hallam 17 PS2 2 2 Type A 13.30 823,970 Hallam 18 PS22 2 2 Type A 13.30 845,000Hallam 19 PS6 2 2 Type C 13.70 3,170,000 Hallam 20 PS62 2 2 Type C 13.70 3,554,000 Hallam 21 PS7 2 2 Type C 13.70 5,140,000 Hallam 22 PS72 2 2 Type C 13.70 6,096,000 Hallam 23 PS82 2 2 Type C 11.10 20,965,000 Hallam 24 PS8 2 2 Type C 11.10 21,391,000 Hallam 25 PS9 2 2 Type C 11.10 24,305,000
↓ Continued ↓
B. Ovuoba and G.S. Prinz
SSRL – 0392-16028-22-0000 SSRL, November 2015
20
Table A-1: Continued…
Reference Test
Number Specimen
Name
No. of Slabs in
Test Studs/Side
Failure Mode
Stress Range (ksi)
Nf (cycles)
Hallam 26 PS92 2 2 Run-Out 11.10 35,000,000 Lehman/Lew2 1 212 2 4 Run-Out 10.00 6,730,000 Lehman/Lew 2 616 2 4 Run-Out 10.00 5,810,000 Lehman/Lew 3 1020 2 4 Type B/C 10.00 6,711,000 Lehman/Lew 4 214 2 4 Type B/C 12.00 2,960,000 Lehman/Lew 5 618 2 4 Type B/C 12.00 2,223,000 Lehman/Lew 6 216 2 4 Type B/C 14.00 305,000 Lehman/Lew 7 620 2 4 Type B/C 14.00 1,345,000 Lehman/Lew 8 1024 2 4 Type B/C 14.00 390,000 Lehman/Lew 9 620B 2 4 Type B/C 14.00 726,000 Lehman/Lew 10 218 2 4 Type B/C 16.00 292,000 Lehman/Lew 11 622 2 4 Type A 16.00 435,720 Lehman/Lew 12 220 2 4 Type B/C 18.00 100,000 Lehman/Lew 13 624 2 4 Type B/C 18.00 142,680 Lehman/Lew 14 1028 2 4 Type B/C 18.00 340,300 Mainstone3 1 S1 2 2 Type B/C 22.18 76,000 Mainstone 2 S10 2 2 Type B/C 28.07 1,700,000 Mainstone 3 S12 2 2 Type B/C 31.69 679,000 Mainstone 4 S2 2 2 Type B/C 17.66 439,000 Mainstone 5 S20 2 2 Type B/C 35.08 669,000 Mainstone 6 S23 2 2 Stud9 35.08 657,000 Mainstone 7 S24 2 2 Yield 36.22 9,200 Mainstone 8 S25 2 2 Stud 38.48 13,300 Mainstone 9 S27 2 2 Stud 37.35 8,970 Mainstone 10 S28 2 2 Stud 37.35 6,000 Mainstone 11 S30 2 2 Yield 37.35 13,100 Mainstone 12 S31 2 2 Stud 36.22 8,600 Mainstone 13 S32 2 2 Stud 38.48 165,000Mainstone 14 S33 2 2 Stud 37.35 106,000 Mainstone 15 S7 2 2 Stud 17.66 1,940,000 Mainstone 16 S9 2 2 Type B/C 24.45 42,000Nathani4 2 F2 1 1 Stud 22.64 3,200 Nathani 3 F1 1 1 Stud 22.36 1,000 Nathani 4 F3 1 1 Stud 16.77 23,000Nathani 5 F4 1 1 Stud 16.77 21,000 Nathani 6 F5 1 1 Stud 13.98 68,000 Nathani 7 F6 1 1 Stud 13.98 78,000Nathani 8 F7 1 1 Stud 11.18 266,000 Nathani 9 F8* 1 1 Type B/C 11.18 48,000 Nathani 10 F10 1 1 Stud 8.39 685,000Nathani 11 F9+ 1 1 Stud 8.39 1,150,000 Nathani 12 F11 1 1 Run-Out 6.99 2,000,000 Nathani 13 F12 1 1 Run-Out 5.59 2,512,000Roderick5 1 R4 2 2 Yield 21.76 49,300 Roderick 2 R1 2 2 Yield 20.30 616,000 Roderick 3 R2 2 2 Yield 20.30 194,110Roderick 4 R3 2 2 Yield 20.30 190,460 Slutter/Fisher6 1 a3C 1 4 Type B/C 8.00 7,481,100 Slutter/Fisher 2 b3C 1 4 Type B/C 8.00 10,275,900 Slutter/Fisher 3 c3C 1 4 Type B/C 8.00 5,091,200 Slutter/Fisher 4 a6B 1 4 Type B/C 10.00 962,500 Slutter/Fisher 5 b6B 1 4 Type B/C 10.00 919,100
↓ Continued ↓
21 On the Fatigue Capacity of Headed Shear Studs in Composite Bridge Girders
SSRL – 0392-16028-22-0000 SSRL, November 2015
Table A-1. Continued…
Reference Test
Number Specimen
Name
No. of Slabs in
Test Studs/Side
Failure Mode
Stress Range (ksi)
Nf (cycles)
Slutter/Fisher 6 c6B 1 4 Type B/C 10.00 1,144,600 Slutter/Fisher 7 a6C 1 4 Type B/C 10.00 1,213,600 Slutter/Fisher 8 b6C 1 4 Type B/C 10.00 1,295,300 Slutter/Fisher 9 c6C 1 4 Type B/C 10.00 1,618,900 Slutter/Fisher 10 a2B 1 4 Type B/C 12.00 897,300 Slutter/Fisher 11 b2B 1 4 Type B/C 12.00 565,300 Slutter/Fisher 12 c2B 1 4 Type B/C 12.00 551,100 Slutter/Fisher 13 a4C 1 4 Type B/C 12.00 798,000 Slutter/Fisher 14 b4C 1 4 Type B/C 12.00 1,215,400 Slutter/Fisher 15 c4C 1 4 Type B/C 12.00 1,010,400 Slutter/Fisher 16 P2 1 4 Type B/C 14.00 383,600 Slutter/Fisher 17 a3B 1 4 Type B/C 16.00 139,400 Slutter/Fisher 18 b3B 1 4 Type B/C 16.00 114,700 Slutter/Fisher 19 c3B 1 4 Type B/C 16.00 199,500 Slutter/Fisher 20 a5C 1 4 Type B/C 16.00 335,800 Slutter/Fisher 21 b5C 1 4 Type B/C 16.00 99,200 Slutter/Fisher 22 c5C 1 4 Type B/C 16.00 197,000 Slutter/Fisher 23 P1 1 4 Type B/C 20.00 27,900 Slutter/Fisher 24 a4B 1 4 Type B/C 20.00 41,500 Slutter/Fisher 25 b4B 1 4 Type B/C 20.00 50,700 Slutter/Fisher 26 c4B 1 4 Type B/C 20.00 58,700 Thurlimann7 1 9 2 4 N.S.10 20.00 169,000 Thurlimann 2 10 2 4 N.S. 14 474,000 Ovuoba/Prinz8 1 1 2 4 Type C 8.70 12,803,000 Ovuoba/Prinz 2 2 2 4 Run-Out 4.4 30,053,000 Ovuoba/Prinz 3 3 2 4 Run-Out 5.8 12,251,908 Ovuoba/Prinz 4 4 2 4 Run-Out 5.8 20,000,000 Ovuoba/Prinz 5 5 2 4 Run-Out 7.3 31,401,000Ovuoba/Prinz 6 6 2 4 Run-Out 8.7 30,001,000
1 Hallam, M.W. (1976) [10] 2 Lehman, H.G., Lew, H.S., and Toprac, A.A. (1965) [20] 3 Mainstone, R.J., and Menzies, J.B. (1967) [19] 4 Nathini, K.C., Gupta, V.K., and Gadh, A.D. (1988) [21] 5 Roderick, J.W., and Ansorian, P. (1976) [22] 6 Slutter, R.G., and Fisher, J.W. (1966) [4] 7 Thurlimann, B. (1959) [23] 8 Ovuoba and Prinz (Current test report) 9 Failure occurred near mid height of stud shank 10 Failure mode not specified
B. Ovuoba and G.S. Prinz
SSRL – 0392-16028-22-0000 SSRL, November 2015
22
Table A- 2. Fatigue dataset for 7/8” diameter shear studs
Reference Test
Number Specimen
Name
No. of Slabs in
Test Studs/Side
Failure Mode
Stress Range (ksi)
Nf (cycles)
Feldman1 1 HSIt1 2 4 Type B/C 26.3 2113520 Feldman 2 HSIt2 2 4 Type B/C 26.3 2265273 Feldman 3 HSIt3 2 4 Type B/C 26.3 2505680 Slutter/Fisher 1 e3I 1 4 8 4885100 Slutter/Fisher 2 e2H 1 4 12 2133000 Slutter/Fisher 3 e4I 1 4 12 587700 Slutter/Fisher 4 e3H 1 4 16 112500 Slutter/Fisher 5 e5I 1 4 16 134300 Slutter/Fisher 6 e4H 1 4 20 33000 Badie/Tadros2 1 SS-5-25 1 8 Stud 20 27000 Badie/Tadros 2 SS-5-23 1 8 Stud 18 60000 Badie/Tadros 3 SS-5-21 1 8 Stud 16 285000 Badie/Tadros 4 SS-5-20 1 8 Stud 15 189000 Badie/Tadros 5 SS-5-19 1 8 Stud 14 157000 Badie/Tadros 6 SS-5-18 1 8 Stud 13 935000 Badie/Tadros 7 SS-5-17 1 8 Concrete 12 400000 Badie/Tadros 8 SS-5-16 1 8 Stud 11 2452000 Badie/Tadros 9 SS-5-15 1 8 Stud 10 600000 Badie/Tadros 10 SS-5-14 1 8 Run-Out 9 2000000 Badie/Tadros 11 SS-5-10 1 8 Run-Out 5 2500000 Mundie3 1 S-0.875-22-A 2 4 Type B/C 22 325557 Mundie 2 S-0.875-22-B 2 4 Type B/C 22 80346 Mundie 3 S-0.875-22-C 2 4 Type B/C 22 245121 Mundie 4 S-0.875-22-D 2 4 Type B/C 22 91598 Mundie 5 S-0.875-18-A 2 4 Type B/C 18 1586515 Mundie 6 S-0.875-18-B 2 4 Type B/C 18 2654243 Mundie 7 S-0.875-18-C 2 4 Type B/C 18 986718 Mundie 8 S-0.875-18-D 2 4 Type B/C 18 235326Mundie 9 S-0.875-26-A 2 4 Type B/C 26 38295 Mundie 10 S-0.875-26-B 2 4 Type B/C 26 56507 Mundie 11 S-0.875-26-C 2 4 Type B/C 26 36094Mundie 12 S-0.875-26-D 2 4 Type B/C 26 38101 Faust4 1 1 2 2 N.S. 16.1 566000 Faust 2 2 2 2 N.S. 16.1 522600Faust 3 3 2 2 N.S. 16.8 720000 Faust 4 4 2 2 N.S. 20.57 83700 Faust 5 5 2 2 N.S. 20.94 103600 Faust 6 6 2 2 N.S. 21.32 96500 Faust 7 7 2 2 N.S. 24.31 60400 Faust 8 8 2 2 N.S. 15.71 550000 Faust 9 9 2 2 N.S. 14.97 907000 Faust 10 10 2 2 N.S. 14.97 913000 Faust 11 11 2 2 N.S. 23.57 39140 Provines/Ocel5 1 1F1 F.S.6 N.A. 20 175000 Provines/Ocel 2 2F1 F.S. N.A. 20 174000 Provines/Ocel 3 3F2 F.S. N.A. 20 51000 Provines/Ocel 4 4F1 F.S. N.A. 20 91000 Provines/Ocel 5 2F2 F.S. N.A. 16 260000 Provines/Ocel 6 3F1 F.S. N.A. 16 747000 Provines/Ocel 7 4F2 F.S. N.A. 16 680000
1 Feldman, et al. (2011) [11]
2 Badie, et al. (2002) [8]
3 Mundie, D.L. (2011) [24]
4 Faust, et al.(2000) [25] 5 Provines, J., and Ocel, J.M. (2014) [26] 6 Full-scale beam test
23 On the Fatigue Capacity of Headed Shear Studs in Composite Bridge Girders
SSRL – 0392-16028-22-0000 SSRL, November 2015
Appendix B. Material Test Data
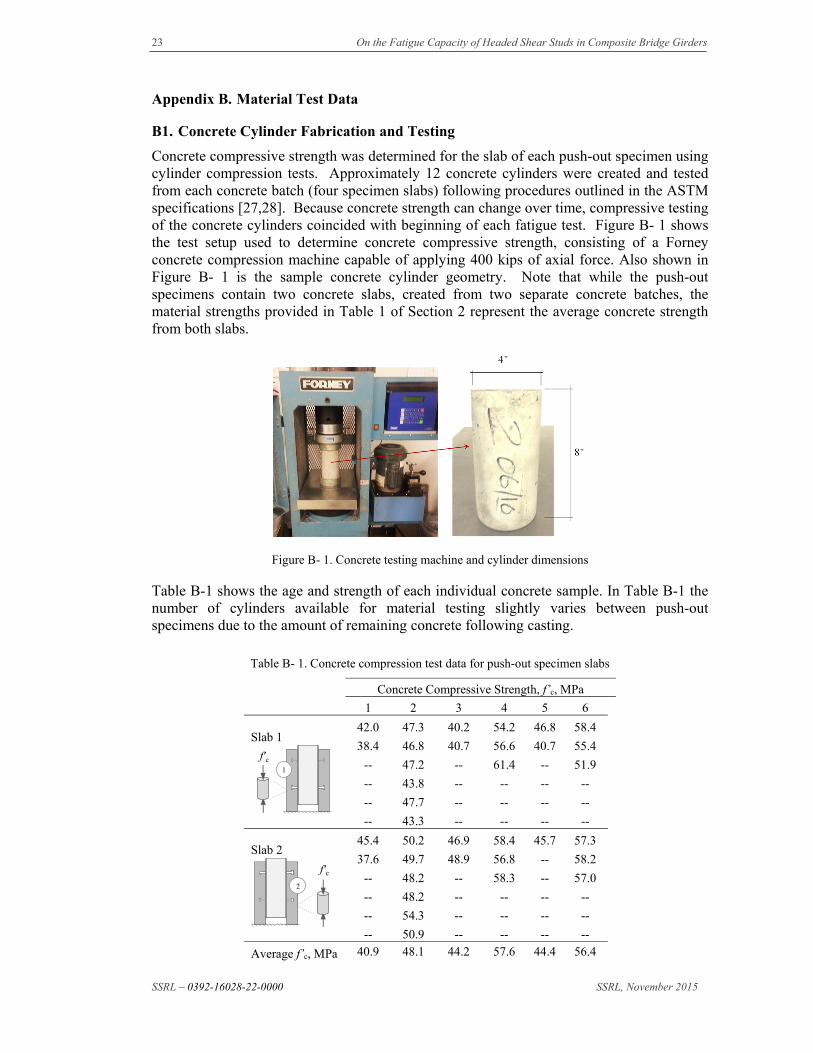
B1. Concrete Cylinder Fabrication and Testing
Concrete compressive strength was determined for the slab of each push-out specimen using cylinder compression tests. Approximately 12 concrete cylinders were created and tested from each concrete batch (four specimen slabs) following procedures outlined in the ASTM specifications [27,28]. Because concrete strength can change over time, compressive testing of the concrete cylinders coincided with beginning of each fatigue test. Figure B- 1 shows the test setup used to determine concrete compressive strength, consisting of a Forney concrete compression machine capable of applying 400 kips of axial force. Also shown in Figure B- 1 is the sample concrete cylinder geometry. Note that while the push-out specimens contain two concrete slabs, created from two separate concrete batches, the material strengths provided in Table 1 of Section 2 represent the average concrete strength from both slabs.
Figure B- 1. Concrete testing machine and cylinder dimensions
Table B-1 shows the age and strength of each individual concrete sample. In Table B-1 the number of cylinders available for material testing slightly varies between push-out specimens due to the amount of remaining concrete following casting.
Table B- 1. Concrete compression test data for push-out specimen slabs
Concrete Compressive Strength, f’c, MPa
1 2 3 4 5 6
Slab 1
42.0 47.3 40.2 54.2 46.8 58.4
38.4 46.8 40.7 56.6 40.7 55.4
-- 47.2 -- 61.4 -- 51.9
-- 43.8 -- -- -- --
-- 47.7 -- -- -- --
-- 43.3 -- -- -- --
Slab 2
45.4 50.2 46.9 58.4 45.7 57.3
37.6 49.7 48.9 56.8 -- 58.2
-- 48.2 -- 58.3 -- 57.0
-- 48.2 -- -- -- --
-- 54.3 -- -- -- --
-- 50.9 -- -- -- --
Average f’c, MPa 40.9 48.1 44.2 57.6 44.4 56.4
1
f'c
2
f'c
B. Ovuoba and G.S. Prinz
SSRL – 0392-16028-22-0000 SSRL, November 2015
24
25 On the Fatigue Capacity of Headed Shear Studs in Composite Bridge Girders
SSRL – 0392-16028-22-0000 SSRL, November 2015
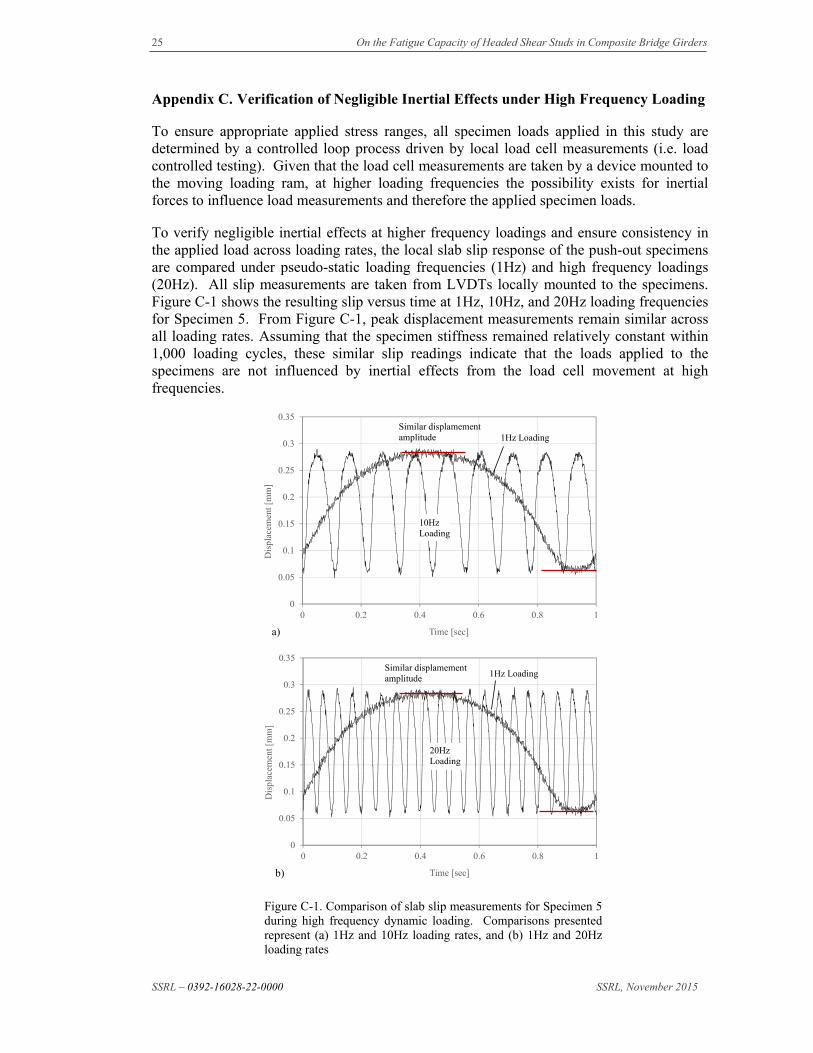
Appendix C. Verification of Negligible Inertial Effects under High Frequency Loading
To ensure appropriate applied stress ranges, all specimen loads applied in this study are determined by a controlled loop process driven by local load cell measurements (i.e. load controlled testing). Given that the load cell measurements are taken by a device mounted to the moving loading ram, at higher loading frequencies the possibility exists for inertial forces to influence load measurements and therefore the applied specimen loads.
To verify negligible inertial effects at higher frequency loadings and ensure consistency in the applied load across loading rates, the local slab slip response of the push-out specimens are compared under pseudo-static loading frequencies (1Hz) and high frequency loadings (20Hz). All slip measurements are taken from LVDTs locally mounted to the specimens. Figure C-1 shows the resulting slip versus time at 1Hz, 10Hz, and 20Hz loading frequencies for Specimen 5. From Figure C-1, peak displacement measurements remain similar across all loading rates. Assuming that the specimen stiffness remained relatively constant within 1,000 loading cycles, these similar slip readings indicate that the loads applied to the specimens are not influenced by inertial effects from the load cell movement at high frequencies.
Figure C-1. Comparison of slab slip measurements for Specimen 5 during high frequency dynamic loading. Comparisons presented represent (a) 1Hz and 10Hz loading rates, and (b) 1Hz and 20Hz loading rates
0
0.05
0.1
0.15
0.2
0.25
0.3
0.35
0 0.2 0.4 0.6 0.8 1
Dis
plac
emen
t [m
m]
Time [sec]
0
0.05
0.1
0.15
0.2
0.25
0.3
0.35
0 0.2 0.4 0.6 0.8 1
Dis
plac
emen
t [m
m]
Time [sec]
1Hz Loading
Similar displamementamplitude
Similar displamementamplitude
10Hz Loading
1Hz Loading
20Hz Loading
a)
b)

B. Ovuoba and G.S. Prinz
SSRL – 0392-16028-22-0000 SSRL, November 2015
26

27 On the Fatigue Capacity of Headed Shear Studs in Composite Bridge Girders
SSRL – 0392-16028-22-0000 SSRL, November 2015
Appendix D. Stud Design Example Calculations for Prototype Bridges
The following figures provide calculation details for the number of required studs in the 5 prototype bridges. Note the values highlighted in red indicate a required pitch that exceeds the maximum stud spacing requirement as specified by [1] (in this case the maximum spacing limit is used).
FA
TIG
UE
LIM
IT S
TA
TE
Bri
dge
Spe
cifi
cati
ons
Spa
nL
engt
hD
eck
Dep
thG
irde
r S
paci
ngD
ista
nce
To
Cur
bS
teel
B
eam
Bea
m
Dep
thA
rea
Ste
elF
lang
e W
idth
Fla
nge
Thi
ckne
ssW
eb
Thi
ckne
ssI
Ste
elD
esig
n f'
cy b
ar
ftin
ftft
inin
2in
inin
in4
psi
in1
646.
56.
51
W36
x150
35.9
44.2
120.
940.
625
9040
4000
30.4
Tra
nsfo
rmed
Sec
tion
Pro
pert
ieShe
ar S
tud
Spe
cifi
cati
ons
She
ar R
esis
tanc
e
Axl
eE
s29
000
ksi
Dia
met
er0.
75in
AD
TT
SL50
0
Fro
nt A
xle
8ki
ps3.
6ki
psE
c36
05ks
iH
eigh
t4
inn
1cy
cles
Mid
dle
Axl
e32
kips
14.3
kips
N13
,687
,500
cy
cles
Bac
k A
xle
32ki
ps14
.3ki
psA
AS
HT
O α
3.96
Pro
pose
d α
4.52
Fat
igue
Loa
d C
ombi
natio
nII
AA
SH
TO
CA
FL
3.50
ksi
Fatig
ue F
acto
r0.
75P
ropo
sed
CA
FL
6.50
ksi
Impa
ct F
acto
r1.
15A
AS
HT
O Z
r2.
23ki
ps
Inte
rior
Gird
er D
istr
ibut
ion
Fac
tor
0.52
Pro
pose
d Z r
2.54
kips
Ext
erio
r G
irder
Dis
trib
utio
n F
acto
r0.
85
Loc
atio
nR
ear
Axl
e L
ocat
ion
Mid
dle
Axl
e L
ocat
ion
Fro
nt
Axl
e L
ocat
ion
Rea
ctio
n A
Vf
Q
IV
srp
AA
SH
TO
p
Pro
pose
dN
o. S
tuds
A
AS
HT
ON
o. S
tuds
P
ropo
sed
Adj
uste
d S
paci
ng
AA
SH
TO
Adj
uste
d S
paci
ng
Pro
pose
d
Adj
uste
d N
o. S
tuds
A
AS
HT
O
Adj
uste
d N
o.
Stu
ds
Pro
pose
d
ftft
ftft
kips
kips
in3
in4
kips
/inin
inin
inin
inin
0.0
64.0
34.0
20.0
22.9
22.9
536
2096
60.
611
.413
.010
.18.
911
.413
.010
96.
457
.627
.613
.619
.719
.753
620
966
0.5
13.2
15.1
17.4
15.3
13.2
15.1
1715
12.8
51.2
21.2
7.2
16.5
16.5
536
2096
60.
415
.818
.014
.612
.815
.818
.015
1319
.244
.814
.80.
813
.313
.353
620
966
0.3
19.6
22.4
11.8
10.3
19.6
22.4
1210
25.6
38.4
8.4
0.0
10.4
10.4
536
2096
60.
325
.028
.69.
28.
124
.024
.010
1032
.032
.02.
00.
07.
67.
653
620
966
0.2
34.5
39.4
6.7
5.9
24.0
24.0
1010
38.4
25.6
55.6
0.0
18.1
10.4
536
2096
60.
325
.028
.69.
28.
124
.024
.010
1044
.819
.249
.263
.218
.813
.353
620
966
0.3
19.6
22.4
11.8
10.3
19.6
22.4
1210
51.2
12.8
42.8
56.8
15.6
16.5
536
2096
60.
415
.818
.014
.612
.815
.818
.015
1357
.66.
436
.450
.412
.319
.753
620
966
0.5
13.2
15.1
17.4
15.3
13.2
15.1
1715
64.0
0.0
30.0
44.0
9.1
22.9
536
2096
60.
611
.413
.010
.18.
911
.413
.010
9T
otal
133
116
137
123
Tra
nsve
rse
Spa
cing
No.
Stu
ds in
R
ow
Tru
ck D
etai
ls Unf
acto
red
Loa
dF
acto
red
Loa
d
3in
3st
uds
Mod
ular
R
atio
8
Equ
iv.
Wid
thL
oad
Fac
tors
9.8
in
Figu
re D
-1.
Fat
igue
Lim
it S
tate
und
er f
inite
loa
ding
for
the
bri
dge
loca
ted
in J
acks
on,
Ark
ansa
s on
US
67 N
orth
boun
d at
the
inte
rsec
tion
of
Sta
te H
ighw
ay 1
61.

B. Ovuoba and G.S. Prinz
SSRL – 0392-16028-22-0000 SSRL, November 2015
28
FA
TIG
UE
LIM
IT S
TA
TE
Bri
dge
Spe
cifi
cati
ons
Spa
nL
engt
hD
eck
Dep
thG
irde
r S
paci
ngD
ista
nce
To
Cur
bS
teel
B
eam
Bea
m
Dep
thA
rea
Ste
elF
lang
e W
idth
Fla
nge
Thi
ckne
ssW
eb
Thi
ckne
ssI
Ste
elD
esig
n f'
cy b
ar
ftin
ftft
inin
2in
inin
in4
psi
in1
646.
56.
51
W36
x150
35.9
44.2
120.
940.
625
9040
4000
30.4
Tra
nsfo
rmed
Sec
tion
Pro
pert
ieShe
ar S
tud
Spe
cifi
cati
ons
She
ar R
esis
tanc
e
Axl
eE
s29
000
ksi
Dia
met
er0.
75in
AD
TT
SL10
00
Fro
nt A
xle
8ki
ps7.
1ki
psE
c36
05ks
iH
eigh
t4
inn
1cy
cles
Mid
dle
Axl
e32
kips
28.5
kips
N27
,375
,000
cy
cles
Bac
k A
xle
32ki
ps28
.5ki
psA
AS
HT
O α
2.67
Pro
pose
d α
3.80
Fat
igue
Loa
d C
ombi
natio
nI
AA
SH
TO
CA
FL
3.50
ksi
Fat
igue
Fac
tor
1.5
Pro
pose
d C
AF
L6.
50ks
i
Impa
ct F
acto
r1.
15A
AS
HT
O Z
r3.
09ki
ps
Inte
rior
Gird
er D
istr
ibut
ion
Fac
tor
0.52
Pro
pose
d Z
r5.
74ki
ps
Ext
erio
r G
irder
Dis
trib
utio
n F
acto
r0.
85
Loc
atio
nR
ear
Axl
e L
ocat
ion
Mid
dle
Axl
e L
ocat
ion
Fro
nt
Axl
e L
ocat
ion
Rea
ctio
n A
Vf
Q
IV
srp
AA
SH
TO
p
Pro
pose
dN
o. S
tuds
A
AS
HT
ON
o. S
tuds
P
ropo
sed
Adj
uste
d S
paci
ng
AA
SH
TO
Adj
uste
d S
paci
ng
Pro
pose
d
Adj
uste
d N
o. S
tuds
A
AS
HT
O
Adj
uste
d N
o.
Stu
ds
Pro
pose
d
ftft
ftft
kips
kips
in3
in4
kips
/inin
inin
inin
inin
0.0
64.0
34.0
20.0
45.9
45.9
536
2096
61.
27.
914
.714
.67.
87.
914
.715
86.
457
.627
.613
.639
.539
.553
620
966
1.0
9.2
17.1
25.1
13.5
9.2
17.1
2514
12.8
51.2
21.2
7.2
33.1
33.1
536
2096
60.
811
.020
.421
.011
.311
.020
.421
1119
.244
.814
.80.
826
.626
.653
620
966
0.7
13.6
25.3
16.9
9.1
13.6
24.0
1710
25.6
38.4
8.4
0.0
20.9
20.9
536
2096
60.
517
.432
.313
.27.
117
.424
.013
1032
.032
.02.
00.
015
.215
.253
620
966
0.4
24.0
44.5
9.6
5.2
24.0
24.0
1010
38.4
25.6
55.6
0.0
36.2
20.9
536
2096
60.
517
.432
.313
.27.
117
.424
.013
1044
.819
.249
.263
.237
.526
.653
620
966
0.7
13.6
25.3
16.9
9.1
13.6
24.0
1710
51.2
12.8
42.8
56.8
31.1
33.1
536
2096
60.
811
.020
.421
.011
.311
.020
.421
1157
.66.
436
.450
.424
.739
.553
620
966
1.0
9.2
17.1
25.1
13.5
9.2
17.1
2514
64.0
0.0
30.0
44.0
18.3
45.9
536
2096
61.
27.
914
.714
.67.
87.
914
.715
8T
otal
191
103
191
113
Tra
nsve
rse
Spa
cing
No.
Stu
ds in
R
ow
Tru
ck D
etai
ls Unf
acto
red
Loa
dF
acto
red
Loa
d
3in
3st
uds
Mod
ular
R
atio
8
Equ
iv.
Wid
thL
oad
Fac
tors
9.8
in
Figu
re D
-2.
Fat
igue
Lim
it S
tate
und
er i
nfin
ite
load
ing
for
brid
ge l
ocat
ed i
n Ja
ckso
n,
Ark
ansa
s on
US
67
Nor
thbo
und
at th
e in
ters
ecti
on o
f S
tate
Hig
hway
161
.
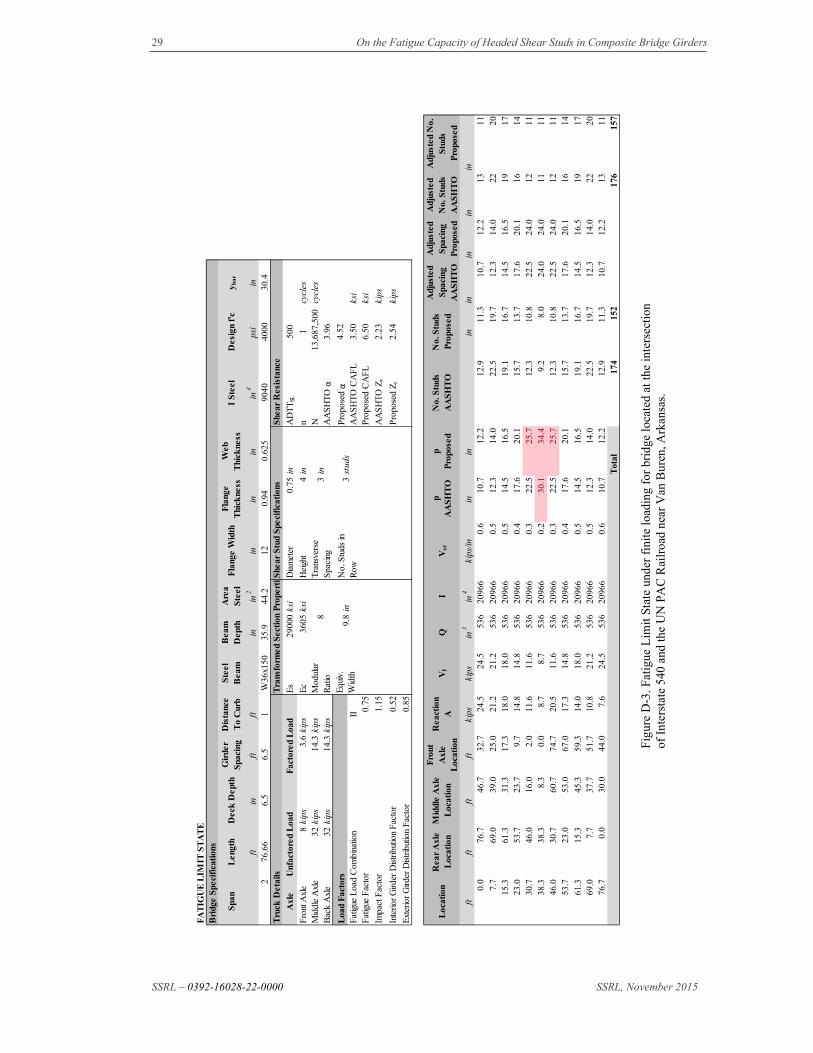
29 On the Fatigue Capacity of Headed Shear Studs in Composite Bridge Girders
SSRL – 0392-16028-22-0000 SSRL, November 2015
FA
TIG
UE
LIM
IT S
TA
TE
Bri
dge
Spe
cifi
cati
ons
Spa
nL
engt
hD
eck
Dep
thG
irde
r S
paci
ngD
ista
nce
To
Cur
bS
teel
B
eam
Bea
m
Dep
thA
rea
Ste
elF
lang
e W
idth
Fla
nge
Thi
ckne
ssW
eb
Thi
ckne
ssI
Ste
elD
esig
n f'
cy b
ar
ftin
ftft
inin
2in
inin
in4
psi
in2
76.6
66.
56.
51
W36
x150
35.9
44.2
120.
940.
625
9040
4000
30.4
Tra
nsfo
rmed
Sec
tion
Pro
pert
ieShe
ar S
tud
Spe
cifi
cati
ons
She
ar R
esis
tanc
e
Axl
eE
s29
000
ksi
Dia
met
er0.
75in
AD
TT
SL50
0
Fro
nt A
xle
8ki
ps3.
6ki
psE
c36
05ks
iH
eigh
t4
inn
1cy
cles
Mid
dle
Axl
e32
kips
14.3
kips
N13
,687
,500
cy
cles
Bac
k A
xle
32ki
ps14
.3ki
psA
AS
HT
O α
3.96
Pro
pose
d α
4.52
Fat
igue
Loa
d C
ombi
natio
nII
AA
SH
TO
CA
FL
3.50
ksi
Fat
igue
Fac
tor
0.75
Pro
pose
d C
AF
L6.
50ks
i
Impa
ct F
acto
r1.
15A
AS
HT
O Z
r2.
23ki
ps
Inte
rior
Gird
er D
istr
ibut
ion
Fac
tor
0.52
Pro
pose
d Z
r2.
54ki
ps
Ext
erio
r G
irder
Dis
trib
utio
n F
acto
r0.
85
Loc
atio
nR
ear
Axl
e L
ocat
ion
Mid
dle
Axl
e L
ocat
ion
Fro
nt
Axl
e L
ocat
ion
Rea
ctio
n A
Vf
Q
IV
srp
AA
SH
TO
p
Pro
pose
dN
o. S
tuds
A
AS
HT
ON
o. S
tuds
P
ropo
sed
Adj
uste
d S
paci
ng
AA
SH
TO
Adj
uste
d S
paci
ng
Pro
pose
d
Adj
uste
d N
o. S
tuds
A
AS
HT
O
Adj
uste
d N
o.
Stu
ds
Pro
pose
d
ftft
ftft
kips
kips
in3
in4
kips
/inin
inin
inin
inin
0.0
76.7
46.7
32.7
24.5
24.5
536
2096
60.
610
.712
.212
.911
.310
.712
.213
117.
769
.039
.025
.021
.221
.253
620
966
0.5
12.3
14.0
22.5
19.7
12.3
14.0
2220
15.3
61.3
31.3
17.3
18.0
18.0
536
2096
60.
514
.516
.519
.116
.714
.516
.519
1723
.053
.723
.79.
714
.814
.853
620
966
0.4
17.6
20.1
15.7
13.7
17.6
20.1
1614
30.7
46.0
16.0
2.0
11.6
11.6
536
2096
60.
322
.525
.712
.310
.822
.524
.012
1138
.338
.38.
30.
08.
78.
753
620
966
0.2
30.1
34.4
9.2
8.0
24.0
24.0
1111
46.0
30.7
60.7
74.7
20.5
11.6
536
2096
60.
322
.525
.712
.310
.822
.524
.012
1153
.723
.053
.067
.017
.314
.853
620
966
0.4
17.6
20.1
15.7
13.7
17.6
20.1
1614
61.3
15.3
45.3
59.3
14.0
18.0
536
2096
60.
514
.516
.519
.116
.714
.516
.519
1769
.07.
737
.751
.710
.821
.253
620
966
0.5
12.3
14.0
22.5
19.7
12.3
14.0
2220
76.7
0.0
30.0
44.0
7.6
24.5
536
2096
60.
610
.712
.212
.911
.310
.712
.213
11T
otal
174
152
176
157
Tra
nsve
rse
Spa
cing
No.
Stu
ds in
R
ow
Tru
ck D
etai
ls Unf
acto
red
Loa
dF
acto
red
Loa
d
3in
3st
uds
Mod
ular
R
atio
8
Equ
iv.
Wid
thL
oad
Fac
tors
9.8
in
Fig
ure
D-3
. Fat
igue
Lim
it S
tate
und
er f
init
e lo
adin
g fo
r br
idge
loca
ted
at th
e in
ters
ecti
on
of I
nter
stat
e 54
0 an
d th
e U
N P
AC
Rai
lroa
d ne
ar V
an B
uren
, Ark
ansa
s.
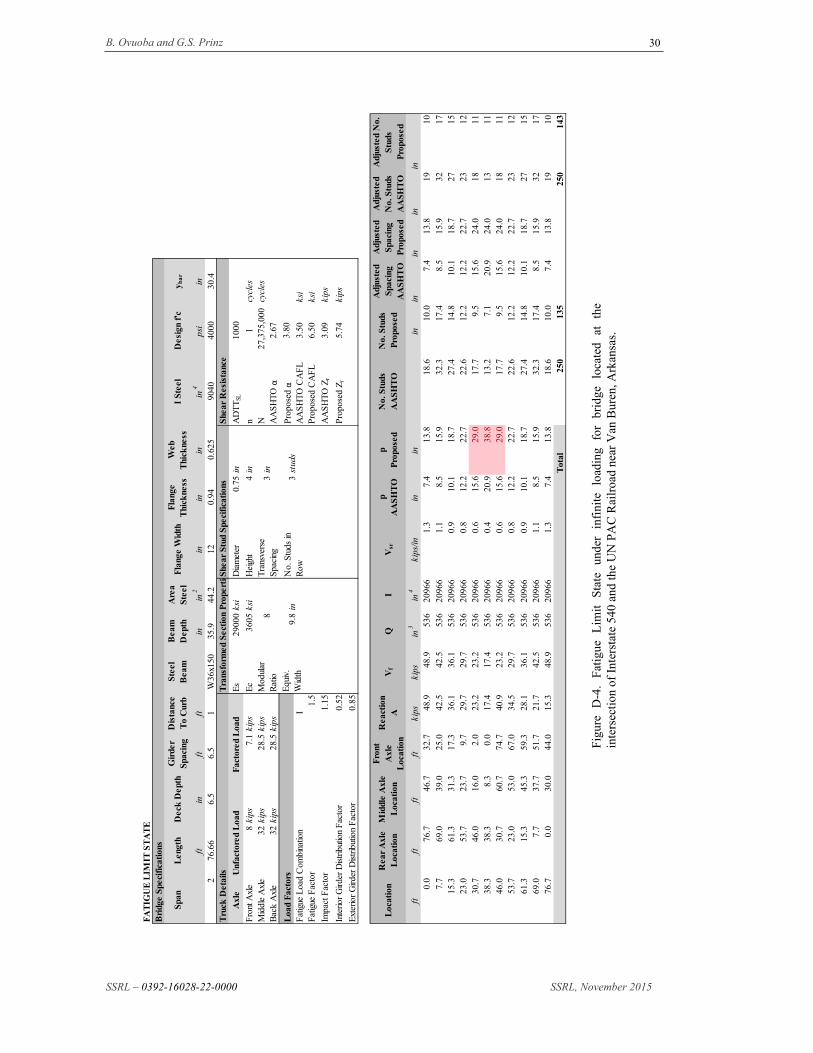
B. Ovuoba and G.S. Prinz
SSRL – 0392-16028-22-0000 SSRL, November 2015
30
FA
TIG
UE
LIM
IT S
TA
TE
Bri
dge
Spe
cifi
cati
ons
Spa
nL
engt
hD
eck
Dep
thG
irde
r S
paci
ngD
ista
nce
To
Cur
bS
teel
B
eam
Bea
m
Dep
thA
rea
Ste
elF
lang
e W
idth
Fla
nge
Thi
ckne
ssW
eb
Thi
ckne
ssI
Ste
elD
esig
n f'
cy b
ar
ftin
ftft
inin
2in
inin
in4
psi
in2
76.6
66.
56.
51
W36
x150
35.9
44.2
120.
940.
625
9040
4000
30.4
Tra
nsfo
rmed
Sec
tion
Pro
pert
ieShe
ar S
tud
Spe
cifi
cati
ons
She
ar R
esis
tanc
e
Axl
eE
s29
000
ksi
Dia
met
er0.
75in
AD
TT
SL10
00
Fro
nt A
xle
8ki
ps7.
1ki
psE
c36
05ks
iH
eigh
t4
inn
1cy
cles
Mid
dle
Axl
e32
kips
28.5
kips
N27
,375
,000
cy
cles
Bac
k A
xle
32ki
ps28
.5ki
psA
AS
HT
O α
2.67
Pro
pose
d α
3.80
Fat
igue
Loa
d C
ombi
natio
nI
AA
SH
TO
CA
FL
3.50
ksi
Fat
igue
Fac
tor
1.5
Pro
pose
d C
AF
L6.
50ks
i
Impa
ct F
acto
r1.
15A
AS
HT
O Z
r3.
09ki
ps
Inte
rior
Gird
er D
istr
ibut
ion
Fac
tor
0.52
Pro
pose
d Z
r5.
74ki
ps
Ext
erio
r G
irder
Dis
trib
utio
n F
acto
r0.
85
Loc
atio
nR
ear
Axl
e L
ocat
ion
Mid
dle
Axl
e L
ocat
ion
Fro
nt
Axl
e L
ocat
ion
Rea
ctio
n A
Vf
Q
IV
srp
AA
SH
TO
p
Pro
pose
dN
o. S
tuds
A
AS
HT
ON
o. S
tuds
P
ropo
sed
Adj
uste
d S
paci
ng
AA
SH
TO
Adj
uste
d S
paci
ng
Pro
pose
d
Adj
uste
d N
o. S
tuds
A
AS
HT
O
Adj
uste
d N
o.
Stu
ds
Pro
pose
d
ftft
ftft
kips
kips
in3
in4
kips
/inin
inin
inin
inin
0.0
76.7
46.7
32.7
48.9
48.9
536
2096
61.
37.
413
.818
.610
.07.
413
.819
107.
769
.039
.025
.042
.542
.553
620
966
1.1
8.5
15.9
32.3
17.4
8.5
15.9
3217
15.3
61.3
31.3
17.3
36.1
36.1
536
2096
60.
910
.118
.727
.414
.810
.118
.727
1523
.053
.723
.79.
729
.729
.753
620
966
0.8
12.2
22.7
22.6
12.2
12.2
22.7
2312
30.7
46.0
16.0
2.0
23.2
23.2
536
2096
60.
615
.629
.017
.79.
515
.624
.018
1138
.338
.38.
30.
017
.417
.453
620
966
0.4
20.9
38.8
13.2
7.1
20.9
24.0
1311
46.0
30.7
60.7
74.7
40.9
23.2
536
2096
60.
615
.629
.017
.79.
515
.624
.018
1153
.723
.053
.067
.034
.529
.753
620
966
0.8
12.2
22.7
22.6
12.2
12.2
22.7
2312
61.3
15.3
45.3
59.3
28.1
36.1
536
2096
60.
910
.118
.727
.414
.810
.118
.727
1569
.07.
737
.751
.721
.742
.553
620
966
1.1
8.5
15.9
32.3
17.4
8.5
15.9
3217
76.7
0.0
30.0
44.0
15.3
48.9
536
2096
61.
37.
413
.818
.610
.07.
413
.819
10T
otal
250
135
250
143
Tra
nsve
rse
Spa
cing
No.
Stu
ds in
R
ow
Tru
ck D
etai
ls Unf
acto
red
Loa
dF
acto
red
Loa
d
3in
3st
uds
Mod
ular
R
atio
8
Equ
iv.
Wid
thL
oad
Fac
tors
9.8
in
Fig
ure
D-4
. Fa
tigu
e L
imit
Sta
te
unde
r in
fini
te
load
ing
for
brid
ge
loca
ted
at
the
inte
rsec
tion
of
Inte
rsta
te 5
40 a
nd th
e U
N P
AC
Rai
lroa
d ne
ar V
an B
uren
, Ark
ansa
s.
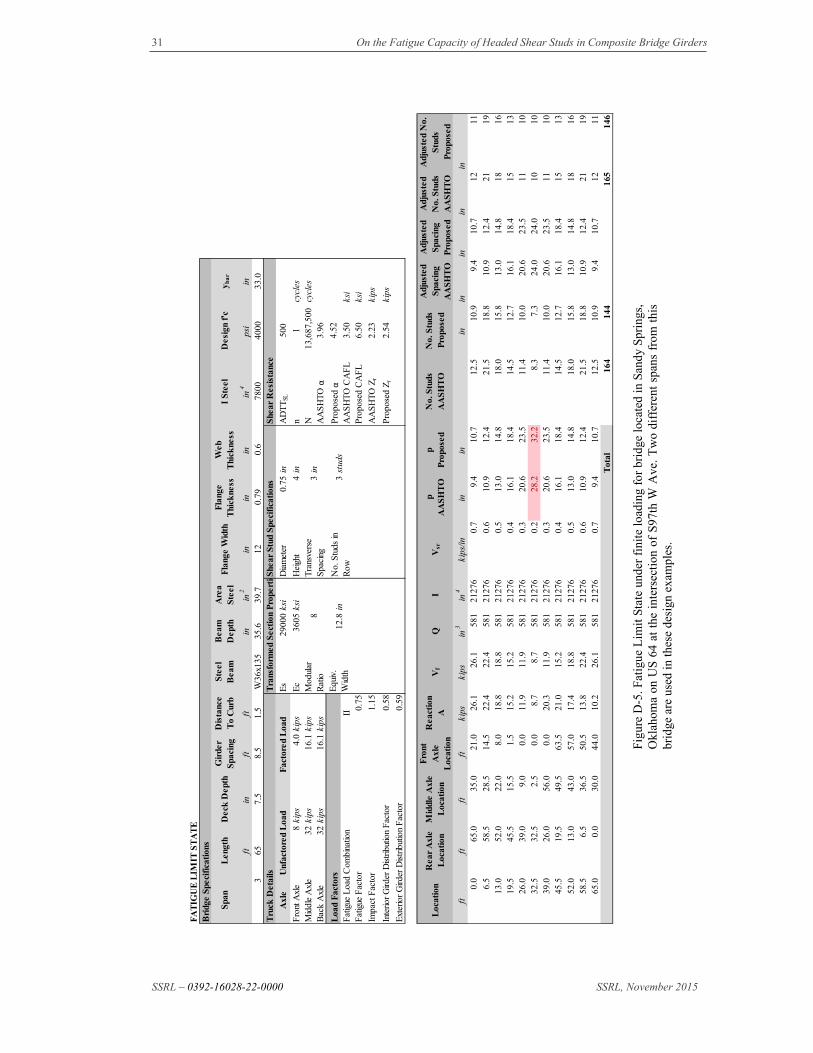
31 On the Fatigue Capacity of Headed Shear Studs in Composite Bridge Girders
SSRL – 0392-16028-22-0000 SSRL, November 2015
FA
TIG
UE
LIM
IT S
TA
TE
Bri
dge
Spe
cifi
cati
ons
Spa
nL
engt
hD
eck
Dep
thG
irde
r S
paci
ngD
ista
nce
To
Cur
bS
teel
B
eam
Bea
m
Dep
thA
rea
Ste
elF
lang
e W
idth
Fla
nge
Thi
ckne
ssW
eb
Thi
ckne
ssI
Ste
elD
esig
n f'
cy b
ar
ftin
ftft
inin
2in
inin
in4
psi
in3
657.
58.
51.
5W
36x1
3535
.639
.712
0.79
0.6
7800
4000
33.0
Tra
nsfo
rmed
Sec
tion
Pro
pert
ieShe
ar S
tud
Spe
cifi
cati
ons
She
ar R
esis
tanc
e
Axl
eE
s29
000
ksi
Dia
met
er0.
75in
AD
TT
SL50
0
Fro
nt A
xle
8ki
ps4.
0ki
psE
c36
05ks
iH
eigh
t4
inn
1cy
cles
Mid
dle
Axl
e32
kips
16.1
kips
N13
,687
,500
cy
cles
Bac
k A
xle
32ki
ps16
.1ki
psA
AS
HT
O α
3.96
Pro
pose
d α
4.52
Fat
igue
Loa
d C
ombi
natio
nII
AA
SH
TO
CA
FL
3.50
ksi
Fat
igue
Fac
tor
0.75
Pro
pose
d C
AF
L6.
50ks
i
Impa
ct F
acto
r1.
15A
AS
HT
O Z
r2.
23ki
ps
Inte
rior
Gird
er D
istr
ibut
ion
Fac
tor
0.58
Pro
pose
d Z
r2.
54ki
ps
Ext
erio
r G
irder
Dis
trib
utio
n F
acto
r0.
59
Loc
atio
nR
ear
Axl
e L
ocat
ion
Mid
dle
Axl
e L
ocat
ion
Fro
nt
Axl
e L
ocat
ion
Rea
ctio
n A
Vf
Q
IV
srp
AA
SH
TO
p
Pro
pose
dN
o. S
tuds
A
AS
HT
ON
o. S
tuds
P
ropo
sed
Adj
uste
d S
paci
ng
AA
SH
TO
Adj
uste
d S
paci
ng
Pro
pose
d
Adj
uste
d N
o. S
tuds
A
AS
HT
O
Adj
uste
d N
o.
Stu
ds
Pro
pose
d
ftft
ftft
kips
kips
in3
in4
kips
/inin
inin
inin
inin
0.0
65.0
35.0
21.0
26.1
26.1
581
2127
60.
79.
410
.712
.510
.99.
410
.712
116.
558
.528
.514
.522
.422
.458
121
276
0.6
10.9
12.4
21.5
18.8
10.9
12.4
2119
13.0
52.0
22.0
8.0
18.8
18.8
581
2127
60.
513
.014
.818
.015
.813
.014
.818
1619
.545
.515
.51.
515
.215
.258
121
276
0.4
16.1
18.4
14.5
12.7
16.1
18.4
1513
26.0
39.0
9.0
0.0
11.9
11.9
581
2127
60.
320
.623
.511
.410
.020
.623
.511
1032
.532
.52.
50.
08.
78.
758
121
276
0.2
28.2
32.2
8.3
7.3
24.0
24.0
1010
39.0
26.0
56.0
0.0
20.3
11.9
581
2127
60.
320
.623
.511
.410
.020
.623
.511
1045
.519
.549
.563
.521
.015
.258
121
276
0.4
16.1
18.4
14.5
12.7
16.1
18.4
1513
52.0
13.0
43.0
57.0
17.4
18.8
581
2127
60.
513
.014
.818
.015
.813
.014
.818
1658
.56.
536
.550
.513
.822
.458
121
276
0.6
10.9
12.4
21.5
18.8
10.9
12.4
2119
65.0
0.0
30.0
44.0
10.2
26.1
581
2127
60.
79.
410
.712
.510
.99.
410
.712
11T
otal
164
144
165
146
Tra
nsve
rse
Spa
cing
No.
Stu
ds in
R
ow
Tru
ck D
etai
ls Unf
acto
red
Loa
dF
acto
red
Loa
d
3in
3st
uds
Mod
ular
R
atio
8
Equ
iv.
Wid
thL
oad
Fac
tors
12.8
in
Figu
re D
-5. F
atig
ue L
imit
Sta
te u
nder
fin
ite
load
ing
for
brid
ge lo
cate
d in
San
dy S
prin
gs,
Okl
ahom
a on
US
64
at t
he i
nter
sect
ion
of S
97th
W A
ve.
Tw
o di
ffer
ent
span
s fr
om t
his
brid
ge a
re u
sed
in th
ese
desi
gn e
xam
ples
.
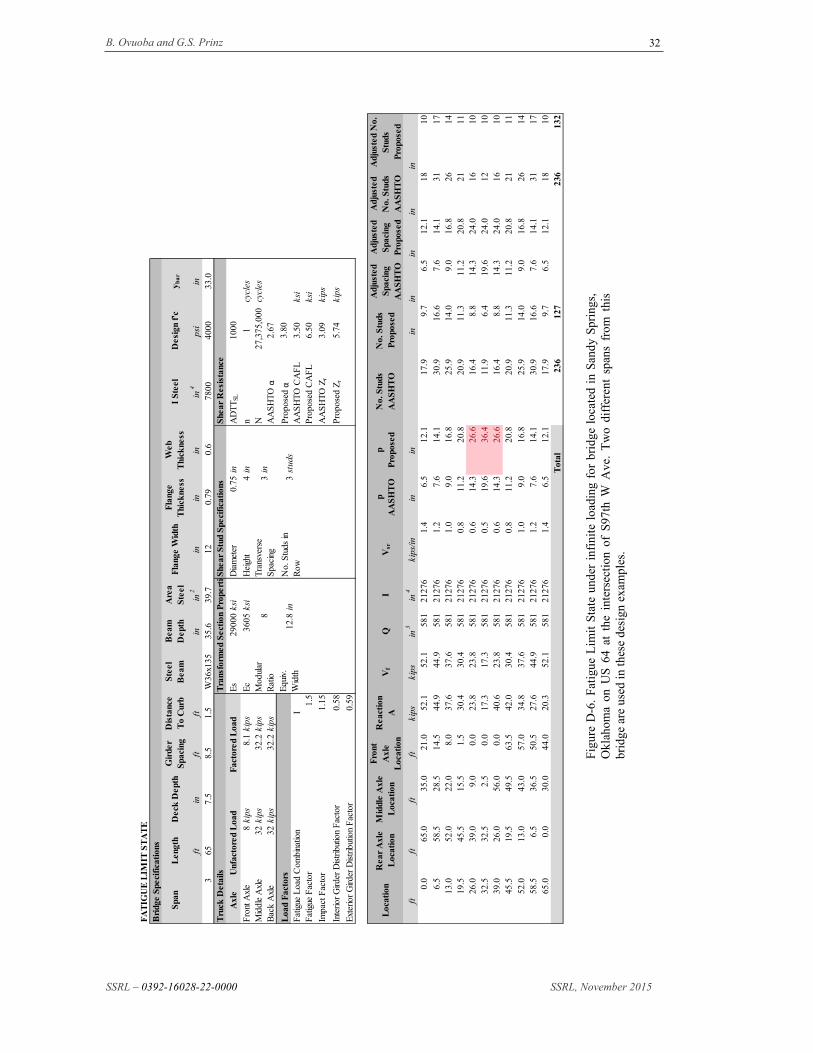
B. Ovuoba and G.S. Prinz
SSRL – 0392-16028-22-0000 SSRL, November 2015
32
FA
TIG
UE
LIM
IT S
TA
TE
Bri
dge
Spe
cifi
cati
ons
Spa
nL
engt
hD
eck
Dep
thG
irde
r S
paci
ngD
ista
nce
To
Cur
bS
teel
B
eam
Bea
m
Dep
thA
rea
Ste
elF
lang
e W
idth
Fla
nge
Thi
ckne
ssW
eb
Thi
ckne
ssI
Ste
elD
esig
n f'
cy b
ar
ftin
ftft
inin
2in
inin
in4
psi
in3
657.
58.
51.
5W
36x1
3535
.639
.712
0.79
0.6
7800
4000
33.0
Tra
nsfo
rmed
Sec
tion
Pro
pert
ieShe
ar S
tud
Spe
cifi
cati
ons
She
ar R
esis
tanc
e
Axl
eE
s29
000
ksi
Dia
met
er0.
75in
AD
TT
SL10
00
Fro
nt A
xle
8ki
ps8.
1ki
psE
c36
05ks
iH
eigh
t4
inn
1cy
cles
Mid
dle
Axl
e32
kips
32.2
kips
N27
,375
,000
cy
cles
Bac
k A
xle
32ki
ps32
.2ki
psA
AS
HT
O α
2.67
Pro
pose
d α
3.80
Fat
igue
Loa
d C
ombi
natio
nI
AA
SH
TO
CA
FL
3.50
ksi
Fat
igue
Fac
tor
1.5
Pro
pose
d C
AF
L6.
50ks
i
Impa
ct F
acto
r1.
15A
AS
HT
O Z
r3.
09ki
ps
Inte
rior
Gird
er D
istr
ibut
ion
Fac
tor
0.58
Pro
pose
d Z
r5.
74ki
ps
Ext
erio
r G
irder
Dis
trib
utio
n F
acto
r0.
59
Loc
atio
nR
ear
Axl
e L
ocat
ion
Mid
dle
Axl
e L
ocat
ion
Fro
nt
Axl
e L
ocat
ion
Rea
ctio
n A
Vf
Q
IV
srp
AA
SH
TO
p
Pro
pose
dN
o. S
tuds
A
AS
HT
ON
o. S
tuds
P
ropo
sed
Adj
uste
d S
paci
ng
AA
SH
TO
Adj
uste
d S
paci
ng
Pro
pose
d
Adj
uste
d N
o. S
tuds
A
AS
HT
O
Adj
uste
d N
o.
Stu
ds
Pro
pose
d
ftft
ftft
kips
kips
in3
in4
kips
/inin
inin
inin
inin
0.0
65.0
35.0
21.0
52.1
52.1
581
2127
61.
46.
512
.117
.99.
76.
512
.118
106.
558
.528
.514
.544
.944
.958
121
276
1.2
7.6
14.1
30.9
16.6
7.6
14.1
3117
13.0
52.0
22.0
8.0
37.6
37.6
581
2127
61.
09.
016
.825
.914
.09.
016
.826
1419
.545
.515
.51.
530
.430
.458
121
276
0.8
11.2
20.8
20.9
11.3
11.2
20.8
2111
26.0
39.0
9.0
0.0
23.8
23.8
581
2127
60.
614
.326
.616
.48.
814
.324
.016
1032
.532
.52.
50.
017
.317
.358
121
276
0.5
19.6
36.4
11.9
6.4
19.6
24.0
1210
39.0
26.0
56.0
0.0
40.6
23.8
581
2127
60.
614
.326
.616
.48.
814
.324
.016
1045
.519
.549
.563
.542
.030
.458
121
276
0.8
11.2
20.8
20.9
11.3
11.2
20.8
2111
52.0
13.0
43.0
57.0
34.8
37.6
581
2127
61.
09.
016
.825
.914
.09.
016
.826
1458
.56.
536
.550
.527
.644
.958
121
276
1.2
7.6
14.1
30.9
16.6
7.6
14.1
3117
65.0
0.0
30.0
44.0
20.3
52.1
581
2127
61.
46.
512
.117
.99.
76.
512
.118
10T
otal
236
127
236
132
Tra
nsve
rse
Spa
cing
No.
Stu
ds in
R
ow
Tru
ck D
etai
ls Unf
acto
red
Loa
dF
acto
red
Loa
d
3in
3st
uds
Mod
ular
R
atio
8
Equ
iv.
Wid
thL
oad
Fac
tors
12.8
in
Fig
ure
D-6
. F
atig
ue L
imit
Sta
te u
nder
inf
init
e lo
adin
g fo
r br
idge
loc
ated
in
Sand
y Sp
ring
s,
Okl
ahom
a on
US
64
at t
he i
nter
sect
ion
of S
97th
W A
ve.
Tw
o di
ffer
ent
span
s fr
om t
his
brid
ge a
re u
sed
in th
ese
desi
gn e
xam
ples
.
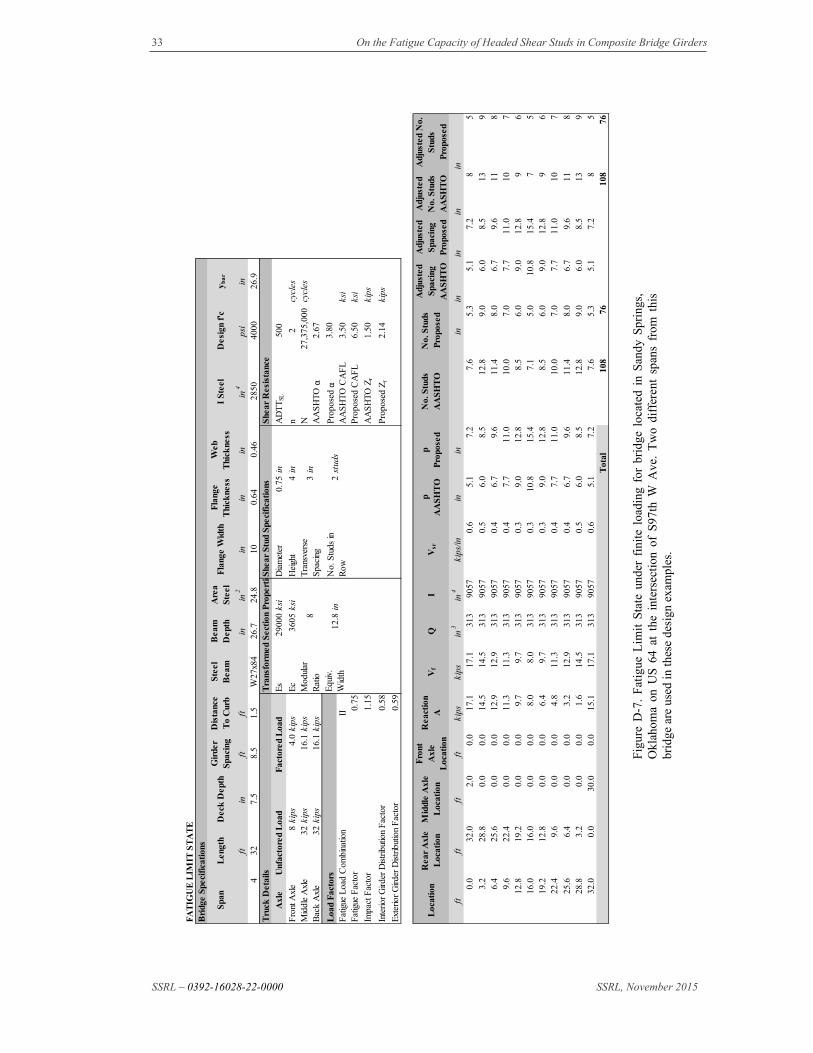
33 On the Fatigue Capacity of Headed Shear Studs in Composite Bridge Girders
SSRL – 0392-16028-22-0000 SSRL, November 2015
FA
TIG
UE
LIM
IT S
TA
TE
Bri
dge
Spe
cifi
cati
ons
Spa
nL
engt
hD
eck
Dep
thG
irde
r S
paci
ngD
ista
nce
To
Cur
bS
teel
B
eam
Bea
m
Dep
thA
rea
Ste
elF
lang
e W
idth
Fla
nge
Thi
ckne
ssW
eb
Thi
ckne
ssI
Ste
elD
esig
n f'
cy b
ar
ftin
ftft
inin
2in
inin
in4
psi
in4
327.
58.
51.
5W
27x8
426
.724
.810
0.64
0.46
2850
4000
26.9
Tra
nsfo
rmed
Sec
tion
Pro
pert
ieShe
ar S
tud
Spe
cifi
cati
ons
She
ar R
esis
tanc
e
Axl
eE
s29
000
ksi
Dia
met
er0.
75in
AD
TT
SL50
0
Fro
nt A
xle
8ki
ps4.
0ki
psE
c36
05ks
iH
eigh
t4
inn
2cy
cles
Mid
dle
Axl
e32
kips
16.1
kips
N27
,375
,000
cy
cles
Bac
k A
xle
32ki
ps16
.1ki
psA
AS
HT
O α
2.67
Pro
pose
d α
3.80
Fat
igue
Loa
d C
ombi
natio
nII
AA
SH
TO
CA
FL
3.50
ksi
Fat
igue
Fac
tor
0.75
Pro
pose
d C
AF
L6.
50ks
i
Impa
ct F
acto
r1.
15A
AS
HT
O Z
r1.
50ki
ps
Inte
rior
Gird
er D
istr
ibut
ion
Fac
tor
0.58
Pro
pose
d Z
r2.
14ki
ps
Ext
erio
r G
irder
Dis
trib
utio
n F
acto
r0.
59
Loc
atio
nR
ear
Axl
e L
ocat
ion
Mid
dle
Axl
e L
ocat
ion
Fro
nt
Axl
e L
ocat
ion
Rea
ctio
n A
Vf
Q
IV
srp
AA
SH
TO
p
Pro
pose
dN
o. S
tuds
A
AS
HT
ON
o. S
tuds
P
ropo
sed
Adj
uste
d S
paci
ng
AA
SH
TO
Adj
uste
d S
paci
ng
Pro
pose
d
Adj
uste
d N
o. S
tuds
A
AS
HT
O
Adj
uste
d N
o.
Stu
ds
Pro
pose
d
ftft
ftft
kips
kips
in3
in4
kips
/inin
inin
inin
inin
0.0
32.0
2.0
0.0
17.1
17.1
313
9057
0.6
5.1
7.2
7.6
5.3
5.1
7.2
85
3.2
28.8
0.0
0.0
14.5
14.5
313
9057
0.5
6.0
8.5
12.8
9.0
6.0
8.5
139
6.4
25.6
0.0
0.0
12.9
12.9
313
9057
0.4
6.7
9.6
11.4
8.0
6.7
9.6
118
9.6
22.4
0.0
0.0
11.3
11.3
313
9057
0.4
7.7
11.0
10.0
7.0
7.7
11.0
107
12.8
19.2
0.0
0.0
9.7
9.7
313
9057
0.3
9.0
12.8
8.5
6.0
9.0
12.8
96
16.0
16.0
0.0
0.0
8.0
8.0
313
9057
0.3
10.8
15.4
7.1
5.0
10.8
15.4
75
19.2
12.8
0.0
0.0
6.4
9.7
313
9057
0.3
9.0
12.8
8.5
6.0
9.0
12.8
96
22.4
9.6
0.0
0.0
4.8
11.3
313
9057
0.4
7.7
11.0
10.0
7.0
7.7
11.0
107
25.6
6.4
0.0
0.0
3.2
12.9
313
9057
0.4
6.7
9.6
11.4
8.0
6.7
9.6
118
28.8
3.2
0.0
0.0
1.6
14.5
313
9057
0.5
6.0
8.5
12.8
9.0
6.0
8.5
139
32.0
0.0
30.0
0.0
15.1
17.1
313
9057
0.6
5.1
7.2
7.6
5.3
5.1
7.2
85
Tot
al10
876
108
76
Tra
nsve
rse
Spa
cing
No.
Stu
ds in
R
ow
Tru
ck D
etai
ls Unf
acto
red
Loa
dF
acto
red
Loa
d
3in
2st
uds
Mod
ular
R
atio
8
Equ
iv.
Wid
thL
oad
Fac
tors
12.8
in
Fig
ure
D-7
. F
atig
ue L
imit
Sta
te u
nder
fin
ite
load
ing
for
brid
ge l
ocat
ed i
n S
andy
Spr
ings
, O
klah
oma
on U
S 6
4 at
the
int
erse
ctio
n of
S97
th W
Ave
. T
wo
diff
eren
t sp
ans
from
thi
s br
idge
are
use
d in
thes
e de
sign
exa
mpl
es.
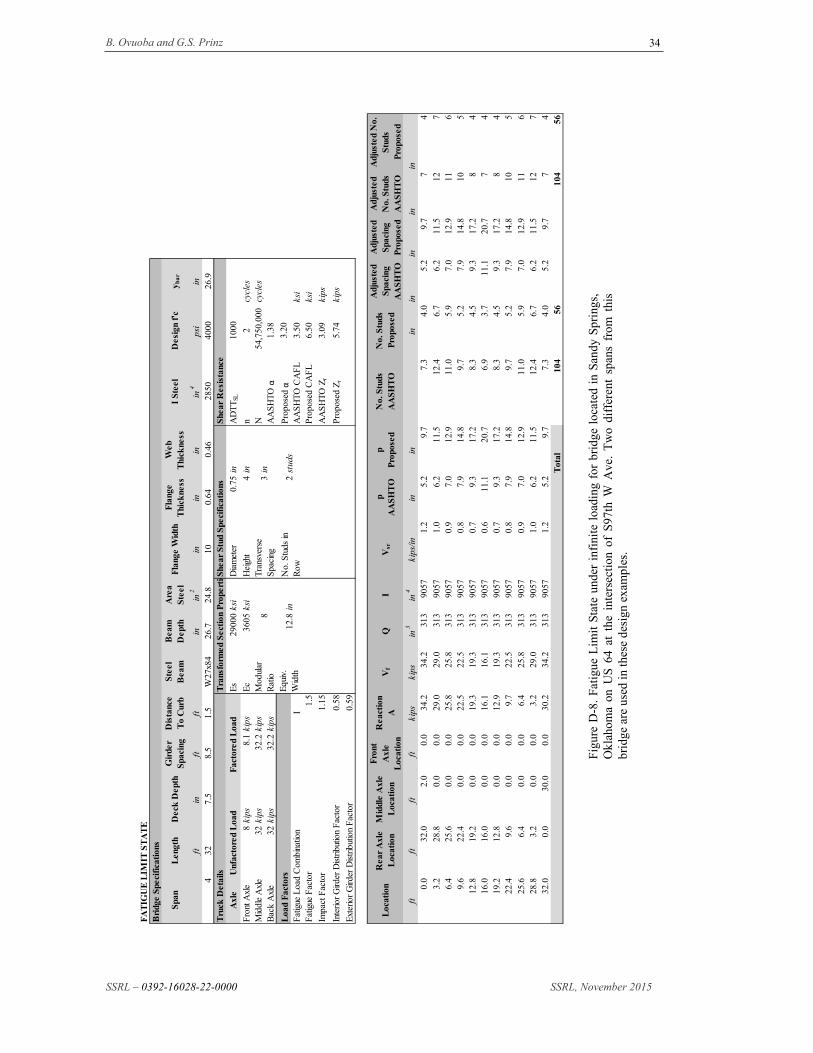
B. Ovuoba and G.S. Prinz
SSRL – 0392-16028-22-0000 SSRL, November 2015
34
FA
TIG
UE
LIM
IT S
TA
TE
Bri
dge
Spe
cifi
cati
ons
Spa
nL
engt
hD
eck
Dep
thG
irde
r S
paci
ngD
ista
nce
To
Cur
bS
teel
B
eam
Bea
m
Dep
thA
rea
Ste
elF
lang
e W
idth
Fla
nge
Thi
ckne
ssW
eb
Thi
ckne
ssI
Ste
elD
esig
n f'
cy b
ar
ftin
ftft
inin
2in
inin
in4
psi
in4
327.
58.
51.
5W
27x8
426
.724
.810
0.64
0.46
2850
4000
26.9
Tra
nsfo
rmed
Sec
tion
Pro
pert
ieShe
ar S
tud
Spe
cifi
cati
ons
She
ar R
esis
tanc
e
Axl
eE
s29
000
ksi
Dia
met
er0.
75in
AD
TT
SL10
00
Fro
nt A
xle
8ki
ps8.
1ki
psE
c36
05ks
iH
eigh
t4
inn
2cy
cles
Mid
dle
Axl
e32
kips
32.2
kips
N54
,750
,000
cy
cles
Bac
k A
xle
32ki
ps32
.2ki
psA
AS
HT
O α
1.38
Pro
pose
d α
3.20
Fat
igue
Loa
d C
ombi
natio
nI
AA
SH
TO
CA
FL
3.50
ksi
Fat
igue
Fac
tor
1.5
Pro
pose
d C
AF
L6.
50ks
i
Impa
ct F
acto
r1.
15A
AS
HT
O Z
r3.
09ki
ps
Inte
rior
Gird
er D
istr
ibut
ion
Fac
tor
0.58
Pro
pose
d Z
r5.
74ki
ps
Ext
erio
r G
irder
Dis
trib
utio
n F
acto
r0.
59
Loc
atio
nR
ear
Axl
e L
ocat
ion
Mid
dle
Axl
e L
ocat
ion
Fro
nt
Axl
e L
ocat
ion
Rea
ctio
n A
Vf
Q
IV
srp
AA
SH
TO
p
Pro
pose
dN
o. S
tuds
A
AS
HT
ON
o. S
tuds
P
ropo
sed
Adj
uste
d S
paci
ng
AA
SH
TO
Adj
uste
d S
paci
ng
Pro
pose
d
Adj
uste
d N
o. S
tuds
A
AS
HT
O
Adj
uste
d N
o.
Stu
ds
Pro
pose
d
ftft
ftft
kips
kips
in3
in4
kips
/inin
inin
inin
inin
0.0
32.0
2.0
0.0
34.2
34.2
313
9057
1.2
5.2
9.7
7.3
4.0
5.2
9.7
74
3.2
28.8
0.0
0.0
29.0
29.0
313
9057
1.0
6.2
11.5
12.4
6.7
6.2
11.5
127
6.4
25.6
0.0
0.0
25.8
25.8
313
9057
0.9
7.0
12.9
11.0
5.9
7.0
12.9
116
9.6
22.4
0.0
0.0
22.5
22.5
313
9057
0.8
7.9
14.8
9.7
5.2
7.9
14.8
105
12.8
19.2
0.0
0.0
19.3
19.3
313
9057
0.7
9.3
17.2
8.3
4.5
9.3
17.2
84
16.0
16.0
0.0
0.0
16.1
16.1
313
9057
0.6
11.1
20.7
6.9
3.7
11.1
20.7
74
19.2
12.8
0.0
0.0
12.9
19.3
313
9057
0.7
9.3
17.2
8.3
4.5
9.3
17.2
84
22.4
9.6
0.0
0.0
9.7
22.5
313
9057
0.8
7.9
14.8
9.7
5.2
7.9
14.8
105
25.6
6.4
0.0
0.0
6.4
25.8
313
9057
0.9
7.0
12.9
11.0
5.9
7.0
12.9
116
28.8
3.2
0.0
0.0
3.2
29.0
313
9057
1.0
6.2
11.5
12.4
6.7
6.2
11.5
127
32.0
0.0
30.0
0.0
30.2
34.2
313
9057
1.2
5.2
9.7
7.3
4.0
5.2
9.7
74
Tot
al10
456
104
56
Tra
nsve
rse
Spa
cing
No.
Stu
ds in
R
ow
Tru
ck D
etai
ls Unf
acto
red
Loa
dF
acto
red
Loa
d
3in
2st
uds
Mod
ular
R
atio
8
Equ
iv.
Wid
thL
oad
Fac
tors
12.8
in
Figu
re D
-8.
Fati
gue
Lim
it S
tate
und
er i
nfin
ite
load
ing
for
brid
ge l
ocat
ed i
n Sa
ndy
Spr
ings
, O
klah
oma
on U
S 6
4 at
the
int
erse
ctio
n of
S97
th W
Ave
. T
wo
diff
eren
t sp
ans
from
thi
s br
idge
are
use
d in
thes
e de
sign
exa
mpl
es.
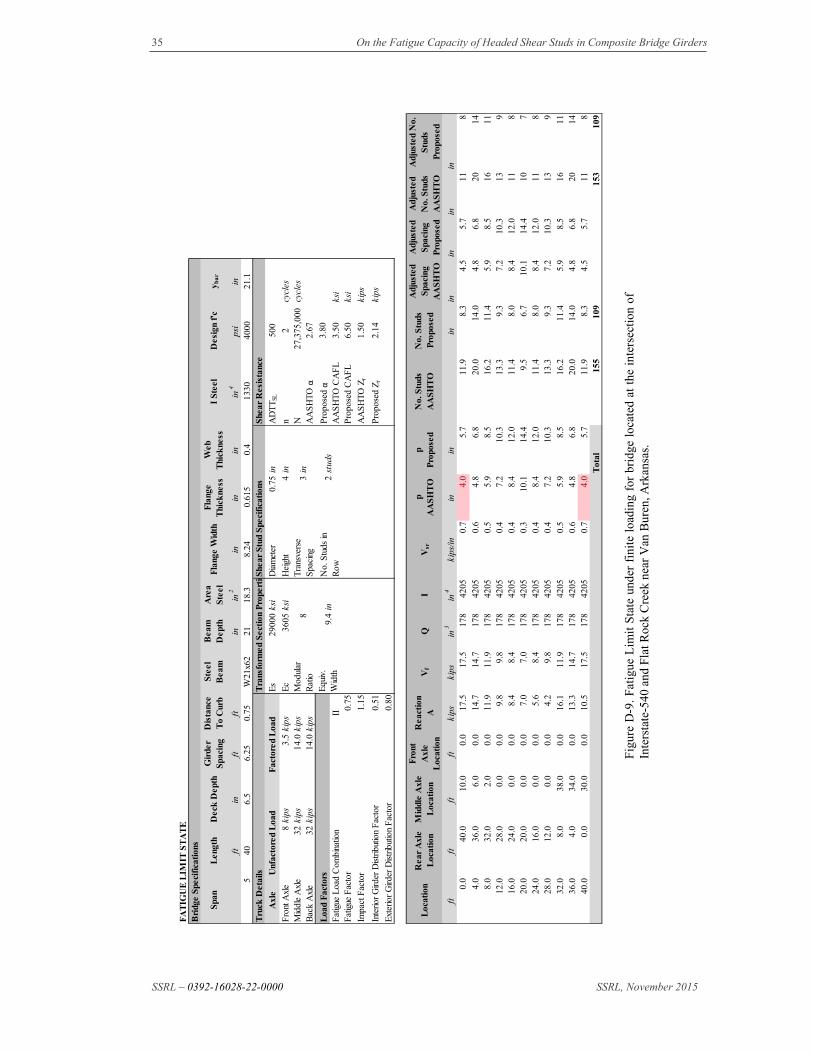
35 On the Fatigue Capacity of Headed Shear Studs in Composite Bridge Girders
SSRL – 0392-16028-22-0000 SSRL, November 2015
FA
TIG
UE
LIM
IT S
TA
TE
Bri
dge
Spe
cifi
cati
ons
Spa
nL
engt
hD
eck
Dep
thG
irde
r S
paci
ngD
ista
nce
To
Cur
bS
teel
B
eam
Bea
m
Dep
thA
rea
Ste
elF
lang
e W
idth
Fla
nge
Thi
ckne
ssW
eb
Thi
ckne
ssI
Ste
elD
esig
n f'
cy b
ar
ftin
ftft
inin
2in
inin
in4
psi
in5
406.
56.
250.
75W
21x6
221
18.3
8.24
0.61
50.
413
3040
0021
.1T
rans
form
ed S
ecti
on P
rope
rtieS
hear
Stu
d S
peci
fica
tion
sS
hear
Res
ista
nce
Axl
eE
s29
000
ksi
Dia
met
er0.
75in
AD
TT
SL50
0
Fro
nt A
xle
8ki
ps3.
5ki
psE
c36
05ks
iH
eigh
t4
inn
2cy
cles
Mid
dle
Axl
e32
kips
14.0
kips
N27
,375
,000
cy
cles
Bac
k A
xle
32ki
ps14
.0ki
psA
AS
HT
O α
2.67
Pro
pose
d α
3.80
Fat
igue
Loa
d C
ombi
natio
nII
AA
SH
TO
CA
FL
3.50
ksi
Fat
igue
Fac
tor
0.75
Pro
pose
d C
AF
L6.
50ks
i
Impa
ct F
acto
r1.
15A
AS
HT
O Z
r1.
50ki
ps
Inte
rior
Gird
er D
istr
ibut
ion
Fac
tor
0.51
Pro
pose
d Z
r2.
14ki
ps
Ext
erio
r G
irder
Dis
trib
utio
n F
acto
r0.
80
Loc
atio
nR
ear
Axl
e L
ocat
ion
Mid
dle
Axl
e L
ocat
ion
Fro
nt
Axl
e L
ocat
ion
Rea
ctio
n A
Vf
Q
IV
srp
AA
SH
TO
p
Pro
pose
dN
o. S
tuds
A
AS
HT
ON
o. S
tuds
P
ropo
sed
Adj
uste
d S
paci
ng
AA
SH
TO
Adj
uste
d S
paci
ng
Pro
pose
d
Adj
uste
d N
o. S
tuds
A
AS
HT
O
Adj
uste
d N
o.
Stu
ds
Pro
pose
d
ftft
ftft
kips
kips
in3
in4
kips
/inin
inin
inin
inin
0.0
40.0
10.0
0.0
17.5
17.5
178
4205
0.7
4.0
5.7
11.9
8.3
4.5
5.7
118
4.0
36.0
6.0
0.0
14.7
14.7
178
4205
0.6
4.8
6.8
20.0
14.0
4.8
6.8
2014
8.0
32.0
2.0
0.0
11.9
11.9
178
4205
0.5
5.9
8.5
16.2
11.4
5.9
8.5
1611
12.0
28.0
0.0
0.0
9.8
9.8
178
4205
0.4
7.2
10.3
13.3
9.3
7.2
10.3
139
16.0
24.0
0.0
0.0
8.4
8.4
178
4205
0.4
8.4
12.0
11.4
8.0
8.4
12.0
118
20.0
20.0
0.0
0.0
7.0
7.0
178
4205
0.3
10.1
14.4
9.5
6.7
10.1
14.4
107
24.0
16.0
0.0
0.0
5.6
8.4
178
4205
0.4
8.4
12.0
11.4
8.0
8.4
12.0
118
28.0
12.0
0.0
0.0
4.2
9.8
178
4205
0.4
7.2
10.3
13.3
9.3
7.2
10.3
139
32.0
8.0
38.0
0.0
16.1
11.9
178
4205
0.5
5.9
8.5
16.2
11.4
5.9
8.5
1611
36.0
4.0
34.0
0.0
13.3
14.7
178
4205
0.6
4.8
6.8
20.0
14.0
4.8
6.8
2014
40.0
0.0
30.0
0.0
10.5
17.5
178
4205
0.7
4.0
5.7
11.9
8.3
4.5
5.7
118
Tot
al15
510
915
310
9
Tra
nsve
rse
Spa
cing
No.
Stu
ds in
R
ow
Tru
ck D
etai
ls Unf
acto
red
Loa
dF
acto
red
Loa
d
3in
2st
uds
Mod
ular
R
atio
8
Equ
iv.
Wid
thL
oad
Fac
tors
9.4
in
Fig
ure
D-9
. Fat
igue
Lim
it S
tate
und
er f
init
e lo
adin
g fo
r br
idge
loc
ated
at
the
inte
rsec
tion
of
Inte
rsta
te-5
40 a
nd F
lat R
ock
Cre
ek n
ear
Van
Bur
en, A
rkan
sas.
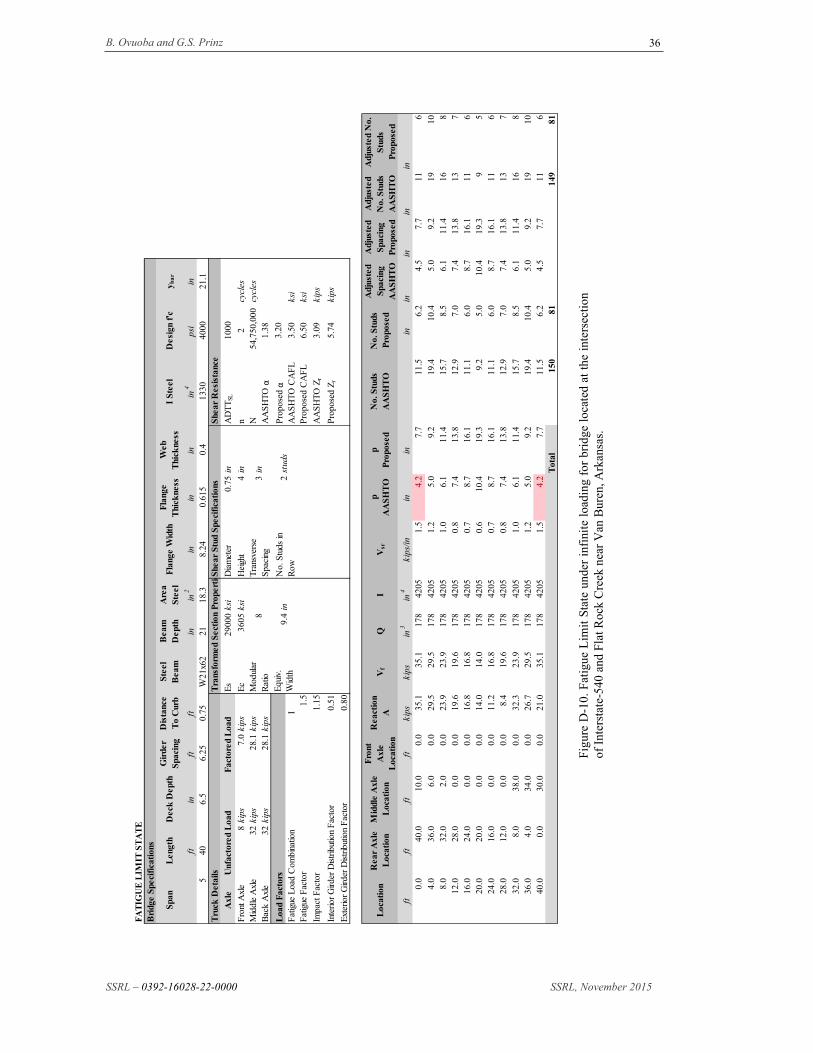
B. Ovuoba and G.S. Prinz
SSRL – 0392-16028-22-0000 SSRL, November 2015
36
FA
TIG
UE
LIM
IT S
TA
TE
Bri
dge
Spe
cifi
cati
ons
Spa
nL
engt
hD
eck
Dep
thG
irde
r S
paci
ngD
ista
nce
To
Cur
bS
teel
B
eam
Bea
m
Dep
thA
rea
Ste
elF
lang
e W
idth
Fla
nge
Thi
ckne
ssW
eb
Thi
ckne
ssI
Ste
elD
esig
n f'
cy b
ar
ftin
ftft
inin
2in
inin
in4
psi
in5
406.
56.
250.
75W
21x6
221
18.3
8.24
0.61
50.
413
3040
0021
.1T
rans
form
ed S
ecti
on P
rope
rtieS
hear
Stu
d S
peci
fica
tion
sS
hear
Res
ista
nce
Axl
eE
s29
000
ksi
Dia
met
er0.
75in
AD
TT
SL10
00
Fro
nt A
xle
8ki
ps7.
0ki
psE
c36
05ks
iH
eigh
t4
inn
2cy
cles
Mid
dle
Axl
e32
kips
28.1
kips
N54
,750
,000
cy
cles
Bac
k A
xle
32ki
ps28
.1ki
psA
AS
HT
O α
1.38
Pro
pose
d α
3.20
Fat
igue
Loa
d C
ombi
natio
nI
AA
SH
TO
CA
FL
3.50
ksi
Fat
igue
Fac
tor
1.5
Pro
pose
d C
AF
L6.
50ks
i
Impa
ct F
acto
r1.
15A
AS
HT
O Z
r3.
09ki
ps
Inte
rior
Gird
er D
istr
ibut
ion
Fac
tor
0.51
Pro
pose
d Z
r5.
74ki
ps
Ext
erio
r G
irder
Dis
trib
utio
n F
acto
r0.
80
Loc
atio
nR
ear
Axl
e L
ocat
ion
Mid
dle
Axl
e L
ocat
ion
Fro
nt
Axl
e L
ocat
ion
Rea
ctio
n A
Vf
Q
IV
srp
AA
SH
TO
p
Pro
pose
dN
o. S
tuds
A
AS
HT
ON
o. S
tuds
P
ropo
sed
Adj
uste
d S
paci
ng
AA
SH
TO
Adj
uste
d S
paci
ng
Pro
pose
d
Adj
uste
d N
o. S
tuds
A
AS
HT
O
Adj
uste
d N
o.
Stu
ds
Pro
pose
d
ftft
ftft
kips
kips
in3
in4
kips
/inin
inin
inin
inin
0.0
40.0
10.0
0.0
35.1
35.1
178
4205
1.5
4.2
7.7
11.5
6.2
4.5
7.7
116
4.0
36.0
6.0
0.0
29.5
29.5
178
4205
1.2
5.0
9.2
19.4
10.4
5.0
9.2
1910
8.0
32.0
2.0
0.0
23.9
23.9
178
4205
1.0
6.1
11.4
15.7
8.5
6.1
11.4
168
12.0
28.0
0.0
0.0
19.6
19.6
178
4205
0.8
7.4
13.8
12.9
7.0
7.4
13.8
137
16.0
24.0
0.0
0.0
16.8
16.8
178
4205
0.7
8.7
16.1
11.1
6.0
8.7
16.1
116
20.0
20.0
0.0
0.0
14.0
14.0
178
4205
0.6
10.4
19.3
9.2
5.0
10.4
19.3
95
24.0
16.0
0.0
0.0
11.2
16.8
178
4205
0.7
8.7
16.1
11.1
6.0
8.7
16.1
116
28.0
12.0
0.0
0.0
8.4
19.6
178
4205
0.8
7.4
13.8
12.9
7.0
7.4
13.8
137
32.0
8.0
38.0
0.0
32.3
23.9
178
4205
1.0
6.1
11.4
15.7
8.5
6.1
11.4
168
36.0
4.0
34.0
0.0
26.7
29.5
178
4205
1.2
5.0
9.2
19.4
10.4
5.0
9.2
1910
40.0
0.0
30.0
0.0
21.0
35.1
178
4205
1.5
4.2
7.7
11.5
6.2
4.5
7.7
116
Tot
al15
081
149
81
Tra
nsve
rse
Spa
cing
No.
Stu
ds in
R
ow
Tru
ck D
etai
ls Unf
acto
red
Loa
dF
acto
red
Loa
d
3in
2st
uds
Mod
ular
R
atio
8
Equ
iv.
Wid
thL
oad
Fac
tors
9.4
in
Figu
re D
-10.
Fat
igue
Lim
it S
tate
und
er i
nfin
ite
load
ing
for
brid
ge l
ocat
ed a
t th
e in
ters
ecti
on
of I
nter
stat
e-54
0 an
d F
lat R
ock
Cre
ek n
ear
Van
Bur
en, A
rkan
sas.
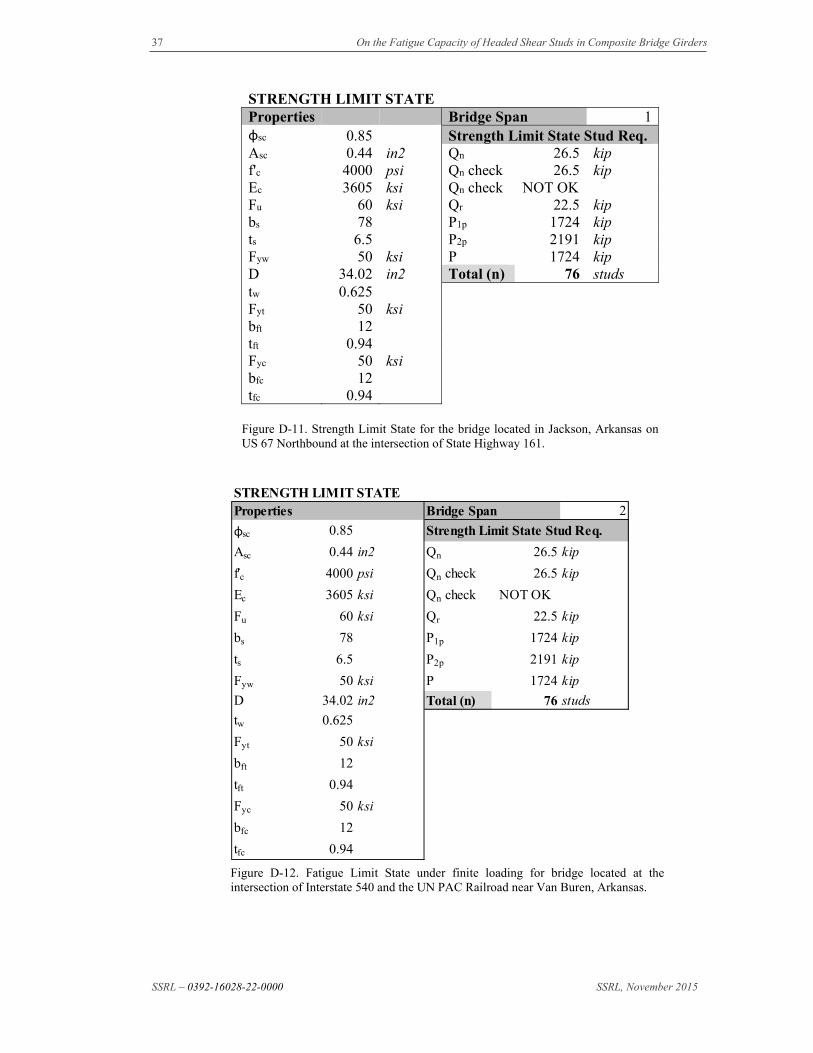
37 On the Fatigue Capacity of Headed Shear Studs in Composite Bridge Girders
SSRL – 0392-16028-22-0000 SSRL, November 2015
STRENGTH LIMIT STATEProperties Bridge Span 1 φsc 0.85 Strength Limit State Stud Req. Asc 0.44 in2 Qn 26.5 kip f'c 4000 psi Qn check 26.5 kip Ec 3605 ksi Qn check NOT OK Fu 60 ksi Qr 22.5 kip bs 78 P1p 1724 kip ts 6.5 P2p 2191 kip Fyw 50 ksi P 1724 kip D 34.02 in2 Total (n) 76 studs tw 0.625 Fyt 50 ksi bft 12 tft 0.94 Fyc 50 ksi bfc 12 tfc 0.94
Figure D-11. Strength Limit State for the bridge located in Jackson, Arkansas on US 67 Northbound at the intersection of State Highway 161.
Figure D-12. Fatigue Limit State under finite loading for bridge located at the intersection of Interstate 540 and the UN PAC Railroad near Van Buren, Arkansas.
STRENGTH LIMIT STATEProperties 2
φsc 0.85 Strength Limit State Stud Req.
Asc 0.44 in2 Qn 26.5 kip
f'c 4000 psi Qn check 26.5 kip
Ec 3605 ksi Qn check NOT OK
Fu 60 ksi Qr 22.5 kip
bs 78 P1p 1724 kip
ts 6.5 P2p 2191 kip
Fyw 50 ksi P 1724 kip
D 34.02 in2 Total (n) 76 studs
tw 0.625
Fyt 50 ksi
bft 12
tft 0.94
Fyc 50 ksi
bfc 12
tfc 0.94
Bridge Span
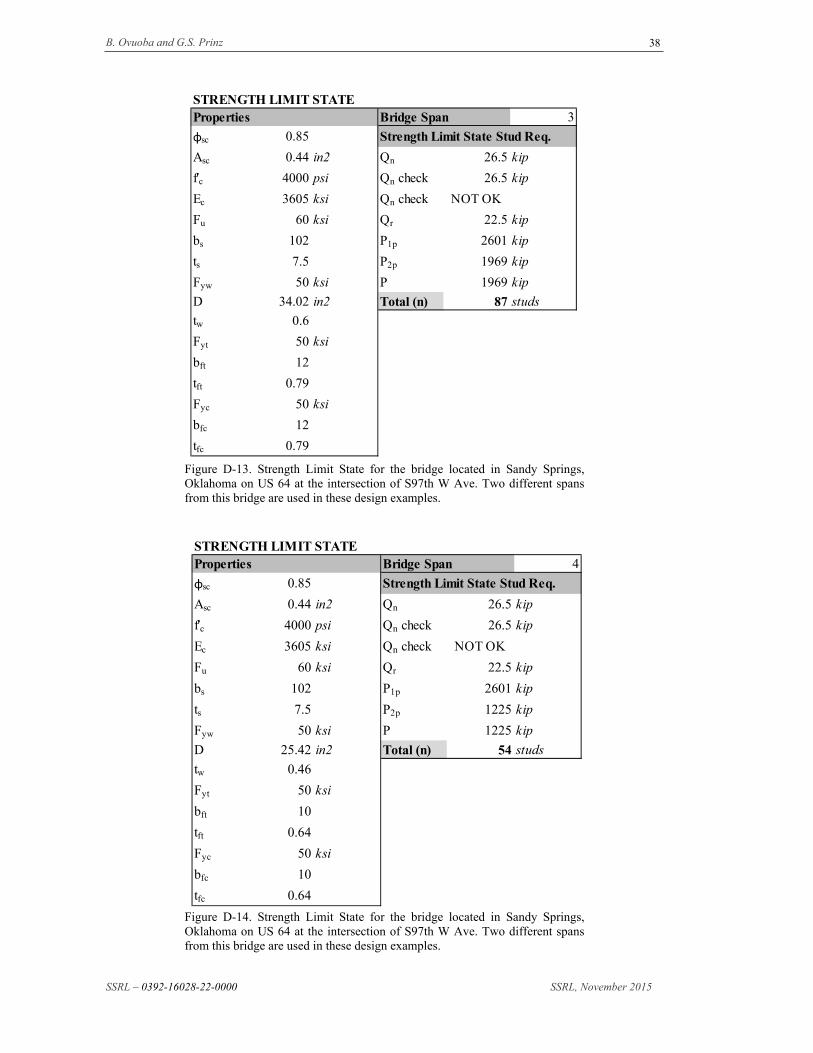
B. Ovuoba and G.S. Prinz
SSRL – 0392-16028-22-0000 SSRL, November 2015
38
Figure D-13. Strength Limit State for the bridge located in Sandy Springs, Oklahoma on US 64 at the intersection of S97th W Ave. Two different spans from this bridge are used in these design examples.
Figure D-14. Strength Limit State for the bridge located in Sandy Springs, Oklahoma on US 64 at the intersection of S97th W Ave. Two different spans from this bridge are used in these design examples.
STRENGTH LIMIT STATEProperties 3
φsc 0.85 Strength Limit State Stud Req.
Asc 0.44 in2 Qn 26.5 kip
f'c 4000 psi Qn check 26.5 kip
Ec 3605 ksi Qn check NOT OK
Fu 60 ksi Qr 22.5 kip
bs 102 P1p 2601 kip
ts 7.5 P2p 1969 kip
Fyw 50 ksi P 1969 kip
D 34.02 in2 Total (n) 87 studs
tw 0.6
Fyt 50 ksi
bft 12
tft 0.79
Fyc 50 ksi
bfc 12
tfc 0.79
Bridge Span
STRENGTH LIMIT STATEProperties 4
φsc 0.85 Strength Limit State Stud Req.
Asc 0.44 in2 Qn 26.5 kip
f'c 4000 psi Qn check 26.5 kip
Ec 3605 ksi Qn check NOT OK
Fu 60 ksi Qr 22.5 kip
bs 102 P1p 2601 kip
ts 7.5 P2p 1225 kip
Fyw 50 ksi P 1225 kip
D 25.42 in2 Total (n) 54 studs
tw 0.46
Fyt 50 ksi
bft 10
tft 0.64
Fyc 50 ksi
bfc 10
tfc 0.64
Bridge Span
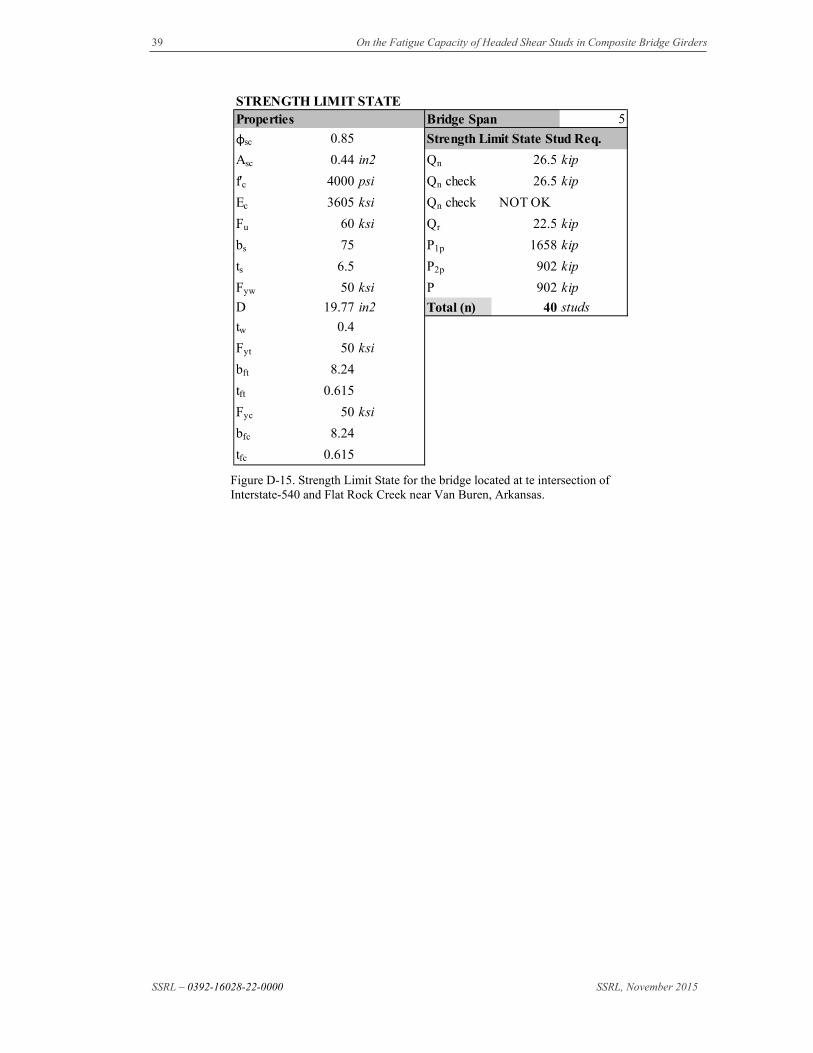
39 On the Fatigue Capacity of Headed Shear Studs in Composite Bridge Girders
SSRL – 0392-16028-22-0000 SSRL, November 2015
Figure D-15. Strength Limit State for the bridge located at te intersection of Interstate-540 and Flat Rock Creek near Van Buren, Arkansas.
STRENGTH LIMIT STATEProperties 5
φsc 0.85 Strength Limit State Stud Req.
Asc 0.44 in2 Qn 26.5 kip
f'c 4000 psi Qn check 26.5 kip
Ec 3605 ksi Qn check NOT OK
Fu 60 ksi Qr 22.5 kip
bs 75 P1p 1658 kip
ts 6.5 P2p 902 kip
Fyw 50 ksi P 902 kip
D 19.77 in2 Total (n) 40 studs
tw 0.4
Fyt 50 ksi
bft 8.24
tft 0.615
Fyc 50 ksi
bfc 8.24
tfc 0.615
Bridge Span

B. Ovuoba and G.S. Prinz
SSRL – 0392-16028-22-0000 SSRL, November 2015
40
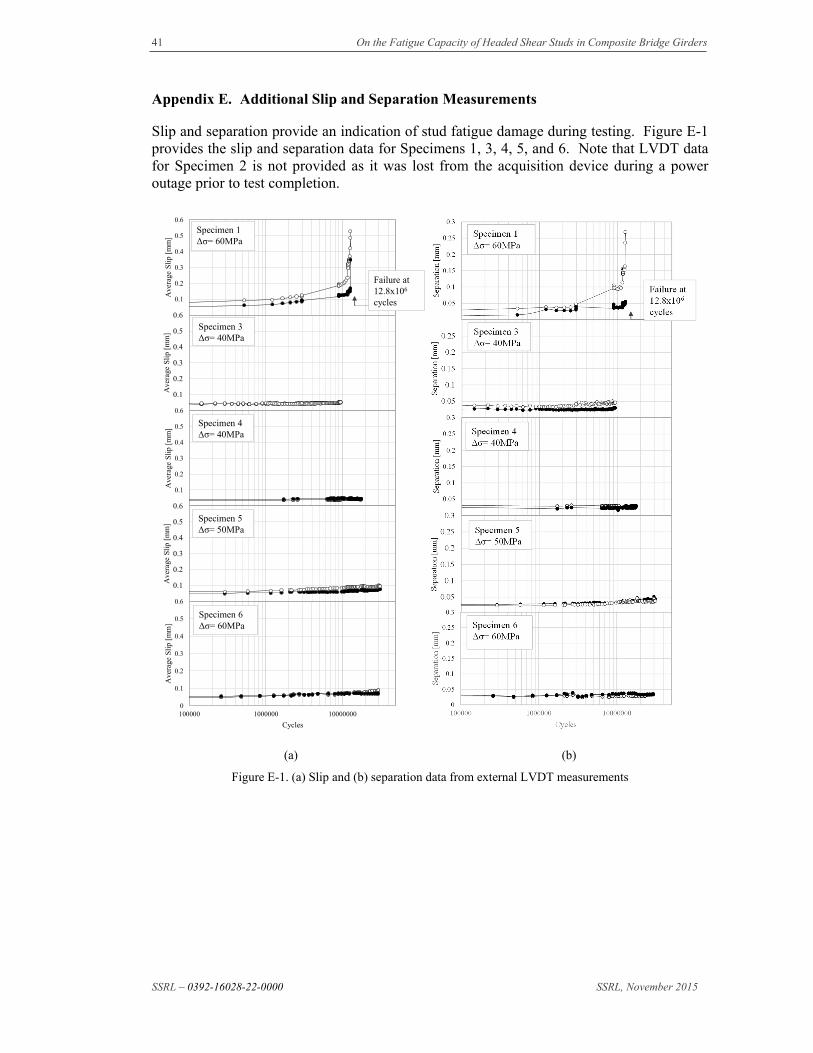
41 On the Fatigue Capacity of Headed Shear Studs in Composite Bridge Girders
SSRL – 0392-16028-22-0000 SSRL, November 2015
Appendix E. Additional Slip and Separation Measurements
Slip and separation provide an indication of stud fatigue damage during testing. Figure E-1 provides the slip and separation data for Specimens 1, 3, 4, 5, and 6. Note that LVDT data for Specimen 2 is not provided as it was lost from the acquisition device during a power outage prior to test completion.
(a) (b)
Figure E-1. (a) Slip and (b) separation data from external LVDT measurements
0
0.1
0.2
0.3
0.4
0.5
0.6
Ave
rage
Slip
[m
m]
Specimen 1Δσ= 60MPa
Failure at12.8x106
cycles
0
0.1
0.2
0.3
0.4
0.5
0.6
Ave
rage
Slip
[m
m]
Specimen 3Δσ= 40MPa
0
0.1
0.2
0.3
0.4
0.5
0.6
Ave
rage
Sli
p [m
m]
Specimen 4Δσ= 40MPa
0
0.1
0.2
0.3
0.4
0.5
0.6
Ave
rage
Slip
[m
m]
Specimen 5Δσ= 50MPa
0
0.1
0.2
0.3
0.4
0.5
0.6
100000 1000000 10000000
Ave
rage
Slip
[m
m]
Cycles
Specimen 6Δσ= 60MPa