Embed Size (px)
Citation preview
On The Extent, Growth, and Efficiency Consequences of State Business Tax Planning
Donald Bruce,1 John Deskins,2 and William F. Fox1
1University of Tennessee and 2Creighton University
June 2005 ABSTRACT: Our focus in this essay is on the extent to which tax planning in response to variations in state tax policy has affected state corporate income tax bases and revenues. Tax planning is defined as a broad set of actions undertaken by firms to reduce their tax liability. Financial or accounting tax planning is contrasted with what we refer to as locational distortions, in which firms move physical operations to avoid higher tax liabilities. Results from a fixed effects instrumental variables regression model using a 1985-2001 panel of state-level data provide highly suggestive evidence that tax planning activity significantly diminishes taxable corporate profits in high tax states. Specifically, we find that state corporate income tax bases decline by nearly 7 percent following a one-percentage-point increase in the top marginal corporate income tax rate, controlling for locational distortions. We also find that throwback rules are usually ineffective in restoring corporate income tax bases while combined reporting requirements are often effective. Further analysis indicates that tax planning has not diminished the locational distortions of tax policy. Corresponding Address: John Deskins
Economics & Finance Department College of Business Administration Creighton University 2500 California Plaza Omaha, NE 68178 Phone: 402.280.2612 Email: [email protected].
The authors thank Dhammika Dharmapala, Brian Hill, LeAnn Luna, Matthew Murray, Michael McKee, Kenneth Anderson, and participants in the University of Tennessee Department of Economics Seminar Series and the 2004 National Tax Association Annual Conference for insightful comments on an earlier draft. The authors also thank Bill Gentry, Charles McLure, Joel Slemrod and participants in the OTPR corporate tax conference for many helpful comments and suggestions.
1
1. Introduction
Traditionally, much of the literature on state corporate taxation has focused on
how taxes affect the location of economic activity (see Wasylenko, 1997). A perpetual
concern among policymakers is that higher tax rates or broader tax bases will retard
regional economic development. In contrast, some recent research has begun to focus
more on tax planning, or how firms expand after-tax profits by adjusting to tax policy
through financial arrangements within related firms. Interest in tax planning among
businesses is evidenced by the fact that each of the Big Four accounting firms and many
banks maintain specific groups to deal exclusively with aiding firms in making
arrangements to reduce their tax liability.
Tax planning is defined here as a broad set of tax avoidance and evasion schemes
that affect only financial arrangements of firms. Tax planning is contrasted with
strategies in which firms move physical operations to avoid higher taxes – herein termed
locational distortions of tax policy.1 Firms may also respond to corporate taxation by
altering the input mix or production technology, though no attempt is made here to
measure the implications of this third effect. Tax planning exploits differences in state
tax policies and often involves sophisticated arrangements wherein firms create one or
more subsidiaries for the purpose of shifting income from high to lower tax jurisdictions.
Tax planning strategies are often legal, but some may fall into a legally gray area or even
1 Note that location distortions need not be restricted to the movement of an entire firm. Many location distortions may involve marginal changes in economic activity, such as when a firm makes decisions to expand output by employing excess capacity at facilities located in low tax rather than high tax areas.
2
be blatantly illegal methods of tax evasion such as underreporting taxable income or
overstating tax deductions.2
Policymakers’ uneasiness surrounding increases in the use of tax planning
techniques is grounded in these techniques’ potential contribution to the decline of state
corporate income tax bases. State corporate income tax revenues as a share of corporate
profits fell by about one-third from 1989 to 2002 (controlling for rate changes), and some
have asserted that tax planning is a significant contributor to this decline (Fox and Luna,
2002).3 Policymakers’ concerns are evidenced by the fact that, since 2002, as many as 18
states have considered adding or modifying a combined reporting requirement with the
intention of retarding tax planning activities (Houghton, Hogroian, and Weinreb, 2004).
Other potential problems include lost neutrality when only a subset of firms is able to use
tax planning to minimize taxes and increases in compliance and administrative costs
associated with implementing tax planning practices.
If one is only concerned with the revenue consequences of tax planning, then the
growing literature on the elasticity of taxable income is perhaps most relevant.4
Specifically, locational distortions, tax planning, and other responses potentially change a
state’s corporate income tax base, so an analysis of the overall elasticity of reported
taxable corporate income would give policy makers a good picture of the combined
problem from a revenue perspective. However, the purpose of this paper is to isolate tax
planning effects from locational distortions in a broader consideration of economic 2 An aggregation of tax avoidance, tax evasion, and ambiguous practices differs from traditional analysis but is consistent with recent research. See Slemrod (2004) who refers to these actions as “tax selfishness.” One advantage of this aggregation is the ability to avoid categorizing legally ambiguous practices along the gray area between evasion and avoidance. 3 Other likely determinants of the tax base erosion are reductions in the federal corporate income tax base (to which essentially every state CIT base is coupled) and state policy decisions such as concessions for economic development purposes. 4 See Slemrod (1998) and Slemrod (2001) for a general discussion.
3
efficiency. The extent to which tax planning might be substituting for locational effects
is important, even though the combined revenue effects might be slight.
Unfortunately, the efficiency consequences of tax planning alone cannot be
determined a priori. For example, prior to the adoption of tax planning strategies, firms
might have moved real activity in response to tax policy, creating an inefficient allocation
of resources. Tax planning strategies might allow firms to respond to tax policy through
structural changes within the firm, removing the inefficiency from repositioning
operations. Even if tax planning and locational distortions have identical effects on
reported taxable income (and revenues), greater tax planning and correspondingly less
locational distortions might have a net positive effect on overall economic efficiency.
Some also would assert that tax planning could be efficiency-enhancing when
viewed within a Leviathan framework (i.e., it helps to constrain a government that is too
large). On the other hand, tax planning may retard efficiency if it ignites a “race to the
bottom” that yields tax rates on mobile capital below an efficient level, resulting in an
economy that is too capital intensive (Inman and Rubinfeld, 1996). Further, overall
efficiency changes depend on other factors such as administrative and compliance costs
(which could potentially be very large) and, in a revenue neutral framework, on the
alternative revenue sources used to replace declining corporate tax revenues.
The degree to which tax planning has eroded state tax bases is yet to be
empirically tested with a significant degree of rigor. It remains to be seen whether
accounts of tax planning are anecdotal and isolated or whether tax planning has
significantly reduced tax revenues. Indeed, as evidenced by the Associated Industries of
Massachusetts (2004), a consensus regarding the extent of tax planning is elusive. Fully
4
informed tax policy decision-making requires a greater understanding of the causes,
effects and extent of tax planning.
The purpose of this essay is to determine the extent to which tax planning in
response to tax policy differences across U.S. states has lowered state corporate income
tax revenues. This effect cannot be measured directly but will be accomplished indirectly
by examining relationships between several state tax policy parameters and state
corporate income tax bases. More specifically, evidence of the impact of tax planning
can be inferred from an econometric model that examines the effects of tax structure
variables on the corporate income tax base while holding state economic activity
constant. This study also assesses the degree to which the effect of such activities on
corporate income tax bases has changed over time. Further, the analysis allows us to
examine whether the effectiveness of state efforts to restore corporate income tax bases
(i.e., combined reporting requirements and throwback rules) are effective.
This study proceeds as follows. Section 2 reviews the relevant literature. Section
3 presents a more in-depth discussion of several tax planning strategies. Section 4 details
the empirical strategy and the data that are used. Section 5 presents a discussion of the
results, and Section 6 offers a conclusion. Results indicate that tax planning in response
to state tax policy differences significantly diminishes state corporate income tax bases in
higher tax states. In addition, the evidence suggests that combined reporting
requirements are frequently effective in partially restoring state corporate income tax
bases while throwback rules are not. Results do not indicate that tax planning has
diminished the location distortions of tax policy between 1985 and 2001.
5
2. Existing Literature
No studies have been identified that specifically measure the extent to which tax
planning has eroded state tax bases. Fox and Luna (2002) review state corporate income
tax revenue trends and assert that tax planning is a contributor to the decline of state
corporate bases. They also discuss some of the methods that are intended to restore
corporate income tax base erosion due to tax planning (some of which are discussed
below). However, they do not specifically measure the effect of tax planning on state tax
bases.5
Mintz and Smart (2004) investigate the extent to which income shifting among
affiliated companies (which constitutes one form of tax planning) affects provincial tax
bases in Canada. They develop a theoretical model that finds that taxable income for
multijurisdictional firms is more mobile for firms that are able to shift income between
affiliated companies than for those that are not. Their model also predicts that the
responsiveness of real investment to tax rate differentials is reduced by the possibility of
income shifting. Then, using administrative tax records for businesses operating in
Canadian provinces, they test their hypothesis by estimating and comparing taxable
income elasticities between firms that are able to engage in income shifting to firms that
are not, and indeed find that the elasticity of taxable income is much higher for firms that
are able to shift income.
Two other areas of literature are relevant here. The first is literature on the effects
of tax policy on location, or how tax policy affects the location of the physical operations
of firms. This large literature represents, in large part, the traditional treatment of the
effects of tax policy on business. This literature is important to this study because, (1) as 5 Also see Mazerov (2003) and Schiller (2002).
6
previously stated, it may be possible that tax planning has reduced location distortions
and (2) the methods below provide further information as to the effects of tax policy on
the location of economic activity. The literature on federal tax planning, which has likely
grown significantly over the past decade or so, is also relevant6 since nearly every state
begins its determination of profits with the federal definition. In addition, the degree to
which firms pursue tax planning at the federal level may be a signal of the intensity of
planning at the state level.
Location Effects of Tax Policy.
The literature on the effects of tax policy on the location of economic activity is
vast, in part due to the great emphasis policymakers place on structuring tax policy to be
conducive to economic development. Fortunately, Wasylenko (1997) examined over 75
studies in a review of this literature.7 What follows is a brief overview of his review. A
portion of the methodology below aligns with the standards of this literature.
Wasylenko begins with a review of issues associated with the design and
estimation of economic development as a function of tax policy. Most studies are based
on a profit or cost function that determines the profitability of locating in a particular
region. The most common measures used to capture economic activity are employment,
income, investment, or business location. Explanatory variables usually include
measures of input costs, such as wages and energy prices; proxies of market size, such as
population, median income, or unionization; and various measures of tax policy. The
most common tax policy measures are statutory tax rates and tax revenues relative to
6 See Bankman (1999) for example. 7 See also Bartik (1991 and 1994).
7
some measure of income or population. Most studies fail to incorporate more detailed
elements of tax structures such as incentives for economic development.
According to Wasylenko, the general conclusion of the literature on the
interregional effects of tax policy is that tax policy is a statistically significant
determinant of economic activity. However, the magnitudes (and even direction) of the
effects of tax policy on economic development are scattered. Wasylenko reports a wide
range of tax elasticities, from –1.54 to 0.54, that depend primarily on data used for the
dependent variable (particularly micro- versus aggregate-level data), methodology, and
time period of analysis. However, the median tax elasticity in each of the dependent
variable categories is negative and generally small. For example, studies that specify
gross state product as the dependent variable (most relevant to the current study as
discussed below) report a median tax elasticity of –0.07. That is, given a 1-percent
increase in some tax parameter, gross state product declines by only 0.07 percent.
Federal Tax Planning.
Federal concern about tax planning is evidenced by the U.S. Department of the
Treasury (1999), which expresses significant unease with the use of corporate tax
sheltering (similar to the tax planning definition used here) and represents an attempt to
design better strategies to combat such practices. The study cites several potential
problems with tax sheltering such as revenue losses, disrespect for the tax system,
increased complexity, and the cost to firms of pursuing such activities. The Internal
Revenue Service (2003) estimated that losses from abusive tax shelters amounted to
$14.5 to $18.4 billion in 1998. The loss from sheltering amounts to between 7 and 9
percent of the $204.2 billion in corporate tax revenues. Following Slemrod (2004), if the
8
average of this span is added to a recent estimate of corporate tax evasion of $53.0 billion
(U.S. General Accounting Office, 1998), abusive tax sheltering combined with evasion
amounted to 26.1 percent of corporate tax receipts in 1998.8
A few studies have examined more closely the causes of corporate tax sheltering
and the policies with which it is most closely associated. Desai (2002) studies federal tax
sheltering by using simulations to examine the growing divergence between corporate
book income and taxable income. He finds that over half of the difference between book
and taxable income in 1998 is due to differences in the treatment of depreciation, the
reporting of foreign source income, and the shift from salaries to stock options as forms
of employee compensation. Desai also finds evidence that the relationship between book
and tax income has become much less stable over the past few years, indicating
increasing tax sheltering activity. Desai and Dharmapala (2004) develop and test a model
that explains how incentive compensation for management relates to the degree to which
firms pursue tax sheltering strategies. Although their theoretical model yields ambiguous
results, their empirical findings indicate that increases in incentive compensation lead to
less tax sheltering activity. Rego (2003) finds that economies of scale exist in tax
planning, i.e., larger and more profitable multinational firms are better able to reduce
their income tax liability through tax planning.
A highly publicized form of tax planning at the federal level involves corporate
inversions, or when a corporation with a foreign subsidiary (usually in a low or no tax
country) inverts its structure such that the foreign subsidiary becomes the parent company
and the U.S. firm becomes the subsidiary. This tactic generally allows the corporation to
8 See Mackie (2000) for a discussion of the problems of using average tax rates to examine the effects of tax sheltering.
9
reduce its tax liability on its foreign income and also to hold pre-tax profits until earnings
are repatriated to the U.S. Desai and Hines (2002) analyze the determinants of inversions
and find that firms are more likely to invert if they are larger and more heavily leveraged
and if they have more overseas assets and operate in low-tax foreign countries.
Gentry and Hubbard (1998, p.193) discuss three general forms of tax planning
under the current federal corporate income tax: “discouraging incorporation, encouraging
borrowing, and altering the timing of transactions.” They analyze how fundamental tax
reform in the form of either (1) integrating the personal and corporate systems or (2)
moving from the current income tax to a pure consumption tax would alleviate these tax
planning incentives. They conclude that both types of reforms can significantly reduce
the incentives to adopt these forms of tax planning.9
3. How Does State Tax Planning Work?
Firms employ numerous tax planning strategies to reduce their tax burden. An
exhaustive review is impossible because known strategies are numerous and many
strategies are likely unknown to tax analysts. Some forms of tax planning include:10
(1) Reclassifying business income as non-business income,
(2) Exploiting P.L. 86-272,
(3) Using transfer pricing to shift income from high tax to low tax jurisdictions,
(4) Employing passive investment companies, and
(5) Using single member limited liability companies (LLC) to shift income out of
state.
9 See Hines (2002) for a discussion of how governments respond to the adoption of tax avoidance strategies. 10 See Luna (2004) for discussion of state corporate tax planning.
10
Many firms have altered the characterization of business and non-business income
to reduce tax liability. The distinction is important because only business income is
apportionable while non-business income is allocated to the state in which it was earned.
Therefore, a firm can reduce its tax liability by classifying some income as non-business
income where possible and shifting it to a low or no-tax state.
Congress passed P.L. 86-272 as a temporary measure to limit state efforts to tax
multistate corporations while the best means of taxing the firms was being studied. The
temporary legislation remains in place decades later. P.L. 86-272 precludes a state from
levying tax on a firm whose only linkage with the state is the solicitation of sales of
tangible personal property. Thus, companies can avoid tax through the creation of
“nowhere income” when they sell into states where they have no presence other than
solicitation, since the destination state cannot attribute the sales for corporate tax
purposes and the origin state generally does not attribute the sales for corporate tax
purposes.
Manipulating transfer prices is a common type of tax planning. For example,
consider a firm that is headquartered in Delaware and has two wholly owned subsidiaries,
a retailer in Montana and a wholesaler in Wyoming. An increase in the price that the
Wyoming firm charges the Montana firm shifts profits from Montana to Wyoming. This
transaction will lower overall tax liability as long as Wyoming’s tax rate is lower than
Montana’s (Wyoming does not impose a corporate income tax), and Montana does not
impose a combined reporting requirement (see below).
The fourth group of tax planning practices involves the creation of a passive
investment company (PIC). This strategy often exploits the tax structure of either
11
Nevada, which does not tax corporations, or Delaware, which does not tax income from
intangible assets, but can be effective in other circumstances as well. Perhaps the most
famous example is with Toys Я Us and its subsidiary Geoffrey, Inc. Toys Я Us created
Geoffrey, Inc. in Delaware to house the Toys Я Us trademark. Geoffrey, Inc. only had
physical presence in Delaware. Toys Я Us stores across the states pay royalties to
Geoffrey, Inc. and transfer income to Delaware, effectively eliminating the income from
state tax bases. Numerous corporations have duplicated this practice. South Carolina
challenged the use of Geoffrey11 and prevailed, but some states have lost similar cases
and other states fail to pursue income shifted through PICs (at least in part because of
state’s corporate tax legislation). Further, states have the often daunting task of
identifying firms that are employing PIC strategies.
Lastly, single member limited liability companies (LLCs) can allow firms to shift
income to the state where the member is located (see Fox and Luna, forthcoming). At the
end of the 1980s, only two states permitted the LLC structure, but by the end of 1997 all
states had enacted LLC legislation and all but Massachusetts permit single member
LLCs. The simplest way for a corporation to use LLCs to avoid taxes is to create a single
member LLC to house its operating company for a particular state and to own this LLC
with a Delaware corporation that does not otherwise have nexus in the state. Income
earned in the LLC state flows through to the Delaware member without tax unless the
corporate tax law is changed. Delaware does not tax a firm that only administers an
intangible investment, and interest in an LLC is considered an intangible. This
arrangement effectively removes all of the operating firm’s profits from state taxation
unless the state where the LLC is located imposes an entity level tax on LLCs. 11 Geoffrey, Inc. v. South Carolina Tax Commission, 114 S. Ct. 50 (1993).
12
State Strategies to Offset Revenue Losses Arising from Tax Planning.
States use a variety of strategies to lessen the effects of tax planning, several of
which are reviewed here. Combined reporting requirements can at least partially restore
CIT bases by precluding some tax planning strategies based on transfer pricing, such as
the use of PICs. Combined reporting requires firms that are part of a unitary group to file
a single corporate income tax return and thereby eliminates many of the effects of intra-
group transactions.12 Combined reporting can only partially restore tax bases (see Fox
and Luna, 2002, for a discussion).13 For example, foreign corporations are seldom
included in the combined report, meaning a foreign PIC can help shift income. Also,
only the unitary group can be required to file a combined return.14 Fourteen states
imposed combined reporting in 2001 (five of those 14 states added the requirement
during the timeframe of this analysis).15
States employ several other strategies in efforts to lessen the effects of PICs and
transfer pricing strategies, though these should generally be less effective than combined
reporting. For example, a number of states disallow deductions for payments to PICs and
require the in-state firm to addback the expenses. Other states have argued that certain
PICs have no economic substance and that the payments should be disallowed. Still
12 One firm in the unitary group is designated to file the return on behalf of all members of the group. Some states require all firms that are part of the unitary group to be combined and other states only require those firms that are part of the unitary group and that individually have nexus in the state to file as part of the combined group. 13 Combined reporting does not always lessen the capacity for tax planning, as evidenced by the frequent use of California, a combined reporting state, as situs for PICs. Firms that have nexus in California and sell into separate reporting states are not disadvantaged by locating their PIC in California to shift income from the separate reporting states to the PIC in California. This practice does not alter the firm’s California taxable income since this is determined by apportionment. 14 Also, combined reporting legislation in some states, such as the recently enacted legislation in Kentucky, only includes companies that individually have nexus in the state in the combined group. 15 See also McIntyre, Mines, and Pomp (2001).
13
other states have argued that the out-of-state PIC has nexus by virtue of licensing
intangible property to an in-state corporation.16
A number of states use throwback rules to eliminate the nowhere income that
arises because of P.L. 86-272. Slightly over half of corporate income taxing states (24
out of 44) imposed throwback rules in 2001 (six states either added or removed this rule
during the timeframe of this analysis). Throwback rules require corporations to include
sales in the numerator of the origin state in cases where the sale cannot be or is not
included in the numerator of the destination state. This can lessen the effectiveness of tax
planning strategies that attempt to shift income to states where corporations do not have
nexus, though firms may easily plan around the throwback rules by selling from non-
throwback rule states (see Fox, Luna, and Murray, 2005). Indeed, throwback rules are a
form of origin-based taxation and give firms an incentive to locate sales in states that do
not impose such rules.
4. Empirical Design and Data
The primary hypothesis in this study is that cross-state differences in corporate tax
policies have led to tax planning that has significantly lowered state corporate income tax
bases. The effect of tax planning on tax bases cannot be measured directly but can be
tested in the following way. A state’s total CIT base is determined by three factors: (1) a
set of state-determined institutional parameters that define taxable income, (2) the
magnitude of economic activity in the state that is taxed under the CIT structure, and (3)
the ability of firms to make financial or accounting adjustments to lower their tax
liability. The third determinant of the CIT base is tax planning – the myriad ways in 16 See Tax Management Multistate Tax Report (2004) for a discussion.
14
which firms adjust and restructure to lower tax liabilities. Tax planning to reduce taxable
profits may be spurred by any tax policy change that raises the effective tax rate that
firms face, by differences in tax structures between states, or by changes in state law that
make planning easier.17
State tax policy can affect firm behavior along a number of different margins,
some of which entail tax planning responses and others of which change real behavior.
We seek to separate these two types of responses by estimating the regression model that
explains state CIT bases as a function of the set of government parameters that define the
CIT base, Gross State Product (GSP) and variables that change the effective tax rate that
firms face. GSP is included in the model to account for the effect that tax structures have
on tax bases through changes in the real behavior of firms, with the goal being to isolate
the effects of tax planning by separating out real effects.
Firms can make two real economic responses to the higher relative price of capital
caused by an increase in the effective corporate tax rate. They can relocate production to
lower-cost-of-capital states, or they can change the capital/labor ratio (either within the
existing technology or by using a new technology) used within the taxing state. Changes
in the location of production are accounted for through GSP and are isolated from tax
planning. Changes in the capital/labor ratio are accounted for through GSP to the extent
that firms reduce output as they alter relative input use. That said, substitution of labor
for capital will presumably also reduce firms’ before-tax profits, and this will get
17 Of course, other effects complicate this picture and render the relationship between higher tax structures and tax planning theoretically ambiguous. See Crocker and Slemrod (2004) and Slemrod (2004) for recent models of corporate income tax evasion.
15
reflected in a lower CIT base. The extent of tax planning is overstated in the empirical
results to the extent that a lower tax base results from firms’ changes in their input mix.18
A foremost econometric issue in this context is the potential endogeneity of GSP
in explaining the CIT base since changes in the CIT base could also affect state economic
activity. Therefore, we use both a standard model that does not control for endogeneity
as well as a two-stage instrumental variables regression model that estimates GSP in the
first stage and CIT base in the second. Of course, the two-stage model requires at least
one instrumental variable in the GSP equation that does not have an independent effect
on the CIT base. Technical details are discussed below.
A second hypothesis is that tax planning has begun to substitute for the location
distortions of tax policy. More specifically, firms may be increasingly able to avoid
higher taxes simply by engaging in tax planning strategies rather than actually moving
physical operations to lower tax jurisdictions. This hypothesis can be tested by
examining how the effect of the CIT rate on its base (holding GSP constant) and on GSP
differs over time. This approach is accomplished in the regression framework by
including an interaction between the CIT rate and a time variable. If tax planning activity
is rising and if tax planning and location responses are substitutes, the CIT rate (and other
tax policy instruments) is of waning importance over time in determining state economic
activity. The CIT rate would also have a growing effect on its base over time if tax
planning were becoming more prevalent. Both of these hypotheses, that real investment
18 The same can be said about other distortions, such as those regarding debt and equity policies, organizational form, and incorporation decisions. To the extent that distortions along these margins reduce the CIT base but are not accompanied by output changes, their influence will be part of our estimated tax planning effects.
16
would be less responsive, and that taxable income would be more responsive to tax
policy differentials, are consistent with the theoretical model of Mintz and Smart (2004).
Model Structure and Variable Description.
We employ a panel of data from all 50 U.S. states for years 1985 through 2001.
The specific structure of the regression equations and the variables included in them are
defined below.
Economic Activity and Corporate Income Tax Base Measures. Non-government
gross state product (GSP) is used to measure economic activity. Government production
is excluded because it is potentially not subject to corporate taxation.
The corporate income tax base is approximated by dividing corporate income tax
collections by the highest marginal state corporate income tax rate for those states with a
corporate income tax.19 This method suffers from measurement error given that a few
states have progressive corporate income tax schedules. However, the consequences of
this error are likely to be minor for two reasons. First, the majority of states (31 out of 44
that taxed corporate income in 2001) have a single rate. Second, in the remaining 13
states that have progressive corporate income tax schedules, the threshold for the top
bracket is relatively low such that the majority of income falls into the top bracket.20
The corporate income tax base is estimated for the six states without a corporate
income tax by regressing a measure of the federal corporate income tax base by state
(Internal Revenue Service, various years) on state CIT bases using only data for states
19 Nevada and Wyoming have no broad business tax. Michigan imposes a single business tax (sometimes described as a business activities tax or value added tax). Texas imposes a franchise tax on earned surplus. South Dakota imposes a corporate income tax on banks. Washington imposes a gross receipts tax termed the business and occupations tax. (Federation of Tax Administrators, 2004) Michigan, Texas, South Dakota, and Washington are treated as if they have no CIT whatsoever. 20 Additionally, this over-estimate of the CIT base is at least partially offset by an underestimate due to our lack of consideration of CIT credits in the base calculation.
17
with a CIT. The parameter estimates from this model are then applied to obtain predicted
values for CIT bases for states without CITs.21 It is important to include these states in
the analysis to allow for the possibility that firms consider non-CIT states in their tax
planning decisions.
Tax Rates. The top marginal CIT rate is often the focal point of public attention
surrounding business taxation because high rates could distort location distortions or
justify the adoption of costlier and more effective tax planning techniques. The omission
of the CIT rates of lower brackets leads to specification error, but the error is relatively
unimportant for the same reasons offered above in the context of using the top marginal
rate in calculating corporate income tax bases.22
Tax planning or real economic effects could be encouraged by any parameter that
affects the overall tax burden firms face, not just parameters directly related to the
corporate income tax. The state general sales tax rate is included because it represents
the largest component of the overall state tax liability of many firms since it is imposed
on the sales value of many business-to-business transactions (Cline et al., 2003a and
2003b; Cline et al., 2005). In a similar fashion, the top marginal personal income tax
(PIT) rate is included. Firms may be more likely to incorporate when faced with higher
21 This procedure uses a random effects regression that results in an overall R-squared of 0.72. The federal corporate income tax base coefficient is statistically different from zero at the 1 percent level. Results are omitted for brevity but are available upon request. 22 Our use of the top statutory CIT rate might raise concerns about measurement error if one truly believes that the firm’s effective tax rate is a more appropriate measure. However, our analysis of aggregate state data rather than individual firm data makes the use of effective tax rates less compelling. Also, we view the statutory rate as an important policy signal at the aggregate level and have thus elected to include it along with most other factors in effective tax rate calculations (e.g., combined reporting and throwback rules, apportionment formula details, and other features of state CIT structures).
18
PIT rates relative to CIT rates or closely held corporations may choose to pay less in
wages to owner/operators, meaning higher PIT rates could raise the CIT base.23, 24
Corporate Tax Structure. Elements of the corporate tax structure could influence
GSP and also have independent effects on CIT bases. The former is true because many
of these parameters raise or lower effective corporate tax rates, which may create location
distortions. The independent effects on CIT bases may occur because these variables
help define the CIT base.
The first variable included in this group is the sales factor weight in the state
corporate income tax apportionment formula. The apportionment formula uses a state’s
share of the corporation’s national property, plant, and payroll to distribute the
corporation’s national profits to the state for tax purposes. These three factors are added
together using weights that the states have been varying as economic development tools.
Increasing the sales factor weight, which may entice firms (especially manufacturing
firms) to expand production in a given state, has become a commonly-used instrument for
attracting production.
In general, for given tax rates, locating payroll and property in a state with a high
sales factor weight while selling in many states will reduce tax liability compared with
locating the payroll and property in a state with a low sales factor weight and higher
weights on property and payroll factors (see Edmiston, 2002). States have aggressively
23 There is a significant amount of variation in CIT, PIT, and sales tax rates, both between states and within states, during the timeframe of this analysis. For each of these taxes, over half of states changed the rate at least one time from 1985 to 2001. 24 A corporate franchise tax may also affect the CIT base. However, we chose not to include this variable because of the difficulty of capturing corporate franchise tax rates in a usable form. The use of a simple dummy variable for states that impose a corporate franchise tax was discarded because of the very small amount of variation in the states that impose such a tax. Omission of this variable does not bias the results because the state fixed effects control for this tax and all other state-specific characteristics that are not included in the model.
19
increased the weight on the sales factor in the formula to lessen origin-based taxation and
increase destination taxation. This also tends to lessen the corporate income tax on many
multistate, and presumably more mobile firms, without affecting the tax liability of
domestic firms, which do not apportion income. For example, in 1990, 32 of the 44
income taxing states applied equal weight to all three factors. By 2004, only 12 states
applied equal weight to all factors, while 23 states double-weighted the sales factor (a 50
percent weight), and the remainder applied more than 50 percent weight to sales.25
The apportionment formula for state corporate income taxes can be an important
element in tax planning (as firms seek to exploit differences across states or across types
of business structure) or location effects. For example, until Kentucky’s 2005 corporate
tax reform, LLCs profits were apportioned using a single factor sales formula and other
corporations were apportioned using double weighted sales. Thus, the firm could lower
its liability by producing inside Kentucky in its LLC and locating a sales office outside
Kentucky inside a corporation to sell back into the state.
As previously stated, combined reporting requirements can be an important
element of state CIT structures, and are thus included to help explain state CIT bases.
Combined reporting requirements could reduce economic activity in a state by driving
away firms if such requirements effectively raise the CIT burden by disallowing some
planning opportunities. Combined reporting is specified as a dummy variable to denote
whether a state requires combined reporting. Other means of offsetting the use of PICs
are not included because data are not available for a panel application. Whether a state
has a throwback rule is included as a dummy variable. A throwback rule is intended to
25 A significant amount of this variation occurred during the time period of this analysis. Indeed, 24 states increased their sales factor weight at least once during this time period.
20
raise the CIT base as it narrows avoidance possibilities, but could create location
distortions because it raises the origin component of the CIT.26
State legislation permitting limited liability companies (LLCs) can create tax
planning opportunities and may affect economic activity across states (see Fox and Luna,
2005). The option for LLC status could affect economic activity because firms may start
in or relocate to states to exploit this organizational form. The LLC structure can be
preferred over the C-corporation structure because LLCs also offer limited liability, but
in many cases they are treated as pass-through entities with the income taxed only under
the PIT system.27 Further, LLCs are often exempt from some other corporate taxes, such
as the corporate license taxes in Louisiana. This arrangement allows these firms to avoid
double taxation of the CIT and PIT systems, reducing CIT bases. In addition, single-
member LLCs can erode CIT bases through the tax planning opportunities described
above. This variable is specified as a dummy to denote whether states permit LLCs.
Allowing corporations to deduct their federal CIT liability will directly lower
state CIT bases. We include a dummy variable to denote a federal CIT liability deduction
from the state CIT. This variable essentially lowers the effective CIT rate that firms face
in a state and, thus, may generate locational distortions. Economic development
incentive programs are inherently difficult to capture in a simple metric because of the
wide variation in incentive programs offered across states. They are incorporated in this
analysis via a count of the number of incentive programs that states offer. The counts are
26 It should be noted that we include two of the most common and most visible policies that have been used to offset the effects of tax planning but this does not represent a comprehensive set of such variables. States use several other policies, some of which were discussed in Section 3, to lessen avoidance opportunities. However, reliable data on these policies for all states and for the time period of this analysis are difficult to obtain. We leave this to future work. 27 The LLC structure also offers some advantages over S-corporations. For example, there is no limit on the number of members of an LLC whereas an S corporation is limited to 100 shareholders (75 before 2005).
21
divided into the number of tax incentive programs and the number of non-tax incentive
programs. Both of these counts may increase economic activity by attracting firms to a
state. Tax incentive programs should lower the CIT base because states are providing tax
breaks through these programs. Non-tax incentive programs may increase real economic
activity as they lower business costs, although no independent effect on the tax base is
expected.28
The primary stage of the regression model is summarized below:
CIT Basei,t = β0 + β1 CIT Ratei,t +β2 PIT Ratei,t + β3 Sales Ratei,t + β4 Sales Factor Apportionmenti,t + β5 Combined Reportingi,t + β6 LLCi,t, + β7 Throwback Rulei,t + β8 Fed CIT Deductibilityi,t + β9 Tax Incentivesi,t+ β10 Non-Tax Incentivesi,t+ β11 GSPi,t + εit,
where i and t are state and year indices.
Instruments for GSP. As previously mentioned, GSP is likely to be endogenous
with respect to the CIT base.29 The first-stage GSP instrumenting equation includes all of
the explanatory variables in the CIT base equation plus a set of socio-economic
instrumental variables that explain GSP but do not have independent effects on CIT
bases. This specification is consistent with the literature that explains the determinants of
economic activity as discussed in the review of location effects of tax policy.30 Most of
this literature models locational decisions by constructing profit functions (or other
related functions) to determine profitability, and correspondingly, the decision to locate
into a region. The literature includes variables such as measures of regional market
28 See Zodrow (2003) for a discussion of tax incentives. 29 To be precise, under perfect information the CIT base does not affect GSP directly, rather it is the parameters that define the base that affect GSP. However, given the complexity of CIT structures, firms may not separately consider every parameter that defines the CIT base and, under these circumstances, respond directly to the CIT base. A standard Hausman test revealed that GSP is endogenous in the CIT base equation (Hausman, 1978). 30 See, for example, Wasylenko and McGuire (1985).
22
demand, costs of producing in a particular location, and, of course, taxes. The following
summarizes this (first-stage) equation:
GSPi,t = β0 + β1 CIT Ratei,t +β2 PIT Ratei,t + β3 Sales Ratei,t + β4 Sales Factor Apportionmenti,t + β5 Combined Reportingi,t + β6 LLCi,t, + β7 Throwback Rulei,t + β8 Fed CIT Deductibility + β9 Tax Incentivesi,t+ β10 Non-Tax Incentivesi,t+ β11 Populationi,t + β12 Median Incomei,t + β13 Population Densityi,t + β14 Government Expendituresi,t + β15 Manufacturing Wagei,t + β16 Educationi,t + β17 Energy Pricei,t + εit,,
where, as before, i and t are state and year indices.
Two measures of input costs are included. The first is the average hourly wage
for manufacturing workers in a state. The second is a measure of overall energy prices in
a state (including all forms of energy such as gas, electricity, etc.). State population and
median income are included to control for state size and demand. Population density is
included because a high population concentration may influence the ability of firms to
achieve economies of operation. Total state government expenditures per capita control
for government size. Government size has an ambiguous theoretical effect; firms may be
more likely to locate in a state with greater expenditures per capita recognizing the
associated benefits of more public services. Alternatively, they could focus on the higher
taxes accompanying larger governments and choose to locate elsewhere to the extent that
per capita taxes and expenditures are correlated. The percentage of a state’s residents
(over age 25) who hold a baccalaureate degree or higher would likely influence GSP
because many firms require an educated workforce.31
31 This education variable is not available for 1985-88, so values are imputed based on the average rate of change in each state between 1980 and 1989.
23
All regressions include state- and year-specific fixed effects to control for state
and time specific factors not included in the model.32 CIT bases and GSP are entered as
natural logs to control for the scaling effects from the wide variation in GSP and CIT
bases between large and small states. The time period of analysis, 1985 through 2001, is
advantageous in that it began just before the Tax Reform Act of 1986, which potentially
affected tax planning by reducing marginal federal corporate income tax rates, thereby
increasing the relative value of avoiding state business taxes from the perspective of
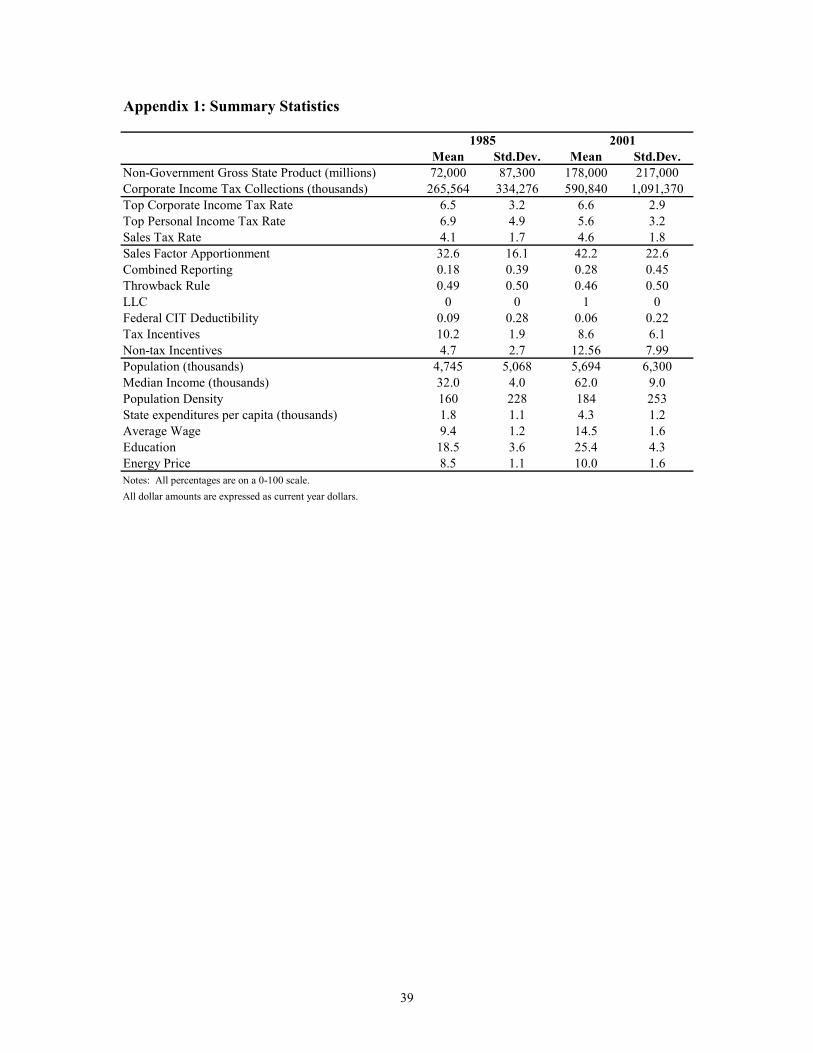
firms. This time span also allows for broad changes across the business cycle. Appendix
1 presents summary statistics for all variables for the first and last years of the study and
Appendix 2 provides variable descriptions and source notes.
5. Results and Discussion
This section first discusses the results from the baseline model. It then turns to a
modified baseline model that includes the CIT rate interacted with other CIT structural
parameters to more precisely identify the effects of these parameters. The section closes
with another modification of the baseline model that considers the possibility that tax
planning has replaced the location distortions of tax policy over time.
Baseline Model.
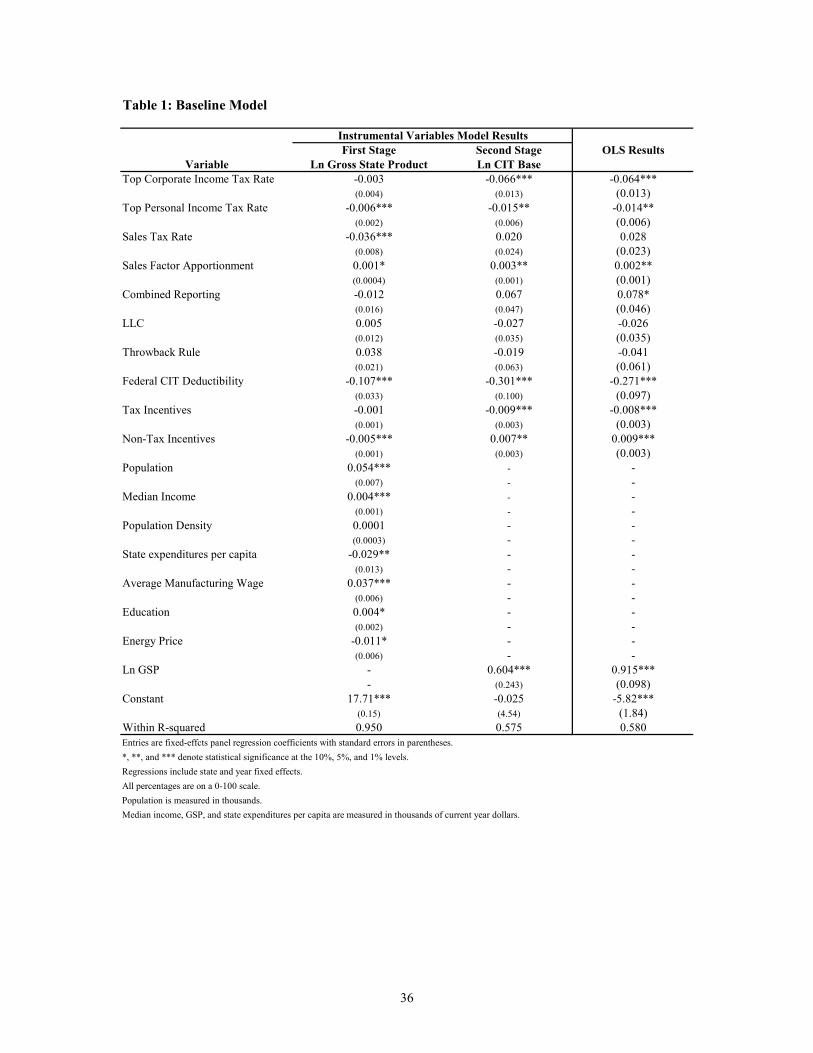
GSP Results. Table 1 presents results from the primary regression model.
Estimates from the first stage equation indicate that the top CIT rate does not have a
statistically identifiable effect on private sector economic activity. However, increases in
32 Note that this will influence our interpretation of the regression results, as statistical significance will be identified on the basis of changes in variables over time as well as cross-state differences. We also estimated the model using a random effects specification, but a Hausman (1978) test revealed correlations between the explanatory variables and the random effects.
24
top PIT rates and sales tax rates are associated with lower levels of output growth. One
possible explanation is that the sales tax and PIT each account for about one-third of state
tax revenues (and large shares of business costs) while the corporate income tax currently
generates only about six percent of state tax revenue. The magnitude of the PIT rate
effect is relatively small: a one-percentage-point increase in the top PIT rate decreases
GSP by only 0.6 percent. In contrast, a one-percentage-point increase in the sales tax rate
lowers GSP by 3.6 percent.33
The sales factor weight in the state CIT apportionment formula is also a
statistically significant determinant of GSP. The model predicts that a sales factor weight
increase from 33 percent to 50 percent would increase GSP by 1.7 percent. Deductibility
of federal CIT liability from state CITs tends to reduce GSP growth, though the estimated
effects are larger than seems reasonable. As variation in this factor is limited to a very
small number of states, it may be picking up other influences common to those states. In
addition, the number of non-tax incentive programs has a statistically distinguishable, but
unexpected negative, relationship with GSP. The programs may offer lower benefits than
the tax costs, so the net effect is a reduction of economic activity. Alternatively, this
variable could be endogenous with gross output if more non-tax incentive programs are
developed in low output states.
Some of the other control variables in the first stage of the model also deserve
attention. As would be expected, states with higher population or median income growth
relative to the national average have higher relative GSP growth. Interestingly, increases
in state government expenditures per capita tend to yield lower GSP growth. The overall
33 The sales tax effect translates into an elasticity of -0.2. That is, a one-percent increase in the sales tax rate yields a -0.2-percent decrease in GSP (based on the average sales tax rate of 4.6 percent in 2001). This magnitude is within the range of tax elasticity estimates discussed in Wasylenko (1997).
25
relationship between government spending and total output is not captured because the
GSP measure excludes government spending; this result could simply reflect the
crowding out of private output. States with higher growth in average wages for
manufacturing workers have higher rates of growth in economic output. This likely
suggests that more skilled workers, as evidenced by greater salaries, result in greater
output. In addition, increases in a state’s highly educated population are associated with
higher GSP growth.
Corporate Income Tax Base Results. Results from the second stage of the model
indicate that GSP is highly significant in explaining the CIT base with an estimated
elasticity of 0.60. The lack of statistical significance on the constant term in this
equation, combined with the significance of GSP, indicate that the CIT base
fundamentally follows from GSP, as would be expected.
A one-percentage-point increase in the top CIT rate is associated with a 6.6
percent decrease in the corporate income tax base, holding GSP and all else in the model
constant.34 The relationship between the CIT rate and base is mostly attributable to tax
planning activities because holding GSP constant eliminates the effect of location
distortions on the base. However, effects on profitability arising from changes in the
relative use of inputs can also be included in this coefficient. Further, the CIT base
declines by 1.5 percent following a one-percentage-point increase in the PIT rate, again
attributable to tax planning. As previously stated, when faced with higher tax rates in the
PIT system, owners may be cost-justified in seeking more tax planning opportunities.
Several other tax variables are statistically significant in explaining the CIT base.
Higher sales factor weights relative to the national average are associated with higher 34 This translates into an elasticity of –0.44 (based on the average top CIT rate of 6.6 percent for 2001).
26
relative CIT base growth. Changing the apportionment formula does not create any
additional tax base across the 50 states, but differences in state apportionment formulas
appear to allow those states with higher sales ratios to tax a greater share of the corporate
tax base. The model provides no evidence that state efforts to limit tax planning are
effective. The imposition of combined reporting requirements or throwback rules has no
effect on CIT bases in this context. These policies receive more attention in the next
section.
The model also fails to find evidence that allowing LLCs erodes the CIT base.
Fox and Luna (2005) use a different CIT base measure and find that advent of LLCs
lowered tax revenues, but only when the analysis is run without fixed effects for time.
The result found here might also be due to a high degree of correlation between the LLC
dummy and the year fixed effects. As expected, allowing the deduction of federal CIT
liability reduces state CIT base growth. In addition, more tax incentive programs reduce
growth in the CIT base. More non-tax incentive programs are associated with higher CIT
base growth, holding GSP constant. Perhaps firms pursue tax planning strategies less
aggressively when offered more non-tax incentive programs, thereby increasing the tax
base.
We also present a set of results from a standard fixed effects model that does not
control for the possible endogeneity bias. Here our tax policy results are largely similar
to those in the instrumental variables specification, indicating that any endogeneity bias is
small. Nonetheless, since a Hausman test revealed GSP endogeneity, we will continue to
focus on the two-stage results.
27
Several pieces of policy-relevant information can be drawn from these results.
Sales and personal income tax rates have statistically significant and negative effects on
economic activity in states, although the effect of the personal income tax is small. On
the other hand, the corporate income tax rate does not have a significant effect on
economic activity. Higher corporate income tax rates do appear to encourage tax
planning, so policymakers should be aware of the large tax-planning-related base erosion
that would likely follow an increase in corporate income tax rates.
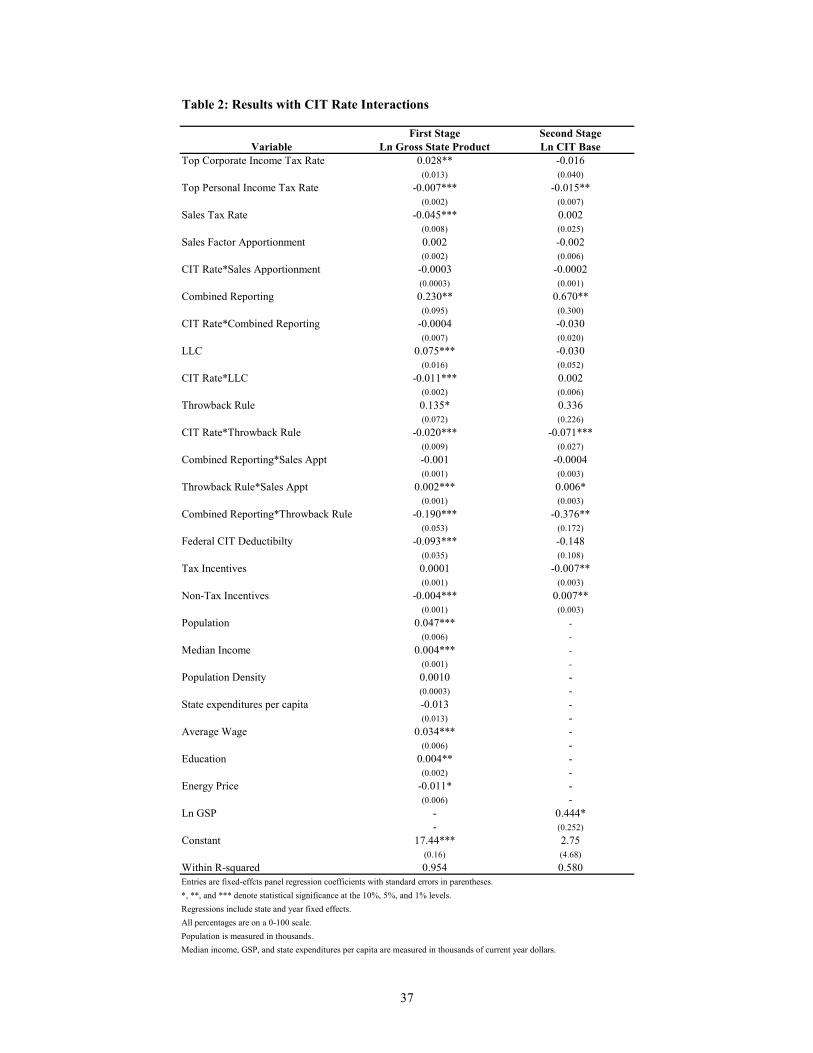
Baseline Model Modified to Include CIT Rate Interactions.
Table 2 presents a set of results similar to those in Table 1 with the difference
being the inclusion of (1) interactions of the top CIT rate with the sales factor weight in
the CIT apportionment formula, combined reporting requirements, throwback rules, and
LLC allowances and (2) the CIT apportionment formula, combined reporting, and
throwback rule variables interacted with each other in each possible two-way
combination. This specification allows for a more in-depth examination of the effects of
these variables because it more precisely identifies how the effect of each element of CIT
structure differs across policy regimes defined by the other CIT factors. This framework
is especially important given that it is likely that many firms consider state tax structures
from a broad perspective (i.e., rates and other policies in conjunction) rather than from a
narrower perspective that only considers each element of the tax structure in isolation.
We focus our discussion of Table 2 on the CIT base results, leaving a more detailed
analysis of the GSP results to the reader.
Our first result of note in Table 2 is that we find no separate effect of the CIT rate
on tax planning. Instead, the CIT rate only reduces the base in states that impose a
28
throwback rule. More specifically, the CIT base falls by 7.1 percent for every one-
percentage-point increase in the top CIT rate. Combined reporting requirements are
effective in increasing CIT bases, but the effect depends on whether a throwback rule is
also imposed. The CIT base increase from a combined reporting requirement is large in
states without a throwback rule but falls considerably in states with throwback rules.
This suggests that the throwback rule may have reaped some of the gains that could be
obtained with combined reporting. Increases in the sales factor weight only increase the
CIT base in states that also impose a throwback rule. This is expected since the
“throwing back” of sales into a state will have a greater impact in the formula when a
greater weight is applied to sales. Results do not identify a significant relationship
between LLC allowances and the CIT base.
One policy implication is that combined reporting requirements aid in restoring
corporate income tax bases in most cases without diminishing economic activity.
Alternatively, results indicate that throwback rules often have the perverse effect of
actually diminishing CIT bases.
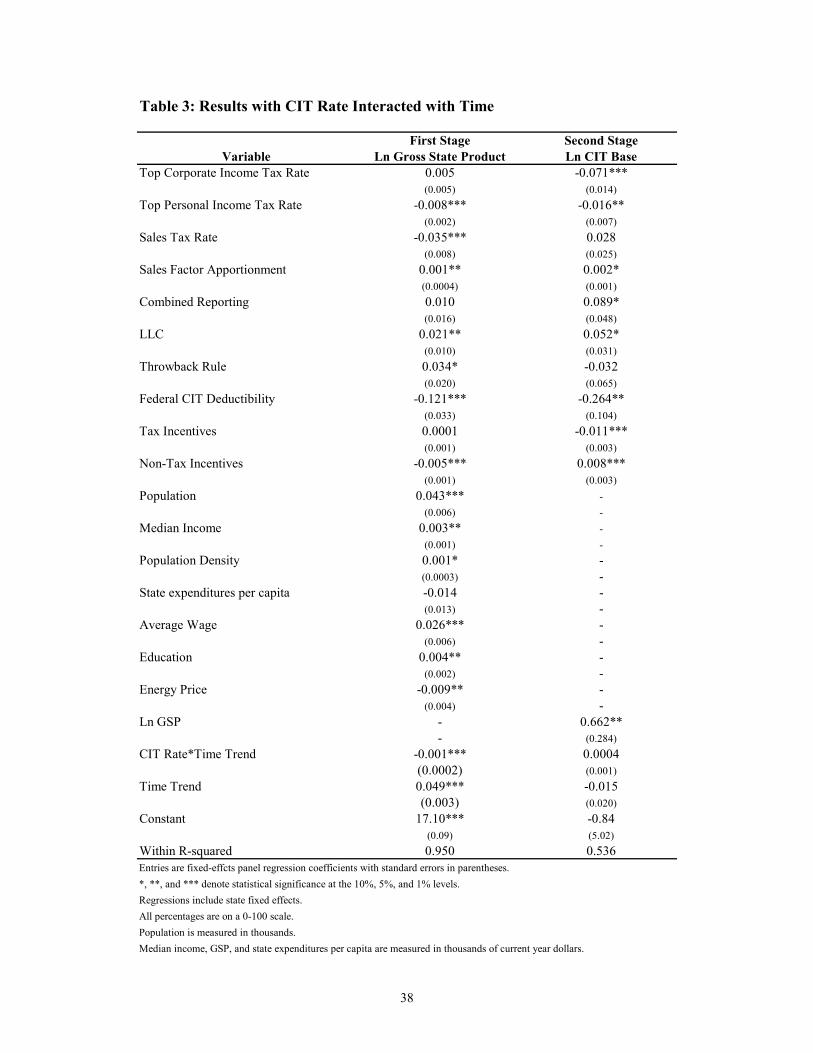
Tax Planning Over Time.
In the third and final component of our study, we examine whether tax planning
has increased over time and whether tax planning has replaced locational distortions. We
use two approaches to investigate this. First, we run the baseline model while fully
interacting the top CIT rate with the year fixed effects. Second, we estimate a model in
which the year fixed effects are replaced with a time trend in both level and interaction
29
terms.35 Results from the latter model are presented in Table 3, while similar yet more
cumbersome results from the former model are omitted for brevity.36
The first goal is to understand how effects of the tax rate on the tax base differ
over time, holding GSP constant. The results from these models do not identify a
significant difference in the effect of the CIT rate on the CIT base over time, providing
evidence that tax planning was equally prevalent throughout the period of analysis.37
If tax planning and location responses to tax policy are substitutes, the effect of
the CIT rate on GSP might decline over time if firms are beginning to use financial
arrangements to avoid taxes, as opposed to location responses. This question is examined
in the first stage of the model. However results from this model indicate that the
corporate income tax rate actually has a larger negative effect on GSP over time. A
possible explanation for this puzzling result is that new technologies may enhance firms’
abilities to produce remotely, by increasing firm mobility. Perhaps this effect dominates
any tax planning effect. In other words, firms may have a growing ability to produce in
one state and sell nationwide given the increased use of on-line shopping and better
information technologies. Therefore, firms can respond more strongly to taxes because
they need not be in a particular location to serve their customers. Further research is
required to verify this hypothesis. All other findings of this model are similar to the
baseline model with the exception of the combined reporting variable (and LLC
35 The time trend takes on the values of 1 to 17 for the years 1985 through 2001, respectively. 36 The only difference between the specification with year fixed effects and a year time trend is the effect of LLC allowances. In the latter model, the LLC allowance variable is positive and significant while it is not in the former. This variable is probably identifying a time effect in the time trend model given the pattern of LLC introductions. 37 A third model is estimated that included a quadratic time trend and the corresponding CIT rate interaction. The coefficients on the quadratic terms are not statistically different from zero in this model, and other results are largely unchanged.
30
allowances as noted). Here a combined reporting requirement has a positive and
statistically significant effect on the CIT base.
6. Conclusions
In this paper an econometric model is developed to test the extent to which tax
planning activities in response to differences in state business tax policies have affected
state corporate income tax bases. Results strongly suggest that tax planning activity
significantly diminishes taxable corporate profits in high tax states. In particular, state
corporate income tax bases decline by nearly seven percent following a one-percentage-
point increase in the top corporate income tax rate, holding Gross State Product and other
state policy parameters constant. More in-depth analysis provides evidence that
throwback rules are not effective in restoring state corporate income tax bases in most
states. This result can be interpreted as evidence that firms seek out more planning
opportunities when they are cost-justified by high corporate tax rates combined with a
throwback rule. In contrast, combined reporting requirements are found to be somewhat
effective in restoring corporate tax bases in most cases, but their effect is lessened in
states with throwback rules.
No evidence is found that the effects of tax planning on state corporate income tax
bases have grown over time. In addition, findings do not indicate that tax planning
activity has replaced locational responses to tax policy over the past decade and a half.
These findings are very important for policymakers to consider in designing better
corporate income tax systems. First, policymakers should consider significant tax-
planning-related base erosion that would likely follow an increase in the corporate
31
income tax rate. Second, if policymakers decide that restoring, or at least maintaining,
the corporate income tax base is desirable, evidence suggests that combined reporting
requirements are often effective in partially achieving this goal. At the same time, there
is no evidence that these requirements diminish economic activity in states. Next, results
provide no evidence that increased tax planning activity is a contributor to the recent
corporate income tax base erosion. Further research is needed to better understand the
causes of this trend. Last, results indicate that the sales tax rate significantly diminishes
economic activity in states while corporate income and personal income tax rates have
either statistically insignificant or very small effects.
32
References
Associated Industries of Massachusetts. 2004. “A Response to Proponents of Combined Reporting: Combined Reporting is Bad for Massachusetts.” State Tax Notes, April 12: 135-136.
Bartik, Timothy J. 1994. “Jobs, Productivity, and Local Economic Development:
What Implications Does Economic Research Have For The Role of Government?” National Tax Journal, 47(4): 847-861.
Bartik, Timothy J. 1991. “Who Benefits From State and Local Economic
Development Policies?” Upjohn Institute: Kalamazoo, MI. Bankman, Joseph. 1999. “The New Market in Corporate Tax Shelters.” Tax Notes,
June 21: 1775-1795. Cline, Robert, William Fox, Thomas S. Neubig, and Andrew Phillips. 2003a. “A
Closer Examination of the Total State and Local Business Tax Burden.” State Tax Notes, January 27: 295-303.
Cline, Robert, William Fox, Thomas S. Neubig, and Andrew Phillips. 2003b. “Total
State and Local Business Taxes: Fiscal Year 2003 Update.” State Tax Notes, October 20: 205-210.
Cline, Robert, John L. Mikesell, Thomas S. Neubig, and Andrew Phillips. 2005.
“Sales Taxation of Business Inputs: Existing Tax Distortions and the Consequences of Extending the Sales Tax to Business Services.” State Tax Notes, February 14: 457-470.
Crocker, Keith J., and Joel Slemrod. 2004. “Corporate Tax Evasion With Agency
Costs.” NBER Working Paper 10690, Cambridge, MA. Desai, Mihir A. 2002. “The Corporate Profit Base, Tax Sheltering Activity, and the
Changing Nature of Employee Compensation.” NBER Working Paper 8866, Cambridge, MA.
Desai, Mihir A. and James R. Hines, Jr. 2002. “Expectations and Expatriations:
Tracing the causes and Consequences of Corporate Inversions.” National Tax Journal, 60(3): 409-456.
Edmiston, Kelly. 2002. “Strategic Apportionment of the State Corporate Income
Tax.” National Tax Journal 60(2): 239-262. Federation of Tax Administrators (FTA). 2004. “Range of State Corporate Income
Tax Rates.” Available at http://www.taxadmin.org/fta/rate/corp_inc.html. Accessed September 10.
33
Fox, William F., and LeAnn Luna. 2002. “State Corporate Tax Revenue Trends: Causes and Possible Solutions.” National Tax Journal, 55(3): 491-508.
Fox, William F., and LeAnn Luna. Forthcoming. “Do LLCs Explain Declining State
Corporate Tax Revenues?” Public Finance Review. Fox, William F., LeAnn Luna, and Matthew Murray. 2005. “How Should a Subnational
Corporate Income Tax on MultiState Businesses be Structured?” National Tax Journal, 58(1): 139-159.
Gentry, William M., and R. Glenn Hubbard. 1998. “Fundamental Tax Reform and
Corporate Financial Policy,” in Tax Policy and the Economy, James M. Poterba (ed.), v 12:191-227.
Hausman, J.A. 1978. “Specification Tests in Econometrics.” Econometrica,
46:1251-1271. Hines, James R., Jr. 2002. “On the Timeliness of Tax Reform.” NBER Working
Paper 8909, Cambridge, MA. Houghton, Kendall L., Ferdinand Hogroian, and Adam Weinreb. 2004.
“Unitary/Combined Filings: Old Concept, New Focus.” State Tax Notes, August 9: 457-471.
Inman, Robert P. and Daniel L. Rubinfeld. 1996. “Designing Tax Policies in
Federalist Economies: An Overview.” Journal of Public Economics, 60: 307- 334.
Internal Revenue Service. Various Years. “Annual Report: Commissioner of the
Internal Revenue and the Chief Counsel for the Internal Revenue Service.” Washington, D.C.
Luna, LeAnn. 2004. “Corporate Tax Avoidance Strategies and Solutions.” Journal
of Multi-State Taxation and Incentives, 14(2): 6-17, 46-48. Mackie, James B., III. 2000. “The Puzzling Comeback of the Corporate Income
Tax.” Proceedings of the Ninety-Second Annual Conference on Taxation, 93-102. Washington, DC: National Tax Association.
Mazerov, Michael. 2003. “Closing Three Common Corporate Income Tax
Loopholes Could Raise Additional Revenue For Many States.” Center for Budget and Policy Priorities: Washington, DC, May 23.
McIntyre, Michael J., Paul Mines, and Richard D. Pomp. 2001. “Designing a
Combined Reporting Regime for a State Corporate Income Tax: A Case Study of Louisiana.” State Tax Notes, September 3.
34
Mintz, Jack, and Michael Smart. 2004. "Income Shifting, Investment, and Tax Competition: Theory and Evidence from Provincial Taxation in Canada." Journal of Public Economics, 88: 1149-1168.
National Association of State Development Agencies. Various years. “Directory of
Incentives for Business Investment and Development in the United States: A State-by-State Guide.” Urban Institute: Washington D.C.
Rego, Sonja Olhoft. 2003. “Tax-Avoidance Activities of U.S. Multinational
Corporations.” Contemporary Accounting Research, (20)4: 805-833. Ring, Raymond J., Jr. 1999. “Consumer’s Share and Producer’s Share of the
General Sales Tax.” National Tax Journal 52(1): 79-90. Schiller, Zach. 2002. “Ohio’s Vanishing Corporate Franchise Tax.” State Tax
Notes, November 25. Slemrod, Joel. 2004. “The Economics of Corporate Tax Selfishness.” National Tax
Journal, 57(4): 877-899. Slemrod, Joel. 2001. “A General Model of the Behavioral Response to Taxation.” International Tax and Public Finance 8(2): 119-128. Slemrod, Joel. 1998. “Methodological Issues in Measuring and Interpreting Taxable Income Elasticities.” National Tax Journal 51(4): 773-788. Tax Management Multistate Tax Report. 2004. “Holding Companies.” Volume 11(4): S-
65-S68. U.S. Department of the Treasury. 1999. “The Problem of Corporate Tax Shelters.”
Washington, DC, July. U.S. General Accounting Office. 2003. “Challenges Remain in Combating Abusive
Tax Shelters.” Testimony before the Senate Finance Committee on Finance. Washington, DC, October 21.
U.S. General Accounting Office. 1998. “IRS’ Tax Gap Studies.”
GAP/GGD-88-66BR. Washington, DC, October 21. Wasylenko, Michael. 1997. “Taxation and Economic Development: The State of the
Economic Literature.” New England Economic Review, March/April: 37-52. Wasylenko, Michael, and Therese McGuire. 1985. “Jobs and Taxes: The Effect of
Taxes on States’ Employment Growth Rates.” National Tax Journal, 38(4): 497-514.

35
Zodrow, George R. 2003. “Reflections on the Economic Theory of Local Tax Incentives.” State Tax Notes, June 9.
36
Table 1: Baseline Model
First Stage Second Stage OLS ResultsVariable Ln Gross State Product Ln CIT Base
Top Corporate Income Tax Rate -0.003 -0.066*** -0.064***(0.004) (0.013) (0.013)
Top Personal Income Tax Rate -0.006*** -0.015** -0.014**(0.002) (0.006) (0.006)
Sales Tax Rate -0.036*** 0.020 0.028(0.008) (0.024) (0.023)
Sales Factor Apportionment 0.001* 0.003** 0.002**(0.0004) (0.001) (0.001)
Combined Reporting -0.012 0.067 0.078*(0.016) (0.047) (0.046)
LLC 0.005 -0.027 -0.026(0.012) (0.035) (0.035)
Throwback Rule 0.038 -0.019 -0.041(0.021) (0.063) (0.061)
Federal CIT Deductibility -0.107*** -0.301*** -0.271***(0.033) (0.100) (0.097)
Tax Incentives -0.001 -0.009*** -0.008***(0.001) (0.003) (0.003)
Non-Tax Incentives -0.005*** 0.007** 0.009***(0.001) (0.003) (0.003)
Population 0.054*** - -(0.007) - -
Median Income 0.004*** - -(0.001) - -
Population Density 0.0001 - -(0.0003) - -
State expenditures per capita -0.029** - -(0.013) - -
Average Manufacturing Wage 0.037*** - -(0.006) - -
Education 0.004* - -(0.002) - -
Energy Price -0.011* - -(0.006) - -
Ln GSP - 0.604*** 0.915***- (0.243) (0.098)
Constant 17.71*** -0.025 -5.82***(0.15) (4.54) (1.84)
Within R-squared 0.950 0.575 0.580Entries are fixed-effcts panel regression coefficients with standard errors in parentheses.*, **, and *** denote statistical significance at the 10%, 5%, and 1% levels.Regressions include state and year fixed effects.All percentages are on a 0-100 scale. Population is measured in thousands. Median income, GSP, and state expenditures per capita are measured in thousands of current year dollars.
Instrumental Variables Model Results
37
Table 2: Results with CIT Rate Interactions
First Stage Second StageVariable Ln Gross State Product Ln CIT Base
Top Corporate Income Tax Rate 0.028** -0.016(0.013) (0.040)
Top Personal Income Tax Rate -0.007*** -0.015**(0.002) (0.007)
Sales Tax Rate -0.045*** 0.002(0.008) (0.025)
Sales Factor Apportionment 0.002 -0.002(0.002) (0.006)
CIT Rate*Sales Apportionment -0.0003 -0.0002(0.0003) (0.001)
Combined Reporting 0.230** 0.670**(0.095) (0.300)
CIT Rate*Combined Reporting -0.0004 -0.030(0.007) (0.020)
LLC 0.075*** -0.030(0.016) (0.052)
CIT Rate*LLC -0.011*** 0.002(0.002) (0.006)
Throwback Rule 0.135* 0.336(0.072) (0.226)
CIT Rate*Throwback Rule -0.020*** -0.071***(0.009) (0.027)
Combined Reporting*Sales Appt -0.001 -0.0004(0.001) (0.003)
Throwback Rule*Sales Appt 0.002*** 0.006*(0.001) (0.003)
Combined Reporting*Throwback Rule -0.190*** -0.376**(0.053) (0.172)
Federal CIT Deductibilty -0.093*** -0.148(0.035) (0.108)
Tax Incentives 0.0001 -0.007**(0.001) (0.003)
Non-Tax Incentives -0.004*** 0.007**(0.001) (0.003)
Population 0.047*** -(0.006) -
Median Income 0.004*** -(0.001) -
Population Density 0.0010 -(0.0003) -
State expenditures per capita -0.013 -(0.013) -
Average Wage 0.034*** -(0.006) -
Education 0.004** -(0.002) -
Energy Price -0.011* -(0.006) -
Ln GSP - 0.444*- (0.252)
Constant 17.44*** 2.75(0.16) (4.68)
Within R-squared 0.954 0.580Entries are fixed-effcts panel regression coefficients with standard errors in parentheses.*, **, and *** denote statistical significance at the 10%, 5%, and 1% levels.Regressions include state and year fixed effects.All percentages are on a 0-100 scale. Population is measured in thousands. Median income, GSP, and state expenditures per capita are measured in thousands of current year dollars.
38
Table 3: Results with CIT Rate Interacted with Time
First Stage Second StageVariable Ln Gross State Product Ln CIT Base
Top Corporate Income Tax Rate 0.005 -0.071***(0.005) (0.014)
Top Personal Income Tax Rate -0.008*** -0.016**(0.002) (0.007)
Sales Tax Rate -0.035*** 0.028(0.008) (0.025)
Sales Factor Apportionment 0.001** 0.002*(0.0004) (0.001)
Combined Reporting 0.010 0.089*(0.016) (0.048)
LLC 0.021** 0.052*(0.010) (0.031)
Throwback Rule 0.034* -0.032(0.020) (0.065)
Federal CIT Deductibility -0.121*** -0.264**(0.033) (0.104)
Tax Incentives 0.0001 -0.011***(0.001) (0.003)
Non-Tax Incentives -0.005*** 0.008***(0.001) (0.003)
Population 0.043*** -(0.006) -
Median Income 0.003** -(0.001) -
Population Density 0.001* -(0.0003) -
State expenditures per capita -0.014 -(0.013) -
Average Wage 0.026*** -(0.006) -
Education 0.004** -(0.002) -
Energy Price -0.009** -(0.004) -
Ln GSP - 0.662**- (0.284)
CIT Rate*Time Trend -0.001*** 0.0004(0.0002) (0.001)
Time Trend 0.049*** -0.015(0.003) (0.020)
Constant 17.10*** -0.84(0.09) (5.02)
Within R-squared 0.950 0.536Entries are fixed-effcts panel regression coefficients with standard errors in parentheses.*, **, and *** denote statistical significance at the 10%, 5%, and 1% levels.Regressions include state fixed effects.All percentages are on a 0-100 scale. Population is measured in thousands. Median income, GSP, and state expenditures per capita are measured in thousands of current year dollars.
39
Appendix 1: Summary Statistics
Mean Std.Dev. Mean Std.Dev.Non-Government Gross State Product (millions) 72,000 87,300 178,000 217,000Corporate Income Tax Collections (thousands) 265,564 334,276 590,840 1,091,370Top Corporate Income Tax Rate 6.5 3.2 6.6 2.9Top Personal Income Tax Rate 6.9 4.9 5.6 3.2Sales Tax Rate 4.1 1.7 4.6 1.8Sales Factor Apportionment 32.6 16.1 42.2 22.6Combined Reporting 0.18 0.39 0.28 0.45Throwback Rule 0.49 0.50 0.46 0.50LLC 0 0 1 0Federal CIT Deductibility 0.09 0.28 0.06 0.22Tax Incentives 10.2 1.9 8.6 6.1Non-tax Incentives 4.7 2.7 12.56 7.99Population (thousands) 4,745 5,068 5,694 6,300Median Income (thousands) 32.0 4.0 62.0 9.0Population Density 160 228 184 253State expenditures per capita (thousands) 1.8 1.1 4.3 1.2Average Wage 9.4 1.2 14.5 1.6Education 18.5 3.6 25.4 4.3Energy Price 8.5 1.1 10.0 1.6Notes: All percentages are on a 0-100 scale.All dollar amounts are expressed as current year dollars.
1985 2001

40
Appendix 2: Data Descriptions and Source Notes
Variable DefinitionNon-Government Gross State Product Total Gross state product less GSP from government sector. (1)Corporate Income Tax Base Corporate income tax (CIT) revenues divided by top marginal CIT rate. (2)Top Corporate Income Tax Rate Highest marginal corporate income tax rate. (3)Top Personal Income Tax Rate Highest marginal personal income tax rate. (3)Sales Tax Rate General sales tax rate. (3)Sales Factor Apportionment Weight given to sales factor in the corporate income tax apportionment formula. (3)Combined Reporting 1 if a state has a combined reporting requirement. (3)Throwback Rule 1 if a state has a throwback rule. (4)LLC 1 if a state allows LLCs. (5) Federal CIT Deductibility 1 if a state allows deduction of federal CIT liability from state CIT liability. (12)Tax Incentives Number of tax incentive programs a state offers. (6)Non-Tax Incentives Number of non-tax incentive programs a state offers. (6)Population (thousands) State population. (7)Median Income (thousands) State median income. (7)Population Density Population/square miles in a state. (8)State expenditures per capita (thousands) State government expenditures/population. (9)Average Wage Average hourly wage for manufacturing workers. (10)Education Percent of population over age 25 that hold at least a Bachelor's degree. (7) Energy Price Estimate of energy costs for all forms of energy, measured per million Btu. (11)
Source Notes:1. Regional Economic Accounts , Bureau of Economic Analysis, various years.2. Author's calculations based on data from State Government Finances , U.S. Census Bureau, various years, and State Tax Handbook , Commerce Clearing House, various years.3. State Tax Handbook , Commerce Clearing House, various years.4. State Tax Handbook , Commerce Clearing House (various years) and various state revenue departments.5. www.llcweb.com6. National Association of State Development Agencies, various years.7. Statistical Abstract of the United States , U.S. Census Bureau, various years.8. Author's calculations based on data from Statistical Abstract of the United States , U.S. Census Bureau, various years.9. Author's calculations based on data from State Government Finances , U.S. Census Bureau, various years.10. Employment and Wages, U.S. Bureau of Labor Statistics, various years.11. Energy Price Estimates by Source , U.S. Department of Energy, various years.12. We thank Justin Garosi for assembiling these data from primary sources.