Embed Size (px)
Citation preview
On the Effectiveness of
Patenting Strategies in
Innovation Races
_______________
Jürgen MIHM
Fabian J. STING
Tan WANG
2013/88/TOM
(Revised version of 2012/28/TOM)

On the Effectiveness of Patenting Strategies in
Innovation Races
Jürgen Mihm*
Fabian J. Sting**
Tan Wang***
Revised version of 2012/28/TOM
The authors gratefully acknowledge comments and suggestions by Vikas Aggarwal,
Knut Blind, Murat Tarakci.
* Associate Professor of Technology and Operations Management at INSEAD, Boulevard de
Constance 77305 Fontainebleau, France. Email: [email protected]
** Assistant Professor of Operations Management at Erasmus University Rotterdam,
Burgemeester Oudlaan 50, 3062 PA, Rotterdam, Netherlands. Email: [email protected]
*** Dataesp Private Ltd. 437 Kew Crescent, Singapore, 466260
Email: [email protected]
A Working Paper is the author’s intellectual property. It is intended as a means to promote research to
interested readers. Its content should not be copied or hosted on any server without written permission
from [email protected]
Find more INSEAD papers at http://www.insead.edu/facultyresearch/research/search_papers.cfm

On the Effectiveness of Patenting Strategiesin Innovation Races
Jurgen MihmINSEAD, Boulevard de Constance, 77305 Fontainebleau, France [email protected]
Fabian J. StingErasmus University Rotterdam, Burgemeester Oudlaan 50, 3062 PA, Rotterdam, [email protected]
Tan WangDataesp Private Ltd. 437 Kew Crescent, Singapore, 466260 [email protected]
Which inventions should a company patent? Should it patent at all? Many companies engaged in an inno-
vation race seek a patenting strategy that will protect their intellectual property, but not much is known
about factors that determine the best strategy. Although scholars in various management, economics, and
engineering disciplines have conducted research on patents, little work has addressed the normative issues
pertaining to formation of an appropriate patenting strategy. We develop an inventory of patenting strate-
gies and integrate them into a framework accommodating the contingencies that influence their selection.
Our simulation model characterizes the optimal patenting choices for different settings, and it captures the
dynamics between firms that compete via strategic interactions. We identify those competitive dynamics
driven by the choice of R&D strategy as the most salient determinant of the firm’s optimal patenting strategy.
Thus our research contributes to establishing a contingency theory of patenting strategies.
Key words : Patent Strategies, Innovation Races, NK Modeling, Strategic Interaction, Complex Landscapes
History : initial submission
1. Introduction
Should a company patent a certain invention? More generally, what inventions should a company
patent? (All of them? None at them? A select subset?) And upon what factors should the choice
of such a patenting strategy depend?
A wealth of literature has illuminated different facets of the impact that patents have on indi-
vidual companies and on economies as a whole. Research in economics has established the role of
patenting in giving firms an incentive to innovate (Arrow 1962, Loury 1979, Dasgupta and Stiglitz
1980). Research in business strategy has established that patents can effectively impede imitation
(for products or certain capabilities) and thereby sustain competitive advantages (Teece 1986, Hall
1993, Teece et al. 1997). In addition, evolutionary scholars have found that a firm’s long-term suc-
cess depends crucially not only on the strength of its own patents but also on its ability to absorb
the knowledge embodied in extant patents (Cohen and Levinthal 1990, Zahra and George 2002).
1
2 On the Effectiveness of Patenting Strategies
Both the empirical and the practitioner literature on patents have explored motives for patenting
and have identified elements of generic patenting strategies (Blind et al. 2006).
Despite this rich body of research on patents, we lack a comprehensive understanding of how
firms that are engaged in innovation races can design patenting strategies to their competitive
advantage while taking environmental and firm characteristics into account. This paper makes
two contributions. First, it constitutes a first effort to devise a theory of patenting: we build a
coherent inventory of patenting strategies (systematizing and complementing the existing cursory
knowledge of such strategies) and then integrate that knowledge into a common framework that
considers as contingencies the firm’s R&D strategy, the technological landscape, and competitor
behavior. Second, we use a simulation model to identify which patenting strategies are beneficial
for which R&D strategy and for which type of competitive innovation. Overall, our study helps lay
the foundation for a comprehensive contingency theory of patenting strategies.
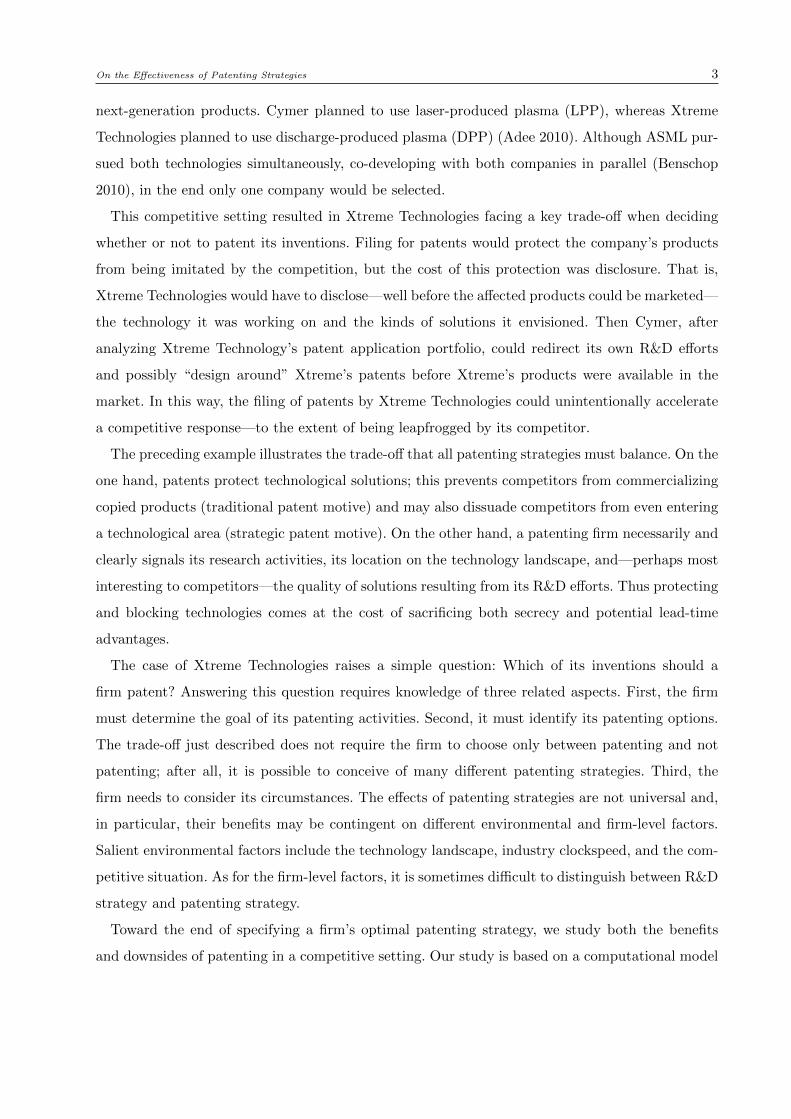
To illustrate the intricacies of choosing a patenting strategy in innovation races, consider the
case of Xtreme Technologies. This company was at the end of the semiconductor supply chain,
and it was argued that the fortune of the entire semiconductor ecosystem depended on its tech-
nological advances. To understand the importance of this company, recall that the advances in
semiconductor capabilities foreseen by Moore’s law (Moore 1965) have changed many aspects of
business and consumer lives in the past 50 years. The pervasiveness of information technology and
the proliferation of digital consumer goods could not have arisen without relentless advances in
the performance of semiconductors. These performance leaps were made possible by the ability
of semiconductor manufacturers, such as Intel and Samsung, to shrink transistor sizes by a factor
of 2 every other year; hence they were increasingly able to fit more circuitry on a single semicon-
ductor chip, which continued to expand its computational power. In order to effect this shrinkage,
semiconductor manufacturers relied on a critical manufacturing process: lithography. Yet in 2011
a single company, ASML, held a near monopoly in selling and developing lithography equipment;
this company controlled about three fourths of the general market and nearly all of the market for
the most advanced technology.
In 2010, ASML faced the challenge of totally revising the architecture of their lithography
tools. For the next equipment generation, AMSL would need to introduce extreme ultraviolet
lithography (EUVL). So for the first time in a decade, the company would have to exchange its
most critical product component: the light source. Two outside companies—Cymer and Xtreme
Technologies—were competing to become the supplier of this light source for the near monopolist
upon which every advanced semiconductor manufacturer would need to rely when developing their
On the Effectiveness of Patenting Strategies 3
next-generation products. Cymer planned to use laser-produced plasma (LPP), whereas Xtreme
Technologies planned to use discharge-produced plasma (DPP) (Adee 2010). Although ASML pur-
sued both technologies simultaneously, co-developing with both companies in parallel (Benschop
2010), in the end only one company would be selected.
This competitive setting resulted in Xtreme Technologies facing a key trade-off when deciding
whether or not to patent its inventions. Filing for patents would protect the company’s products
from being imitated by the competition, but the cost of this protection was disclosure. That is,
Xtreme Technologies would have to disclose—well before the affected products could be marketed—
the technology it was working on and the kinds of solutions it envisioned. Then Cymer, after
analyzing Xtreme Technology’s patent application portfolio, could redirect its own R&D efforts
and possibly “design around” Xtreme’s patents before Xtreme’s products were available in the
market. In this way, the filing of patents by Xtreme Technologies could unintentionally accelerate
a competitive response—to the extent of being leapfrogged by its competitor.
The preceding example illustrates the trade-off that all patenting strategies must balance. On the
one hand, patents protect technological solutions; this prevents competitors from commercializing
copied products (traditional patent motive) and may also dissuade competitors from even entering
a technological area (strategic patent motive). On the other hand, a patenting firm necessarily and
clearly signals its research activities, its location on the technology landscape, and—perhaps most
interesting to competitors—the quality of solutions resulting from its R&D efforts. Thus protecting
and blocking technologies comes at the cost of sacrificing both secrecy and potential lead-time
advantages.
The case of Xtreme Technologies raises a simple question: Which of its inventions should a
firm patent? Answering this question requires knowledge of three related aspects. First, the firm
must determine the goal of its patenting activities. Second, it must identify its patenting options.
The trade-off just described does not require the firm to choose only between patenting and not
patenting; after all, it is possible to conceive of many different patenting strategies. Third, the
firm needs to consider its circumstances. The effects of patenting strategies are not universal and,
in particular, their benefits may be contingent on different environmental and firm-level factors.
Salient environmental factors include the technology landscape, industry clockspeed, and the com-
petitive situation. As for the firm-level factors, it is sometimes difficult to distinguish between R&D
strategy and patenting strategy.
Toward the end of specifying a firm’s optimal patenting strategy, we study both the benefits
and downsides of patenting in a competitive setting. Our study is based on a computational model
4 On the Effectiveness of Patenting Strategies
using the NK framework. Such modeling gives us control over all decision variables, enabling us to
systematize current knowledge within a comprehensive overall framework. It is by analyzing this
framework that we make a step toward developing a contingency theory of strategic patenting. We
find that, among the contingency factors considered, the two that are most influential on outcomes
are the firm’s R&D strategy and the present competitive situation. So for different R&D strategies
and competitive situations, we identify the firm’s optimal patenting strategy and comment on the
resulting industry equilibria. In terms of methodology, our model explicitly captures the dynamic
strategic interactions between firms that are searching technology landscapes; the model thus
introduces the concept of dynamically interacting policies into the NK framework.
2. Motives, Strategies, and Contingencies for Optimal Patenting
In this section we describe the three dimensions that any contingency model should consider.
First, we concentrate on patenting motives and thus on the goals to which a firm may aspire.
Second we identify the different patenting decision options. Third, we focus on contingency factors
that determine the usefulness of those decision options—with respect to patenting motives—under
different environmental and firm circumstances.
Patenting Motives. Why do firms patent? Empirical studies have carefully examined the
motives for patenting—that is, what drives innovating firms to apply for and hold patents (Arundel
et al. 1995, Cohen et al. 2000, OECD 2003, Macdonald 2004, Blind et al. 2006). These studies
provide strong evidence that firms do not patent simply to protect against imitation. Instead
they pursue, and often simultaneously (Levin et al. 1987, Cohen et al. 2000, Blind et al. 2006),
several strategic goals when applying for a patent. Although the goals of patenting may appear
fairly nuanced in practice, Blind and colleagues used factor analysis to condense the multiplicity of
considerations into five basic motives: protection, blockade, exchange, reputation, and incentive.
Beyond the traditional protection motive, which remains the principal driver behind patenting,
firms seek to blockade competitors by anticipating and preempting their use of future technologies.
Such a blockade can serve a defensive or an offensive purpose: defensive blocking prevents competi-
tors from venturing close to the firm’s own technological base (Reitzig 2004a); offensive blocking
aims to impair competitors’ future R&D trajectories regardless of their direction (Granstrand 1999,
p. 215, Blind et al. 2006). The exchange motive presumes that the firm files for patents in order
to improve its bargaining position in patent licensing deals (Crama et al. 2008, Aggarwal and Hsu
2009) as well as in patent exchanges and in the “cross-licensing” of patents (Grindley and Teece
1997, Reitzig 2004b). Cohen et al. (2000) and Kash and Kingston (2001) find that the exchange
On the Effectiveness of Patenting Strategies 5
motive is especially important in industries where inventions by competitors build on each other. In
the electronics industry, for example, inventions are a composite of many individual detail solutions
and so favor cooperation for mutual benefit. Both the reputation and incentive motives—which
are usually considered to be less influential than the motives of protection, blockade, and exchange
(Blind et al. 2006)—are linked to the standing a firm has with respect to key stakeholders. The
reputation motive involves external stakeholders, such as potential investors (Hsu and Ziedonis
2008); the incentive motive is an internal tool for motivating staff (Oldham and Cummings 1996).
It is important to realize that the three preeminent motives (protection, blocking, and exchange)
are not ulterior goals but rather intermediate goals. To see this, note that these particular motives
build on a common characteristic of all patents: establishing a claim in the technology landscape
that the patent owner can prevent others from exploiting. This claim can be used to protect the
firm’s position, to prevent another firm from entering a technology field, or to establish bargaining
power in an exchange situation. (It is worth remarking that secrecy, the alternative to patenting, can
at best achieve only the first of these major patenting motives; see Arundel 2001). Hence the patent
claim can ultimately be used to influence the competitiveness of the firm’s product offering and
thus to create economic value. For both protection and blocking, the economic value expresses itself
in a relative performance advantage of a final product as compared with a competitor’s product.
Protection gives a focal firm the right to implement its preferred technological solution—a right
that it denies the opposing firm. Blockade gives a relative performance advantage to the focal firm
by preventing the opponent from implementing its own preferred solution. The exchange motive
implies that both companies can break a deadlocked situation and, through collaboration, improve
the absolute performance of products offered in the market. Our model should therefore account
for the roles of protection, blocking, and exchange by examining the performance consequences of
staking out claims in the technology landscape.
Patenting Decisions. Motives by themselves are not sufficient to establish a patenting strategy.
It is only when the firm adopts a consistent decision pattern with respect to patenting that we can
speak of its patenting strategy. The literature on patenting decisions is sparse, with Granstrand’s
(1999) typology the rare exception. This book reports that firms explore the technology landscape
through their R&D processes, after which they might use patenting to establish and protect claims
in this landscape for their exclusive economic use. Based on various case studies across nations and
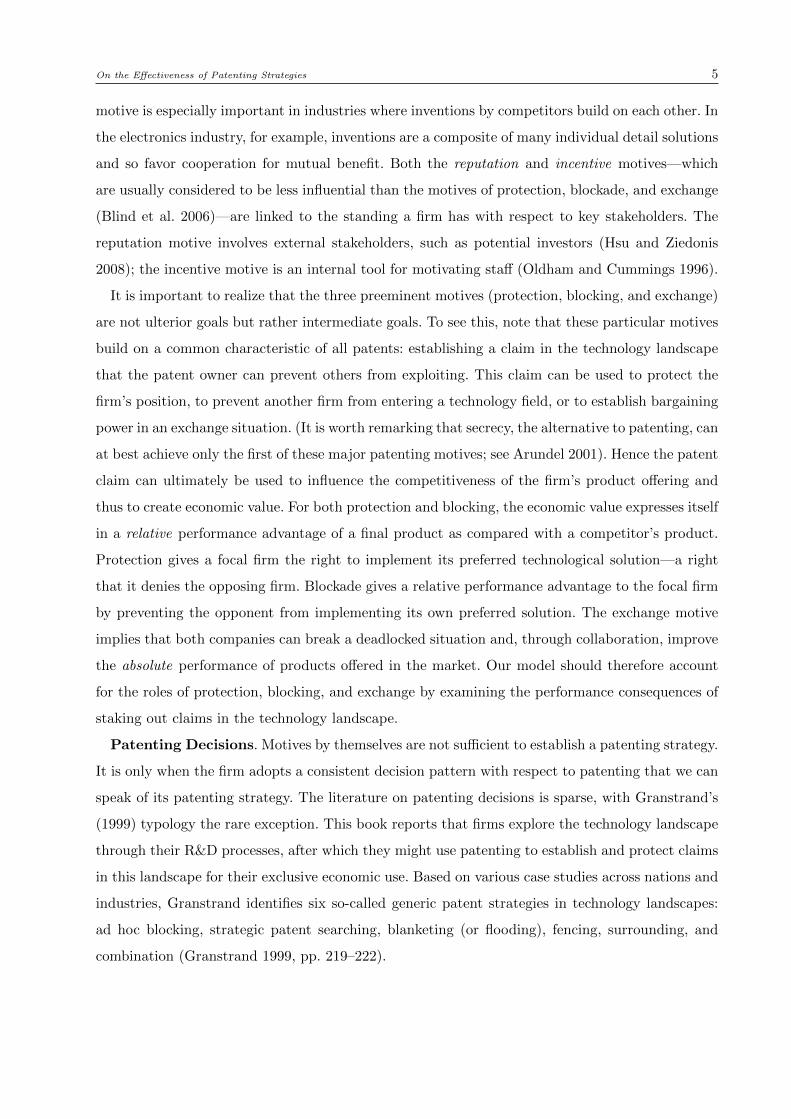
industries, Granstrand identifies six so-called generic patent strategies in technology landscapes:
ad hoc blocking, strategic patent searching, blanketing (or flooding), fencing, surrounding, and
combination (Granstrand 1999, pp. 219–222).
6 On the Effectiveness of Patenting Strategies
Table 1 Patenting Strategies on Technology Landscapes
Blanketing/flooding
Surrounding
Searching for Strategic Patents
Ad hoc blocking
Fencing
Surrounding
Non-disclosing leader
Non-disclosing follower
Leader
Follower
Everything High-Quality
Patent Strategy
Close-Competitor Nothing
R&D
Str
ateg
y
Granstrand (1999), Cohen et al. (2000), Blind et al. (2006),Blind et al. (2009)
Granstrand (1999), Cohen et al. (2000), Reitzig et al. (2007)
Granstrand (1999), Arundel and Patel (2003)
Levin et. al. (1987), Granstrand(1999), Blind et. al. (2006), Blindet. al. (2009)
Lerner (1994), Granstrand (1999), Cohen et. al. (2000), Arundel and Patel (2003), Blind et. al. (2006), Blind et. al. (2009)
[Competitor is close by definition — thus equivalent to patent everything.] Granstrand(1999), Cohen et al.(2000)
Levin et al. (1987), Teece (1986),Cohen et al. (2000), Arundel (2001)
Teece (1986)
Granstrand’s work is a solid starting point for any effort to identify patenting strategies. It is
interesting that, upon closer examination, his mapped strategies turn out to be a combination of
two separate firm decisions. First, the firm’s movement (or trajectory) on the technology landscape
implies a deliberate decision about the direction of R&D; second, the choice of whether or not to
patent a specific technological invention presupposes a patenting rule (or, more broadly, a patenting
strategy). Consistently with Granstrand’s work, we recognize that patenting decisions cannot be
analyzed without taking into account the firm’s overarching R&D strategy. In contrast to his work,
however, we make a deliberate distinction between the two; thus we are able to systematize and
complement current thinking on these strategies.
Table 1 proposes a typological framework for classifying a firm’s patenting strategy along two
crucial dimensions, and it classifies the extant literature accordingly. The first dimension is the
patenting rule that dictates when an invention should be patented. A firm that patents everything
seeks patent protection for every solution generated by its R&D activities. A firm that applies the
high-quality patenting rule files patents only for those solutions that offer superior performance.
When patenting under the close-competitor rule, a firm tries to anticipate its competitors’ future
movements and then to patent only those inventions that are in those firms’ technology terrains;
this rule is most closely related to the blocking motive. The patent nothing rule reflects the notion
that secrecy will prevent others from exploiting the focal firm’s inventions (Levin et al. 1987,
Cohen et al. 2000, Arundel 2001); thus this strategy seeks to achieve protection via a means other
than patenting. The second dimension of our framework is the firm’s R&D strategy. Research
and development efforts provide the technological solutions eligible for patenting. We follow Teece
(1986) and distinguish between leaders, who autonomously explore the technology landscape, and
followers, whose R&D activities are geared to imitate and thus chase competitors’ technology
trajectories.
On the Effectiveness of Patenting Strategies 7
The combination of what we designate a patenting rule and an R&D strategy forms what
Granstrand would call a patenting strategy, and our classification subsumes his typology. For
instance, the “patenting everything” rule followed by an innovation leader that files patents for
every solution developed on its path through the technology landscape can be identified as a blan-
keting/flooding strategy. At the same time, the “patent everything” decision rule when used by
an innovation follower will take the form of a surrounding strategy. In order to avoid confusion,
hereafter we shall use the term “patenting strategy” in the more narrow sense of a patenting rule.
Contingency Factors. The two-dimensional classification proposed by Table 1 demonstrates
that patenting decisions take effect contingent on a firm’s given R&D strategy. The same patenting
strategy will lead to different outcomes when pursued in combination with a different R&D strategy.
Hence we submit to the view that a firm’s R&D strategy is an important internal contingency
factor for the effectiveness of any patenting strategy.
Environmental contingency factors also moderate how various patenting strategies affect firm
goals in different settings. Although many environmental factors affect the success of a patenting
strategy, two are salient in the literature. First, extensive empirical evidence suggests that a focal
firm’s patenting behavior should not be analyzed in isolation from the behavior of other firms. The
reason is that observed patenting behavior actually follows from strategic interaction in so-called
patent (portfolio) races (Hall and Ziedonis 2001, Ziedonis 2004, Hall 2005). To see that, consider
a firm that suddenly begins to flood entire technological areas with patents. The change in patent
behavior causes other firms in the industry to adapt by intensifying their own patenting activities
(Jell and Henkel 2010). In this case, more patenting simply reduces their risk of being blocked or
being sued for infringement (Ziedonis 2004). Hence competitor behavior is critical to a contingency
model of patenting. Since a competitor’s patenting likewise takes effect contingent on its R&D
strategy, modeling strategic interaction necessarily requires incorporating both the competitor’s
R&D strategy as well as its patenting strategies as environmental contingencies for a focal firm.
A second factor is industry characteristics—in particular, technological complexity (Cohen et al.
2000) and industry clockspeed (Nadkarni and Narayanan 2007). Technological complexity affects
how easily innovation can be appropriated in focal markets (Grindley and Teece 1997, Hall and
Ziedonis 2001, Ziedonis 2004, Ceccagnoli 2009), and industry clockspeed affects how much time
each company has to perform its technology search (Chao and Kavadias 2008) and patenting
activities (Nadkarni and Narayanan 2007). Any model of patenting should accommodate both of
these industry characteristics.
8 On the Effectiveness of Patenting Strategies
Our understanding of patent races has been largely informed by economic models (for a detailed
overview, see e.g. Pollock 2008). However, a model that incorporated patenting motives, patent-
ing strategies (with their corresponding R&D strategies), and relevant contingencies would differ
considerably from those models. The basic features of “patent race models” in economics (Loury
1979, Dasgupta and Stiglitz 1980, Delbono and Denicolo 1991) are as follows: (i) a firm’s decision
variable is R&D effort, which is typically measured by dollar expenditures; (ii) a known (mem-
oryless) function links current effort to probability of discovery; and (iii) firms exhibit rational
behavior and interact strategically. In studying patent races between firms, the cited research sets
out to answer this question: “Which patent structure maximizes industry innovation?” In other
words, models of patent races have been devised to inform policy makers about optimal patenting
regimes. Yet because of their high-level focus, such models abstract from important aspects of
actual patenting activities. In particular: the choice of patenting strategy is not a main decision
variable; R&D processes are not represented as search on technology landscapes (Erat and Krish-
nan 2012, Oraiopoulos and Kavadias 2012); and, since these models do not incorporate the concept
of search, they fail to consider the trade-off between secrecy and disclosure as a source of strategic
interaction between competitors. In short, the level of analysis in patent race models makes them
unsuitable for our research question of how a specific firm should determine its patenting strategy.
A model fulfilling the requirements just alluded to would fill an important gap in the literature.
We remark that it need not accommodate the detailed facets of patenting activity (unlike many of
the empirical and conceptual works cited in this section) and that it need not focus on the overall
economic impact of patent races (unlike primarily economic models). Instead, this model aims to
create a framework for making decisions about strategic patenting under competition at the firm
level. It abstracts sufficiently from individual details to focus on overall firm patenting strategies,
yet it remains sufficiently fine grained to address questions about how firms should formulate their
patenting strategies.
3. Model
In the previous section we identified critical factors that a contingency model for patenting must
consider: patenting motives driving competitive advantage as the goal of all patenting activities,
patenting strategies as the templates for how firms decide on what they ultimately protect, and
internal contingencies (i.e., the R&D strategy) and environmental contingencies (i.e., the competi-
tors’ patenting and R&D strategies, industry clockspeed and complexity) as mediators between
those patenting strategies and the firm’s achievement of its patenting goals. Thus the model’s
On the Effectiveness of Patenting Strategies 9
predictions must reflect the competitive advantage fostered by patenting motives, the decision vari-
ables in the deployment of patenting strategies, and the parameters needed to reproduce the most
salient internal and environmental contingency factors.
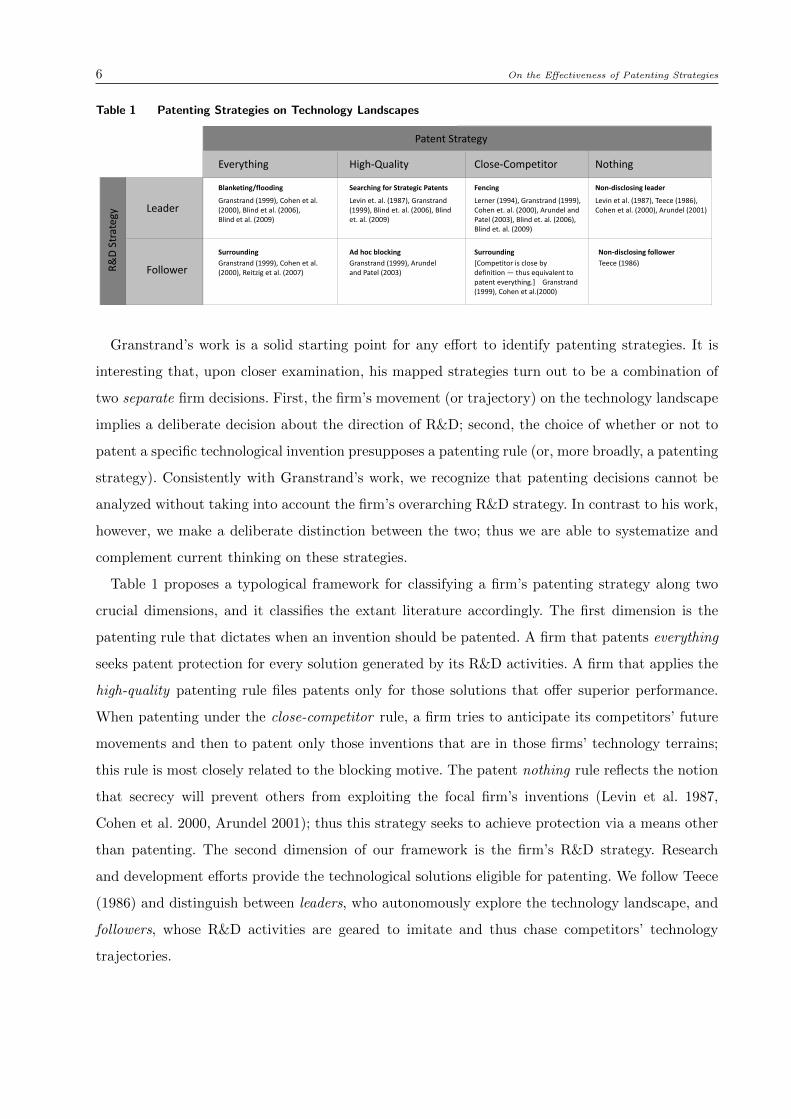
A central aspect of our model that helps to formalize these requirements is the notion of a general
technology space or “technology landscape” (Granstrand 1999). The technology landscape links
agent decisions to outcomes: it models the performance outcome of R&D decisions on a fitness
landscape by assigning a fitness value to each of all conceivable technology configurations. The
resulting map consists of “coordinates” representing particular product solutions and “altitude
curves” assessing the quality of those solutions; this map of the landscape thus establishes a basis
for the economic value of protection. Hence the fitness dimension represents the competitive situa-
tion that patenting motives seek to affect: the economic value embodied in technological solutions
can be protected for exclusive exploitation, competitors can be blocked from deriving that value,
and it can be used as part of an exchange. Different companies might search the technology land-
scape in different ways, thereby implementing different R&D strategies. Contingent on their R&D
strategies, firms implement different patenting strategies by reserving (or not) certain locations
on the technology landscape for their exclusive use. The various patent strategies can be used
to characterize the focal firm’s behavior and thus serve as our main decision variables; however,
they do also characterize competitor behavior and so function as environmental contingency factor.
Finally, the landscape’s structural properties can be adjusted and therefore represent additional
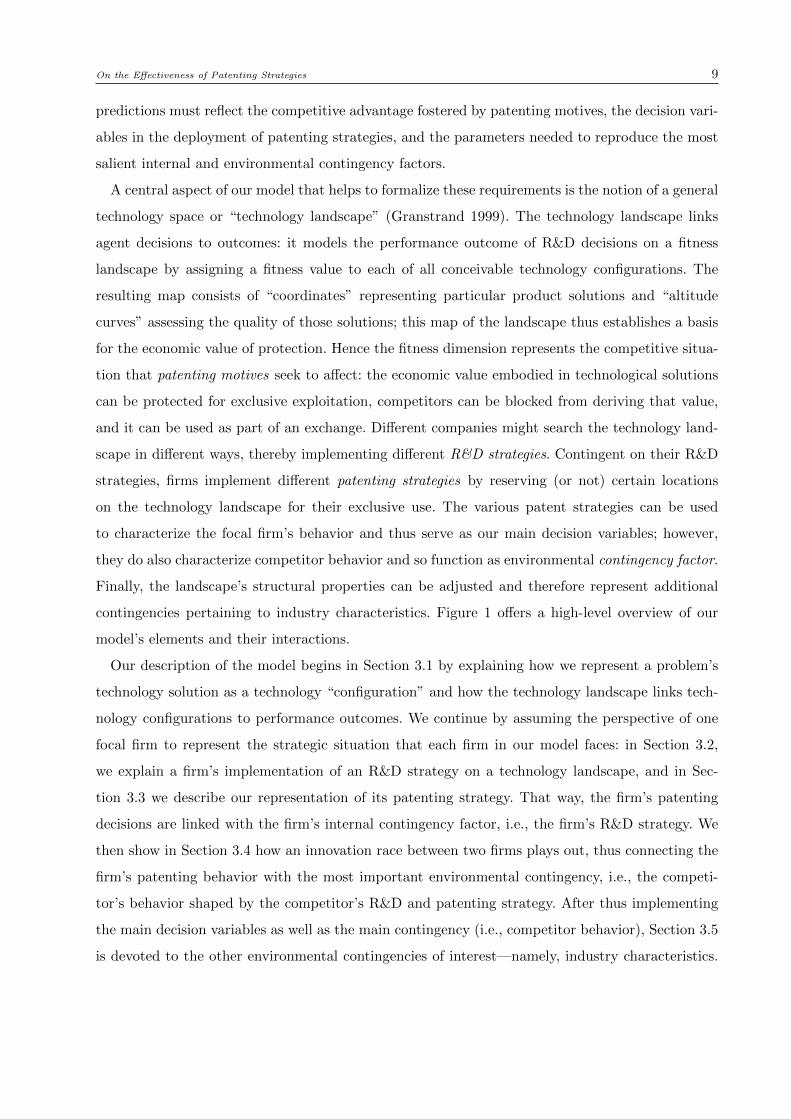
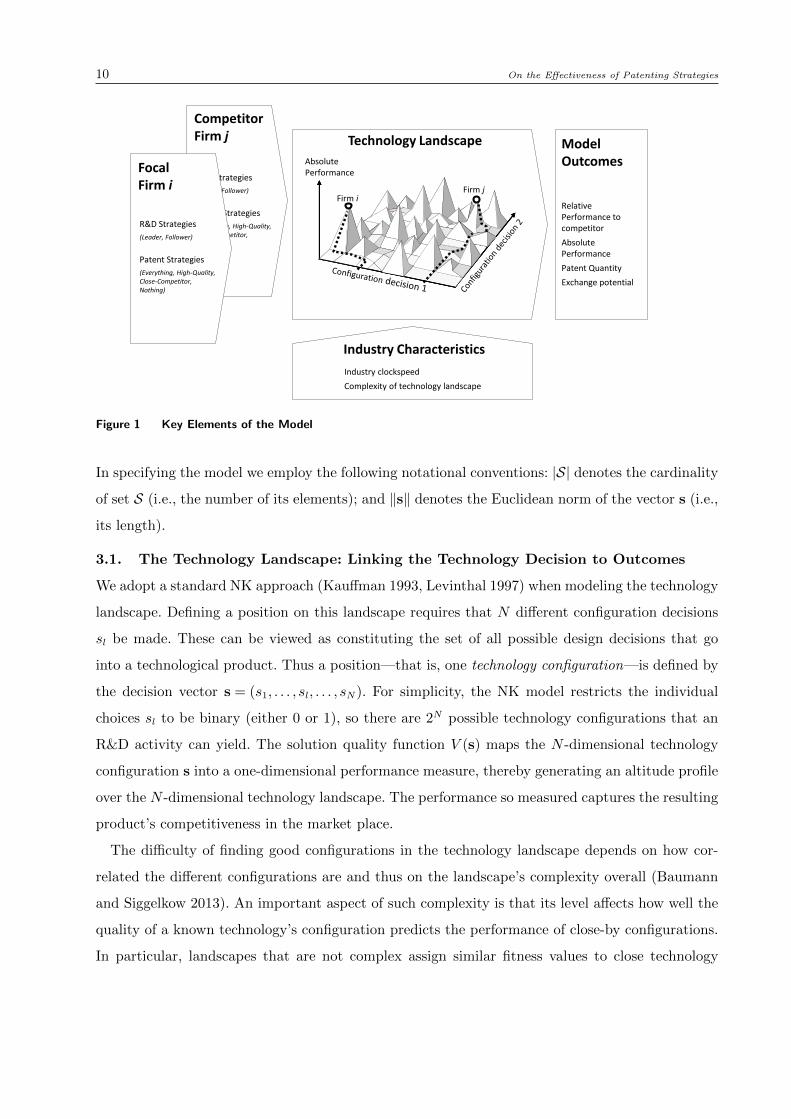
contingencies pertaining to industry characteristics. Figure 1 offers a high-level overview of our
model’s elements and their interactions.
Our description of the model begins in Section 3.1 by explaining how we represent a problem’s
technology solution as a technology “configuration” and how the technology landscape links tech-
nology configurations to performance outcomes. We continue by assuming the perspective of one
focal firm to represent the strategic situation that each firm in our model faces: in Section 3.2,
we explain a firm’s implementation of an R&D strategy on a technology landscape, and in Sec-
tion 3.3 we describe our representation of its patenting strategy. That way, the firm’s patenting
decisions are linked with the firm’s internal contingency factor, i.e., the firm’s R&D strategy. We
then show in Section 3.4 how an innovation race between two firms plays out, thus connecting the
firm’s patenting behavior with the most important environmental contingency, i.e., the competi-
tor’s behavior shaped by the competitor’s R&D and patenting strategy. After thus implementing
the main decision variables as well as the main contingency (i.e., competitor behavior), Section 3.5
is devoted to the other environmental contingencies of interest—namely, industry characteristics.
10 On the Effectiveness of Patenting Strategies
Absolute Performance
Firm i Firm j
Industry Characteristics
Technology Landscape
Competitor Firm j
Model Outcomes
R&D Strategies
(Leader, Follower)
Patent Strategies
(Everything, High-Quality, Close-Competitor, Nothing)
Industry clockspeed
Complexity of technology landscape
Relative Performance to competitor
Absolute Performance
Patent Quantity
Exchange potential
Focal Firm i
R&D Strategies
(Leader, Follower)
Patent Strategies
(Everything, High-Quality, Close-Competitor, Nothing)
Figure 1 Key Elements of the Model
In specifying the model we employ the following notational conventions: |S| denotes the cardinality
of set S (i.e., the number of its elements); and ‖s‖ denotes the Euclidean norm of the vector s (i.e.,
its length).
3.1. The Technology Landscape: Linking the Technology Decision to Outcomes
We adopt a standard NK approach (Kauffman 1993, Levinthal 1997) when modeling the technology
landscape. Defining a position on this landscape requires that N different configuration decisions
sl be made. These can be viewed as constituting the set of all possible design decisions that go
into a technological product. Thus a position—that is, one technology configuration—is defined by
the decision vector s = (s1, . . . , sl, . . . , sN). For simplicity, the NK model restricts the individual
choices sl to be binary (either 0 or 1), so there are 2N possible technology configurations that an
R&D activity can yield. The solution quality function V (s) maps the N -dimensional technology
configuration s into a one-dimensional performance measure, thereby generating an altitude profile
over the N -dimensional technology landscape. The performance so measured captures the resulting
product’s competitiveness in the market place.
The difficulty of finding good configurations in the technology landscape depends on how cor-
related the different configurations are and thus on the landscape’s complexity overall (Baumann
and Siggelkow 2013). An important aspect of such complexity is that its level affects how well the
quality of a known technology’s configuration predicts the performance of close-by configurations.
In particular, landscapes that are not complex assign similar fitness values to close technology

On the Effectiveness of Patenting Strategies 11
configurations and are therefore relatively easy to search: by examining a few support points and
then following the steepest ascent to a local hill, one can quickly (and almost exhaustively) search
the entire landscape. In contrast, complex landscapes typically assign extremely different fitness
values even to alternatives that are very close. In this case, finding good solutions requires that
one searches the entire landscape.
One benefit of using the NK model is that we can then structurally alter the complexity of
the technology landscape as follows. Each decision contributes to the overall performance. Let Vl
denote the contribution of decision l to solution quality. The overall solution quality is then simply
the average of all the decisions’ contributions:
V (s) =
∑N
l=1 Vl(sl, s−l)
N.
Landscape complexity arises because Vl depends not only on the value of sl but also on the value
of K other decisions (Levinthal 1997); we denote these decisions as s−l = (sl1, . . . , slK). For each
possible combination of sl and s−l, a random draw from a uniform distribution U [0,1] is assigned
to Vl(sl, s−l). When K =N −1, decisions are highly interdependent: each Vl is affected by all N −1
other decisions and so the technology landscape is noncorrelated, complex, and “rugged”. If one of
the N decisions changes then all Vl assume the value of another random draw, which means that
the entire performance function V takes on the value of a new random draw. As a result, nearly
identical product solutions may have drastically different solution qualities. At the other extreme,
if K = 0 then all decisions are independent because Vl depends entirely on sl; hence the technology
landscape is correlated, not complex, and “smooth” In this case, if one of the N decisions changes
then only the corresponding Vl undergoes a random change, which means that V is only marginally
affected. Consequently, a slight product modification will have an equally slight effect on solution
quality.
3.2. R&D Strategies
The technology landscape links each technology configuration to a performance outcome. We can
therefore model the R&D search process as a search on the technology landscape (Mihm et al.
2003, Sting et al. 2011). In the standard NK model, a firm searches the landscape in isolation and
its search heuristics are motivated by various behavioral factors (Levinthal 1997). Deviating from
standard instances of the NK approach, we model two firms that explore the technology landscape
while interacting with each other. For each firm i, j = 1,2, i 6= j, the search process starts from
a random initial product solution s(0)i and then traverses the landscape via the search trajectory
(s(t)i )t∈N = (s
(0)i , s
(1)i , s
(2)i , . . . ).
12 On the Effectiveness of Patenting Strategies
To illustrate the model dynamics and firm interactions, we consider an arbitrary period t in
which both firms have already undertaken some R&D activities. Each firm has investigated the
technological field to some extent and has thus built a knowledge base of that field; furthermore,
each firm has protected some of this knowledge by using patents. In our model, a firm that has
built knowledge of a field corresponds to a firm that has explored some technology configurations
s(τ)i and learned about their performance V (s
(τ)i ) for all past periods τ ∈ {1, . . . , t}. The complete
stock of knowledge that the firm has assembled up until the current period t is retained in the
solution list S(t)i , which stores all past technology configurations that the company has explored
and their respective performance; a second list, the patent list P(t)i , contains all solutions for which
the firm has filed a patent by t and their respective performance. Clearly, P(t)i ⊆S
(t)i . Although S(t)
i
is private information to firm i—since we assume that, in general, firms do not reveal their R&D
activities to their competitors—the competing firm j can observe the subset of patented (and thus
disclosed) solutions P(t)i .
In Section 2 we established the R&D leader and the R&D follower as exponents of two archetyp-
ical R&D strategies. These two strategies are represented by different heuristics in our model.
Consider the beginning of the period t+ 1, when the firm needs to decide about its future R&D
direction. It must choose an area of research—that is, a starting point for its R&D efforts. A leader
firm chooses its starting technology configuration from its solution list S(t)i , relying exclusively on
its own technology. In contrast, a follower focuses on catching up with the leader; hence a follower
chooses its starting technology configuration from its competitor’s patent list P(t)j . The currently
best-performing technology is not necessarily the one selected by the leader and the follower as their
starting point. Instead, the starting configuration is picked randomly, with the selection probabili-
ties proportional to the assessed quality of each solution. Building on the base technology chosen,
the firm carries out an incremental research step. That is, the firm experiments with one randomly
chosen decision by reversing its state from 0 to 1 (or vice versa). This R&D step generates the next
solution s(t+1)i and its performance V (s
(t+1)i ), updating the solution list from S(t)
i to S(t+1)i .1
3.3. Patenting Strategies
Once firm i has carried out its R&D efforts with result s(t+1)i , it must decide whether or not to
patent this technological solution. As described in Section 2, firms may apply different patenting
strategies.
1 We assume that the follower has full absorptive capacity (Cohen and Levinthal 1990, Lenox and King 2004)—inother words, that it can readily assess competitor’s patents and easily integrate them into its own R&D program.Although this simplifying assumption could be relaxed, it does allow us to preserve model parsimony.
On the Effectiveness of Patenting Strategies 13
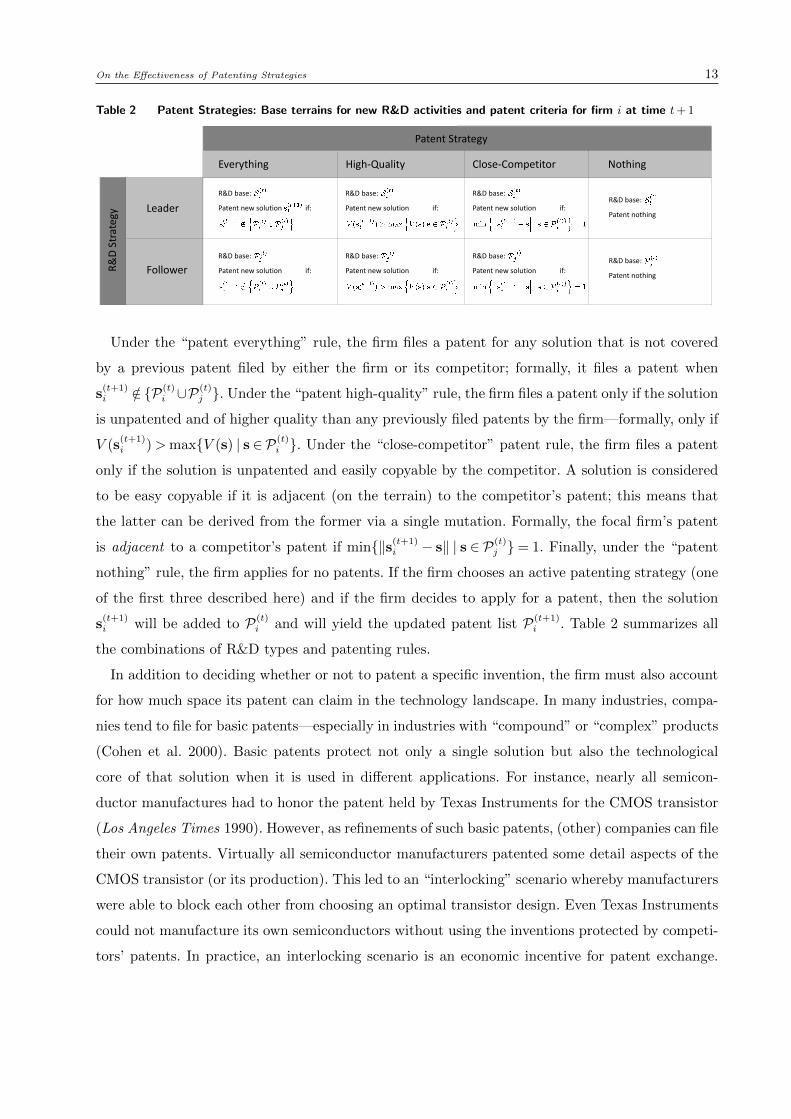
Table 2 Patent Strategies: Base terrains for new R&D activities and patent criteria for firm i at time t+ 1
Leader
Follower
Everything High-Quality
Patent Strategy
Close-Competitor Nothing
R&D
Stra
tegy
R&D base:
Patent new solution if:
R&D base:
Patent new solution if:
R&D base:
Patent new solution if:R&D base:
Patent nothing
R&D base:
Patent new solution if:
R&D base:
Patent new solution if:
R&D base:
Patent new solution if:R&D base:
Patent nothing
Under the “patent everything” rule, the firm files a patent for any solution that is not covered
by a previous patent filed by either the firm or its competitor; formally, it files a patent when
s(t+1)i /∈ {P(t)
i ∪P(t)j }. Under the “patent high-quality” rule, the firm files a patent only if the solution
is unpatented and of higher quality than any previously filed patents by the firm—formally, only if
V (s(t+1)i )>max{V (s) | s ∈ P(t)
i }. Under the “close-competitor” patent rule, the firm files a patent
only if the solution is unpatented and easily copyable by the competitor. A solution is considered
to be easy copyable if it is adjacent (on the terrain) to the competitor’s patent; this means that
the latter can be derived from the former via a single mutation. Formally, the focal firm’s patent
is adjacent to a competitor’s patent if min{‖s(t+1)i − s‖ | s ∈ P(t)
j }= 1. Finally, under the “patent
nothing” rule, the firm applies for no patents. If the firm chooses an active patenting strategy (one
of the first three described here) and if the firm decides to apply for a patent, then the solution
s(t+1)i will be added to P(t)
i and will yield the updated patent list P(t+1)i . Table 2 summarizes all
the combinations of R&D types and patenting rules.
In addition to deciding whether or not to patent a specific invention, the firm must also account
for how much space its patent can claim in the technology landscape. In many industries, compa-
nies tend to file for basic patents—especially in industries with “compound” or “complex” products
(Cohen et al. 2000). Basic patents protect not only a single solution but also the technological
core of that solution when it is used in different applications. For instance, nearly all semicon-
ductor manufactures had to honor the patent held by Texas Instruments for the CMOS transistor
(Los Angeles Times 1990). However, as refinements of such basic patents, (other) companies can file
their own patents. Virtually all semiconductor manufacturers patented some detail aspects of the
CMOS transistor (or its production). This led to an “interlocking” scenario whereby manufacturers
were able to block each other from choosing an optimal transistor design. Even Texas Instruments
could not manufacture its own semiconductors without using the inventions protected by competi-
tors’ patents. In practice, an interlocking scenario is an economic incentive for patent exchange.
14 On the Effectiveness of Patenting Strategies
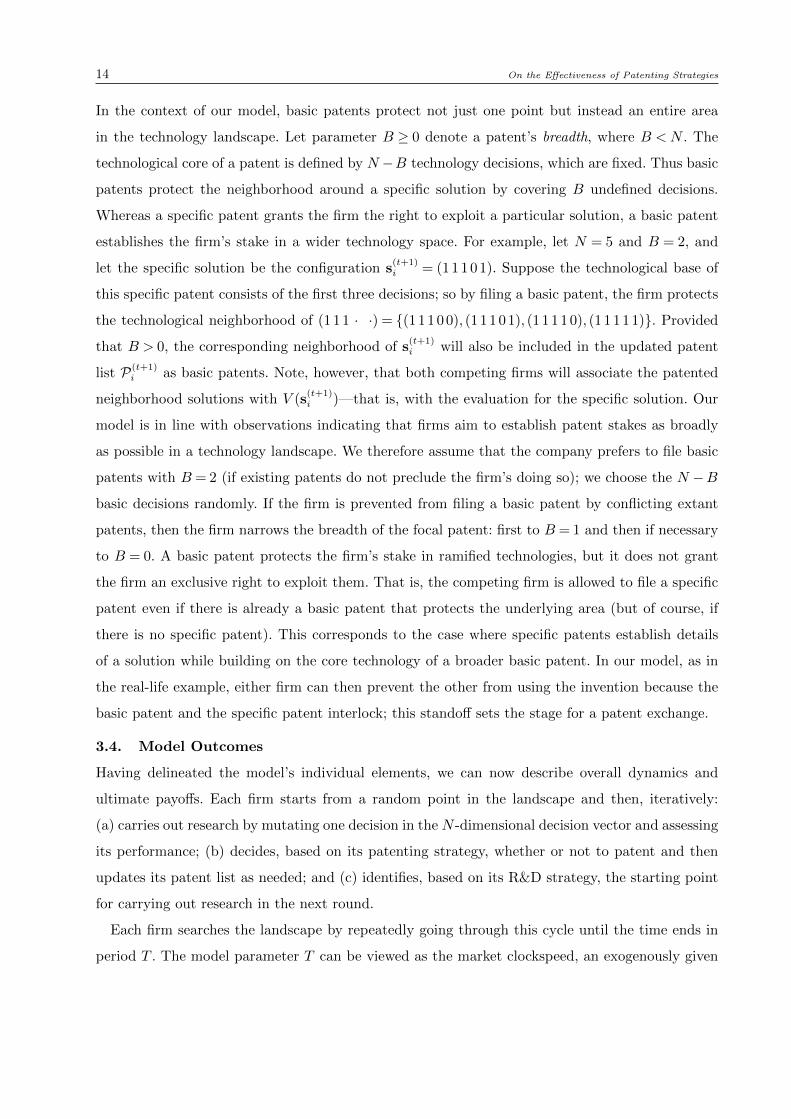
In the context of our model, basic patents protect not just one point but instead an entire area
in the technology landscape. Let parameter B ≥ 0 denote a patent’s breadth, where B <N . The
technological core of a patent is defined by N −B technology decisions, which are fixed. Thus basic
patents protect the neighborhood around a specific solution by covering B undefined decisions.
Whereas a specific patent grants the firm the right to exploit a particular solution, a basic patent
establishes the firm’s stake in a wider technology space. For example, let N = 5 and B = 2, and
let the specific solution be the configuration s(t+1)i = (11 101). Suppose the technological base of
this specific patent consists of the first three decisions; so by filing a basic patent, the firm protects
the technological neighborhood of (111 · ·) = {(11 100), (111 01), (111 10), (11 111)}. Provided
that B > 0, the corresponding neighborhood of s(t+1)i will also be included in the updated patent
list P(t+1)i as basic patents. Note, however, that both competing firms will associate the patented
neighborhood solutions with V (s(t+1)i )—that is, with the evaluation for the specific solution. Our
model is in line with observations indicating that firms aim to establish patent stakes as broadly
as possible in a technology landscape. We therefore assume that the company prefers to file basic
patents with B = 2 (if existing patents do not preclude the firm’s doing so); we choose the N −B
basic decisions randomly. If the firm is prevented from filing a basic patent by conflicting extant
patents, then the firm narrows the breadth of the focal patent: first to B = 1 and then if necessary
to B = 0. A basic patent protects the firm’s stake in ramified technologies, but it does not grant
the firm an exclusive right to exploit them. That is, the competing firm is allowed to file a specific
patent even if there is already a basic patent that protects the underlying area (but of course, if
there is no specific patent). This corresponds to the case where specific patents establish details
of a solution while building on the core technology of a broader basic patent. In our model, as in
the real-life example, either firm can then prevent the other from using the invention because the
basic patent and the specific patent interlock; this standoff sets the stage for a patent exchange.
3.4. Model Outcomes
Having delineated the model’s individual elements, we can now describe overall dynamics and
ultimate payoffs. Each firm starts from a random point in the landscape and then, iteratively:
(a) carries out research by mutating one decision in the N -dimensional decision vector and assessing
its performance; (b) decides, based on its patenting strategy, whether or not to patent and then
updates its patent list as needed; and (c) identifies, based on its R&D strategy, the starting point
for carrying out research in the next round.
Each firm searches the landscape by repeatedly going through this cycle until the time ends in
period T . The model parameter T can be viewed as the market clockspeed, an exogenously given

On the Effectiveness of Patenting Strategies 15
deadline for presenting the product solution. A small T implies substantial time pressure for R&D
efforts, whereas a large T corresponds to business situations with long market cycles that allow for
in-depth R&D exploration (Csaszar and Siggelkow 2010, Mihm et al. 2010).
By the end of period T , firm i receives the payoff associated with the highest-quality solution
s∗i that its R&D efforts have yielded that is not already patented by the competitor. In other
words, the firm launches the product with the highest performance that is not protected by the
competition. Hence it does not matter whether firm i holds a patent for s∗i ; what matters is whether
firm j has already patent-protected the technology solution s∗i . Formally, firm i achieves the absolute
performance
Πi = max{V (s) | s∈ S(T+1)
i \P(T+1)j
}, i= 1,2, j 6= i.
However, the firm’s market success may depend less on this absolute performance than on its
relative performance—that is, as compared with the competitor’s solution. Some strategy profiles
yield good absolute performance but poor relative performance. We view relative performance as
a proxy for (relative) market share; we view absolute performance, which is informative about a
solution’s overall attractiveness, as a proxy for market size. In the rest of the paper we report
both the absolute performance and the relative performance achieved by each firm i, where relative
performance is formally defined as
Πri = Πi−Πj, i= 1,2, j 6= i.
We described previously how, for a given product solution, one firm’s specific patent may overlap
with a basic patent held by another (competitor) firm. In such cases, a product cannot be brought
to market without the competitor’s consent. The result is a deadlock in which neither party can
exploit the patented product solution. To examine such situations, we augment our simulation
results with the potential value of patent exchange. This value is defined as a firm’s expected
performance increment that would result from breaking the patent deadlock via mutually shared
patents. In our simulations, no agent chooses to participate in a patent exchange; we simply indicate
the value of patent exchange once game outcomes have been realized.
Finally, we consider patenting cost to be linear in the number of patents filed. For c the average
direct and indirect cost per patent, the accumulated patenting cost could be given as Ci = c · |P(T+1)i |
(i= 1,2, j 6= i). However, we intentionally refrain from including an explicit cost factor. For some
companies, small improvements in competitiveness (relative performance) outweigh any patenting
cost considerations; yet for other companies, even considerable performance advantages are easily
consumed by the cost of acquiring and maintaining patents. That is why we do not account for
16 On the Effectiveness of Patenting Strategies
cost in relative performances. Instead, we report cost for separate consideration, where the number
of patents |P(T+1)i | serves as a proxy for each firm’s patenting cost.
3.5. Industry Characteristics
So far, we have elaborated on the main internal and environmental contingencies by embedding both
the focal firm’s R&D strategy as well as the competitor’s R&D and patenting strategies into the
model’s dynamic structure. Two critical parameters allow us to address the contingencies involving
industry characteristics. First, by systematically varying the time T allotted to a simulation run, we
can incorporate industry clockspeed into the model. Second, by changing the correlation parameter
K in the NK representation of the technology landscape, we can account for search environments
that are relatively more or less complex.
4. Analysis
In this section we discuss the effectiveness of patent strategies. The analysis is organized in terms
of our main contingency: competitive behavior determined by the combinations of opposing R&D
types. Thus we report (in Sections 4.1–4.4, respectively) the results for (1) how a leader should
shape its patenting strategy when competing with another leader, (2) how a leader should compete
against a follower, (3) how a follower should compete against a leader, and (4) how a follower
should compete against another follower.
We set the end time T to 100 rounds, and we set N = 12 and K = 6 so that the reported per-
formance measures result from a moderately complex environment. (The effects of jointly varying
these parameters are discussed in Section 4.6.) Since simulation-based results are subject to ran-
dom fluctuations, we report averages of 10,000 runs for each game setting. In each run, the players
compete on a new random landscape constructed using identical parameters. All results mentioned
in the text are significant at the 5% level.
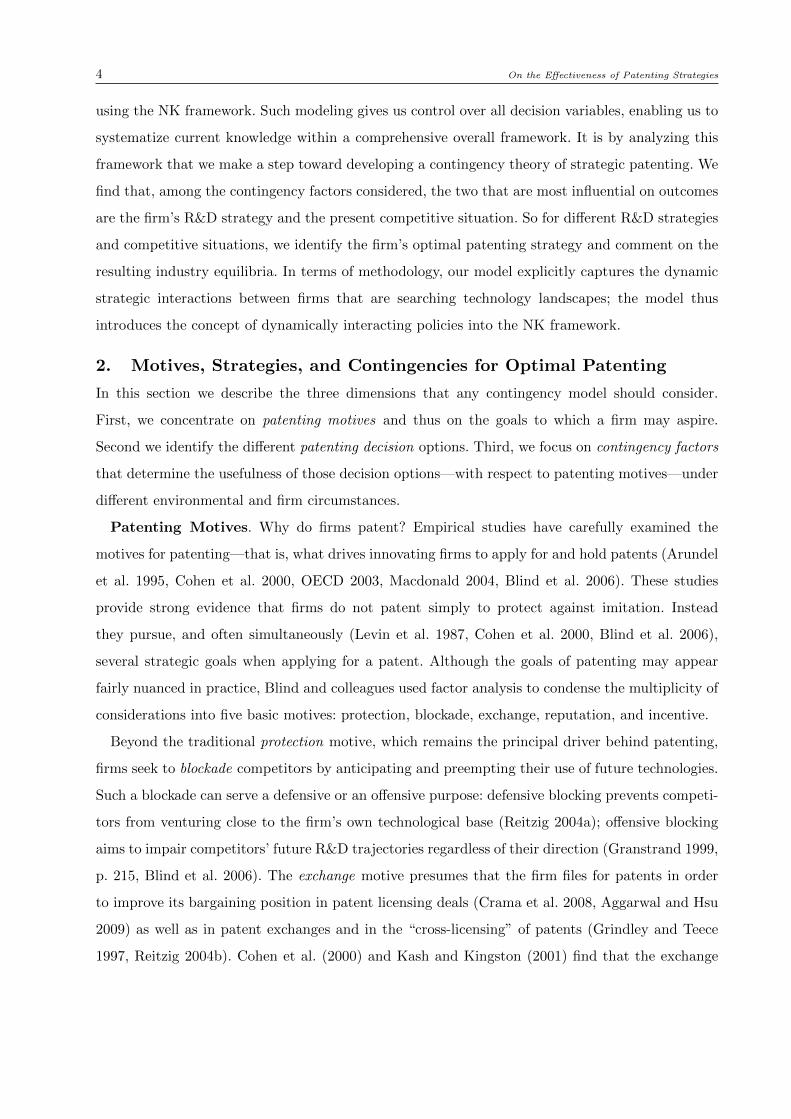
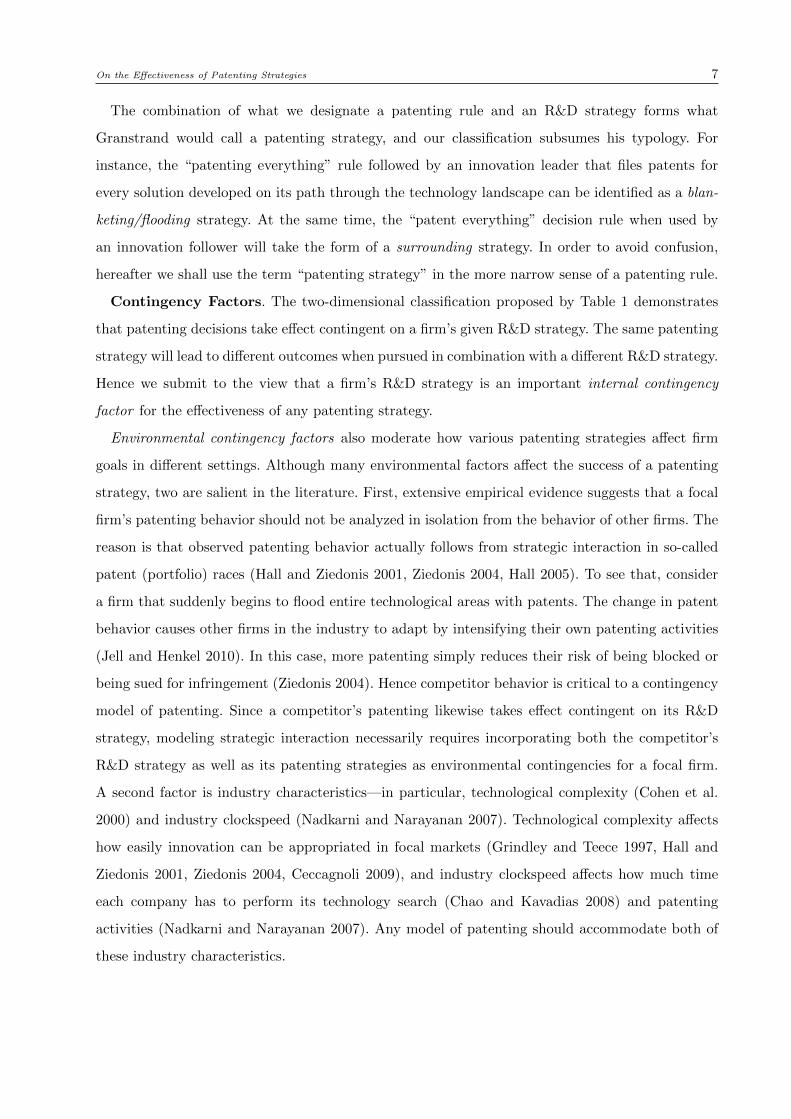
4.1. Best Strategies for an R&D Leader Competing with an R&D Leader
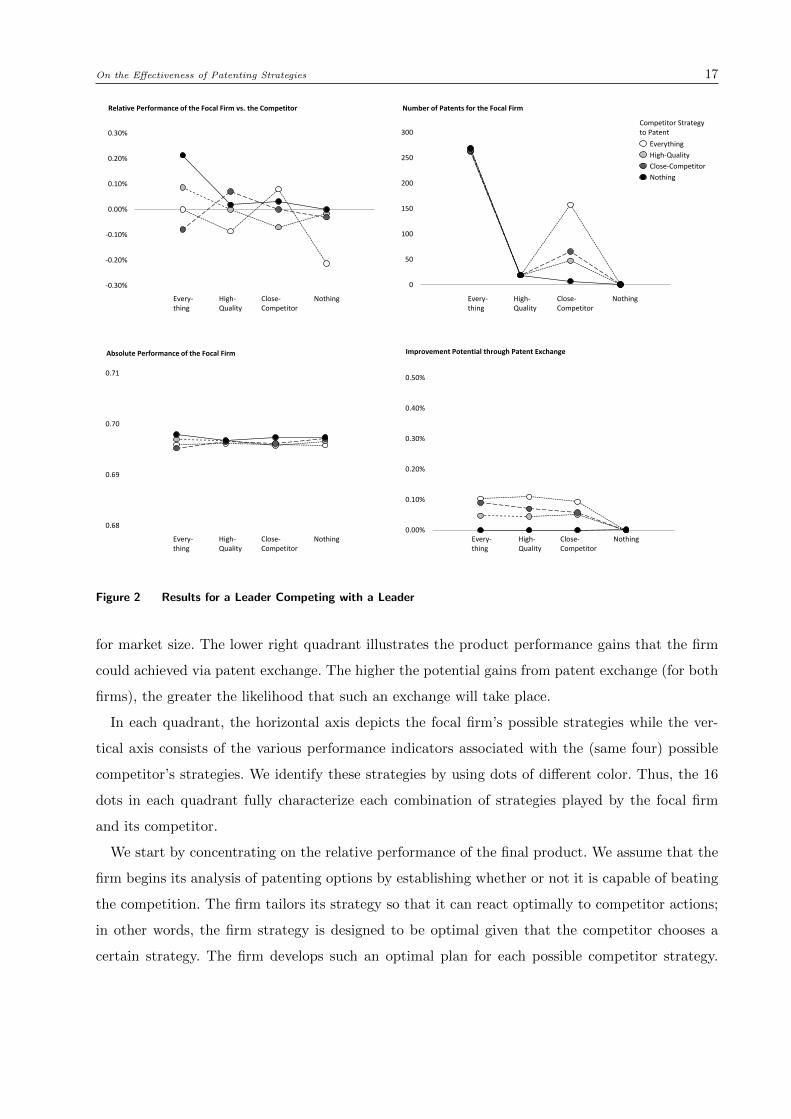
First we consider the case of a leader competing against a leader. Figure 2 plots all the outcome
measures described previously. The figure’s upper left quadrant shows the relative product perfor-
mance (i.e., how well the focal firm fares when compared with its competitor) at the end of the
innovation race: the more positive the relative performance, the more competitive the focal firm’s
product; the more negative, the less competitive. The upper right quadrant shows the number of
patents held by the focal firm at the end of the innovation race; recall that this number is used as
a proxy for patenting cost. The figure’s lower left quadrant shows the focal firm’s absolute prod-
uct performance, which is a proxy for the product offering’s attractiveness to consumers and thus
On the Effectiveness of Patenting Strategies 17
Every- thing
High- Quality
Close- Competitor
Nothing
-0.30%
-0.20%
-0.10%
0.00%
0.10%
0.20%
0.30%
0.68
0.69
0.70
0.71
Every- thing
High- Quality
Close- Competitor
Nothing Every- thing
High- Quality
Close- Competitor
Nothing
Every- thing
High- Quality
Close- Competitor
Nothing
Everything
High-Quality
Close-Competitor
Nothing
0
50
100
150
200
250
300
0.00%
0.10%
0.20%
0.30%
0.40%
0.50%
Competitor Strategy to Patent
Relative Performance of the Focal Firm vs. the Competitor Number of Patents for the Focal Firm
Absolute Performance of the Focal Firm Improvement Potential through Patent Exchange
Figure 2 Results for a Leader Competing with a Leader
for market size. The lower right quadrant illustrates the product performance gains that the firm
could achieved via patent exchange. The higher the potential gains from patent exchange (for both
firms), the greater the likelihood that such an exchange will take place.
In each quadrant, the horizontal axis depicts the focal firm’s possible strategies while the ver-
tical axis consists of the various performance indicators associated with the (same four) possible
competitor’s strategies. We identify these strategies by using dots of different color. Thus, the 16
dots in each quadrant fully characterize each combination of strategies played by the focal firm
and its competitor.
We start by concentrating on the relative performance of the final product. We assume that the
firm begins its analysis of patenting options by establishing whether or not it is capable of beating
the competition. The firm tailors its strategy so that it can react optimally to competitor actions;
in other words, the firm strategy is designed to be optimal given that the competitor chooses a
certain strategy. The firm develops such an optimal plan for each possible competitor strategy.
18 On the Effectiveness of Patenting Strategies
Then, while assuming that its competitor also behaves strategically, the firm tries to second-guess
its competitor’s actions. The idea is akin to an equilibrium in game theory, and thus motivates
us to juxtapose the competitor’s optimal plan for every given competitive situation in turn. The
firm devises best responses for every contingency (i.e., for each competitor patenting strategy)
that maximize its position—relative to the competitor—for each contingency. A competitor that
does likewise will determine its own strategy while assuming that the focal firm is also employing
a best-response strategy. Our analysis begins with a discussion of best responses before focusing
on the outcomes of various equilibria. Observe that all the figures represent competitor patenting
strategy by identically colored dots that are linked by a uniquely depicted (dots, dashes, etc.) line.
The firm identifies its best response to a competitor’s strategy by choosing as its own strategy (on
each plot’s x-axis) the one with the highest y-axis value on that line. For instance, if the competitor
patents nothing (line of black dots) then the focal firm’s best response is to patent everything—in
other words, to choose the highest (here, the leftmost) black dot. Figure 2 supports several notable
conclusions. In response to a competitor that patents nothing (line of black dots), pursuing that
same strategy (rightmost black dot) yields poorer performance for the focal firm than does any of
the other, active patenting strategies (leftmost three black dots). Moreover, given any competitor
strategy (any line of dots), the relative performance of patenting nothing (right-column dots) is
either inferior to or, statistically, not significantly different from any of the other three patenting
strategies (corresponding dots in the other columns with identical shading). For example, a strategy
of high-quality patenting clearly dominates the strategy of filing no patents. In short, to patenting
nothing is an inferior strategy for a leader competing with a leader. The effect is not large but it
is relevant.
Among the three active patenting strategies, no single one dominates. Although “patent every-
thing” is the firm’s best response when its competitor patents nothing, high-quality patenting
should be employed in response to close-competitor patenting and close-competitor patenting is the
best response to a competitor that patents everything. So from the relative performance viewpoint,
a leader facing a leader should definitely patent; however, it is not possible to choose among active
patenting strategies based solely on relative performance criteria.
In fact, for leader–leader competition neither absolute product performance nor the potential
gains from a patent exchange is enough to determine the best active patenting strategy. The lower
left quadrant of Figure 2 clearly shows that, with respect to absolute performance, no active patent-
ing strategy dominates any other. Since whatever differences exist are negligible, it follows that all
active patenting strategies are consistent with the goal of achieving good product performance for
On the Effectiveness of Patenting Strategies 19
leaders that are competing against leaders. The same conclusion follows when we analyze patent
exchange (lower right quadrant); once again, no active patenting strategy dominates and, overall,
the potential gains from a patent exchange would be small.
Yet as regards to the number of patents held by the focal firm at the end of the technology
race, the strategies exhibit substantially different results (upper right quadrant). In particular, the
strategy of patenting everything naturally results in many more patents than do the other two
active strategies. So if the cost of filing for—and holding—patents is substantial, then the strategies
of high-quality and close-competitor patenting outperform the “patent everything” strategy, which
rational players should therefore avoid. However, if the cost for patenting is negligible and if a high
number of patents held yields secondary benefits, then it is actually preferable to patent everything.
In sum, when an R&D leader is engaged in a race with another technology leader, active patent-
ing is the optimal strategy. The classical protection motive of patenting outweighs any secrecy
considerations. Since our competitive setup is symmetric, such a patenting strategy also forms the
industry equilibrium. (In equilibrium, the firms’ best responses reciprocally agree; no firm benefits
by unilaterally deviating from active patenting.) We therefore expect that, in markets of competing
technology leaders, considerable patenting activity will be observed. Since the differences between
the various active patenting strategies tend to be small, we expect to find a spectrum of different
active strategies in practice.
Because both competitors adopt a symmetric active patenting strategy, neither one can use
patenting to differentiate itself in the market; their product performance is roughly equivalent.
Hence both companies are better-off exchanging their patents, since doing so increases the absolute
product performance of each firm without affecting the competitive stalemate. In practice, then,
we expect to see a prevalence of patent exchange schemes.
An example from the semiconductor industry illustrates this leader–leader scenario. In the PC
processor market there are two main competitors, Intel and Advanced Micro Devices (AMD), that
each aspire to technological leadership: Intel because market dominance is its explicit strategy and
AMD because innovation is its only opportunity to leapfrog Intel and thereby gain market share
(this last occurred with the introduction in 2003 of AMD’s “Opteron” processors). Both companies
are actively involved in patenting. Intel is ranked 5th in the US Patent Office list of most active
companies, and AMD—despite its limited resources—is ranked 92nd (USPTO 2008). In addition,
the companies engage in patent exchange programs that allow each other to utilize their respective
inventions.
20 On the Effectiveness of Patenting Strategies
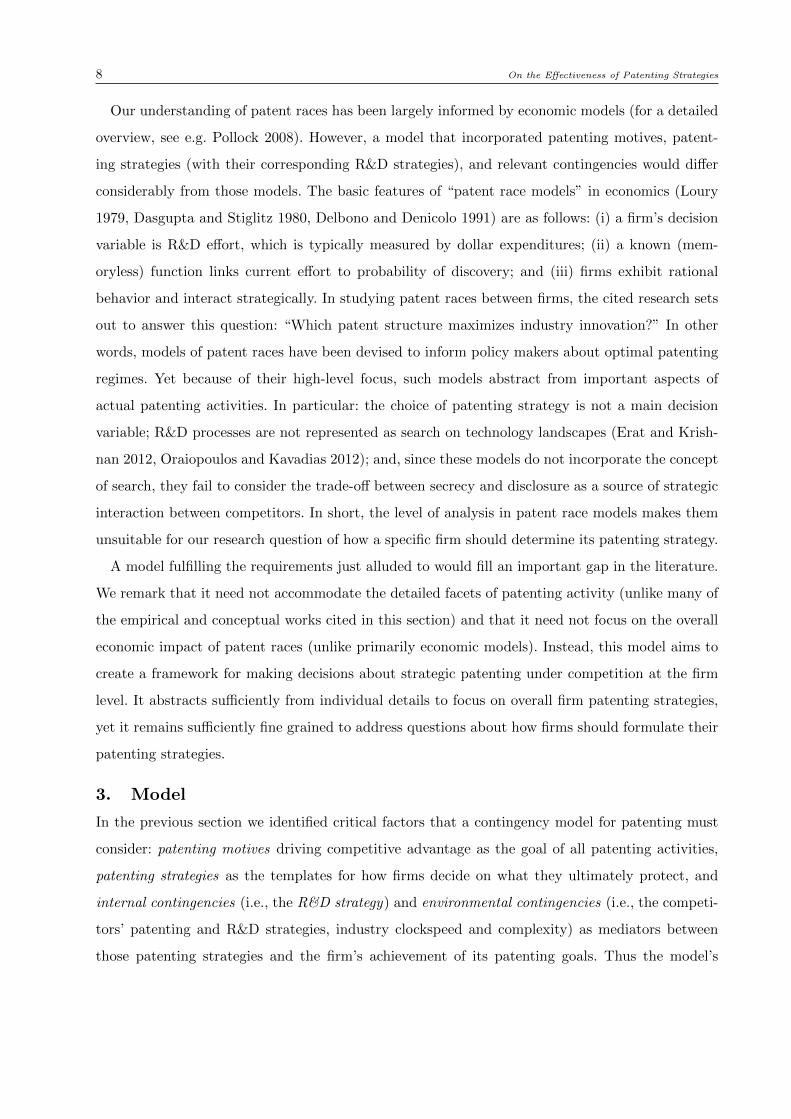
4.2. Best Strategies for an R&D Leader Competing with an R&D Follower
We now turn our attention to an asymmetric setting in which a focal R&D leader competes with
a follower. How should the leader protect its inventions against a follower? How should the leader
respond to a follower’s anticipated patenting strategies?
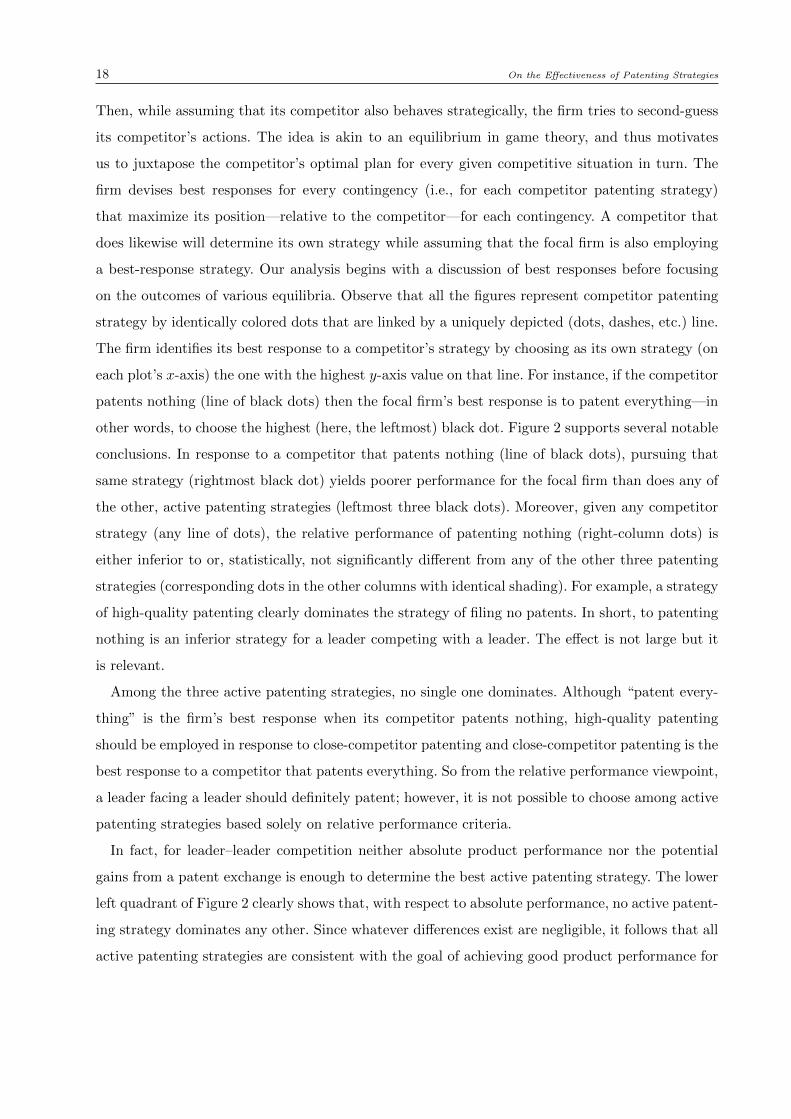
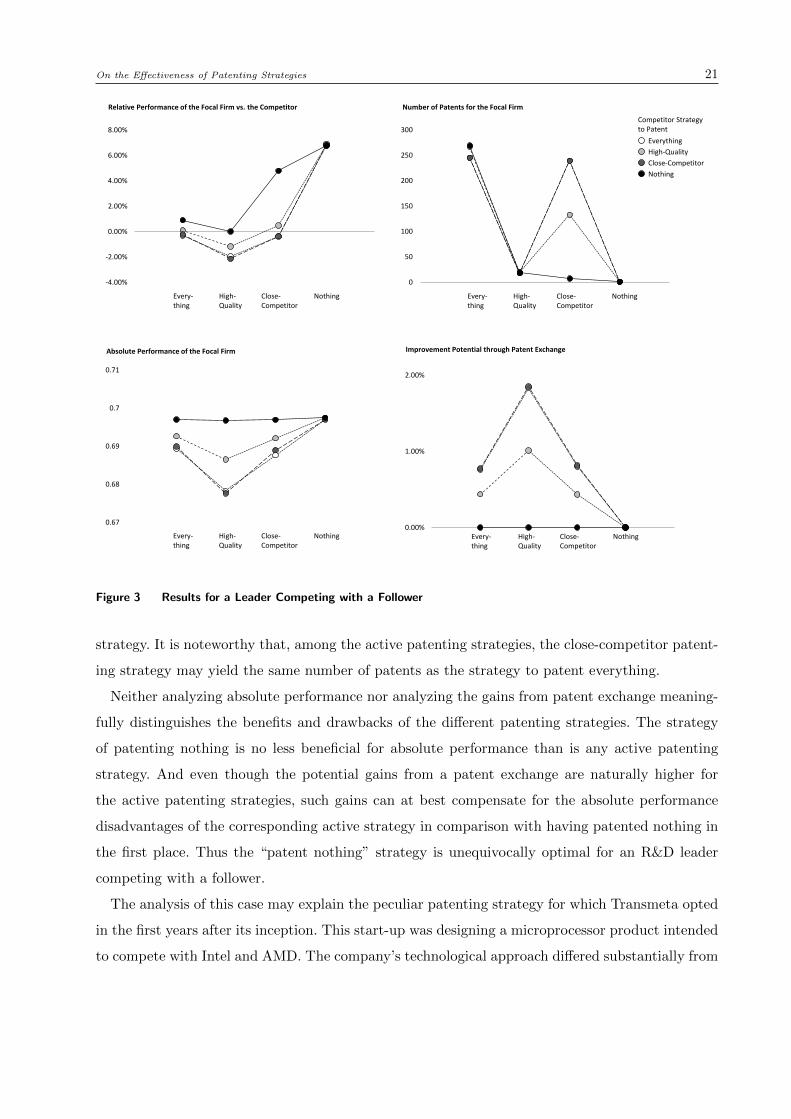
For this leader–follower combination, Figure 3 shows the relative performance, the number of
patents held at the end of the race, the absolute performance, and the expected gains from a patent
exchange for the focal R&D leader. If we focus on relative performance in order to identify best
responses, then it is clear that “patent nothing” is the leader’s dominant strategy irrespective of the
follower’s strategy; to patent nothing is to outperform any active strategy, and by a considerable
margin. Therefore, the leader should not reveal information about its R&D trajectory by patenting,
even though not patenting means that the leader cannot formally protect its technology position
should the follower happen upon it. The performance advantage of a leader competing against a
follower stems from secrecy: the follower has no reliable information concerning where its research
efforts should be focused. In contrast, any strategy that includes patenting will provide a signal
that the follower might use to improve its performance substantially.
Unlike the case of leader–leader combinations, in this case there are subtle but interesting differ-
ences that allow for distinctions among the active patenting strategies. Among these, the strategy of
patenting only high-quality innovations is an especially inferior choice. This insight contradicts the
common intuition that companies should build patent portfolios consisting solely of high-quality
patents in order to balance protection and the cost of patenting. The results reported here rather
imply that a leader firm adopting the strategy of high-quality patents is more easily outperformed
(than are leader firms adopting other active patent strategies) by its follower: the better the signal
for the follower (i.e., the more clearly the leader identifies filed patents as superior ones), the easier
it will be for the follower to find desirable and perhaps even superior solutions in the technological
vicinity of the leader’s inventions. The follower does not waste time on inferior solutions, focusing
instead on the most promising technology configurations as devised (and signalled) by the leader.
The implication is that, if a leader must patent, at least it should avoid signalling the solution
quality when competing against a follower. When the leader either patents everything or patents
close to its competitor, much of the patenting does not concern superior technological solutions
and thus confounds more than facilitates the follower’s R&D efforts.
With the number of patents serving as a proxy for patent cost, the expenditures required under
the different strategies reinforce the superiority of the obviously cost-optimal “patent nothing”
On the Effectiveness of Patenting Strategies 21
Every- thing
High- Quality
Close- Competitor
Nothing
-4.00%
-2.00%
0.00%
2.00%
4.00%
6.00%
8.00%
0.67
0.68
0.69
0.7
0.71
Every- thing
High- Quality
Close- Competitor
Nothing Every- thing
High- Quality
Close- Competitor
Nothing
Every- thing
High- Quality
Close- Competitor
Nothing
0
50
100
150
200
250
300
0.00%
1.00%
2.00%
Everything
High-Quality
Close-Competitor
Nothing
Competitor Strategy to Patent
Relative Performance of the Focal Firm vs. the Competitor Number of Patents for the Focal Firm
Absolute Performance of the Focal Firm Improvement Potential through Patent Exchange
Figure 3 Results for a Leader Competing with a Follower
strategy. It is noteworthy that, among the active patenting strategies, the close-competitor patent-
ing strategy may yield the same number of patents as the strategy to patent everything.
Neither analyzing absolute performance nor analyzing the gains from patent exchange meaning-
fully distinguishes the benefits and drawbacks of the different patenting strategies. The strategy
of patenting nothing is no less beneficial for absolute performance than is any active patenting
strategy. And even though the potential gains from a patent exchange are naturally higher for
the active patenting strategies, such gains can at best compensate for the absolute performance
disadvantages of the corresponding active strategy in comparison with having patented nothing in
the first place. Thus the “patent nothing” strategy is unequivocally optimal for an R&D leader
competing with a follower.
The analysis of this case may explain the peculiar patenting strategy for which Transmeta opted
in the first years after its inception. This start-up was designing a microprocessor product intended
to compete with Intel and AMD. The company’s technological approach differed substantially from
22 On the Effectiveness of Patenting Strategies
that of both incumbents, and at the time it was perceived to be potentially superior. With respect
to this specific approach, Transmeta could be viewed as an emergent R&D leader with Intel and
AMD as R&D followers. Transmeta was famously secretive and held only a single, obscure patent
before bringing its product to market (The Economist 2000). Transmeta’s managers obviously did
not want to give Intel and AMD a chance to “catch up” before their own company’s product was
even available.
We have established how a leader should respond to any of the follower’s patenting strategies.
Next, in order to characterize industry equilibria, we analyze which patenting strategy a follower
should choose when competing with a leader.
4.3. Best Strategies for an R&D Follower Competing with an R&D Leader
In this setting, our focal company is an R&D follower and its competitor is an R&D leader. Thus
we reverse the previous setting’s perspective by now assuming the role of the follower.
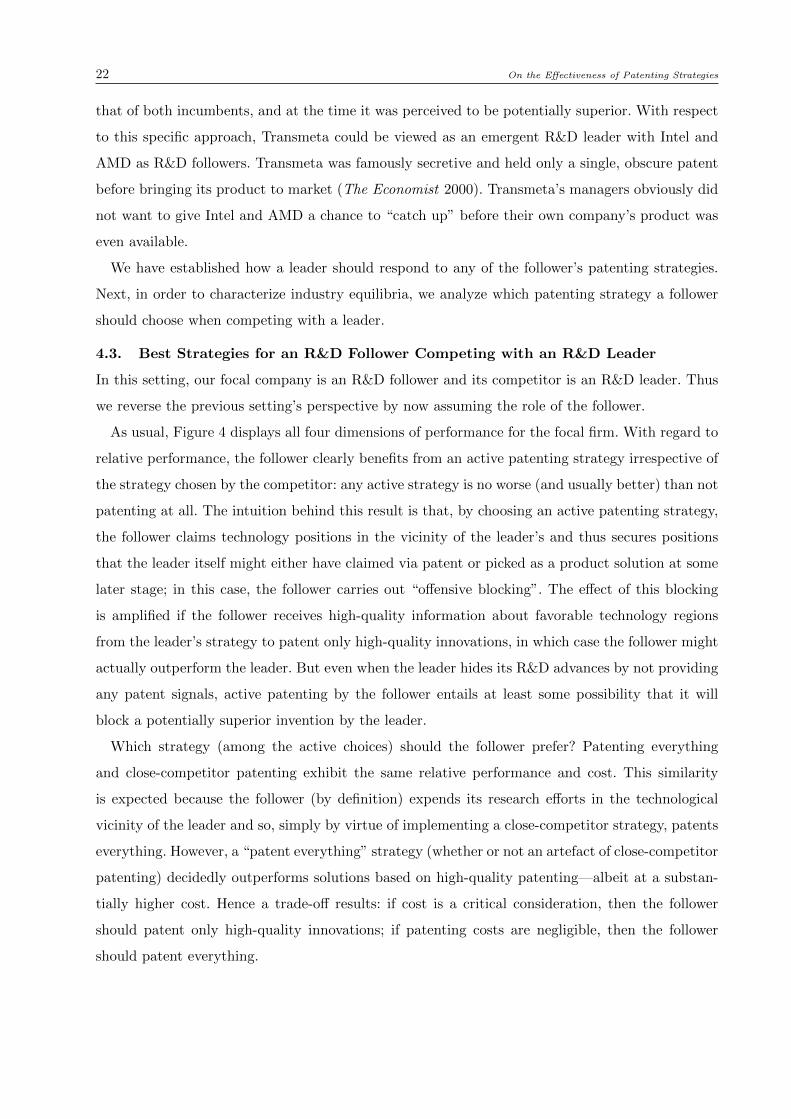
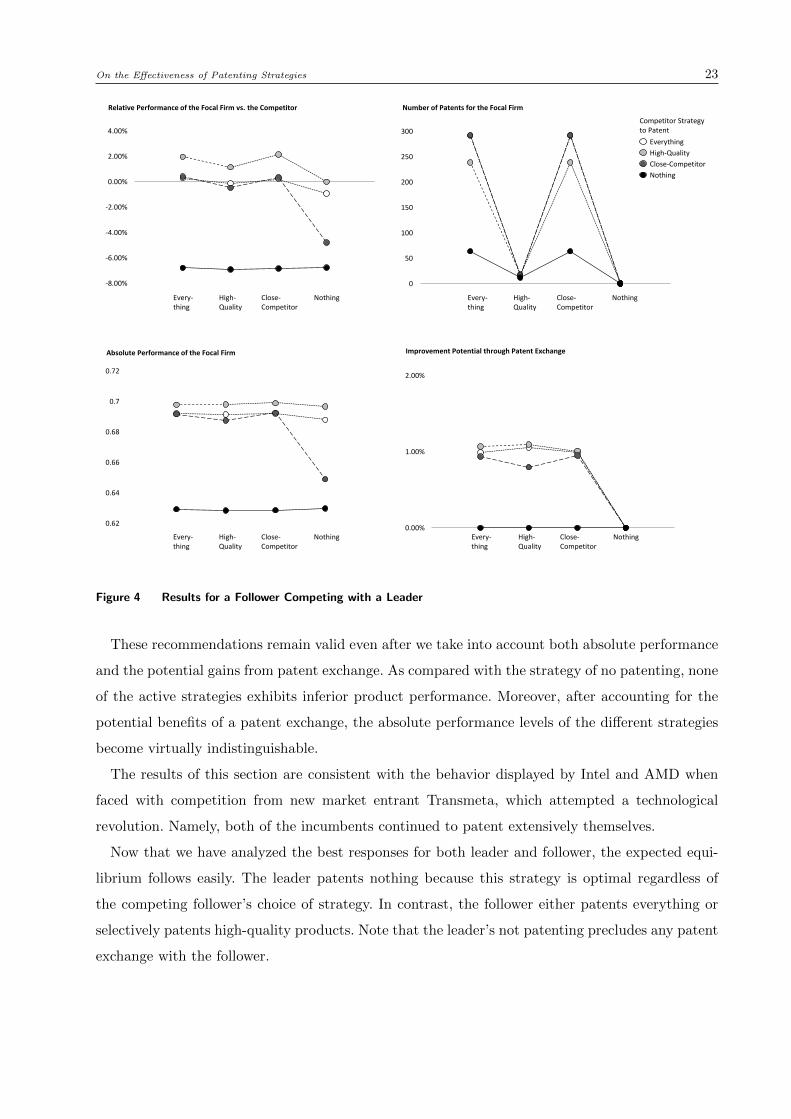
As usual, Figure 4 displays all four dimensions of performance for the focal firm. With regard to
relative performance, the follower clearly benefits from an active patenting strategy irrespective of
the strategy chosen by the competitor: any active strategy is no worse (and usually better) than not
patenting at all. The intuition behind this result is that, by choosing an active patenting strategy,
the follower claims technology positions in the vicinity of the leader’s and thus secures positions
that the leader itself might either have claimed via patent or picked as a product solution at some
later stage; in this case, the follower carries out “offensive blocking”. The effect of this blocking
is amplified if the follower receives high-quality information about favorable technology regions
from the leader’s strategy to patent only high-quality innovations, in which case the follower might
actually outperform the leader. But even when the leader hides its R&D advances by not providing
any patent signals, active patenting by the follower entails at least some possibility that it will
block a potentially superior invention by the leader.
Which strategy (among the active choices) should the follower prefer? Patenting everything
and close-competitor patenting exhibit the same relative performance and cost. This similarity
is expected because the follower (by definition) expends its research efforts in the technological
vicinity of the leader and so, simply by virtue of implementing a close-competitor strategy, patents
everything. However, a “patent everything” strategy (whether or not an artefact of close-competitor
patenting) decidedly outperforms solutions based on high-quality patenting—albeit at a substan-
tially higher cost. Hence a trade-off results: if cost is a critical consideration, then the follower
should patent only high-quality innovations; if patenting costs are negligible, then the follower
should patent everything.
On the Effectiveness of Patenting Strategies 23
Every- thing
High- Quality
Close- Competitor
Nothing
-8.00%
-6.00%
-4.00%
-2.00%
0.00%
2.00%
4.00%
0.62
0.64
0.66
0.68
0.7
0.72
Every- thing
High- Quality
Close- Competitor
Nothing Every- thing
High- Quality
Close- Competitor
Nothing
Every- thing
High- Quality
Close- Competitor
Nothing
0
50
100
150
200
250
300
0.00%
1.00%
2.00%
Everything
High-Quality
Close-Competitor
Nothing
Competitor Strategy to Patent
Relative Performance of the Focal Firm vs. the Competitor Number of Patents for the Focal Firm
Absolute Performance of the Focal Firm Improvement Potential through Patent Exchange
Figure 4 Results for a Follower Competing with a Leader
These recommendations remain valid even after we take into account both absolute performance
and the potential gains from patent exchange. As compared with the strategy of no patenting, none
of the active strategies exhibits inferior product performance. Moreover, after accounting for the
potential benefits of a patent exchange, the absolute performance levels of the different strategies
become virtually indistinguishable.
The results of this section are consistent with the behavior displayed by Intel and AMD when
faced with competition from new market entrant Transmeta, which attempted a technological
revolution. Namely, both of the incumbents continued to patent extensively themselves.
Now that we have analyzed the best responses for both leader and follower, the expected equi-
librium follows easily. The leader patents nothing because this strategy is optimal regardless of
the competing follower’s choice of strategy. In contrast, the follower either patents everything or
selectively patents high-quality products. Note that the leader’s not patenting precludes any patent
exchange with the follower.
24 On the Effectiveness of Patenting Strategies
4.4. Best Strategies for an R&D Follower Competing with an R&D Follower
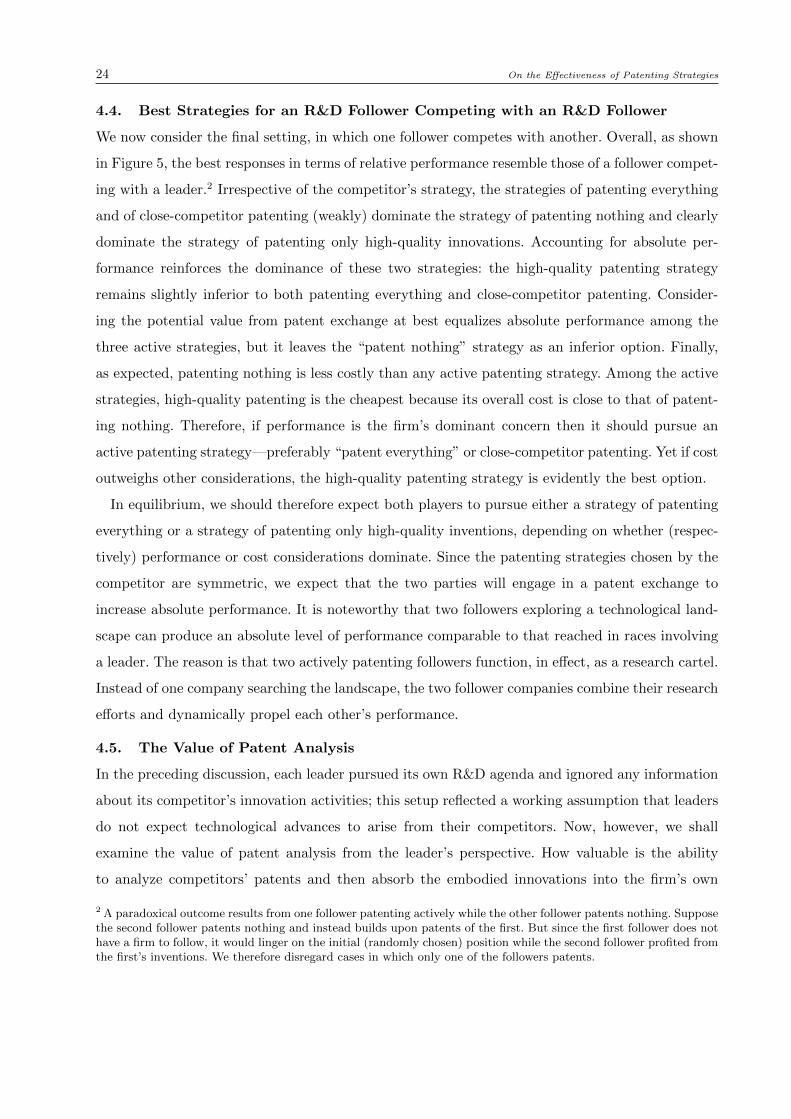
We now consider the final setting, in which one follower competes with another. Overall, as shown
in Figure 5, the best responses in terms of relative performance resemble those of a follower compet-
ing with a leader.2 Irrespective of the competitor’s strategy, the strategies of patenting everything
and of close-competitor patenting (weakly) dominate the strategy of patenting nothing and clearly
dominate the strategy of patenting only high-quality innovations. Accounting for absolute per-
formance reinforces the dominance of these two strategies: the high-quality patenting strategy
remains slightly inferior to both patenting everything and close-competitor patenting. Consider-
ing the potential value from patent exchange at best equalizes absolute performance among the
three active strategies, but it leaves the “patent nothing” strategy as an inferior option. Finally,
as expected, patenting nothing is less costly than any active patenting strategy. Among the active
strategies, high-quality patenting is the cheapest because its overall cost is close to that of patent-
ing nothing. Therefore, if performance is the firm’s dominant concern then it should pursue an
active patenting strategy—preferably “patent everything” or close-competitor patenting. Yet if cost
outweighs other considerations, the high-quality patenting strategy is evidently the best option.
In equilibrium, we should therefore expect both players to pursue either a strategy of patenting
everything or a strategy of patenting only high-quality inventions, depending on whether (respec-
tively) performance or cost considerations dominate. Since the patenting strategies chosen by the
competitor are symmetric, we expect that the two parties will engage in a patent exchange to
increase absolute performance. It is noteworthy that two followers exploring a technological land-
scape can produce an absolute level of performance comparable to that reached in races involving
a leader. The reason is that two actively patenting followers function, in effect, as a research cartel.
Instead of one company searching the landscape, the two follower companies combine their research
efforts and dynamically propel each other’s performance.
4.5. The Value of Patent Analysis
In the preceding discussion, each leader pursued its own R&D agenda and ignored any information
about its competitor’s innovation activities; this setup reflected a working assumption that leaders
do not expect technological advances to arise from their competitors. Now, however, we shall
examine the value of patent analysis from the leader’s perspective. How valuable is the ability
to analyze competitors’ patents and then absorb the embodied innovations into the firm’s own
2 A paradoxical outcome results from one follower patenting actively while the other follower patents nothing. Supposethe second follower patents nothing and instead builds upon patents of the first. But since the first follower does nothave a firm to follow, it would linger on the initial (randomly chosen) position while the second follower profited fromthe first’s inventions. We therefore disregard cases in which only one of the followers patents.
On the Effectiveness of Patenting Strategies 25
Every- thing
High- Quality
Close- Competitor
Nothing
-3.00%
-2.00%
-1.00%
0.00%
1.00%
2.00%
3.00%
0.61
0.63
0.65
0.67
0.69
0.71
Every- thing
High- Quality
Close- Competitor
Nothing Every- thing
High- Quality
Close- Competitor
Nothing
Every- thing
High- Quality
Close- Competitor
Nothing
0
50
100
150
200
250
300
350
0.00%
1.00%
2.00%
3.00%
Everything
High-Quality
Close-Competitor
Nothing
Competitor Strategy to Patent
Relative Performance of the Focal Firm vs. the Competitor Number of Patents for the Focal Firm
Absolute Performance of the Focal Firm Improvement Potential through Patent Exchange
Figure 5 Results for a Follower Competing with a Follower
research program? How do the patent strategies and R&D types of the players affect the value of
patent analysis? Will the capacity to analyze patents affect outcomes of the competition?
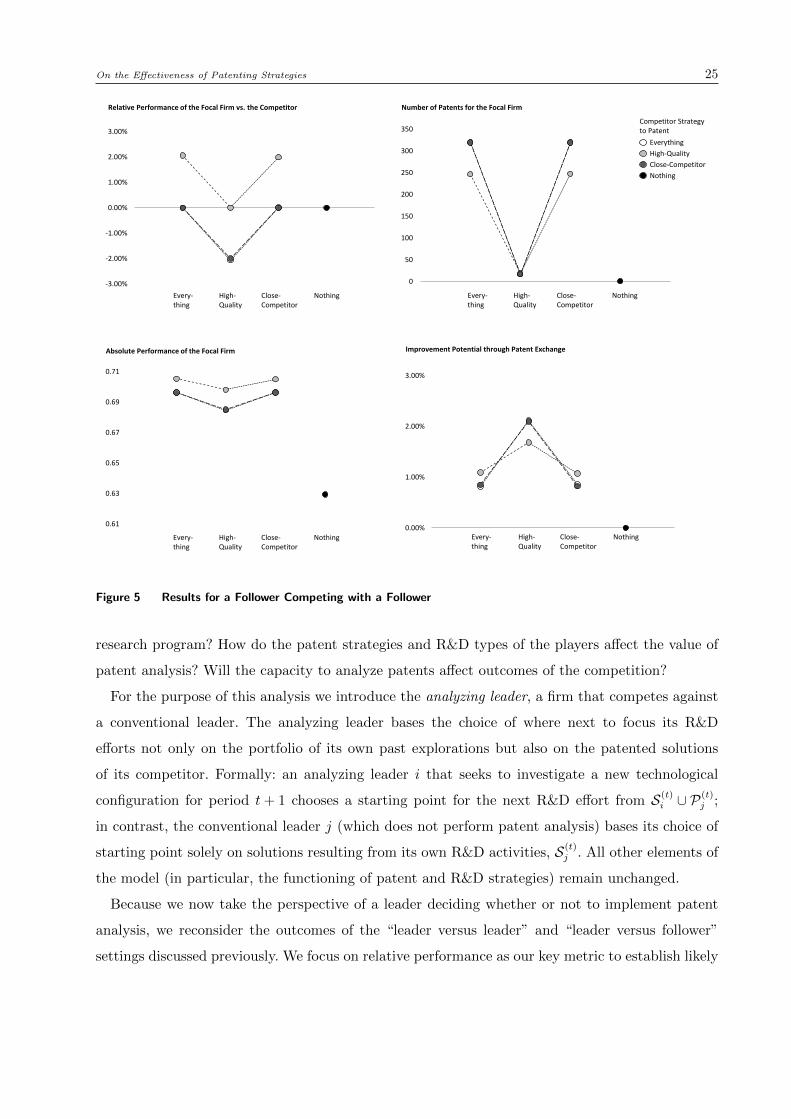
For the purpose of this analysis we introduce the analyzing leader, a firm that competes against
a conventional leader. The analyzing leader bases the choice of where next to focus its R&D
efforts not only on the portfolio of its own past explorations but also on the patented solutions
of its competitor. Formally: an analyzing leader i that seeks to investigate a new technological
configuration for period t+ 1 chooses a starting point for the next R&D effort from S(t)i ∪ P
(t)j ;
in contrast, the conventional leader j (which does not perform patent analysis) bases its choice of
starting point solely on solutions resulting from its own R&D activities, S(t)j . All other elements of
the model (in particular, the functioning of patent and R&D strategies) remain unchanged.
Because we now take the perspective of a leader deciding whether or not to implement patent
analysis, we reconsider the outcomes of the “leader versus leader” and “leader versus follower”
settings discussed previously. We focus on relative performance as our key metric to establish likely
26 On the Effectiveness of Patenting Strategies
Every- thing
High- Quality
Close- Competitor
Nothing
0.68
0.69
0.70
ConventionalLeader/Everything vs.
ConventionalLeader/Everything
AnalyzingLeader/Everything vs.
ConventionalLeader/Everything
AnalyzingLeader/Everything vs.
ConventionalLeader/Nothing
-1.00%
0.00%
1.00%
2.00% Everything
High-Quality
Close-Competitor
Nothing
Competitor Strategy to Patent
Conventional -> Analyzing
Conventional Leader
Relative Performance of the Analyzing Leader vs. the Leader Absolute Performance for Both Firms
Figure 6 Results for an Analyzing Leader Competing with a Conventional Leader
behavior and equilibrium outcomes. (Taking into account absolute performance and the value of
patent exchange does not alter any of our conclusions.) As a second metric, we establish the value
of patent analysis per se; this value is assessed in terms of the gains expected by a leader that
switches from the conventional to the analyzing type. Thus we make two comparisons: (1) the case
of an analyzing leader competing with a conventional leader to the case of a conventional leader
competing with a conventional leader; and (2) the case of an analyzing leader competing with a
follower to the case of a conventional leader competing with a follower.
For our first analysis, the left panel of Figure 6 plots the relative performance for an analyzing
leader competing against a conventional leader. Patent analysis and the resulting ability to identify
and “invent around” competing patents bestows a relative performance advantage to the analyzing
leader (as evidenced by the generally positive results in this analysis). That advantage is most
pronounced when the competitor adopts the high-quality patenting strategy. The figure indicates
that, as a best response, active patenting strategies (preferably, patenting everything or close-
competitor patenting) at least weakly dominate the “patent nothing” strategy. On the one hand,
if the conventional leader chooses any active patenting strategy then the analyzing leader is clearly
better-off by actively patenting; also, in this case the “patent everything” and close-competitor
strategies each outperform the strategy of patenting only high-quality innovations. On the other
hand, if the conventional leader decides to patent nothing then the analyzing leader is no worse-off
for having chosen an active patenting strategy.
Choosing an active patenting strategy was the equilibrium outcome for both conventional leaders
in the base setting of Section 4.1. Although it seems as if an analyzing leader’s best response is
in line with such an equilibrium outcome, patent analysis modifies the equilibrium fundamentally.
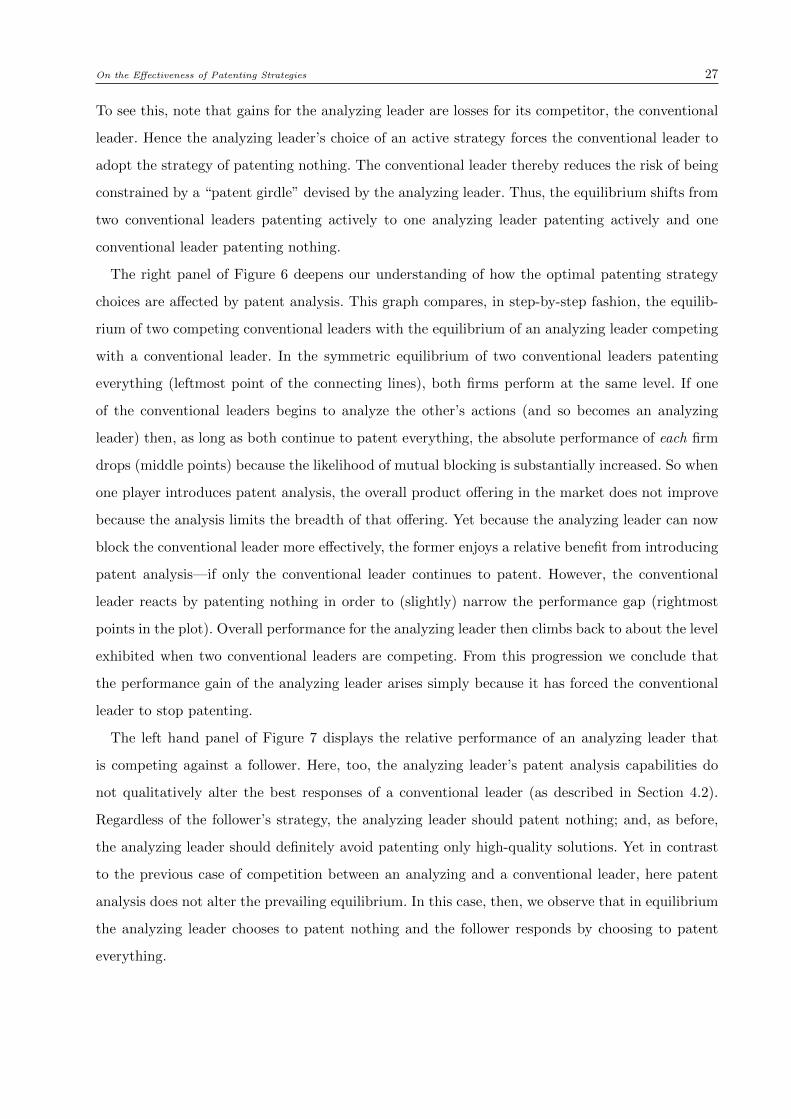
On the Effectiveness of Patenting Strategies 27
To see this, note that gains for the analyzing leader are losses for its competitor, the conventional
leader. Hence the analyzing leader’s choice of an active strategy forces the conventional leader to
adopt the strategy of patenting nothing. The conventional leader thereby reduces the risk of being
constrained by a “patent girdle” devised by the analyzing leader. Thus, the equilibrium shifts from
two conventional leaders patenting actively to one analyzing leader patenting actively and one
conventional leader patenting nothing.
The right panel of Figure 6 deepens our understanding of how the optimal patenting strategy
choices are affected by patent analysis. This graph compares, in step-by-step fashion, the equilib-
rium of two competing conventional leaders with the equilibrium of an analyzing leader competing
with a conventional leader. In the symmetric equilibrium of two conventional leaders patenting
everything (leftmost point of the connecting lines), both firms perform at the same level. If one
of the conventional leaders begins to analyze the other’s actions (and so becomes an analyzing
leader) then, as long as both continue to patent everything, the absolute performance of each firm
drops (middle points) because the likelihood of mutual blocking is substantially increased. So when
one player introduces patent analysis, the overall product offering in the market does not improve
because the analysis limits the breadth of that offering. Yet because the analyzing leader can now
block the conventional leader more effectively, the former enjoys a relative benefit from introducing
patent analysis—if only the conventional leader continues to patent. However, the conventional
leader reacts by patenting nothing in order to (slightly) narrow the performance gap (rightmost
points in the plot). Overall performance for the analyzing leader then climbs back to about the level
exhibited when two conventional leaders are competing. From this progression we conclude that
the performance gain of the analyzing leader arises simply because it has forced the conventional
leader to stop patenting.
The left hand panel of Figure 7 displays the relative performance of an analyzing leader that
is competing against a follower. Here, too, the analyzing leader’s patent analysis capabilities do
not qualitatively alter the best responses of a conventional leader (as described in Section 4.2).
Regardless of the follower’s strategy, the analyzing leader should patent nothing; and, as before,
the analyzing leader should definitely avoid patenting only high-quality solutions. Yet in contrast
to the previous case of competition between an analyzing and a conventional leader, here patent
analysis does not alter the prevailing equilibrium. In this case, then, we observe that in equilibrium
the analyzing leader chooses to patent nothing and the follower responds by choosing to patent
everything.
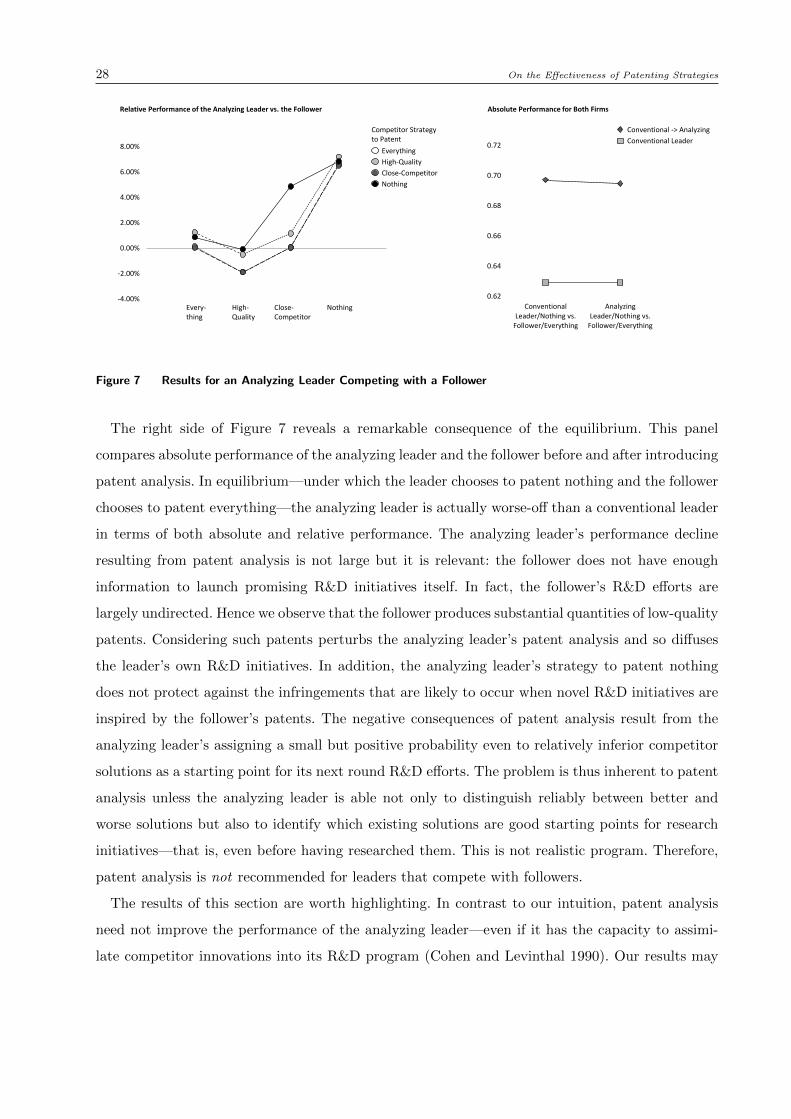
28 On the Effectiveness of Patenting Strategies
Every- thing
High- Quality
Close- Competitor
Nothing
0.62
0.64
0.66
0.68
0.70
0.72
ConventionalLeader/Nothing vs.
Follower/Everything
AnalyzingLeader/Nothing vs.
Follower/Everything
Conventional -> Analyzing
Conventional Leader
-4.00%
-2.00%
0.00%
2.00%
4.00%
6.00%
8.00%Everything
High-Quality
Close-Competitor
Nothing
Competitor Strategy to Patent
Relative Performance of the Analyzing Leader vs. the Follower Absolute Performance for Both Firms
Figure 7 Results for an Analyzing Leader Competing with a Follower
The right side of Figure 7 reveals a remarkable consequence of the equilibrium. This panel
compares absolute performance of the analyzing leader and the follower before and after introducing
patent analysis. In equilibrium—under which the leader chooses to patent nothing and the follower
chooses to patent everything—the analyzing leader is actually worse-off than a conventional leader
in terms of both absolute and relative performance. The analyzing leader’s performance decline
resulting from patent analysis is not large but it is relevant: the follower does not have enough
information to launch promising R&D initiatives itself. In fact, the follower’s R&D efforts are
largely undirected. Hence we observe that the follower produces substantial quantities of low-quality
patents. Considering such patents perturbs the analyzing leader’s patent analysis and so diffuses
the leader’s own R&D initiatives. In addition, the analyzing leader’s strategy to patent nothing
does not protect against the infringements that are likely to occur when novel R&D initiatives are
inspired by the follower’s patents. The negative consequences of patent analysis result from the
analyzing leader’s assigning a small but positive probability even to relatively inferior competitor
solutions as a starting point for its next round R&D efforts. The problem is thus inherent to patent
analysis unless the analyzing leader is able not only to distinguish reliably between better and
worse solutions but also to identify which existing solutions are good starting points for research
initiatives—that is, even before having researched them. This is not realistic program. Therefore,
patent analysis is not recommended for leaders that compete with followers.
The results of this section are worth highlighting. In contrast to our intuition, patent analysis
need not improve the performance of the analyzing leader—even if it has the capacity to assimi-
late competitor innovations into its R&D program (Cohen and Levinthal 1990). Our results may
On the Effectiveness of Patenting Strategies 29
therefore explain why competitive patent analysis is neither widely promoted in the literature nor
used in practice as a standard tool for establishing R&D strategies (Fabry et al. 2006).
4.6. Industry Characteristics
We have implicitly assumed throughout that the most critical moderating influence on the optimal
choice of a patenting strategy is the competitive dynamics of a market—namely, whether the focal
firm is an R&D leader or follower and whether this firm is in competition with a leader or a follower.
However, there may be other variables that influence the choice. We can systematically vary two
of the most central ones: the technology landscape’s complexity and the innovation race’s search
time.
Landscape complexity is a proxy for how many acceptable solutions exist to a given technological
challenge and for how difficult it is to find them. A complex landscape may have several solutions,
but they will be difficult to identify. Many different technologies might offer a similar performance,
and competitors can then “avoid” each other. A simple landscape has relatively few solutions,
which are easily identified by surveying the current configuration’s neighborhood. As a result, only
a limited set of technologies achieves a reasonable level of performance and so different companies’
research efforts will quickly coalesce around those technologies. Search time is our proxy for different
industry clockspeeds. Some markets require that products be extremely mature; a new technology
must undergo several iterations before an actual solution merits marketable production (Sommer
and Loch 2004). In other, more experimental markets, technologies may be quickly translated into
marketable products without much iteration. This explains why innovation races quickly terminate
in some markets but span extensive periods of time in others.
Both of these factors could well affect the optimal strategy in a given situation. We therefore
systematically varied both complexity (using K = 0 and K = 11 rather than the main model’s
K = 6) and the length of the race (10 and 200 steps rather than the main model’s 100 steps). It
is remarkable that variations in complexity and/or in timing do not change our results. Although
the reported effects become more pronounced for higher complexities and less pronounced for
shorter times, our qualitative conclusions remain valid in any case. These analyses imply that firms,
when choosing their patent strategy, can safely forgo accounting for both industry clockspeed and
the technology landscape’s specific shape. Instead, the most critical determinants of an optimal
patenting strategy is the composition of the innovation race’s competitors.
5. Discussion
Patents have been the focus of many different research streams. Some use patent filings as an
empirical vehicle to study phenomena such as creativity (Chen 2007) or team effectiveness (Singh

30 On the Effectiveness of Patenting Strategies
Competitor Firm
Leader Follower
Focal Firm
Leader
Active Patenting Patenting High-Quality Patenting Close-Competitor
Both Perform Equally Well Patent Exchange
No Patenting Leader Wins No Patent Exchange
Follower
Active Patenting If cost is a consideration: Patent High-Quality If Cost is not a Consideration: Patent Everything (or Close-Competitor)
Leader Wins No Patent Exchange
Active Patenting If cost is a consideration: Patent High-Quality If Cost is not a Consideration: Patent Everything (or Close-Competitor)
Both Perform Equally Well Patent Exchange
Figure 8 Summary Framework of Main Results
and Fleming 2010). Others focus on the legal design of patents to enhance industry innovation in
patent races (Pollock 2008). However, little work has addressed normative questions concerning
the formation of an appropriate patenting strategy. In this paper we identify contingencies that
affect the choice of a patenting strategy and then characterize the optimal choices with respect to
those contingencies.
We focus on industry competitive dynamics as our main contingency factor because it has been
shown to be the most significant driver of patent strategies. Yet even though technological com-
plexity and industry clockspeed influence patenting outcomes, they have hardly any effect on the
choice of an optimal patenting strategy. In contrast, the firm’s strategy is affected by competitive
dynamics that explicate its competitor’s research strategy. Hence the optimal strategy is a function
of (1) whether the firm is competing against an R&D leader or a follower and (2) whether the firm
itself aims to be a leader or a follower.
The basic choice faced by the firm in conceptualizing its patenting strategy is whether it prefers
protection at the cost of disclosure or instead prefers secrecy at the cost of no protection. If it prefers
protection, then the firm must decide which elements of its technology should be protected under
what circumstances. Our analysis leads to advice about which patenting strategy firms should
pursue depending on their industry’s competitive R&D dynamics; as a result, it informs us about
expected industry equilibria. Figure 8 summarizes our main results.
In sum, we find that if an R&D leader competes with another R&D leader, both should pursue
an active patenting strategy. For both parties, a strategy of patenting only high-quality innovations
is preferable, with the strategy of close-competitor patenting a near second. When an R&D leader
is competing with a follower, the leader should patent nothing and the follower should either patent
On the Effectiveness of Patenting Strategies 31
everything (if patenting costs are negligible) or patent only high-quality inventions (if patenting
costs are high). Finally, if two followers compete with each other then both should follow a high-
quality patenting strategy (if patenting costs are high) or a “patent everything” strategy (if those
costs are negligible).
Patent exchange is likely to occur either when a leader competes against a leader or when
a follower competes against a follower, since in those cases the exchange is mutually beneficial.
However, patent exchange is not expected between a leader competing with a follower because only
the leader would benefit from the exchange.
Our analysis has explicitly assumed that the R&D strategy is determined by factors external
to the model; hence the company’s only decisions concern its patenting strategy. In the long run,
though, the research strategy in itself may be a decision variable. Our patenting analysis can yield
some insight on such a combined R&D and patenting strategy as follows.
The equilibria of the different settings exhibit different levels of stability with respect to changes
in the R&D strategy. Can any of the players improve their performance by changing their R&D
strategy? If so, then evolutionary forces will eventually drive them to realize that improvement
potential. When a follower competes against a follower, both perform at about the same level and
patent their results. Yet by adopting the behavior of an R&D leader, a follower could become
relatively more competitive and thus win the technology competition—unless the follower can reap
substantial cost savings in R&D. Hence, the scenario in which two followers are competing against
each other is not a stable one in technology-dominated industries. Now consider what happens when
a leader competes against a follower. The follower patents, while the leader refrains from patenting
and is able to win the innovation race. Hence this scenario, too, is unstable (again barring R&D
cost advantages). The follower should therefore attempt to become an R&D leader. In contrast, the
equilibrium in which a leader competes against another leader is a stable one. Both firms perform
at about the same level, and both patent using similar strategies. Most importantly, switching
to a follower role would entail losses in relative performance. Overall, then, the follower role is
transitional; it does not exhibit long-run stability in industries that are dominated by technological
performance.
This paper also sheds light on the value of patent analysis for research leaders. Patent analysis
makes competitive information available to the analyzing leader and thus may potentially give
it an edge. Yet contrary to the common assumption that more information is always better, we
find that (in equilibrium) patent analysis improves performance for the analyzing leader only
when competing against another leader—not when competing against a follower. Furthermore, the
32 On the Effectiveness of Patenting Strategies
analyzing party’s absolute product performance is not improved by patent analysis even when
that firm is competing against a leader; instead, such analysis actually reduces its performance by
unduly affecting its own patenting behavior. The overall limited usefulness of patent analysis hints
at a fundamental reason why it has not become a standard tool in formulating R&D strategies
despite its seeming benefits.
Our work has several shortcomings. First, the analysis is based on a formal model that is inves-
tigated via computational means; absent an accompanying empirical analysis that verifies the
conclusions, our patent strategy advice should be viewed with an appropriate level of skepticism.
That being said, the recommendations derived from our model form immediately testable hypoth-
esis about the patenting strategies that can be expected in different competitive situations. The
paper’s second main limitation is that, in order to limit complexity, the strategies addressed here
span only the most salient classes of patenting strategies. There may be variants of these strategies
that would yield improvements in the base cases that we have treated. Additional work is needed
in order to identify those variants.
In this paper we have formulated a set of normative prescriptions for how companies should
make use of patents in innovation races. In so doing, our research has hence made a step towards
a contingency theory of patent strategies.
Acknowledgments
The authors gratefully acknowledge comments and suggestions by Vikas Aggarwal, Knut Blind, Murat
Tarakci.
References
Adee, S. 2010. Euv’s underdog light source will have its day. IEEE Spectrum 47(11) 13–14.
Aggarwal, V. A., D. H. Hsu. 2009. Modes of cooperative R&D commercialization by start-ups. Strategic
Management Journal 30(8) 835–864.
Arrow, K. 1962. Economic welfare and the allocation of resources for invention. R. R. Nelson, ed., The Rate
and Direction of Inventive Activity: Economic and Social Factors. Princeton University Press, 609–625.
Arundel, A. 2001. The relative effectiveness of patents and secrecy for appropriation. Research Policy 30(4)
611–624.
Arundel, A., P. Patel. 2003. Strategic patenting. background report for the trend chart policy benchmarking
workshop “New Trends in IPR Policy” .
Arundel, A., G. van de Paal, L. Soete. 1995. Innovation strategies of europe’s largest industrial firms : results
of the pace survey for information sources, public research, protection of innovations and government
programmes. MERIT Final Report .
On the Effectiveness of Patenting Strategies 33
Baumann, Oliver, Nicolaj Siggelkow. 2013. Dealing with complexity: Integrated vs. chunky search processes.
Organization Science 24(1) 116–132.
Benschop, J. 2010. Euv: Status and challenges ahead (keynote talk). 2010 International Workshop on EUV
Lithography, Maui .
Blind, K., K. Cremers, E. Mueller. 2009. The influence of strategic patenting on companies’ patent portfolios.
Research Policy 38(2) 428–436.
Blind, K., J. Edler, R. Frietsch, U. Schmoch. 2006. Motives to patent: Empirical evidence from germany.
Research Policy 35(5) 655–672.
Ceccagnoli, M. 2009. Appropriability, preemption, and firm performance. Strategic Management Journal
30(1) 81–98.
Chao, R. O., S. Kavadias. 2008. A theoretical framework for managing the new product development
portfolio: when and how to use strategic buckets. Management Science 54(5) 907–921.
Chen, Ming-Huei. 2007. Entrepreneurial leadership and new ventures: Creativity in entrepreneurial teams.
Creativity and Innovation Management 16(3) 239–249.
Cohen, W. M., D. Levinthal. 1990. Absorptive capacity: A new perspective on learning and innovation.
Administrative Science Quarterly 35(1) 128–152.
Cohen, W.M., R. R. Nelson, J. P. Walsh. 2000. Protecting their intellectual assets: Appropriability conditions
and why u.s. manufacturing firms patent (or not). NBER Working Paper (7552) 1–50.
Crama, P., B. De Reyck, Z. Degraeve. 2008. Milestone payments or royalties? contract design for R&D
licensing. Operations Research 56(6) 1539–1552.
Csaszar, F. A., N. Siggelkow. 2010. How much to copy? determinants of effective imitation breadth. Orga-
nization Science 21(3) 661–676.
Dasgupta, P., J. Stiglitz. 1980. Uncertainty, industrial structure, and the speed of R&D. The Bell Journal
of Economics 11(1) 1–28.
Delbono, F., V. Denicolo. 1991. Incentives to innovate in a cournot oligopoly. The Quarterly Journal of
Economics 106(3) 951–961.
Erat, S., V. Krishnan. 2012. Managing delegated search over design spaces. Management Science 58(3)
606–623.
Fabry, B., H. Ernst, J. Langholz, M. Koster. 2006. Patent portfolio analysis as a useful tool for identifying
R&D and business opportunities—an empirical application in the nutrition and health industry. World
Patent Information 28(3) 215–225.
Granstrand, O. 1999. The Economics and Management of Intellectual Property: Towards Intellectual Capi-
talism. Edward Elgar, Cheltenham, UK.
34 On the Effectiveness of Patenting Strategies
Grindley, P. C, D. J. Teece. 1997. Managing intellectual capital: Licensing and cross—licensing in semicon-
ductors and electronics. California Management Review 39(2) 8–41.
Hall, B. H. 2005. Exploring the patent explosion. The Journal of Technology Transfer 30(1) 35–48.
Hall, B. H., R. H. Ziedonis. 2001. The patent paradox revisited: An empirical study of patenting in the u.s.
semiconductor industry, 1979-1995. The RAND Journal of Economics 32(1) 101–128.
Hall, R. 1993. A framework linking intangible resources and capabiliites to sustainable competitive advantage.
Stategic Management Journal 14(8) 607–618.
Hsu, D. H., R. H. Ziedonis. 2008. Patents as quality signals for entrepreneurial ventures. Academy of
Management Best Paper Proceedings .
Jell, F., J. Henkel. 2010. Patent portfolio races in concentrated markets for technology. Working Paper
Technical University of Munich .
Kash, D. E., W. Kingston. 2001. Patents in a world of complex technologies. Science and Public Policy
28(1) 11–22.
Kauffman, S. A. 1993. The Origins of Order: Self-Organization and Selection in Evolution. Oxford University
Press, New York.
Lenox, M., A. King. 2004. Prospects for developing absorptive capacity through internal information provi-
sion. Strategic Management Journal 25(4) 331–345.
Lerner, J. 1994. The importance of patent scope: An empirical analysis. The RAND Journal of Economics
25(2) 319–333.
Levin, R. C., A. K. Klevorick, R. R. Nelson, S. G. Winter, R. Gilbert, Z. Griliches. 1987. Appropriating the
returns from industrial research and development. Brookings Papers on Economic Activity 3(Special
Issue On Microeconomics) 783–831.
Levinthal, D. A. 1997. Adaptation on rugged landscapes. Management Science 43(7) 934–950.
Los Angeles Times. 1990. Toshiba will pay TI royalty on chip patents. Los Angeles Times December 12.
Loury, G. C. 1979. Market structure and innovation. The Quarterly Journal of Economics 93(3) 395–410.
Macdonald, S. 2004. When means become ends: considering the impact of patent strategy on innovation.
Information Economics and Policy 16(1) 135–158.
Mihm, J., C. H. Loch, A. Huchzermeier. 2003. Problem-solving oscillations in complex engineering projects.
Management Science 49(6) 733–750.
Mihm, J., C. H. Loch, D. Wilkinson, B. Huberman. 2010. Hierarchical structure and search in complex
organizations. Management Science 56(5) 831–848.
Moore, G. 1965. Cramming more components onto integrated circuits. Electronics 38(8) 4.
Nadkarni, S., V.K. Narayanan. 2007. Strategic schemas, strategic flexibility, and firm performance: the
moderating role of industry clockspeed. Stategic Management Journal 28(3) 243–270.
On the Effectiveness of Patenting Strategies 35
OECD. 2003. Preliminary results of oecd/biac survey on the use and perception of patents in the business
community. Working Party on Innovation and Policy, 19-20 June .
Oldham, G. R., A. Cummings. 1996. Employee creativity: Personal and contextual factors at work. The
Academy of Management Journal 39(3) 607–634.
Oraiopoulos, N., S. Kavadias. 2012. The path dependent nature of R&D search: Implications for (and from)
competition. Working Paper University of Cambridge .
Pollock, R. 2008. The economics of knowledge: A review of the theoretical literature. Working Paper
University of Cambridge .
Reitzig, M. 2004a. The private values of ‘thickets’ and ‘fences’: towards an updated picture of the use of
patents across industries. Economics of Innovation and New Technology 13(5) 457–476.
Reitzig, M. 2004b. Strategic management of intellectual property. Sloan Management Review 45(3) 35–40.
Reitzig, M., J. Henkel, C. Heath. 2007. On sharks, trolls, and their patent prey: unrealistic damage awards
and firms’ strategies of being infringed. Research Policy 36(1) 134–54.
Singh, J., L. Fleming. 2010. Lone inventors as sources of breakthroughs: Myth or reality? Management
Science 56(1) 41–56.
Sommer, S. C., C. H. Loch. 2004. Selectionism and learning in projects with complexity and unforseeable
uncertainty. Management Science 50(10) 1334–1347.
Sting, F. J., J. Mihm, C.H. Loch. 2011. Collaborative search. Working Paper INSEAD .
Teece, D. J. 1986. Profiting from technological innovation: implications for integration, collaboration, licens-
ing and public policy. Research Policy 15(6) 285–305.
Teece, D. J., G. Pisano, A. Shuen. 1997. Dynamic capabilities and strategic management. Stategic Manage-
ment Journal 18(7) 509–533.
The Economist. 2000. Stealth chip. The Economist Print Edition January, 13. URL http://www.
economist.com/node/328295.
USPTO. 2008. URL http://www.uspto.gov/web/offices/ac/ido/oeip/taf/topo_08.htm.
Zahra, S. A., G. George. 2002. Absorptive capacity: A review, reconceptualization, and extension. Academy
of Management Review 27(2) 185–203.
Ziedonis, R. H. 2004. Don’t fence me in: Fragmented markets for technology and the patent acquisition
strategies of firms. Management Science 50(6) 804–820.