Embed Size (px)
Citation preview
On The Dynamics of Business Environment in MENA Region
A. Suut Dogruel* and B. Can Karahasan**
Abstract
The location choice of production and regional dimensions of the phenomenon are widely discussed on the grounds of intra country studies. Application of the theoretical framework developed for the intra country studies to the cross country studies is also growing field of economics. MENA region consists of lagging and developing nations of the globe is an interesting area of study to assess the dynamics of location of production. Within this context, after identifying proper indicators to account for business environment at the country level, the paper indents to scrutinize the determinants behind the development of the business environments within the region. Results state that domestic consumption and export as the demand driven factors dominate the development path of business environment in the MENA region.
Keywords: business environment, location, panel data JEL Codes: C33, O50, R12
* Marmara University, Department of Economics, [email protected] ** Istanbul Bilgi University, Department of Int. Finance, [email protected]
Topics in Middle Eastern and African Economies Vol. 12, September 2010
2
I. Introduction Recently the economics literature has witnessed a growing interest in the interaction between regional economics and international trade theories. With the contributions of new economic geography (NEG), different dimensions of regional variation of economic activity and economic growth are discussed on the grounds of importance of location in terms of geographic proximity. In this framework, attention of economists has also shifted toward identification of the major motivations or obstacles of regions as somehow affecting the decisions of productive units. Krugman (1991a) and (1992) analyzed the major centrifugal and centripetal forces that influence the distribution of manufacturing activities. Krugman’s theory is heavily affected by the seminal contributions of Marshall (1920) which identified the consequences of industrial districts’ formation; the vital elements can come from supply and demand side of the economy. Moreover, industrial interactions are also found to be explanatory; backwards and forwards linkages may work separately or jointly to determine the spatial distribution of production (Venables, 1996). Within this context, the two sector model developed by Krugman (1991a) and (1992) is later augmented by Fujita et al. (1999) to analyze possible sources of agglomeration economies. Later various studies test the hypothesis of Krugman (1991) and Fujita et al. (1999) by constructing cross section and panel analysis that aim to understand the possible pull and push effects for industrial production within the countries. However, these models analyze the location decision issue at the country level, by investigating the internal structure of the economies. We think that it may be interesting to adopt these contributions to explain the variations in business activities between economies. Although, the shift from intra country analysis to cross country analysis does not affect the core idea of location selection decisions, some modification may be necessary. Within this context, the paper strives to examine the dynamics behind the differentiation of production for a region consists of lagging and developing nations of the globe, namely Middle East and North Africa (MENA). Since the firm base data is absent, the paper also open up a discussion on measuring the economic activity at the country level in order to create a proper proxy to asses for the business environment.
Topics in Middle Eastern and African Economies Vol. 12, September 2010

3
Organization of the paper as follow: Next section reviews the location decision of production over which the central arguments are constructed. In section 3, we discuss some facts about the business environment in the MENA region. As mentioned above, identification of the right proxy to account for the business environment is also discussed in this section. The research methodology is introduced in Section 4. Estimation results are presented in section 5. Last section concludes the paper. II. Location of Production and Business Environment Regional studies that intend to evaluate the dynamics of economic development and growth originates from the regional disparity and inequality phenomenon. Yet concentration on various dimensions of regional disparities is an evolving topic. While economic growth is a noteworthy sign to assess the regional differences, different measures to account for such a process is a necessity. Actually it is the rise of new economic geography that somehow connect the Marshalian (1920) type of location decisions with the more contemporary approaches towards identification of regional distribution of economic activity. One has to remark that the evolution of the contemporary debate regarding formation of business environment is strictly linked to the location decision of production. Essentially the issue is discussed in urban economics as well as regional studies (Nijkamp and Mills, 1987). In this respect, it was von Thünen (1826) to explain the surroundings of a central business area for pre industrialized Germany. While von Thünen type of understanding does not explain the formation of a central business area, it is informative as to deepen the observation towards the location decisions of the other agents around the identified business area. Later, Marshall (1920) has offered a more comprehensive view on the motivations for localization. Idea of Marshall (1920) contributed to the existing knowledge by describing the possible mechanisms without assuming an exogenously formed business area - or as Marshall called industrial district-. Labor market pooling, knowledge spillovers and provision of non-tradable inputs are the three building blocks of the Marshalian type localization concept. Formation of industrial districts by itself constructs an environment in which a labor force with identical skill and education level evolves as to satisfy the needs for that industry; later this formation benefits both labor force, by decreasing the time to spend for finding new jobs, and also for the industrial producers, by shrinking the time to search for required labor skill and quality. On the other hand, industrial districts and interaction within these
Topics in Middle Eastern and African Economies Vol. 12, September 2010
4
districts are the environments for the diffusion of knowledge in Marshall (1920). That property is also strictly tied with the formation of complementary production areas within and also around the district. Alternatively, Isard (1954) emphasized that the location decision of production can be best understood on the grounds of general equilibrium models that account for the interrelationship between trade and location decision of production. Isard (1954) augments the ongoing localization debate and underlines the similarities between location analysis and trade theories. Well before the rise of new economic geography, Isard (1954) has underlined the integration of regional localization analysis and trade theories. Following these debates, number of studies in urban and regional economics concentrates on the localization issues. Among them Hoover (1963), Alonso (1964), Henderson (1974) and Beckmann and Thisse (1987) are prominent. While these studies try to evaluate the various aspects of formation of business centers as well as the inner part of these centers, it is the contributions of regional economics and its integration with the trade theory, which helps one to understand agglomeration economies and economies of geography (Helpman and Krugman, 1985, and Grossman and Helpman, 1991). Although these studies which have focused on regional and urban economics formed a concrete perceptive, it is Fujita (1988), Venables (1996) and Krugman (1991a, b, c) to combine the issues and forms the background of new economic geography. From this perspective the comments of Krugman (1991c) are essential. Krugman (1991c, 1992) underlines the significance of location decision of production both within the scope of international trade theories and also for the regional studies. The central emphasize is directed toward concentration thus agglomeration of production. In fact, Krugman (1995) remarks that centripetal and centrifugal forces described by the Marshalian approach constitute the sole of the regional disparities in the form of divergence and convergence. From such a point of view, it is evident that social and economical properties of regions, cities, counties or countries, may work for attracting new economic activities or may discourage those activities. In this setting, the two-sector model that developed by Krugman (1991c) and (1995) portrays the interaction among increasing returns, transportation costs and scale economies as to determine the location decision behavior of economic activity. Naturally, it is necessary to revise new economic geography approach while switching the focus of the study from regional to cross country diversification in
Topics in Middle Eastern and African Economies Vol. 12, September 2010

5
the business environment formation. The role of externalities in the geographic models may be substituted by the dynamics behind business start ups or new firm formation. Regional country studies state that business start ups, or new firm formation volume, is dominated by numerous factors ranging from the social environments to economic backgrounds.1 The literature regarding the formation of the new firms provides two major insights for our study; i) Specific role of new firms - entrepreneurs or formation of business environment - towards their innovation and knowledge diffusion capabilities (Acs at al, 2003, Audretsch and Keilbach, 2004) and also their job creation potentials (Storey, 1994). ii) Economic growth is a vital determinant for the location choice of the new firm start ups. Thus within the context of regional studies, economic growth is no longer only the outcome of the process, instead a vital demand base dynamic of evolution of the business environment (Krugman, 1991a, Storey, 1994). III. Dynamics and Differentiation of Business Environment in MENA MENA region consists of economies which have diverse policy preferences: While some follows short term growth enhancing policies, a limited number of them adopt policies of long-termism. Esfahani (2008) remarks that the latter set of countries are aware of the fact that, institutional factors matter for policy making purposes, which in the long run is expected to be effective. Esfahani (2008) underlines that acting based on short term policies may make these economies more fragile in the long run. Another aspect of the development of the economics activities in the region is the financing the investments. Abu Al-Foul and Soliman (2008) investigated the impact of FDI on host country’s manufacturing exports in the MENA region and found a limited positive effect. On the other hand, Jallob et al. (2008) shows that FDI’s impact on economic growth is conditional; macroeconomic stability has an important effect on FDI. Hisarciklilar et al. (2006), by taking into account the geographic proximity of the MENA region, underline that market potential of countries is important to understand the spatial distribution of FDI within the region. While these studies try to evaluate the determinants for foreign investors to locate in the MENA region, Aysan et al. (2005) questions the low domestic
1 See Storey (1994), Reynolds et al. (1994), Sutaria, Hicks (2004) for a brief discussion regarding the new firm formation literature.
Topics in Middle Eastern and African Economies Vol. 12, September 2010
6
private investment performance of the MENA region countries. Considering limited number of MENA region economies, the model developed by Aysan et al. (2005) underlines the importance of government policies. Lack of financial reforms and low level of openness as well as uncertainties arising from external debt burden and economic volatility are found to be the background of the lagging private investment of the region. Although these studies clearly questioned the background of regional differences in the MENA region, the paper intended to concentrate on a much more specific issue: the variations in development of the business environment. To this end, first step is to determine proper indicator to account the business environment. Numerous cross section and panel data studies employ new firm registrations as the accurate indicator to assess the firm start ups and the strength of business environment. Storey (1994) emphasized that new firms are mostly the innovator, creative actors of the economy; moreover by construction new firms are expected to stimulate the job creation process in its surrounding. Within this perceptive the literature is dominated by country specific studies that investigate the variation of firm start ups and mainly its determinants.2 Annual time series data for firm start ups is not available for the MENA countries considered. Therefore, for the estimation of the model developed, change in sectoral value-added is employed as the proxy of business environment. In order to verify to what extend the change in value-added is an accurate proxy, we contrasted it with the starting business index of World Bank (WB). The index is regarded as an indicator to assess the simplicity of starting up a new business with less obstacles. Starting a business index takes into account all officially necessary procedures that are needed to start up a new business, which is augmented by time, cost and paid in capital that is required to start a new business.3 Table-1 gives a summary of “doing business statistics” for the MENA countries. Over the 186 countries included in the “doing business” survey of the World Bank, ten out of twenty two MENA countries fail to enter the first 100 in terms of “ease of doing business”. In terms of starting new business rank, only Egypt, Israel, Saudi Arabia and United Arab Emirates can take place in the first quintile of the rank.
2 Reynolds, Storey and Westhead (1994), Kangasharju (2000), Fritsch, Falck (2003), Berglund, Branas (2001), Sutari, Hicks (2004) give brief overviews of the debate. 3 For a brief representation of the index see Djankov et al. (2002).
Topics in Middle Eastern and African Economies Vol. 12, September 2010

7
Table 1. Health of Business Environment for New Firms in MENA Region
Economy
Ease of Doing
Business Rank
Starting a Business
Rank Procedures (number)
Time (days)
Cost (% of income per
capita)
Min. capital (% of income per capita)
Algeria 136 148 14 24 12.1 31
Bahrain 20 63 7 9 0.5 195.2
Djibouti 163 177 11 37 195.1 500.5
Egypt, Arab Rep. 106 24 6 7 16.1 0
Iran, Islamic Rep. 137 48 7 9 3.9 0.8
Iraq 153 175 11 77 75.9 30.3
Israel 29 34 5 34 4.2 0
Jordan 100 125 8 13 49.5 19.9
Kuwait 61 137 13 35 1 59.2
Lebanon 108 108 5 9 78.2 51
Morocco 128 76 6 12 16.1 11.8
Oman 65 62 5 12 2.2 273.6
Saudi Arabia 13 13 4 5 7.7 0
Syrian Arab Republic 143 133 7 17 27.8 1,012.50
Tunisia 69 47 10 11 5.7 0
Turkey 73 56 6 6 14.2 9.5
United Arab Emirates 33 44 8 15 6.2 0
West Bank and Gaza 139 176 11 49 55 220.4
Yemen, Rep. 99 53 6 12 83 0
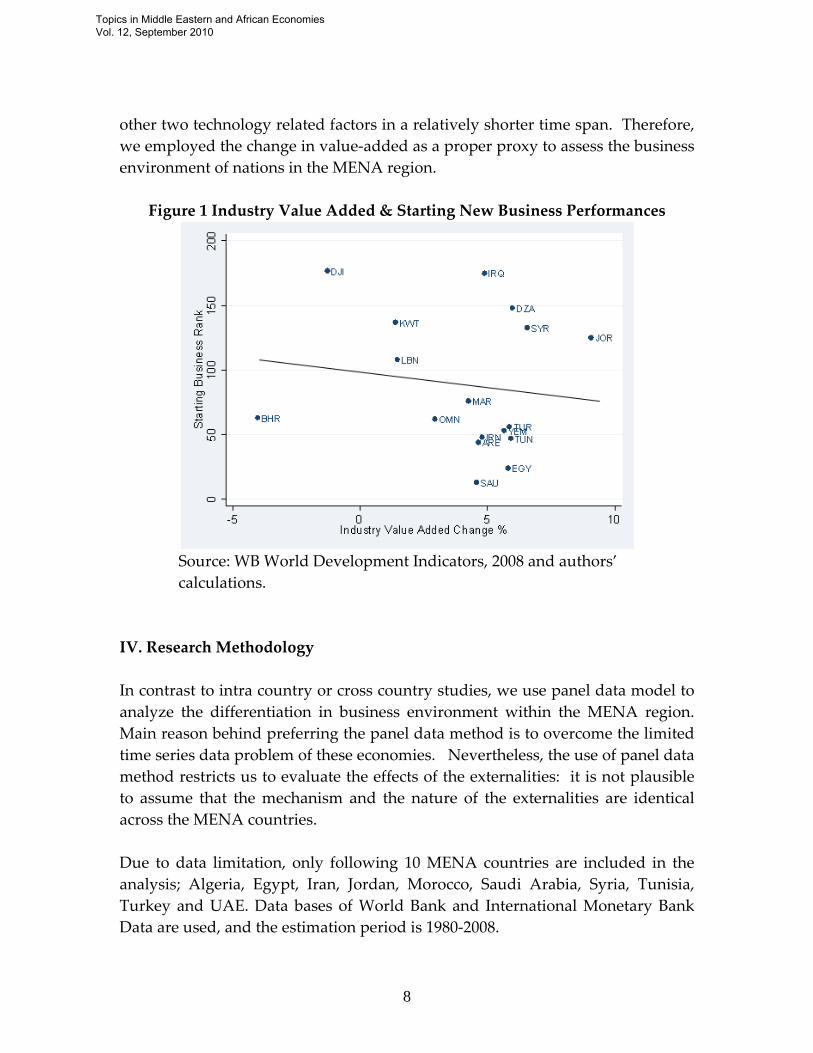
(Source: WB, Doing Business Survey, 2009) Figure-1 displays a fairly significant relationship between the business environment and average annual increase in value added of industrial production: Decreasing trend line produced in the scatter diagram shows that the decrease in the rank of starting business (in other words improvement in business environment) is positively related with the increase in value-added in industry. Assuming that the improvement in the business environment stimulates the firm creation, the result depicted in figure-1 permits us to employ sectoral value-added as the proxy for the open ups. However, it should be noted that the change in value added, particularly increase in, can be related with the three specific changes in the economy; (i) Increase in the production capacities or scales of the existing firms, (ii) Technological improvement which creates an increase in productivity, (iii) Increase in the number of firms operating in the industry. Although, we have not sufficient data to decompose the factors effecting the change in value-added, result presented in figure-1 permits us to conclude that the increase in the number of firms largely effects the change in the value-added. Furthermore, it is also possible to assume that the effect of the change in the number of firms on value-added is more predominant than the
Topics in Middle Eastern and African Economies Vol. 12, September 2010
8
other two technology related factors in a relatively shorter time span. Therefore, we employed the change in value-added as a proper proxy to assess the business environment of nations in the MENA region.
Figure 1 Industry Value Added & Starting New Business Performances
Source: WB World Development Indicators, 2008 and authors’ calculations.
IV. Research Methodology In contrast to intra country or cross country studies, we use panel data model to analyze the differentiation in business environment within the MENA region. Main reason behind preferring the panel data method is to overcome the limited time series data problem of these economies. Nevertheless, the use of panel data method restricts us to evaluate the effects of the externalities: it is not plausible to assume that the mechanism and the nature of the externalities are identical across the MENA countries. Due to data limitation, only following 10 MENA countries are included in the analysis; Algeria, Egypt, Iran, Jordan, Morocco, Saudi Arabia, Syria, Tunisia, Turkey and UAE. Data bases of World Bank and International Monetary Bank Data are used, and the estimation period is 1980-2008.
Topics in Middle Eastern and African Economies Vol. 12, September 2010

9
Since the time dimension of the panel data set is relatively long, we first check the presence of the unit root. Considering the possibility of cross-section dependency, in addition to first generation panel unit root tests, we also consider the second generation panel unit root test. We employed Maddala and Wu (1999) unit root test which do not control for cross-section dependency, and Pesaran (2003) unit root test for the presence of cross-section dependency. We should note that, since the data set used is unbalanced, number of alternative tests is limited. Following the pane unit root tests, the models can be estimated by using different panel data methods. Considering the discussion above, a general panel data model can be defined in the following form; (1) tititi uXy ,,, ++= βα where ‘y’ is the growth of value added in the industry, and ‘X’ is a set of explanatory variables for country ‘i’ and for time ‘t’. Explanatory variables employed in the various versions of the model defined in the paper can be classified into five categories. i) The effect of demand à la Krugman is include into the model by using final consumption as the indicator of the domestic demand and exports as the indicator of the external demand. ii) Money supply (M2) as a percentage of GDP and domestic banking credits to private sector as a percentage of GDP are used as the indicators of the financial deepening. Stimulating effect of financial deepening on business sector is emphasized by Evans and Jovanovic (1989). On the other hand Emran and Stigltz (2007) warn the possible negative impacts of financial liberalization that may hinder new firm formations due to asymmetric information and uncertainty. iii) Inflation rate is used in the models to observe weather the increase in the price level is an obstacle as an instability indicator, or a stimulating factor as depicted by à la inflationary development hypothesis. iv) Oil reserves and fuel exports are used as the indicators of the national natural resource. v) Growth rate of world output, MENA region output growth rate, growth rate of world exports and growth rate of MENA trade volume are employed as the explanatory variables in order to capture the common factors which may affect the business environments in the MENA countries uniformly.
Topics in Middle Eastern and African Economies Vol. 12, September 2010
10
The one way error component can be decomposed as follows; tiiti vu ,, += µ where µ denotes the unobserved individual effects, v denotes the remaining errors. The enduring discussion is regarding the unobserved individual effects; whether these effects are fixed or random. In the case of fixed effect models iµ is assumed to be a fixed parameter and by construction is correlated with explanatory variables unlike the random effect model. tiv , is the IID (0, 2
vσ ) stochastic disturbance, and tiX , must not be correlated with tiv , . The logic behind the fixed effect model estimation is to eliminate the unobserved effect. Baltagi (2005) emphasizes that the within transformation, which can also be labeled as the fixed effects transformation, is the accurate process. On the other hand, in the case of random effect models, the unobserved effect is assumed to be random. As argued by Baltagi (2005), if the expected individual effects are uncorrelated with the regressors, unlike the fixed effect models, then modeling the individual specific constant terms by randomly distributing across cross section units will be more appropriate. The efficiency is that random effect model accounts for the implied serial correlation in the composite error component by using a Generalized Least Squares (GLS) analysis (Baltagi, 2005). While fixed and random effect models can describe the relationship in a static manner, same models can also be constructed in a dynamic panel data setting. Equation 2 gives the general specification of the dynamic panel data models with the inclusion of lagged values of the growth of value added. (2) titititi uXyy ,,1,, +++= − βφα Estimation of equation 2 is subject to the major discussion regarding the time and cross section dimension of the data. A number of methods are enter the realm of the process. While traditional GMM methods discussed by Arellano and Bond (1991) and Blundell and Bond (1998) are widely used, both difference and system GMM should be preferred for panel models with small time and large cross section dimensions. Rodman (2006) emphasized that the increasing number of instruments in panel models with long time dimensions is a crucial problem. Galiani and Gonzalez-Rozada (2002) compares system and difference GMM and emphasizes that system GMM is superior. However, modified Least Square Dummy Variable (LSDVC) method proposed by Kiviet (1995) is considered as the most efficient method for panel data with small cross section and relatively longer time dimensions where time dimension is larger than a single digit
Topics in Middle Eastern and African Economies Vol. 12, September 2010

11
number. For the dynamic version of our panel data models, both system GMM and LSDVC methods will be used. Arellano and Bond (1991) first emphasized that equation 2 can be estimated by using the first difference transformation technique with the moment conditions; [ ] 0,, =∆− tisti vyE (for s≥2, t=3,…..,T ) and [ ] 0,, =∆− tisti vXE (for s≥2, t=3,…..,T).
However, this method which is called as difference Generalized Measure of Moment (GMM) is criticized due to conceptual and statistical problems of using difference estimator (Arrelano and Bover, 1995). Alternative method proposed is the system GMM in which level and difference equations are used together. In this case, instruments for equation in differences will be unchanged -lagged values of the explanatory variables - whereas for the equation in levels, lagged differences of the explanatory variables will be used. System GMM estimation can be valid under the additional moment conditions; [ ] 0)( ,1, =+∆ − tiiti vyE µ and [ ] 0)( ,1, =+∆ − tiiti vXE µ . Moreover, as discussed by Arellano and Bond (1991), Arellano and Bover (1995), and Blundell and Bond (1998), the choice of right instruments is the crucial phase of the estimation. Sargan and Hansen tests evaluate the validity of the instruments used in the estimation procedure with the null hypothesis that instruments used are not correlated with the residuals (Sargan, 1958). Recently, LSDV approach has also introduced as the method of dynamic panel estimations. However, several studies underline that LSDV fails to be consistent for short time and large cross section dimensions.4 This heavily criticized method is later augmented by Kiviet (1995) and Kiviet and Bun (2003) and problems emerged in the estimation process are solved. Considering the contribution of Kiviet (1995) and the remarks of Galiani and Gonzalez-Rozada (2002), we may conclude that dynamic panel models can be estimated by LSDVC method in case of small panels with relatively large time dimension. Kiviet (1995) and Kiviet and Bun (2003) underline the efficiency of LSDVC over GMM and IV for balanced panel models. More recently, Bruno (2005a and 2005b) augmented the contributions of Kiviet (1995) and Bun and Kiviet (2003) and implemented the LSDVC method for unbalanced panels. Bruno (2005a) remarks that the increasing time dimension of the models also decreases the LSDV bias. Overall findings indicate that LSDVC method is superior with respect to LSDV, IV and GMM methods in case of small cross section and relatively large time dimensions. 4 Among others, see Nickell (1981).
Topics in Middle Eastern and African Economies Vol. 12, September 2010
12
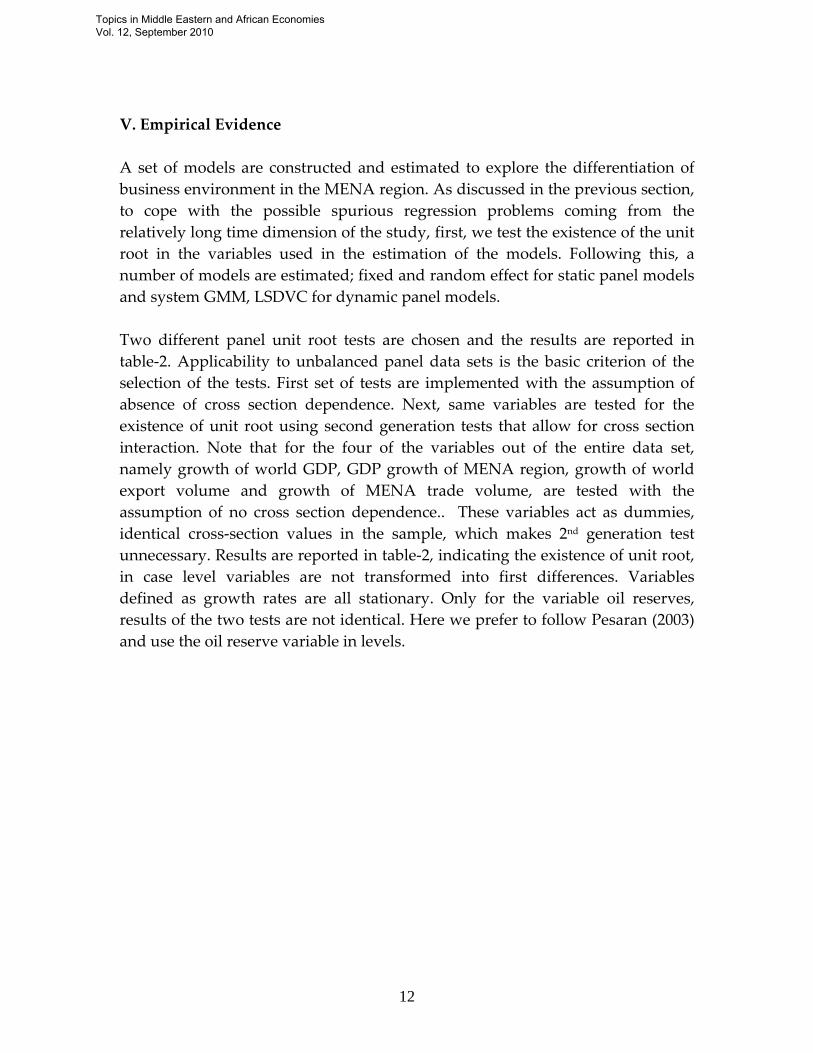
V. Empirical Evidence A set of models are constructed and estimated to explore the differentiation of business environment in the MENA region. As discussed in the previous section, to cope with the possible spurious regression problems coming from the relatively long time dimension of the study, first, we test the existence of the unit root in the variables used in the estimation of the models. Following this, a number of models are estimated; fixed and random effect for static panel models and system GMM, LSDVC for dynamic panel models. Two different panel unit root tests are chosen and the results are reported in table-2. Applicability to unbalanced panel data sets is the basic criterion of the selection of the tests. First set of tests are implemented with the assumption of absence of cross section dependence. Next, same variables are tested for the existence of unit root using second generation tests that allow for cross section interaction. Note that for the four of the variables out of the entire data set, namely growth of world GDP, GDP growth of MENA region, growth of world export volume and growth of MENA trade volume, are tested with the assumption of no cross section dependence.. These variables act as dummies, identical cross-section values in the sample, which makes 2nd generation test unnecessary. Results are reported in table-2, indicating the existence of unit root, in case level variables are not transformed into first differences. Variables defined as growth rates are all stationary. Only for the variable oil reserves, results of the two tests are not identical. Here we prefer to follow Pesaran (2003) and use the oil reserve variable in levels.
Topics in Middle Eastern and African Economies Vol. 12, September 2010
13
Table 2 First and Second Generation Panel Unit Root Test Results
No Cross Section Dependence
Maddala, Wu (1999) Fisher Type Test
Cross Section Dependence Pesaran (2003)
CADF Test
Y Y∆ Y Y∆
Industry Value Added
Constant 0.0026 137.91*** -0.373 -7.120*** Constant&Trend 0.8007 125.78*** 1.951 -6.915***
Final Consumption
Constant 0.0001 132.27*** 6.304 -4.677*** Constant&Trend 0.0001 109.72*** 7.203 -3.762***
Export Growth
Constant 151.49*** - -4.079*** - Constant&Trend 119.21*** - -3.146*** -
World GDP Growth
Constant 99.01*** - - - Constant&Trend 58.95*** - - -
World Export Growth
Constant 97.68*** - - - Constant&Trend 127.20*** - - -
MENA GDP Growth
Constant 134.94*** - - - Constant&Trend 100.49*** - - -
MENA Trade Growth
Constant 29.00* - - - Constant&Trend 25.57 67.78*** - -
Money Supply (M2 %GDP)
Constant 44.23*** - -0.088 -4.728*** Constant&Trend 27.72 58.83*** -0.666 -3.947***
Domestic Credit to Private Sec. (%GDP)
Constant 30.19* 89.94*** 0.898 -4.569*** Constant&Trend 30.96* 62.34*** 0.633 -3.216***
Consumer Price Index (¥)
Constant 2.08 28.32* 2.325 -0.732 Constant&Trend 9.71 17.90 3.455 0.046
Oil Reserves
Constant 18.66 141.27*** -3.320*** - Constant&Trend 13.68 106.24*** -2.188** -
Fuel Exports (% of GDP)
Constant 24.89 125.33*** 0.095 -3.142*** Constant&Trend 9.3264 128.29*** 4.429 -2.245***
***, **, * represents rejection of unit root at 1%, 5% and 10% respectively (¥) CPI variable becomes stationary after the second difference transformation. Considering the results of the unit root tests, we identified alternative panel data models for the analyses of the development of the business environment in the MENA region. A number of models are estimated and Table-3 and 4 display the estimation results for the random effect and fixed effect static panel data models, respectively. One major finding is that growth of world GDP, GDP growth of MENA region, growth of world export volume and growth of MENA trade volume don not have a significant effect on the industrial value-added growth in
Topics in Middle Eastern and African Economies Vol. 12, September 2010

14
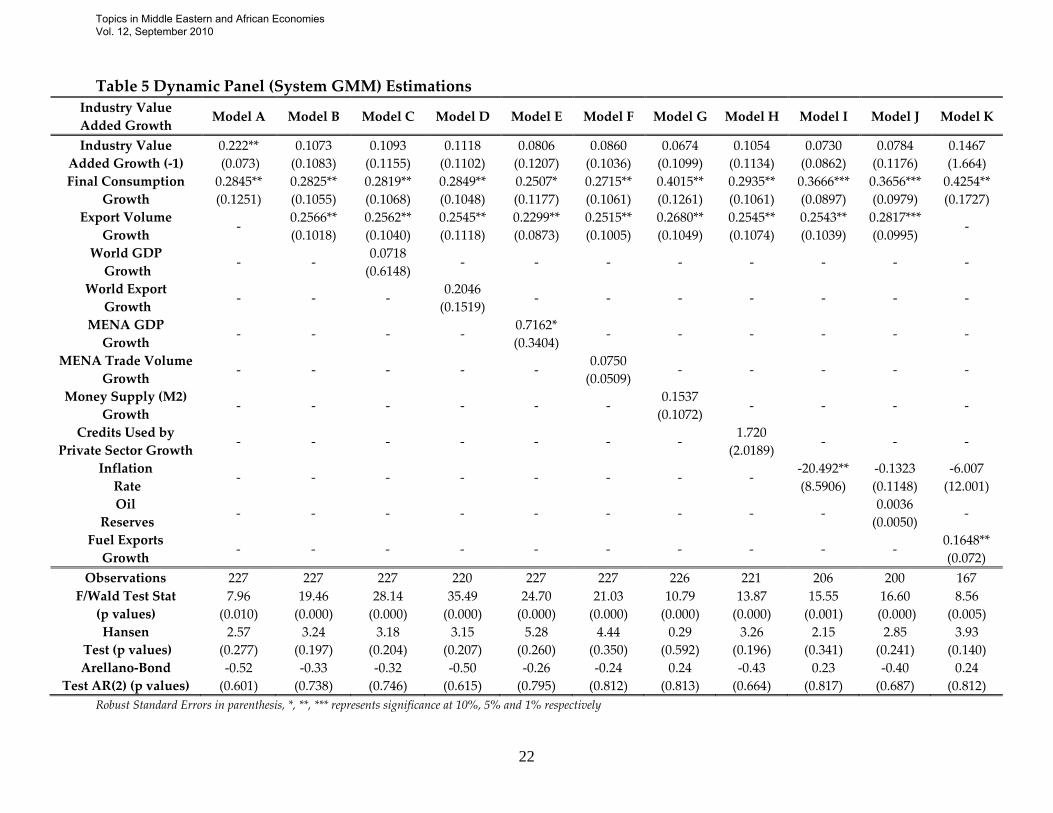
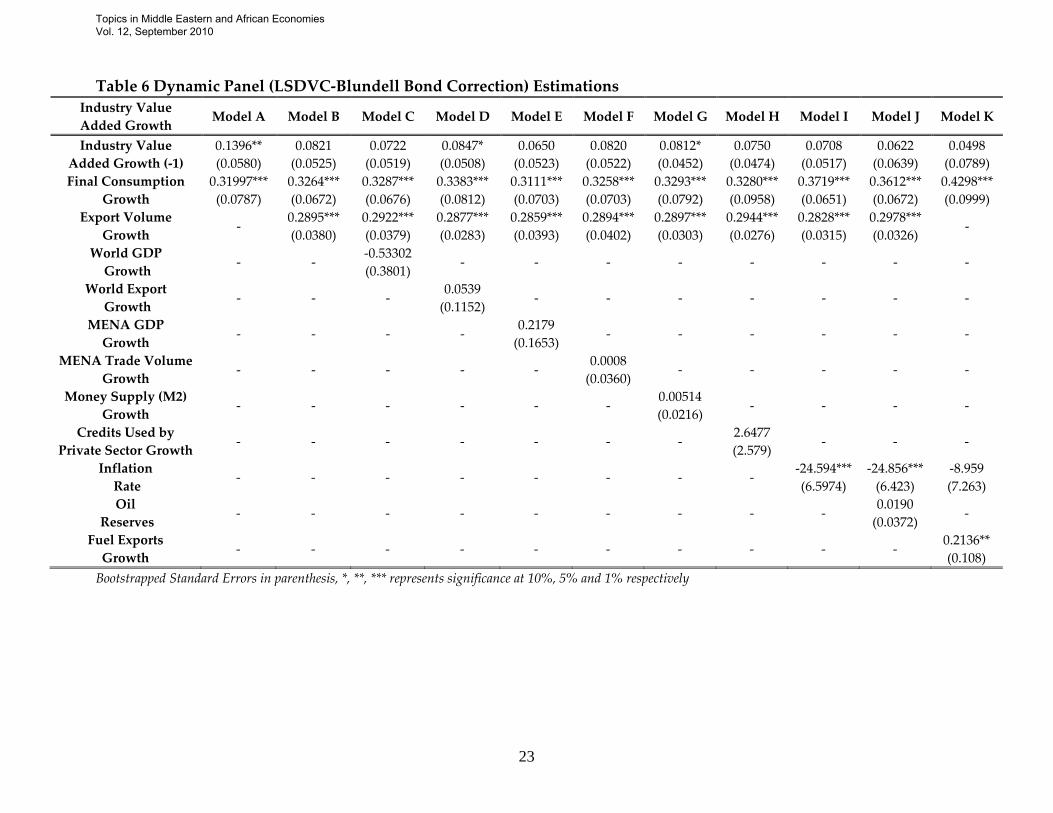
MENA countries. On the other hand, estimated coefficients for the national export growth and change in the domestic consumptions are significant in all models. Financial development defined as the change in money supply is insignificant, whereas credit used by private sector is found as one of the key determinants of the improvement in the business environment. Inflation rate, which is not employed as the explanatory variable with the financial development indicators due to possible multi colinearity problems, seems to be a sign of instability for industrial value added. Finally, to control the effect of oil, two different models are estimated. While oil reserves have a negligible effect on the development of the business environment, growth of fuel exports has a significant effect on the business sector. We also defined dynamic panel models. Number of models are estimated and reported in Table-5 and 6. Note that for GMM estimations Hansen test statistics indicate the validity of the preferred instruments in all of the models5. Moreover the absence of second order auto correlation cannot be rejected in the entire model set. Results are parallel with the findings reported in the tables 3 and 4. Major interesting finding is that the lagged value of the industry value added growth has no significant effect on the current industrial value added. Moreover for model J, while random effect estimations point out a weak a negative impact of oil reserves path on industrial value added, this relationship vanishes for the dynamic models constructed. Overall the consistency of the models in different estimations techniques should be regarded as a sign of stability of the overall models and related hypothesis. The estimation results highlight the role of the domestic demands. As discussed by Krugman (1991c, 1992) and also by numerous empirical works, domestic demand is an important element of the business side of the economy. In all of the models estimated, final consumption is found to be significantly affecting industrial value added. The path of domestic demand, openness and business side proxy are illustrated in appendix A and B separately. Figures for selected eight MENA economies remark the parallel movement of indicators throughout the post 1980 period. Both set of illustrations are consistent with the findings of the empirical models. Holding 5 The major problem regarding the increasing number of instruments is controlled throughout the estimation procedure holding the number of instruments used less than the number of individual in each of the models; hence a common problem of weakened Hansen statistic is solved. Finally, testing the presence of second order auto correlation in errors is also necessary to estimate the dynamic models; all tests results verified the absence of second order autocorrelation.
Topics in Middle Eastern and African Economies Vol. 12, September 2010

15
VI. Conclusion The paper analyzes the factors which affect the development of business environment in the selected MENA countries. Drawing on the recent literature on regional differentiation in economic activities and on location choice of production units, it attempts to investigate sources of the disparities in the region. Domestic and external demands, openness, financial deepening, regional and global trends, oil production and oil reserves are considered as the factors which may have effect on the business environment. Static and dynamic panel data models estimated reveal that the domestic and the external demand are the major factors on the development of the business environment. The results also indicate that the inflation impede the progress of the business sector. Significant coefficient estimated for the credit used by the private sector can be considered as the signal of the effectiveness of the financial deepening. However, the estimation results should be taken with the caveat that the growth rate of the industrial value-added is used as a proxy for the firm open up: The reliability of the model will improve when the quality of the data enhanced.
Topics in Middle Eastern and African Economies Vol. 12, September 2010

16
References Abu Al-Foul, B. and Soliman, M., 2008, “Foreign Direct Investment and LDC
Exports: Evidence from the MENA Region”, Emerging Markets Finance and Trade Vol. 44, 2, pp. 4 - 14
Acs, Z. J., Audretsch, D., Braunerhjelm, P. and Carlsson, B., 2003 “The Missing Link: The Knowledge Filter and Endogenous Growth” DRUID Summer Conference
Alonso, W., 1964, Location and land use: toward a general theory of land rent, Harvard University Press Cambridge, MA
Arellano, M. and Bond, S., 1991, “Some Tests of Specification for Panel Data: Monte Carlo Evidence and an Application to Employment Equations”, Review of Economic Studies, Vol.58, pp.277-297
Arellano, M. and Bover, O., 1995, "Another look at the instrumental variable estimation of error-components models", Journal of Econometrics, Vol: 68, No: 1, pp.29-51
Audretsch, D. B. and Keilbach, M., 2004, “Entrepreneurship and regional growth: an evolutionary perspective” Journal of Evolutionary Economics 14, pp.605-616
Aysan, A., Pang, G. and Varoudakis, M.A. V., 2005, “How to Boost Private Investment in the MENA Countries: The Role of Economic Reforms”, Topics on MENA Economies, Proceedings of the Middle East Economic Association
Baltagi, B. H., 2005, Econometric Analysis of Panel Data 3rd Edition England J.W.&Sons
Beckmann, M. Thisse, J. F., 1986, “The Location of Production Activities”, in Nijkamp P. (ed),Handbook of Regional and Urban Economics Vol.1, Elsevier Science Publisher
Berglund, E. and Brannas, K., 2001, “Plants’ entry and exit in Swedish municipalities” The Annals of Regional Science Vol.35, pp: 431-448
Blundell, R. and Bond, S., 1998, GMM Estimation with Persistent Panel Data, An application to Production Functions”, The Institute For Fiscal Studies, Working Paper Series No. W99/4
Bruno, G. S. F., 2005a, . "Monte Carlo analysis for dynamic panel data models," United Kingdom Stata Users' Group Meetings 2005-06, Stata Users Group
Bruno, G. S. F., 2005b. "Estimation and inference in dynamic unbalanced panel data models with a small number of individuals," CESPRI Working Papers 165, CESPRI
Topics in Middle Eastern and African Economies Vol. 12, September 2010
17
Djankov, S., La Porta, R., Lopez Di-Silanes, F. and Shleifer, A., 2002, “The Regulation of entry”, The Quarterly Juornal of Economics, Vol. 117. No.1
Esfahani, H., 2008, "Growth Fundamentals and Economic Growth in the MENA Region," Economic Research Forum, Institutions and Economic Development—Proceedings of the 14th Annual Conference of ERF
Emran, S. M. and Stiglitz, J. E., 2007, “Financial Liberalization, Financial Restraint, and Entrepreneurial Development” paper available at http://www.cid.harvard.edu/neudc07/docs/neudc07_s5_p02_emran.pdf
Evans, D. S. and Jovanovic, B., 1989, “An Estimated Model of Entrepreneurial Choice under Liquidity Constraints” The Journal of Political Economy Vol.97, No.4, pp.808-827
Fritsch, M. and Falck, O., 2003, “New Firm Formation by Industry over Space and Time: A Multi-Level Analysis” German Institute for Economic Research Discussion Papers
Fujita, M., 1988, “A Monopolistic Competition Model of Spatial Agglomeration: A Differentiated Product Approach”, Regional Science and Urban Economics, Vol.18, pp.87-124
Fujita, M., Krugman, P. and Venables, A., 1999, The Spatial Economy. Cities, Regions and International Trade, Cambridge MA: MIT Press
Galiani, S. and Gonzalez-Rozada, M., 2002. "Inference and estimation in small sample dynamic panel data models," Business School Working Papers Treinta,
Grossman, G. and Helpman, E., 1991, Innovation and Growth in the World Economy, Cambridge, MIT Press
Hisarciklilar, K., Kayam, S. S. and Kayalica, O., 2006, “Locational Drivers of FDI in MENA Countries: A Spatial Attempt”, MPRA Paper No. 2085
Henderson, J. V., 1974, “The Sizes and Types of Cities”, American Economic Review, Vol.64, pp.640-656
Helpman, E. and Krugman, P., 1985, Market Structure and Foreign Trade, Cambridge, MIT Press
Hoover, E. M., 1963, The Location of Economic Activity, McGraw Hill, New York Isard, W., 1954, “Location Theory and Trade Theory: A Short-Run Analysis”, The
Quarterly Journal of Economics, Vol. 68, No.2, pp.305-320 Jallob, M. S., Patrick, M. B. and Snadretto, R., 2008, “Foreign Direct Investment,
Macroeconomic Instability and Economic Growth in MENA Countries”, Groupe d’Analyse et de Théorie Économique UMR 5824 du CNRS Working Paper 08-17
Topics in Middle Eastern and African Economies Vol. 12, September 2010

18
Kangasharju, A., 2000, “Regional Variation in firm formation: Panel and Cross-Section Data Evidence form Finland” Papers in Regional Science Vol.79, pp.355-373
Kiviet, J.F., 1995, “On Bias, Inconsistency and Efficiency of Various Estimators in Dynamic Panel Data Models”, Journal of Econometrics, Vol. 68, pp.53-78.
Kiviet, J. F., Bun, M. J. G.., 2003, "On the diminishing returns of higher-order terms in asymptotic expansions of bias", Economics Letters, Vol. 79 No. 2, pp. 145-152
Krugman, P., 1991a Geography and Trade MIT Press Krugman, P., 1991b “History and Industry Location: The Case of Manufacturing
Belt” The American Economic Review Vol. 81, No.2,, pp.80-83 Krugman, P. 1991c “Increasing Returns and Economic Geography” The Journal
of Political Economy Vol.99, No.3, , pp.483-499 Krugman, P., 1992, “A Dynamic Spatial Model”, NBER Working Paper No.4219 Krugman, P., 1995, Development, Geography and Economic Theory, Cambridge,
MIT Press Maddala, G. S. and Wu, S., 1999, “A Comparative Study of Unit Root Tests with
Panel Data and New Simple Test", Oxford Bulletin of Economics and Statistics, Vol.61, pp.631-652
Marshall, A., 1920, Principles of Economics, London, Macmillan, 7th Edition McKinnon R.I., 1973, Money and Capital in Economic Development, The Brookings Institution
Nickell, S.J., 1981, “Biases in Dynamic Models with Fixed Effects”, Econometrica, Vol. 49, pp.1417-1426.
Nijkamp, P. and Mills, E.D., 1986 “Advances in Regional Economics” in Nijkamp P. (ed), Handbook of Regional and Urban Economics Vol.1, Elsevier Science Publisher
Pesaran, M. H., 2003, "A Simple Panel Unit Root Test in the Presence of Cross Section Dependence", Cambridge Working Papers in Economics
Reynolds, P., Storey, D. J. and Westhead, P., 1994, “Cross-national Comparisons of the Variation in New Firm Formation Rates” Regional Studies Vol.28, No.4, pp.443-456
Rodman, D., 2006, “How to Do xtabond2: An Introduction to “Difference” and “System” GMM in Stata”, Center for Global Development Working Paper No.103
Sargan, J.D., 1958, “The estimation of economic relationships using instrumental variables”, Econometrica, Vol. 26, pp. 393–415.
Storey, D.J., 1994 Understanding the Small Business Sector, 1st Edition, Routledge, London
Topics in Middle Eastern and African Economies Vol. 12, September 2010
19
Sutaria, V. and Hicks, D. A., 2004 “New firm Formation: Dynamics and Determinants” The Annals of Regional Science Vol.38, pp: 241-262
Venables, A. J, 1996, “Equilibrium Locations of Vertically Linked Industries”, International Economic Review, Vol..37, No.2, pp.341-359
Von Thünen, J. H., 1826 Der Isolierte Staat in Beziehung auf Landscaft und Nationalökonomie. Hamburg (English Translation by C.M. Warterberg, von Thünen’s Isolated State, Oxford: Pergamon Press)
Topics in Middle Eastern and African Economies Vol. 12, September 2010

20
Table 3 Random Effect (GLS) Estimation Results
Industry Value Added Growth
Model A Model B Model C Model D Model E Model F Model G Model H Model I Model J Model K
Final Consumption Growth
0.4277*** (0.094)
0.3733*** (0.0849)
0.3718*** (0.0856)
0.3817*** (0.0886)
0.3587*** (0.0849)
0.3728*** (0.0860)
0.3726*** (0.0850)
0.3494*** (0.0880)
0.3853*** (0.0743)
0.3812*** (0.0749)
0.3948*** (0.0881)
Export Volume Growth - 0.3482***
(0.0552) 0.3517*** (0 .0528)
0.3487*** (0.0567)
0.3419*** (0.0543)
0.3478*** (0.056)
0.3485*** (0.0554)
0.3046*** (0.0631)
0.2887*** (0.0628)
0.3030*** (0.0608)
-
World GDP Growth - - -0.5697
(0.4273) - - - - - - - -
World Export Growth - - -
0.0287 (0.1251) - - - - - - -
MENA GDP Growth - - - -
0.2058 (0.1811) - - - - - -
MENA Trade Volume Growth - - - - - 0.0020
(0.0328) - - - - -
Money Supply (M2) Growth - - - - - - 0.0024
(0.0169) - - - -
Credits Used by Private Sector Growth - - - - - - -
3.1706** (1.290) - -
2.5534** (1.058)
Inflation Rate - - - - - - - - -24.735***
(8.002) -24.729***
(7.993) -
Oil Reserves - - - - - - - - - 0.0045
(0.0055) -
Fuel Exports Growth - - - - - - - - - -
0.2211*** (0.0563)
Observations 234 234 234 227 234 234 233 222 207 201 176 F/Wald Test Stat
(p values) 20.67
(0.000) 61.36
(0.000) 64.12
(0.000) 65.35
(0.000) 65.78
(0.000) 61.44
(0.000) 62.25
(0.000) 57.46
(0.000) 60.84
(0.000) 61.11
(0.000) 50.38
(0.000) Adjusted R Square 0.096 0.42 0.43 0.43 0.43 0.42 0.42 0.34 0.41 0.44 0.27
Robust Standard Errors in parenthesis, *, **, *** represents significance at 10%, 5% and 1% respectively
Topics in Middle Eastern and African Economies Vol. 12, September 2010

21
Table 4 Fixed Effect (within) Estimation Results Industry Value Added Growth
Model A Model B Model C Model D Model E Model F Model G Model H Model I Model J Model K
Final Consumption Growth
0.4165*** (0.0964)
0.3762*** (0.0849)
0.3740*** (0.085)
0.3869*** (0.0882)
0.3606*** (0.0846)
0.3756*** (0.0858)
0.3825*** (0.0870)
0.3554*** (0.0887)
0.3829*** (0.0759)
0.3709*** (0.0801)
0.3748*** (0.0910)
Export Volume Growth -
0.3492*** (0.0574)
0.3524*** (0.0550)
0.3486*** (0.0592)
0.3424*** (0.0564)
0.3487*** (0.058)
0.3491*** (0.0574)
0.3029*** (0.0639)
0.2843*** (0.0635)
0.2995*** (0.0627) -
World GDP Growth - - -0.5684
(0.4181) - - - - - - - -
World Export Growth - - - 0.0360
(0.1213) - - - - - - -
MENA GDP Growth - - - -
0.2109 (0.1763) - - - - - -
MENA Trade Volume Growth - - - - - 0.0021
(0.0312) - - - - -
Money Supply (M2) Growth - - - - - - 0.0135
(0.0218) - - - -
Credits Used by Private Sector Growth - - - - - - -
3.1757** (1.422) - -
2.158** (1.084)
Inflation Rate - - - - - - - -
-25.192*** (7.660)
-25.399*** (7.5607) -
Oil Reserves - - - - - - - - - 0.0199
(0.0392) -
Fuel Exports Growth - - - - - - - - - -
0.2185*** (0.0673)
Observations 234 234 234 227 234 234 233 222 207 201 176 F/Wald Test Stat
(p values) 23.09
(0.000) 29.53
(0.000) 20.68
(0.000) 20.93
(0.000) 20.99
(0.000) 19.64
(0.000) 19.71
(0.000) 17.08
(0.000) 19.92
(0.000) 15.19
(0.000) 12.94
(0.000) Adjusted R Square 0.096 0.42 0.43 0.43 0.43 0.42 0.42 0.34 0.41 0.43 0.22
Robust Standard Errors in parenthesis, *, **, *** represents significance at 10%, 5% and 1% respectively
Topics in Middle Eastern and African Economies Vol. 12, September 2010
22
Table 5 Dynamic Panel (System GMM) Estimations Industry Value Added Growth
Model A Model B Model C Model D Model E Model F Model G Model H Model I Model J Model K
Industry Value Added Growth (-1)
0.222** (0.073)
0.1073 (0.1083)
0.1093 (0.1155)
0.1118 (0.1102)
0.0806 (0.1207)
0.0860 (0.1036)
0.0674 (0.1099)
0.1054 (0.1134)
0.0730 (0.0862)
0.0784 (0.1176)
0.1467 (1.664)
Final Consumption Growth
0.2845** (0.1251)
0.2825** (0.1055)
0.2819** (0.1068)
0.2849** (0.1048)
0.2507* (0.1177)
0.2715** (0.1061)
0.4015** (0.1261)
0.2935** (0.1061)
0.3666*** (0.0897)
0.3656*** (0.0979)
0.4254** (0.1727)
Export Volume Growth - 0.2566**
(0.1018) 0.2562** (0.1040)
0.2545** (0.1118)
0.2299** (0.0873)
0.2515** (0.1005)
0.2680** (0.1049)
0.2545** (0.1074)
0.2543** (0.1039)
0.2817*** (0.0995)
-
World GDP Growth - - 0.0718
(0.6148) - - - - - - - -
World Export Growth - - -
0.2046 (0.1519) - - - - - - -
MENA GDP Growth - - - - 0.7162*
(0.3404) - - - - - -
MENA Trade Volume Growth - - - - - 0.0750
(0.0509) - - - - -
Money Supply (M2) Growth - - - - - -
0.1537 (0.1072) - - - -
Credits Used by Private Sector Growth - - - - - - -
1.720 (2.0189) - - -
Inflation Rate - - - - - - - - -20.492**
(8.5906) -0.1323 (0.1148)
-6.007 (12.001)
Oil Reserves - - - - - - - - - 0.0036
(0.0050) -
Fuel Exports Growth - - - - - - - - - -
0.1648** (0.072)
Observations 227 227 227 220 227 227 226 221 206 200 167 F/Wald Test Stat
(p values) 7.96
(0.010) 19.46
(0.000) 28.14
(0.000) 35.49
(0.000) 24.70
(0.000) 21.03
(0.000) 10.79
(0.000) 13.87
(0.000) 15.55
(0.001) 16.60
(0.000) 8.56
(0.005) Hansen
Test (p values) 2.57
(0.277) 3.24
(0.197) 3.18
(0.204) 3.15
(0.207) 5.28
(0.260) 4.44
(0.350) 0.29
(0.592) 3.26
(0.196) 2.15
(0.341) 2.85
(0.241) 3.93
(0.140) Arellano-Bond
Test AR(2) (p values) -0.52
(0.601) -0.33
(0.738) -0.32
(0.746) -0.50
(0.615) -0.26
(0.795) -0.24
(0.812) 0.24
(0.813) -0.43
(0.664) 0.23
(0.817) -0.40
(0.687) 0.24
(0.812) Robust Standard Errors in parenthesis, *, **, *** represents significance at 10%, 5% and 1% respectively
Topics in Middle Eastern and African Economies Vol. 12, September 2010
23
Table 6 Dynamic Panel (LSDVC-Blundell Bond Correction) Estimations Industry Value Added Growth
Model A Model B Model C Model D Model E Model F Model G Model H Model I Model J Model K
Industry Value Added Growth (-1)
0.1396** (0.0580)
0.0821 (0.0525)
0.0722 (0.0519)
0.0847* (0.0508)
0.0650 (0.0523)
0.0820 (0.0522)
0.0812* (0.0452)
0.0750 (0.0474)
0.0708 (0.0517)
0.0622 (0.0639)
0.0498 (0.0789)
Final Consumption Growth
0.31997*** (0.0787)
0.3264*** (0.0672)
0.3287*** (0.0676)
0.3383*** (0.0812)
0.3111*** (0.0703)
0.3258*** (0.0703)
0.3293*** (0.0792)
0.3280*** (0.0958)
0.3719*** (0.0651)
0.3612*** (0.0672)
0.4298*** (0.0999)
Export Volume Growth - 0.2895***
(0.0380) 0.2922*** (0.0379)
0.2877*** (0.0283)
0.2859*** (0.0393)
0.2894*** (0.0402)
0.2897*** (0.0303)
0.2944*** (0.0276)
0.2828*** (0.0315)
0.2978*** (0.0326)
-
World GDP Growth - - -0.53302
(0.3801) - - - - - - - -
World Export Growth - - -
0.0539 (0.1152) - - - - - - -
MENA GDP Growth - - - - 0.2179
(0.1653) - - - - - -
MENA Trade Volume Growth - - - - - 0.0008
(0.0360) - - - - -
Money Supply (M2) Growth - - - - - -
0.00514 (0.0216) - - - -
Credits Used by Private Sector Growth - - - - - - -
2.6477 (2.579) - - -
Inflation Rate - - - - - - - - -24.594***
(6.5974) -24.856***
(6.423) -8.959 (7.263)
Oil Reserves - - - - - - - - - 0.0190
(0.0372) -
Fuel Exports Growth - - - - - - - - - -
0.2136** (0.108)
Bootstrapped Standard Errors in parenthesis, *, **, *** represents significance at 10%, 5% and 1% respectively
Topics in Middle Eastern and African Economies Vol. 12, September 2010

24
Appendix A – Final Consumption Growth and Industrial Value Added Growth in Selected MENA Region Countries - - - - Industry Value Added Growth Final Consumption Growth
Algeria
-10
-5
0
5
10
15
19801983
19861989
19921995
19982001
20042007
Egypt
-15
-10
-5
0
5
10
15
20
25
19801983
19861989
19921995
19982001
20042007
Iran
-60
-40
-20
0
20
40
60
19801983
19861989
19921995
19982001
20042007
Jordan
-20
-10
0
10
20
30
40
19801983
19861989
19921995
19982001
20042007
Morocco
-10
-5
0
5
10
15
19801983
19861989
19921995
19982001
20042007
Syrian Arab Rep.
-20
-10
0
10
20
30
19801983
19861989
19921995
19982001
20042007
Tunisia
-202468
10121416
19801983
19861989
19921995
19982001
20042007
Turkey
-15
-10
-5
0
5
10
15
19801983
19861989
19921995
19982001
20042007
Topics in Middle Eastern and African Economies Vol. 12, September 2010

25
Appendix B –Export Growth and Industrial Value Added Growth in Selected MENA Region Countries - - - - Industry Value Added Growth Export Growth
Algeria
-15
-10
-5
0
5
10
15
19801983
19861989
19921995
19982001
20042007
Egypt
-15-10-505
1015202530
19801983
19861989
19921995
19982001
20042007
Iran
-80-60-40-20
020406080
100120
19801983
19861989
19921995
19982001
20042007
Jordan
-20
-10
0
10
20
30
40
19801983
19861989
19921995
19982001
20042007
Morocco
-5
0
5
10
15
20
25
19801983
19861989
19921995
19982001
20042007
Syrian Rep.
-30
-20-10
010
20
3040
50
19801983
19861989
19921995
19982001
20042007
Tunisia
-10
-5
0
5
10
15
20
25
19801983
19861989
19921995
19982001
20042007
Turkey
-15
-10-5
05
10
1520
25
19801983
19861989
19921995
19982001
20042007
Topics in Middle Eastern and African Economies Vol. 12, September 2010


![[PreMoney MENA 2015] ArabNet >> Omar Christidis, "THE GLOBAL VC: MENA"](https://img.pdfslide.us/doc/110x75/58d198b51a28ab6f6b8b4a09/premoney-mena-2015-arabnet-omar-christidis-the-global-vc-mena.jpg)