Embed Size (px)
Citation preview

Material properties
On the difference in material structure and fatigue propertiesof nylon specimens produced by injection molding andselective laser sintering
Brecht Van Hooreweder a,*, David Moens a,b, Rene Boonen a, Jean-Pierre Kruth a,Paul Sas a
aKU Leuven, Department of Mechanical Engineering, PMA, Celestijnenlaan 300b, 3001 Leuven, Belgiumb Thomas More Mechelen, Campus De Nayer, J. De Nayerlaan 5, 2860 Sint-Katelijne-Waver, Belgium
a r t i c l e i n f o
Article history:Received 19 March 2013Accepted 30 April 2013
Keywords:Selective laser sinteringInjection moldingPolyamide 12MicrostructureFatigue behavior
a b s t r a c t
This paper describes the influence of dynamic tension/compression loading on notchedand unnotched nylon specimens fabricated by Injection Molding (IM) and Selective LaserSintering (SLS). The main objective of this work is to analyze and describe the differencesin material structure and fatigue properties of as-built nylon parts produced by IM andSLM from the same polyamide 12 powder. The differences in dimensional quality, density,surface roughness, crystal structure and crystallinity are systematically measured andlinked to the mechanical fatigue properties. The fatigue properties of the unnotched SLSspecimens are found to be equal to those of the unnotched IM specimens. The presence ofpores in the sintered samples does not lead to rapid failure, and the microvoid coalescencefailure mechanism is delayed. The notched specimens show more brittle failure andincreased fatigue resistance which is caused by local notch-strengthening. The resultsenable improved understanding of the difference in material structure and fatiguebehavior of selective laser sintered and injection molded polyamide.
! 2013 Elsevier Ltd. All rights reserved.
1. Introduction
Selective laser sintering (SLS) is an additive manu-facturing process in which layers of preheated powder arespread and laser radiation is used to liquefy (either partiallyor fully) and fuse the powdered material [1]. Sintered ma-terial forms parts, whilst un-sintered material remains inplace to support the structure. The build platform is slowlycooled to room temperature after sintering to avoidshrinkage and distortion of the final products. Selectivelaser sintering has evolved from a rapid prototyping (RP)technique to a promising additive manufacturing (AM)
technique. Sintered parts in polyamide are increasinglybeing used for functional applications in the automotive,aerospace and biomedical industries [2,3]. The SLS processoffers anumberof advantages overconventional productiontechniques, such as injection molding (IM): short design tomanufacturing cycle time, high geometrical freedom,customized components and inexpensive production ofsmall numbers of parts. However, to be competitivewith theconventional production techniques, the mechanical prop-erties of the SLS components must be sufficient to meet in-service loading and operational requirements.
A number of studies have been performed to optimizethemechanical properties using polymer blends [4–8]. Also,the influence of various process parameters such as energydensity, cooling rate, scan pattern, layer orientation, delaytime, etc. has been analyzed to find an optimal set of pro-duction parameters [9–13]. Although the mechanical
* Corresponding author. Tel.: !32 16 328607; fax: !32 16 322838.E-mail address: [email protected] (B. Van
Hooreweder).
Contents lists available at SciVerse ScienceDirect
Polymer Testing
journal homepage: www.elsevier .com/locate/polytest
0142-9418/$ – see front matter ! 2013 Elsevier Ltd. All rights reserved.http://dx.doi.org/10.1016/j.polymertesting.2013.04.014
Polymer Testing 32 (2013) 972–981

properties of sinteredmaterial are of significant importance,very little has been reported in literature on the fatigueproperties of sintered polyamide components. Knowledgeof the fatigue properties of these sintered materials islimited and accurate fatigue life predictions are, therefore,not possible.
In a previous study, the authors made a first attempt toaddress this by studying the fatigue failure of unnotchedSLS-PA12 components under tension/compression loading[14]. In the present work, notched and unnotched SLSspecimens are subjected to the same fatigue loading andcompared with notched and unnotched IM specimens. Allthe specimens were produced from the same powderparticles and the quality of the end-products was carefullyexamined prior to fatigue testing. Consequently, a truecomparison between IM and SLS specimens is made.
Fig. 1 shows an overview of the most important pa-rameters influencing the fatigue life of PA12 componentsproduced by selective laser sintering or injection molding.The fatigue life depends on the fatigue testing conditionsand the properties of the final parts. These final partproperties are functions of the powder quality and processparameters. This work presents a systematic description ofprocess parameters, powder quality and final part proper-ties which is then linked to the experimentally determinedmechanical fatigue behavior.
2. Test specimens
2.1. Material and geometry
It is well known that powder properties and dimensionsare important for the quality of laser sintered parts. To
minimize the influence of the raw material on the me-chanical properties of the specimens, one unique batch ofsemi-crystalline polyamide 12 (PA12) powder was used forthe production of the specimens with both SLS and IM.Fig. 2 shows a scanning microscope observation of thesepowder particles indicating the semi-spherical geometrywith average diameter of 60 mm.
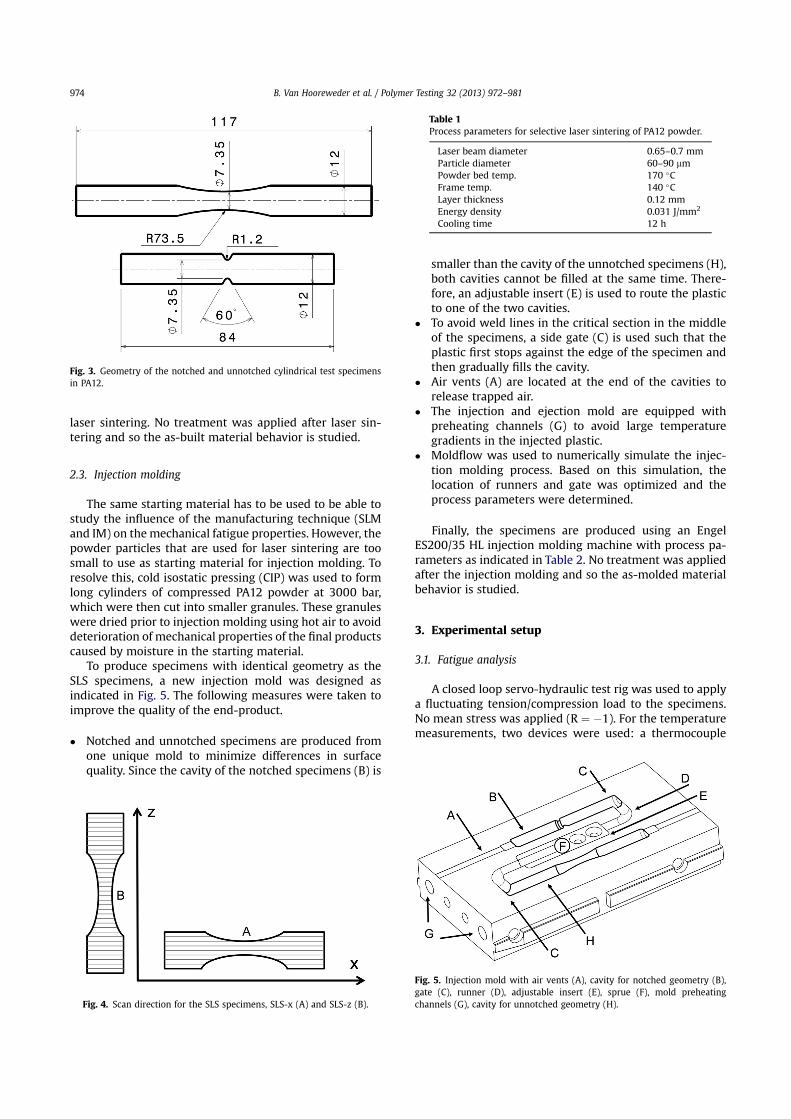
Fig. 3 shows the geometry of the notched andunnotched cylindrical specimens that were used for thefatigue experiments. The geometry of the test specimenswas chosen according to ISO1352 (rotating bar bendingfatigue testing) so that the parts could be subjected tofluctuating bending and torsion stresses in a multi-axialfatigue test rig designed at KU Leuven [15]. Using finiteelement analysis, the geometrical stress concentrationfactors were calculated to be 1.02 for the unnotched ge-ometry and 2.12 for the notched geometry.
2.2. Selective laser sintering
Selective laser sintering was used to produce 80 cylin-drical test specimens from semi-crystalline polyamide 12powder. To study the influence of the scanning direction onthe mechanical properties, two different orientations wereproduced. Both the notched and unnotched specimen ge-ometries were manufactured with longitudinal axis alongthe scan-direction (x) and with longitudinal axis perpen-dicular to the scan direction (x), as indicated in Fig. 4. In thefirst case (A), parts are built up layer by layer along the z-direction, and the scan direction corresponds with theloading direction. In the second case (B), parts are also builtup in the z-direction but the scan direction is perpendicularto the loading direction.
Table 1 shows the SLM process parameters used in aprevious study by Van Hooreweder and also used in thiswork [14]. With these parameters, high quality test speci-mens with absolute densities above 0.95 g/cm3 can beproduced and the results can be compared to previouswork. To minimize scatter in the mechanical properties, allthe specimens were manufactured using the same CO2-laser powered EOS P730 sinter station. Furthermore, allspecimens were built at the same location in the buildplatform to guarantee equal cooling conditions after the
Fig. 1. Overview of parameters influencing the fatigue life of SLS and IMcomponents. Fig. 2. SEM observation of PA12 powder particles.
B. Van Hooreweder et al. / Polymer Testing 32 (2013) 972–981 973
laser sintering. No treatment was applied after laser sin-tering and so the as-built material behavior is studied.
2.3. Injection molding
The same starting material has to be used to be able tostudy the influence of the manufacturing technique (SLMand IM) on themechanical fatigue properties. However, thepowder particles that are used for laser sintering are toosmall to use as starting material for injection molding. Toresolve this, cold isostatic pressing (CIP) was used to formlong cylinders of compressed PA12 powder at 3000 bar,which were then cut into smaller granules. These granuleswere dried prior to injection molding using hot air to avoiddeterioration of mechanical properties of the final productscaused by moisture in the starting material.
To produce specimens with identical geometry as theSLS specimens, a new injection mold was designed asindicated in Fig. 5. The following measures were taken toimprove the quality of the end-product.
! Notched and unnotched specimens are produced fromone unique mold to minimize differences in surfacequality. Since the cavity of the notched specimens (B) is
smaller than the cavity of the unnotched specimens (H),both cavities cannot be filled at the same time. There-fore, an adjustable insert (E) is used to route the plasticto one of the two cavities.
! To avoid weld lines in the critical section in the middleof the specimens, a side gate (C) is used such that theplastic first stops against the edge of the specimen andthen gradually fills the cavity.
! Air vents (A) are located at the end of the cavities torelease trapped air.
! The injection and ejection mold are equipped withpreheating channels (G) to avoid large temperaturegradients in the injected plastic.
! Moldflow was used to numerically simulate the injec-tion molding process. Based on this simulation, thelocation of runners and gate was optimized and theprocess parameters were determined.
Finally, the specimens are produced using an EngelES200/35 HL injection molding machine with process pa-rameters as indicated in Table 2. No treatment was appliedafter the injection molding and so the as-molded materialbehavior is studied.
3. Experimental setup
3.1. Fatigue analysis
A closed loop servo-hydraulic test rig was used to applya fluctuating tension/compression load to the specimens.No mean stress was applied (R " #1). For the temperaturemeasurements, two devices were used: a thermocouple
Fig. 3. Geometry of the notched and unnotched cylindrical test specimensin PA12.
Fig. 4. Scan direction for the SLS specimens, SLS-x (A) and SLS-z (B).
Table 1Process parameters for selective laser sintering of PA12 powder.
Laser beam diameter 0.65–0.7 mmParticle diameter 60–90 mmPowder bed temp. 170 $CFrame temp. 140 $CLayer thickness 0.12 mmEnergy density 0.031 J/mm2
Cooling time 12 h
Fig. 5. Injection mold with air vents (A), cavity for notched geometry (B),gate (C), runner (D), adjustable insert (E), sprue (F), mold preheatingchannels (G), cavity for unnotched geometry (H).
B. Van Hooreweder et al. / Polymer Testing 32 (2013) 972–981974

and an “EasIR-9” infrared camera. The thermocouple wasattached to the critical area of the test specimen. Thethermal camera was used to monitor the heat dissipationduring testing.
The results of tensile tests were used to determine thefirst stress amplitude for fatigue testing at 60% of the UTS.At least 15 specimens were used for every Wöhler-curve.All tests were performed with fixed stress amplitude and afixed test frequency of 3 Hz. No artificial cooling wasapplied. The fatigue tests were performed in a conditionedtest labwith room temperature of 20.8! 0.3 "C and relativehumidity of 50 ! 5%. To obtain reproducible results, thespecimens were stored for 48 h in the conditioned roombefore testing. Careful attention was given to a properalignment of the test specimens in order to avoid secondarybending stresses.
3.2. Thermal analysis
Differential Scanning Calorimetry (DSC) tests were car-ried out using 6 ! 0.5 mg of material cut from the side andfracture surfaces of SLM and IM parts. The starting powderand the granulate for injection molding were subjected to atemperature scan from #30 "C to 300 "C and back with aheating and cooling rate of 10 "C/min.
3.3. Microstructural analysis
To analyze the microstructure and local density of IM-and SLS-parts, 10 mm long sections were cut from thespecimens and mounted using a cold-setting resin. Wetgrinding was then used with 240 to 1200-grit papers fol-lowed by automatic diamond polishing with 3 mm paste ona synthetic cloth. A Philips reflected light microscope wasused to study the number and distribution of pores in thesecross-sections. The crystal structure was also analyzedusing a Siemens D500 X-ray diffractometer at room tem-perature with nickel filtered Cu-Ka radiation of wavelength0.154 nm and a reflection angle ranging from 4" to 55".
4. Test specimen properties
Although the same raw material is used for themanufacturing of selective laser sintered and injectionmolded specimens, the material structure and the materialquality is not the same. This leads to different failuremechanisms and different mechanical properties. To facil-itate improved understanding of this difference in me-chanical properties and fatigue behavior of SLS and IM
specimens, the specimen quality and material structurewas studied as described below. Table 3 summarizes themost important results.
4.1. Dimensions
The actual dimensions of all the test samples weredetermined using a light microscope. The critical diameterand notch radius are most important since they determinethe region where fatigue failure will occur. The measure-ments show a deviation from the desired values (Ref. inTable 3) which is taken into account when calculating thestress in the cross-sections. By doing so, the variation of thecross-sectional dimensions of SLSx, SLSz and IM specimenswill not influence the results of the fatigue experiments.Specimens produced with the same manufacturing tech-nique show minimal variation in dimensions.
4.2. Density
It is well known that the density of selective laser sin-tered and injection molded components has an importantinfluence on the mechanical properties [15,16]. Regions inthe material which are not fully dense have a lower mass/volume ratio leading to lower absolute strength and stiff-ness. Pores may also act as stress concentrators, leading tocrack initiation and failure. Even with measures to avoidpores in the material, it is very difficult to produce partswith exactly the same density. During sintering, parts in themiddle of the platformwill experience a lower cooling ratethan parts on the outside of the platform. This in one reasonfor the variation in quality that is inherent in the SLSprocess.
The global density of all the test specimens was deter-mined using accurate measurements of the geometry andmass. The average results of these measurements for all theSLS-x, SLS-y and IM specimens are summarized in Table 3.Because of the optimized process parameters for both SLSand IM, all the samples have high global densities and thereis only a small difference in global density between IM-parts and SLS-parts. The material density of the IM-partsis, however, not uniform over the longitudinal directionof the specimens. The size, number and distribution ofpores in the test specimens were analyzed using opticallight microscopy and digital image processing. Fig. 6 showsthe results of these techniques applied to a cross-section ofa SLSx part. First, the complete cross-section is put togetherby overlapping 8 separate images from the microscope.
Table 2Process parameters for injection molding of PA12 granules.
Mould temperature 60 "CNose temperature 230 "CHopper temperature 40 "CInjection pressure 50 barInjection speed 60 mm/sHold pressure 10 barHold time 3 sCooling time 30 s
Table 3Properties of SLS and IM specimens in PA12.
Parameter Unit Ref. SLSx SLSz IM
Critical diameter mm 7.35 7.49 ! 0.11 7.41 ! 0.14 7.10 ! 0.05Notch radius mm 1.20 1.16 ! 0.22 1.07 ! 0.14 1.22 ! 0.17Global density g/cm3 – 0.97 ! 0.01 0.98 ! 0.01 0.99 ! 0.01Max. local density g/cm3 – 0.97 0.98 1.03Ra-value mm – 15 18.5 0.7Melting temp. "C – 179 179 186Crystallinity % – 28 28 25Crystal structure – – a $ g form a $ g form g form
B. Van Hooreweder et al. / Polymer Testing 32 (2013) 972–981 975

Then, software is used to apply a Black/White threshold andto filter out the remaining scratches that occurred fromgrinding and polishing. In a final step, the percentage ofblack pixels is determined and the size and distribution ofthese black pores is studied.
For the SLSx and SLSz specimens, irregular pores withlengths ranging from 10 mm to 200 mm are found to berandomly spread over the cross-section. Furthermore, testson different cross-sections indicate that pores in SLSx andSLSz parts have the same distribution and size over thewhole length of the specimens. This is validated by deter-mining the global density of a specimen based on calcula-tions of the percentage of pores in one cross-section. InFig. 6, there are 95.3% white pixels and the density of 100%dense PA12 equals 1.03 g/cm3. Assuming a uniform distri-bution of pores over the length of the specimen, the globaldensity can then be calculated as 0.953! 1.03 which equals0.982 g/cm3. This is very close to the measured density of0.98 g/cm3.
For the IM specimens, a non-uniform density distribu-tion is observed. Near the end of the specimens, large poresof 800 mm diameter are found that are caused by a blockedair vent in the injection mold. The rest of the IM-parts,including the critical section for fatigue failure, are foundto be fully dense (1.03 g/cm3).
4.3. Surface roughness
The surface roughness was determined with a Taylor-Hobson Form Talysurf-120L apparatus. A measuring probewith radius of 2 mm was used to scan a straight track of35 mm in the longitudinal direction at 0.5 mm/s. Specialcare was taken to limit the measurement force.
The surface roughness (Ra) measurements indicate avery smooth surface for the IM-parts, which is caused bythe fine surface quality of themold and the shrinkage of thematerial after injection. The surface of the SLM-parts isrougher because of the layer-wise production technique.After scanning the final contour of each layer, unmoltenpowder particles will stick to this contour leading to aporous outer material layer. Furthermore, the parts withscanning direction perpendicular to the loading direction(B in Fig. 3) have a slightly rougher surface then the parts
with scanning direction parallel to the loading direction (Ain Fig. 3). In the first case (B), the roughness is measuredover different layers while in the second case (A) theroughness is measured over the contour of one layer.
The difference in surface roughness between IM- andSLS-parts will have a negligible influence on the mechan-ical properties that are analyzed in this work because thespecimens are loaded in tension/compression and previousresearch has shown that cracks initiate from pores or ma-terial imperfections in the specimens rather than from thesurface [14]. This is in accordance with a recent study byBlattmeier et al. on the influence of surface characteristicson fatigue of SLS parts [17].
4.4. Microstructure
DSC was applied to study temperature transitions,melting range and degree of crystallinity of the SLS and IMspecimens. Generally, all the DSC-curves follow the sameshape showing three distinct features: (i) a small dent closeto 50 "C indicating the glass transition temperature, (ii) anegative peak in the melting region between 177 "C and186 "C and (iii) a positive peak close to 157 "C indicating thesolidification region. Since all the examined specimensyield approximately the same DSC-curves, only one regionof interest between 160 "C and 200 "C is plotted in Fig. 7,showing the average melting behavior of the powder andmaterial taken from IM and SLS specimens.
The area of the melting peaks represents the heat ofmelting in J/g. The percentage of crystallinity (C%) of thesemi-crystalline PA12 material can then be expressed asshown in Formula 1 [12], where the heat of melting for a100% crystalline specimen of SLS-PA12 equals 209.3 J/gaccording to Gogolewski et al. [18].
C% # Heat of melting sample$ %Heat of melting 100% crystalline specimen$ %
(1)
The powder and the granulate show exactly the samecurve with melting temperature (Tm) of 186.23 "C andcrystallinity (C) of 45%. This corresponds very well with thefindings of Savalani, M.M (Tm # 187.26 "C) [19]. Further-more, this indicates that the production technique to
Fig. 6. Size and distribution of pores in the cross-section of a SLSx specimen.
B. Van Hooreweder et al. / Polymer Testing 32 (2013) 972–981976

manufacture granulate from PA12 powder did not changethe thermal properties of the PA12 material.
Analyzing fatigue loaded or original specimen materialdoes not yield different values for the measured meltingtemperature or crystallinity. This means that fatigue testingdoes not have a permanent influence on the material’sdegree of crystallinity and thermal properties. However,during fatigue testing, the amorphous regions in the poly-mer will stretch and elongate and the specimen tempera-ture will rise above the glass transition region. This cancause the crystal structure to change from g-form to a-form, as described in the next section. After fatigue testing,the temperature will decrease and the original crystalstructure reforms.
Fig. 7 indicates a distinct difference in melting temper-ature and crystallinity between powder, SLS and IM mate-rial. This difference is clearly caused by the thermal historyof the material. The IM material was fully molten justbefore injection and then cooled rapidly after ejection. Thisrapid cooling allows less crystal growth, and hence rela-tively low crystallinity is observed. The SLS material wasalso fully molten during laser sintering but the cooling rateafter processing is much lower, which allows the moleculesenough thermal mobility to transform to a more crystallinestructure.
Another interesting feature in the DSC-curves of someSLS samples is the small additional peak with minimum at186 !C, which corresponds to the melting temperature ofthe PA12 powder. This additional peak was previouslyanalyzed by Zarringhalam and Hopkinson, who found thatthe microstructure of an SLS part consists of fully moltenparticles and unmolten particle cores surrounded byspherulites [12]. These unmolten powder particles have thesame melting temperature as the original powder, causingthe additional small peak at 186 !C. The results of the DSC-experiments in this study are in correspondence with thattheory. However, most of the DSC samples from SLS spec-imens indicate fully molten material. Furthermore, it isimportant to note that special care should be taken to useDSC samples that actually represent the cross section of thematerial. Samples taken from the surface will also indicate
this small additional peak at Tm and increased crystallinity.This is, however, caused by the partially molten powderparticles that are attached to the outer surface layer afterfinal contour scanning, and that are not representative ofthe average properties of the specimen.
Once above the melting temperature, the ‘memoryeffect’ in the material is destroyed. The heat flow curvesof all the specimens coincide and no temperature differ-ence is seen on reaching the solidification temperature of157 !C.
4.5. Crystal structure
The crystal structure of polyamides has been deeplystudied and is known to be in the so-called a and g-forms.The a-form consists of a monoclinic or triclinic lattice withchains in fully extended planar zigzag arrangementwhereas the g-form is a pseudo-hexagonal packing of 21chains [6,20].
Atkins found that the a-form transforms to the g-formwhen heated to Tm. This pseudo-hexagonal phase can thenbe ‘frozen’ by rapid cooling conditions [21]. If these crystalsare heated above Tg, they revert to the monoclinic phaseand, if temperature is increased further, the structure willstart to transform again to the pseudo-hexagonal phase.
In this work, X-ray diffractions were taken from thePA12 powder and from notched and unnotched SLS and IMparts. The radiation was detected in the range of 4–50 de-grees. Fig. 8 presents the results of these tests. It was foundthat the notched and unnotched specimens all show thesame trend as well as the SLSx and SLSz parts. Furthermore,a small reflection peak was detected at 5.6 degrees for allthe measurements. Distinct crystalline peaks are seen inthe region between 20 and 24 degrees, which is shownmore in detail in Fig. 9. The PA12 powder shows tworeflection peaks, which is in accordance with similar ex-periments by Salmoria et al. [6] The first peak at 21.2! in-dicates the g-crystalform (100) and the second peak at22.2! indicates the a-crystalform (010/110) [6]. After laser
Fig. 7. DSC curves for IM, SLSx and SLSz material. Fig. 8. X-ray diffractograms for PA12 powder, SLS-PA12 and IM-PA12.
B. Van Hooreweder et al. / Polymer Testing 32 (2013) 972–981 977

sintering, the g-form is more pronounced but the a-crys-talform is still present. After injection molding, the rapidcooling conditions caused the material to crystallizeexclusively in the g-form.
In general, the XRD measurements indicate a small dif-ference in crystal structure between SLS and IM partscaused by the slow cooling (12 h) of the SLS specimenscompared to the rapid cooling (30 s) of the IM specimens.Furthermore, it is interesting to note that the crystalstructure can change during fatigue testing. In the followingsection it is shown that the specimen temperature risesabove the glass transition region. Consequently, the g-formcan transform to the a-form. This crystalline transitionunder increased temperature and uni-axial loading maycause a shift of the molecular chains in a preferentialorientation, leading to improved fatigue resistance.
5. Mechanical properties
5.1. Tensile tests
To determine appropriate stress levels for the fluctuatingload, tensile tests were performed on the unnotched speci-mens made by IM and SLS. The results of these tests aresummarized in Table 4. The following phenomena are noted.
! There is only a small difference in ultimate tensilestrength (UTS) between all the specimens.
! The difference in fracture strain and modulus of elas-ticity clearly shows that SLS parts are more brittle thenIM parts. This is also visible by examining the fracturesurfaces of the specimens. For the SLS-parts, the fracturesurface is flat and perpendicular to the loading direction.
For the IM-parts, necking and strain hardening occursleading to an irregular and elongated fracture surface.
! SLS-x and SLS-z parts show similar values for tensilestrength and modulus of elasticity. The fracture strainhowever is much lower for the SLS-z parts. This in-dicates that for quasi static loading, interlayer fracture(between two successive layers) is more brittle thenintralayer fracture (within the layers).
To analyze the notch-sensitivity, tensile tests were per-formed on the notched samples. It was found that thenotched specimens reach higher UTS than the unnotchedtest specimens, as shown in Fig.10 at 100 cycles. This effect isparticularly shown in IM specimens,with an increase in UTSfrom 53 MPa to 62 MPa. This effect is attributed to notchstrengthening, i.e. increasing load carrying capacity of thenotched area after local yielding. Voids will nucleate in thelocalized plastic zone near the notch when the stress isincreased further. This will eventually lead to crazing andmacroscopic brittle failure perpendicular to the loadingdirection.
5.2. Fatigue tests
The results of the fatigue experiments are presented inFig. 10 as seven SN-curves on a semi-logarithmic scale. Thefour Wöhler curves of the unnotched (UN) specimens canbe found at the bottom of Fig. 10. Also, the fatigue resultsfrom a previous study by the authors (UN_Ref. in Fig.10) arefound in this region [14]. The variation between these linesis limited, indicating the similar fatigue life of the SLSx,SLSz and IM specimens at given stress amplitude. Thisshows that the SLS parts have equal intra- and interlayerfatigue strength, and that the small differences in crystalstructure, crystallinity, surface roughness and density be-tween SLS and IM parts does not affect the fatigue failure ofthe unnotched samples. The SN-lines also converge to aclear endurance limit around 18 MPa.
It is remarkable that the pores in the unnotched SLSparts, as shown in Fig. 6, do not have a more pronouncednegative impact on the fatigue life. When loaded, theporous material will deform and microvoid coalescenceoccurs. However, this does not lead to rapid crack initiationand crack propagation as expected. The fracture mecha-nism is somehow delayed. Because of the high molecularmobility, resulting from the high local cyclic stresses nearthe pores or initial cracks, the inner material temperatureincreases. This temperature effect leads to three possiblephenomena delaying fatigue failure initiated from pores inthe material.
! A local melt zone is formed, leading to stabilization ofcrack growth.
! Above the glass transition temperature, relative slidingbetween chain molecules occurs. Amorphous polymerchains are stretched and elongated, allowing moreelasticity.
! The increased temperature alters a transformation ofthe crystal structure from the g-form to the a-form. Thiscan cause a shift of themolecular chains in a preferentialorientation leading to improved fatigue resistance.
Fig. 9. Detail of X-ray diffractograms for 20"<2q > 25" .
Table 4Results of tensile tests on unnotched SLS and IM parts in PA12.
Parameter Unit SLSx SLSz IM
UTS MPa 52 49 53E-modulus MPa 2080 2158 17013-fracture % 7 4 97
B. Van Hooreweder et al. / Polymer Testing 32 (2013) 972–981978

Eventually, cracks will grow and extensive yielding oc-curs, leading to ductile fatigue failure. In general, the fa-tigue tests resulted in ductile fracture surfaces with semi-spherical depressions for the unnotched specimens andbrittle fracture surfaces for the notched specimens. Thisindicates the reduced ductility near the notch caused by thepresence of a complex triaxial stress field and steep stressgradient. The three Wöhler curves for the notched (N)specimens are shown at the top of Fig. 10, indicatingimproved fatigue resistance compared to the unnotchedspecimens. This is attributed to the notch strengtheningthat was also observed during tensile testing.
5.3. Hysteresis
It is clear that fatigue failure is caused by a combinationof mechanical and thermal loading. Since no artificialcooling was applied and a fixed test frequency of 3 Hz wasused, the temperature rise in the material plays an impor-tant role in the fatigue life of all the test specimens. Duringfatigue testing, the surface temperaturewasmeasuredwitha thermocouple. For the notched specimens, an infraredcamera was used to measure the temperature in the root ofthe notch during fatigue loading. No noticeable differencewas detected in temperature behavior of SLS and IMspecimens. Fig. 11 shows the increase in maximum surfacetemperature for a notched specimen measured with the IR-camera as a function of time. Initially, a linear increase insurface temperature is seen, as indicated by the trend linein Fig. 11. Starting from 34 !C, there was rapid growth intemperature followed by final failure. After failure, a tem-perature of 130 !C was recorded which is the average innermaterial temperature measured on the fracture surface.Measurements on unnotched specimens show a verysimilar temperature-time history. When the local stressamplitude is lower that the endurance limit, quasi-isothermal conditions occur and the specimens endure atleast 106 load cycles.
A convenient way to analyze the thermo-mechanicalbehavior of the fatigue loaded nylon specimens is to plotthe stress as a function of strain for each load cycle. Fig. 12shows three of these typical hysteresis loops taken from a
notched IM specimen. For the sake of clarity, only the first,middle and final load cycle were plotted.
If the temperature of the semi-crystalline PA12 reachesthe glass transition region (23.5–55!), the amorphouspolymer chains will soften [14]. As a result, these chainswill reorient themselves (crystallization) and by doing sothe stiffness will decrease, leading to larger deformations atthe same stress level. This is clearly visible on the decreasedslope of the hysteresis loop measured just before fatiguefailure. Furthermore, the origins of these curves have shif-ted to the right, indicating that there is a continuous in-crease of strain in time when loading at constant stressamplitude. This behavior is called cyclic creep or ratcheting.
The areawithin these hysteresis loops equals the energyloss during a given load cycle. For the notched specimens,this energy loss is small during the first load cycles and thehysteresis loop is almost a straight line. In the middle of thefatigue life of the specimens, a small amount of energy lossis seen. When the temperature exceeds the glass transitionregion, the molecular mobility grows, causing more dissi-pated energy in the form of heat, as indicated by the areawithin the final hysteresis loop.
Fig. 10. SN fatigue curves for notched (N) and unnotched (UN) SLS and IM specimens.
Fig. 11. Temperature accumulation of the outer material surface during fa-tigue testing of a notched injection molded specimen.
B. Van Hooreweder et al. / Polymer Testing 32 (2013) 972–981 979

The total energy loss per unit of volume during one fa-tigue cycle can be calculated using the stress amplitude(sa), the strain amplitude ( 3a) and the phase difference (d)between stress and strain, as indicated in Formula 2. Bymultiplying by the test frequency (f), the total power lossper unit of volume and per fatigue cycle is determined, asshown in Formula 3. This power loss is expressed in W/m3
and can be partitioned into heat transfer (PHT), sampleheating (PS) and sample fracture (PF), as indicated inFormula 4.
DD ! p" sa " 3a " sin d (2)
D#D ! f " p" sa " 3a " sin d (3)
D#D ! PHT $ PS $ PF (4)
The heat transfer can then be partitioned into conduction(Pk), convection (Ph) and radiation (Pz), as shown inFormulas 5–8. The heat transfer coefficients k, h and z forconduction, convection and radiation were determinedusing Dubbel’s work to be 0.25 W/mK, 7.28 W/m2 K, and5.67 E%8 W/m2 K4, respectively [22]. All the required tem-peratureswere determined using the thermocouple and IR-camera during fatigue testing.
PHT ! Pk $ Ph $ Pz (5)
Pk ! k$AV
" dTdx
(6)
Ph ! h$AV
" &T0 % TN' (7)
Pz ! z$AV
" &T40 % T4
2' (8)
The power to heat the specimen is determined usingFormula 9 with an average density (r) of 1030 kg/m3 andspecific heat capacity (Cp) of 1700 J/kgK [22]. The requiredtemperature-time data was taken from the IR-camerameasurements.
PS ! r" Cp "DTDt
(9)
By determining the total power dissipation from thehysteresis loops and after solving Equations 5–9 for powerdissipated by heat transfer, the unknown power needed forcrack growth (PF) can be calculated using Formula 4. For thenotched IM specimen with temperature-time data shownin Fig. 11, and three hysteresis loops shown in Fig. 12, thetotal dissipated power equals 0.22 W/cm3, 0.28 W/cm3 and1.5 W/cm3, respectively. During the first load cycles, all thedissipated power is transformed into heat (PHT and PS). Inthe middle of the fatigue life of the specimens, 5.6% of thetotal dissipated power is used for fracturing the specimen(PF). During the final load cycle, PF equals 8% of the totaldissipated power. Calculations for other specimens indicatethe same trend which indicates that the PA12 specimenscan clearly absorb a substantial amount of energy withoutfracturing. Further work is needed to determine the heattransfer coefficients with higher accuracy so that PF can beused to validate fracture theories.
6. Conclusions
A study was made of the fatigue properties of as-builtnylon parts produced by selective laser sintering (SLS) andinjection molding (IM). Both notched and unnotched speci-mens were produced starting from one unique batch ofsemi-crystalline polyamide 12. The material quality of thesespecimens was carefully examined and found to be accept-able for the use in various functional applications. To studyand understand the acting failure mechanisms, the thermalproperties, microstructure and hysteresis behavior wasanalyzed. The most important conclusions of this work aresummarized below.
# The fatigue failure of all the specimens is controlled bycyclic mechanical loading in combination with temper-ature effects.
# The building direction of the selective laser sinteredparts has negligible influence on the fatigue properties,the density, the degree of crystallinity and the crystalstructure of the samples examined in this study. Thisindicates that quasi-full powder melting occurredleading to equal inter- and intra-layer fatigue strength.
# Despite the observed difference in facture strength,material density, crystallinity and surface roughness, theinjection molded and selective laser sintered sampleshave similar fatigue properties. Furthermore, all the SN-curves converge to a clear endurance limit >18 MPa.This indicates acceptable fatigue resistance for thenotched and unnotched selective laser sintered com-ponents in PA12 given the applied test conditions andwithout the use of artificial cooling.
# Future work is needed to study the impact of the testspecimen geometry and temperature/frequency effects
Fig. 12. Hysteresis loops for a notched injection molded specimen duringthe first, middle and final load cycle.
B. Van Hooreweder et al. / Polymer Testing 32 (2013) 972–981980

on the failure mechanisms and fatigue properties ofboth notched and unnotched components.
Acknowledgements
This research is funded by a Ph.D grant of the Institutefor the Promotion of Innovation through Science andTechnology in Flanders (IWT-Vlaanderen). The authorswould also like to acknowledge Toon Roels from Materi-alise for valuable discussions on material properties andthe production of SLS-PA12 test specimens.
References
[1] L. Lü, J. Fuh, Laser-induced Materials and Processes for Rapid Pro-totyping, Kluwer, London, 2001.
[2] R. Noorani, Rapid Prototyping: Principles and Applications, Wiley, 2005.[3] R.D. Goodridge, C.J. Tuck, R.J.M. Hague, Laser sintering of polyamides
and other polymers, Prog. Mater. Sci. 57 (2) (2012) 229.[4] G.V. Salmoria, J.L. Leite, Selective laser sintering of PA12/HDPE
blends: effect of components on elastic/plastic behavior, Polym.Test. 27 (2008) 654.
[5] M. Campbell, Performance of CF/PA12 composite femoral stems, J.Mater. Sci. Mater. Med. 19 (2008) 683.
[6] G.V. Salmoria, J.L. Leite, R.A. Paggi, The microstructural character-ization of PA6/PA12 blend specimens fabricated by selective lasersintering, Polym. Test. 28 (7) (2009) 1.
[7] G.V. Salmoria, J.L. Leite, R.A. Paggi, Selective laser sintering of PA12/HDPE blends: effect of components on elastic/plastic behavior,Polym. Test. 27 (2008) 654.
[8] G.V. Salmoria, J.L. Leite, Rapid manufacturing of PA/HDPE blendspecimens by selective laser sintering: microstructural character-ization, Polym. Test. 26 (2007) 361.
[9] P. Marcelis, Control of Selective Laser Sintering and Selective LaserMelting Processes. PhD Thesis, KU Leuven, Belgium, 2007.
[10] P. K Jain, P.M. Pandey, P.V.M. Rao, Effect of delay time on partstrength in selective laser sintering, Int. J. Adv. Manuf. Technol. 43(2009) 117.
[11] A. Becker, J.R. Grez, Elastic tensor stiffness coefficients for SLS Nylon12 under different degrees of densification as measured by ultra-sonic technique, Rapid Prototyping J. 14 (5) (2008) 260.
[12] H. Zarringhalam, N. Hopkinson, Effects of processing on micro-structure and properties of SLS Nylon 12, Mater. Sci. Eng. A 435(2006) 172.
[13] B. Caulfield, P.E. McHugh, S. Lohfeld, Dependence of mechanicalproperties of polyamide components on build parameters in the SLSprocess, J. Mater. Process. Tech. 182 (2007) 477.
[14] B. Van Hooreweder, Microstructural characterization of SLS-PA12specimens under dynamic tension/compression excitation, Polym.Test. 29 (2010) 319.
[15] B. Van Hooreweder, Design and simulation of a novel multi-axialfatigue test rig, Exp. Mech. 52 (2012) 513.
[16] J.P. Kruth, in: Proceedings of the 3rd International Conference onPolymers and Moulds Innovations, Gent, 2008, pp. 15–30.
[17] M. Blattmeier, G. Witt, J. Wortberg, J. Eggert, J. Toepker, Influence ofsurface characteristics on fatigue behavior of laser sintered plastics,Rapid Prototyping J. 18 (2) (2012) 161.
[18] S. Gogolewski, K. Czerniawska, M. Gasiorek, Effect of annealing onthermal properties and crystalline structure of polyamides, Prog.Colloid Polym. Sci. 258 (1980) 1130.
[19] M.M. Savalani, Selective Laser Sintering of Hydroxyapatite-polyamide Composites. PhD Thesis, Loughbourough University,Leeds, UK, 2006.
[20] C.E. Fernandez, Compared structure and morphology of nylon-12and 10-polyutherane lamellar crystals, Polymer 52 (2011) 1515.
[21] E.D.T. Atkins, Structural and morphological investigations of nylon 8chain-folded, lamellar crystals, Polymer 36 (1) (1995) 35.
[22] H. Dubbel, W. Beitz, B.J. Davies, Handbook of Mechanical Engi-neering, Springer, London, 1994.
B. Van Hooreweder et al. / Polymer Testing 32 (2013) 972–981 981