Embed Size (px)
Citation preview

107
ABSTRACT – The SIMon (Simulated Injury Monitor) software package is being developed to advance the interpretation of injury mechanisms based on kinematic and kinetic data measured in the advanced anthropomorphic test dummy (AATD) and applying the measured dummy response to the human mathematical models imbedded in SIMon. The human finite element head model (FEHM) within the SIMon environment is presented in this paper. Three-dimensional head kinematic data in the form of either a nine accelerometer array or three linear CG head accelerations combined with three angular velocities serves as an input to the model. Three injury metrics are calculated: Cumulative strain damage measure (CSDM) – a correlate for diffuse axonal injury (DAI); Dilatational damage measure (DDM) – to estimate the potential for contusions; and Relative motion damage measure (RMDM) – a correlate for acute subdural hematoma (ASDH). During the development, the SIMon FEHM was tuned using cadaveric neutral density targets (NDT) data and further validated against the other available cadaveric NDT data and animal brain injury experiments. The hourglass control methods, integration schemes, mesh density, and contact stiffness penalty coefficient were parametrically altered to investigate their effect on the model’s response. A set of numerical and physical parameters was established that allowed a satisfactory prediction of the motion of the brain with respect to the skull, when compared with the NDT data, and a proper separation of injury/no injury cases, when compared with the brain injury data. Critical limits for each brain injury metric were also established. Finally, the SIMon FEHM performance was compared against HIC15 through the use of NHTSA frontal and side impact crash test data. It was found that the injury metrics in the current SIMon model predicted injury in all cases where HIC15 was greater than 700 and several cases from the side impact test data where HIC15 was relatively small. Side impact was found to be potentially more injurious to the human brain than frontal impact due to the more severe rotational kinematics.
KEYWORDS – Head Injury Biomechanics, Human Head Modeling, Finite Element Analysis, Analytical Modeling of Brain Injuries.
__________________________________
INTRODUCTION
In the United States, motor vehicle crashes are the number one cause of injury death for people aged 1 to 34. (CDC, 2003) Head injuries sustained during these crashes can result in a traumatic brain injury (TBI) and have devastating consequences to human health. Every year in the U.S., 1.5 million people suffer a TBI; this is eight times more than will be diagnosed with breast cancer and thirty-four times more than will be diagnosed with HIV/AIDS. Of these 1.5 million people, 50,000 will die and another 80,000 to 90,000 will have long-term injuries (CDC, 2003). For a single year, the cost of these injuries has been estimated at $56.3 billion dollars (Thurman,
2001). Given these facts, understanding and preventing head injuries should be a primary concern to the automotive community.
Various methods and techniques have been employed over the years to understand the mechanisms and thresholds for these injuries. Among them are animal tests (Meaney et al., 1993; Gennarelli et al., 1982a; Stalnaker et al., 1977; Ono et al., 1980; Abel et al., 1978; Nusholtz et al., 1984) and cadaver studies (Hodgson et al., 1966, Yoganandan et al, 1995, Hardy et al., 2001). Computational models of the head have also been used to further the understanding of underlying injury mechanisms in the brain (Ruan et al., 1993; Bandak and Eppinger, 1995; Bandak et
2003-22-0007Stapp Car Crash Journal, Vol. 47 (October 2003), pp. 107-133
On the Development of the SIMon Finite Element Head Model
Erik G. Takhounts and Rolf H. EppingerNational Highway Traffic Safety Administration
J. Quinn Campbell and Rabih E. TannousAASA, Inc.
Erik D. Power and Lauren S. ShookGESAC, Inc.
__________________________________
StappCar CrashJournal

108 Takhounts et al. / Stapp Car Crash Journal 47 (October 2003) 107-133
al., 2001; Zhang et. al., 2001; Kleiven and Hardy, 2002).
The SIMon finite element head model (FEHM) is a new tool being developed to assess the potential of traumatic brain injury in car crashes. This paper introduces the concept of the simulated injury monitor in which kinematic data measured by an advanced anthropomorphic test dummy (AATD) is applied to a finite element model of the head and estimations of three different forms of brain injury are predicted using the three injury metrics (CSDM, DDM, and RMDM). To make the concept of predicting injury a viable and useful process, it was decided that the complexity of the finite element model should be reduced to represent only the essential components of the head. This approach allows for a simulation of a typical impact event within a reasonable amount of time on a personal computer without sacrificing the accuracy of the injury prediction. To meet this goal, the model was designed to be able to simulate the brain’s response to an impact event of up to 150 milliseconds within 2 hours on a dedicated high-end PC.
To use the SIMon process, the kinematic data from a new or existing crash test is entered into SIMon. This data is then used to create load curves that drive the finite element (FE) model of the head. Once the calculations are complete, the model outputs a value for each injury metric. These values are evaluated against the critical value for each injury metric to predict if an injury has occurred. If a critical value is exceeded, then an injury is assumed to have occurred.
Development and evaluation of the model’s responses are presented, along with those of the proposed brain injury metrics. Numerical issues faced in the development of the model, such as integration schemes, mesh density, and hourglass control methods, are also discussed. Finally, the performance of the model’s injury metrics is evaluated against existing head injury criteria using tests available in the NHTSA database.
METHODS
Model Configuration
The SIMon FEHM is based on the model originally developed by DiMasi et al. (1995a) and later improved by Bandak and Eppinger (1995) and Bandak et al. (2001). It consists of the rigid skull, the dura-CSF layer, the brain, the falx cerebri, and the bridging veins. This simplicity has several advantages. First, it reduces the complexity of the problem being addressed, both in terms of the
number of equations being solved and the necessary run time. The second advantage is that, because the model does not contain any specialized structures of the brain, it can be generalized to other cases and can be scaled independently in three dimensions. This flexibility allows for the use of additional data, such as the animal injury data presented in this paper, in its evaluation.
While the basic model is similar, there are several differences between the SIMon FEHM and that presented in Bandak et al. (2001). These include: 1. The lower brain surface has been rounded off
(Figure 1) to reduce the stress concentration at the corner elements
2. The material properties used for the brain tissue have been updated to reflect the latest experimental data
3. The hourglass control method has been changed to improve the brain’s response
4. The contact interface has been changed to a soft tiebreak interface.
Each of these changes will be discussed in more detail in the methods section. The current version of the FEHM represents the head of a 50th percentile male and has a total mass of 4.7 kg. Of this, 1.5 kg comprises the mass of the brain itself. It is built with 10475 nodes and 7852 elements (7776 hexagonal solid and 76 beam elements). Of the hexagonal solid elements, 49% belong to the non-deformable rigid skull, 10% to the dura-CSF layer, 6% to the falx cerebri, and 35% to the brain. The 76 beam elements are used to represent the bridging veins.

Takhounts et al. / Stapp Car Crash Journal 47 (October 2003) 107-133 109
d)c)
Falx Cerebri
Brain
Dura-CSF
Skull
Bridging Veins
b)a)
Figure 1. Current version of SIMon finite element head model a, c) with rounded lower brain versus older version b, d) with flat lower brain.

110 Takhounts et al. / Stapp Car Crash Journal 47 (October 2003) 107-133
As stated previously, the brain regions being modeled have been simplified in order to generalize the model and to meet the run time constraint of two hours. Seen here in Figure 1, the region under the brain and the tentorium was approximated as a continuation of the dura-CSF layer and did not account for either the cerebellum or the midbrain. In addition, the surface of the brain was taken to be coincidental with the inner surface of the dura-CSF layer. It must also be noted that the dura-CSF layer (structurally representing the dura mater, arachnoid trabeculae, CSF, and pia mater), and particularly the falx cerebri, are assumed to have an average thickness of 7 mm, larger than physiologically observed. This was done to avoid using sharp elements at the tip of the falx and to soften the numerical contact interaction between the soft brain and rigid skull. In addition, the presence of this slightly compressible layer also allows for movement of the brain within the skull cavity to somewhat simulate the effect of the brain moving through the foramen magnum.
In the SIMon FEHM, the motion of an AATD head is applied to the model’s rigid skull. Then, the energy is transferred to the brain via contact algorithms that determine the appropriate surface forces between both the skull and dura-CSF layer and the dura-CSF and the brain. Since there is a large stiffness differential between the contacting bodies (the skull and brain), the contact forces had to be “softened” to avoid excessive distortions of the softer boundary elements. This softening of the contact forces may result in some degree of penetration between the contacting bodies, and a relatively high contact energy compared to the deformation energy of the softer body. The penetration penalty scaling factor was therefore modified to increase the stability of the model without allowing for excessive penetrations between the contacting bodies.
The contact interface was also adjusted to allow for the simulation of cavitation within the brain. This phenomenon occurs when vapor pockets form and collapse in regions of very low pressure. This can happen along the boundary between the skull and the brain when fluid is vaporized under large accelerations (>150g). To account for this, a “tie-break” interface (Bandak and Eppinger, 1995) was implemented to model the effect of fluid vaporization along the boundary.
A soft tie-break formulation was selected to model the skull to dura-CSF and the dura-CSF to brain contact interactions. The lower part of the brain geometry was also modified to improve stability of the contact interactions.
The following sections cover the studies performed to determine the model parameters. These include the material properties, the mesh density, and the hourglass control methods. All of these parameters were examined to determine their effect on the model’s performance and to select the optimum values for the SIMon FEHM.
Development of the Model’s Physical Parameters
In the model, the skull was assumed to be rigid, whereas the rest of the structures were considered as deformable, linear viscoelastic, isotropic, and homogeneous. To test the types of material formulation and properties of brain tissue that might be appropriate for the model, each material type was benchmarked against the neutral density targets and animal injury data. First, a Kelvin-Maxwell linear viscoelastic formulation [Eq. 1] was used in which the short-term shear modulus G0 was varied from 1.0 kPa to 35 kPa, the long-term shear modulus in each case was assumed G∞ = G0/2, and the time constant was unchanged. Next, the brain tissue was assumed to be a nonlinear viscoelastic material. Several constitutive models available in LS-DYNA v.970 were used for the brain tissue, including Ogden rubber, Mooney-Rivlin rubber, and a quasi-linear viscoelastic material. The material constants for these nonlinear models were derived from Takhounts (1998). Unfortunately, a non-linear material model of brain tissue was not yet ready for use in the SIMon FEHM. This necessary substitution of a linear material model leads to some difficulties in simulating the response of the brain to all ranges of strains.
For this model, the material properties of brain tissue were selected to provide the “best fit” to the latest experimental response and injury data. Therefore, the brain was characterized as viscoelastic, having a shear behavior approximated by:
τt
eGGGtG−
∞∞ −+= *)()( 0 , (1)
where G0 is a short-term shear modulus, G∞ is a long-term shear modulus, and τ is a time constant. The values of the material constants for the brain tissue were chosen to be G0 = 10.3 kPa, G∞ = 5 kPa, and τ = 0.01 sec. These material shear constants are somewhat stiffer than those determined experimentally from tests on isolated tissue samples (Arbogast et al., 1995; Donnelly and Medige, 1997; Takhounts, 1998; Darvish and Crandall, 2001; Takhounts et al., 2003) for reasons described later in this paper. The bulk modulus of brain tissue was

Takhounts et al. / Stapp Car Crash Journal 47 (October 2003) 107-133 111
chosen to be 0.56 GPa to simulate its virtual incompressibility (Poisson’s ratio ν = 0.49999).
The stiffness of the linear elastic dura-CSF layer was also varied to investigate its influence on the brain model’s response and numerical stability. The dura-CSF layer and falx cerebri were modeled as elastic materials with an elastic modulus E = 3.4 MPa and Poisson’s ratio ν =0.45 (Bandak and Eppinger, 1995).
In addition to the brain and skull, the parasagittal bridging veins are also accounted for in the SIMon model. This was incorporated into the model to simulate the aggregate response of the bridging veins as a part of the brain’s response, i.e. to account for the tethering of the brain and skull. Seven pairs of bridging veins are modeled using beam elements with an elastic modulus of ~0.3 Mpa (41 psi) (Omori et al., 2000; Monson, 2001).
Model Validation
The displacement-time histories of brain particles – neutral density targets (NDTs) – taken at various locations within the cadaveric brain with respect to the skull (Hardy et al., 2001) comprised the major dataset used to tune the model response for the proper strain distribution within the brain. In the cadaveric head impact experiments conducted by Hardy et al. (2001), a high-speed biplanar X-ray system was used to collect the relative motion data of radio-opaque NDTs with respect to the skull. The translational and angular motion of the skull itself was measured using a nine-accelerometer array system. Three linear and three angular velocities of the center of gravity of the skull were then derived for a single NDT test and applied to the SIMon rigid skull as a prescribed boundary motion. The nodes in the model that were closest to the physical location of each NDT were identified and displacement-time histories with respect to the skull were computed and compared with the experimental data. Using these comparisons, the model’s parameters were adjusted to best fit the data. The model’s predictive capabilities were then validated against all of the remaining NDT experimental data including eight tests in the sagittal plane and one in the coronal plane.
Computational Issues Examined in SIMon
Brain Mesh Density Study. One of the most important constraints during the development of the SIMon FEHM was the imposed limit on the total run time, so that parametric studies and stochastic techniques may be utilized on an inexpensive PC workstation. It was assumed that if the model ran under 2 hours when simulating a 150-millisecond event, then the
application of parametric techniques may become feasible. This run time constraint is directly related to the mesh density of the model, i.e. – as the mesh density increases, so does the run time of the model. The challenge then was to create a relatively coarse mesh, while also preserving the model’s predictive capability.
With this in mind, two mesh densities were examined for the model. These were compared to estimate the possible loss in accuracy associated with the coarser mesh. Each brain element from the original model was split into eight elements to generate a finer mesh. Then, similar loading conditions were applied to both models and the results compared.
Hourglass Control Study. In the development of the SIMon FEHM, the model behavior was studied by using various hourglass control methods: 1) reduced integration with viscous, elastic, and viscous combined with elastic hourglass control and 2) reduced integration with viscous hourglass control and exact volume integration.
The benchmarks for this numerical study were the NDT experimental data. For the viscous and elastic forms of hourglass control, the numerical parameter responsible for the amount of artificial damping and/or stiffness proportional to the anti-hourglass forces (Flanagan and Belytschko, 1981) was also altered. The results of the study were used to select the most appropriate method of hourglass control for the SIMon FEHM.
Model Stability Study. Determining the stability limits of the SIMon FEHM is important to ensure that it is suitable for use in the full range of impact conditions found in an automotive environment. The model’s stability was examined in a manner similar to that seen in Zhang et al. (2001). In this case, a haversine loading function for translational acceleration a(t) and a sinusoidal function for angular acceleration α(t) were defined as follows:
,2sin2)(
2cos1)(
=
−=
Tt
TAt
TtAta
ππα
π
where A is the amplitude and T the duration of the pulses.
For this study, the value of the duration T was scaled at high values of the amplitude A, such that the total rotation of the head would not exceed 100°. This was

112 Takhounts et al. / Stapp Car Crash Journal 47 (October 2003) 107-133
done since head rotations greater than 100° were assumed to be non-physical. The stability study was conducted in both the sagittal and coronal planes, and their corresponding critical values of amplitude A and duration T were determined and documented.
Scaling Techniques
The SIMon model was tested using available experimental animal injury data, including rhesus monkeys (Abel et al., 1978; Gennarelli et al., 1982; Stalnaker et al., 1977; Nusholtz et al., 1984), baboons (Stalnaker et al., 1977), and miniature pigs (Meaney et al., 1993). A total of 114 animal brain injury experiments were simulated in the development of the three injury metrics.
Two scaling techniques were utilized. In the first technique, the SIMon model itself was geometrically scaled to the size of the animal (with different scaling ratios in each geometric direction) and the experimentally measured kinematic loading conditions were directly applied to the scaled model. In the second technique, the kinematic loading conditions were scaled in amplitude and time to satisfy the equal stress/velocity scaling relationship, i.e., translational velocity scaled as 1, angular velocity as 1/λ, and time scaled as λ, where λ is the scaling ratio. Once correctly scaled, these loading conditions were applied to the full-size SIMon model.
The adequacy of both of the two scaling techniques was studied and confirmed using an idealized cylinder model. Both scaling approaches were used with the SIMon FEHM, and the latter was selected as more appropriate since it did not cause element distortions that different scaling ratios in different directions did. Therefore, the results from all of the animal simulations shown in this paper were produced by applying the scaled kinematics from the animal impact tests to the current human-size SIMon head model. The scaling ratios for each animal were: λ = 2.47 for the rhesus monkeys, λ = 2.08 for the baboons, and λ = 2.60 for the miniature pigs. The brain material properties for these tests were G0 = 10.3 kPa, G∞ = 5 kPa, and τ = 0.01 sec.
Injury Metrics
Currently, the only widely accepted injury metric available to evaluate for the possibility of head injuries is the Head Injury Criterion. HIC relates the resultant translational acceleration to skull fracture. The current FMVSS 208 limit is 700 for HIC15. With the advent of airbags, more head injuries are
seen where injury is caused to the brain without a skull fracture. Given this, it is necessary to develop more effective ways of predicting all types of TBI.
Three of the most common types of TBI are examined here: diffuse axonal injury (DAI), contusions, and acute subdural hematoma (ASDH). Because the mechanisms that cause these injuries in an accident are different, a separate injury metric has been developed to predict injury for each case.
Data from animal experiments was used to determine critical values for each injury metric. In order to apply this data, the linear and angular kinematics recorded for the animal’s head were scaled in magnitude and time to what a human would experience. These responses were then applied to the rigid skull of the SIMon FEHM. The injury metrics were computed from each test and logistic regression was used to establish the critical values.
Cumulative Strain Damage Measure (CSDM) as a correlate for Diffuse Axonal Injuries. Over the past 30 years, scientific evidence has accumulated (Povlishock and Christman, 1995; Blumbergs et al., 1995; Christman et al., 1994; Simpson et al., 1985; Adams et al., 1977, 1989; Oppenheimer, 1968) indicating that axonal damage can occur in patients sustaining severe, moderate, and even mild forms of traumatic brain injury (TBI). Depending on the number of axons that are damaged, varying degrees of morbidity can ensue (Povlishock and Christman, 1995; Blumbergs et al., 1995). Because axonal damage can be found in multiple foci throughout the brain and brain stem, such axonal damage has been termed diffuse axonal injury or DAI (Gennarelli et al., 1982a).
Maxwell et al. (1997) constructed a schematic overview of their “current” thinking with regard to axonal injuries (Figure 2). As the strain level applied to the axons grows in intensity, a series of increasingly severe pathological changes occur. At strain levels of 10-15%, axonal swelling and a total loss of axonal transport begin (2-6 hours after the injury). In other studies, a loss of axonal transport was found at the strain levels of 15% (Thibault et al., 1981) and 18% (Bain and Meaney, 2000). However, the loss of axonal transport in a single axon does not reflect the distributive/diffuse nature or severity of DAI (Gennarelli et al., 1982a). Therefore, CSDM, introduced by Bandak and Eppinger (1995), is proposed in this paper as a mechanical equivalent for DAI.

Takhounts et al. / Stapp Car Crash Journal 47 (October 2003) 107-133 113
INJURY
transient depolarization (seconds) 5% or less strain
focal loss of axonal transport (5 – 15 minutes) 5 -10% strain mitochondrial swelling axolemma structural and functional change loss of microtubules (calcium and calmodulin)
axonal swelling (2 – 6 hours) loss of axonal transport 10 -15% strain
neurofilament compaction µM calpain/phosphatase/kinase activation neurofilament sidearm collapse/loss
axonal bulbs (4 hours – 99 days) 15 -20% strain neurofilament proteolysis mM calpain activation
more than 20% strain membrane renting/fragmentation neurofilament proteolysis
Recovery
SECONDARY AXOTOMY (minimum of 4 hours)
AXOTOMY
PRIMARY AXOTOMY (less than 1 hour)
AXOTOMY
Effects of injury and light microscope change
DESCRIPTOR Mechanisms and ultrastructural changes
Figure 2. A schematic overview of primary and secondary axotomy (adapted from Maxwell et al., 1997).

114 Takhounts et al. / Stapp Car Crash Journal 47 (October 2003) 107-133
CSDM is based on the hypothesis that DAI is associated with the cumulative volume of brain tissue experiencing tensile strains over a predefined critical level. The CSDM metric predicts injury by monitoring the accumulation of strain damage. This is accomplished by calculating the volume fraction of the brain which sometime during the event is experiencing strain levels greater than various specified levels. This strain level is based on the maximum principal strain calculated from a strain tensor that is obtained by the integration of the rate of deformation tensor (Bandak and Eppinger, 1995). The cumulative nature of the CSDM means that the strain damage at the end state of a calculation may be related to the DAI associated with a particular loading regime.
To select the critical values of strain and volume for the CSDM metric, data from animal experiments conducted by Abel et al. (1978), Stalnaker et al (1977), Nusholtz et al., (1984), and Meaney et al. (1993) was used to relate the CSDM levels to the observed occurrence of DAI (or concussion).
Dilatation Damage Measure (DDM) as a correlate for contusions. The second computational injury metric proposed is for the evaluation of brain injury that occurs as a result of dilatational stress states. It is referred to as the Dilatation Damage Measure, or DDM. It involves localized regions where stress states in the brain result in negative pressures exceeding values large enough to produce contusions and tissue damage, often found in countre-coup injuries. Dilatational stress modes are postulated to be involved in the damage processes due to the biphasic nature of brain with fluid (cerebrospinal, blood, and water) permeating nearly all of the brain’s volume.
The DDM monitors the volume of the brain experiencing specified negative pressure levels. Similar to the CSDM calculation, the final result is the percent of brain volume that have experienced a negative pressure level exceeding a prescribed threshold value sometime during the event. For the purposes here, this pressure threshold is set at –14.7 psi (~100 Kpa), the vapor pressure of water. The spatial distribution of the affected volume of brain mater reaching this negative pressure value indicates a higher possibility of contusions.
Animal impact tests from Stalnaker et al. (1977) and Nusholtz et al. (1984), along with the physical model study of Nusholtz et al. (1995), were used to establish the injury threshold for DDM. In the latter, the physical model results indicated that impacts above
150 g have the physical possibility of causing vaporization, whereas impacts above 350 g would result in a violent cavity collapse. Furthermore, the results obtained from the computational model highlighted the importance of incorporating some form of fluid vaporization at the skull-brain boundary.
Relative Motion Damage Measure (RMDM) as a correlate for acute subdural hematoma (ASDH). The third computational injury metric proposed, RMDM, is used for the evaluation of injuries related to brain motion relative to the interior surface of the cranium. This includes injuries due to acute subdural hematoma (ASDH). The metric accounts for the large-stretch modes of rupture of the bridging veins, while leaving open the possibility of using other micro or macro rupture-modes associated with more complex vascular tethering states.
The RMDM also incorporates the dependence of bridging vein-stretching rupture on strain rate. While explicit bridging veins are modeled, they are not used to calculate the RMDM measure by modeling the failure of each vein. Instead, several pairs of nodes were selected on the brain (node A) and skull (node B) surfaces. These are used to calculate the RMDM by quantifying the tangential motion between the brain and skull. Assuming that at t = t1, a pair of nodes are located at A1 and B1 (Figure 3). At t = t2, the nodes move to A2 and B2, and the distance between the nodes is s.
Figure 3. A schematic showing a pair of nodes located on the dura (node B) and the brain (node A) at time t=t1 before a motion is induced on the head the nodes have an initial length so. After impact at t=t2, the nodes will move to a new location at A2 and B2 where the relative motion between the two nodes is measured by the new length s.

Takhounts et al. / Stapp Car Crash Journal 47 (October 2003) 107-133 115
To calculate RMDM, the displacement time history of each pair of nodes is recorded and an initial length of the vein is assumed. Using both of these, the strain and strain rate of each bridging vein is then calculated by:
)/ln( 0sse = , dtdee =
..
Next, the strain-strain rate failure description of the RMDM is established by using experimental data from Lowenhielm (1974)(Figure 4). These results are then modified by a 30% reduction to the ultimate strain. This is an attempt to account for the fact that the ultimate strain might be lower for fresh human bridging veins, especially at higher strain rates. The resulting curve, represented by the dashed line in Figure 4, is used to calculate the failure strain for a given strain rate. The potential for failure of a
bridging vein at any time t is determined by calculating the ratio of a vein’s current strain to its failure strain. The failure strain is the strain that corresponds to the Lowenhielm threshold at the vein’s current strain rate. In this case, the ratio is the critical value for the metric. The initial length of the vein and the strain vs. strain-rate curve are adjusted so that the ratio is 1.0 at the 50% probability of injury, i.e., - if the ratio exceeds 1, failure is assumed. The RMDM calculation returns the maximum ratio calculated for all of the 14 node pairs.
RMDM was then evaluated against primate ASDH experimental results (Abel et al., 1978). The scaled kinematic loading conditions used in these experiments were applied to the SIMon FEHM by imposing a time-dependent angular velocity in the sagittal plane, and model outputs were compared and calibrated to the experimental results to maximize its predictive capability.
Figure 4. Bridging veins failure criterion based on strain and strain rate. The continuous line is a quadratic fit of the data from Lowenhielm et al. (1974), whereas the dashed line is a quadratic fit of the same data with a 30% reduction to the ultimate strain.

116 Takhounts et al. / Stapp Car Crash Journal 47 (October 2003) 107-133
Frontal NCAP and Side Impact Data Analysis Using SIMon
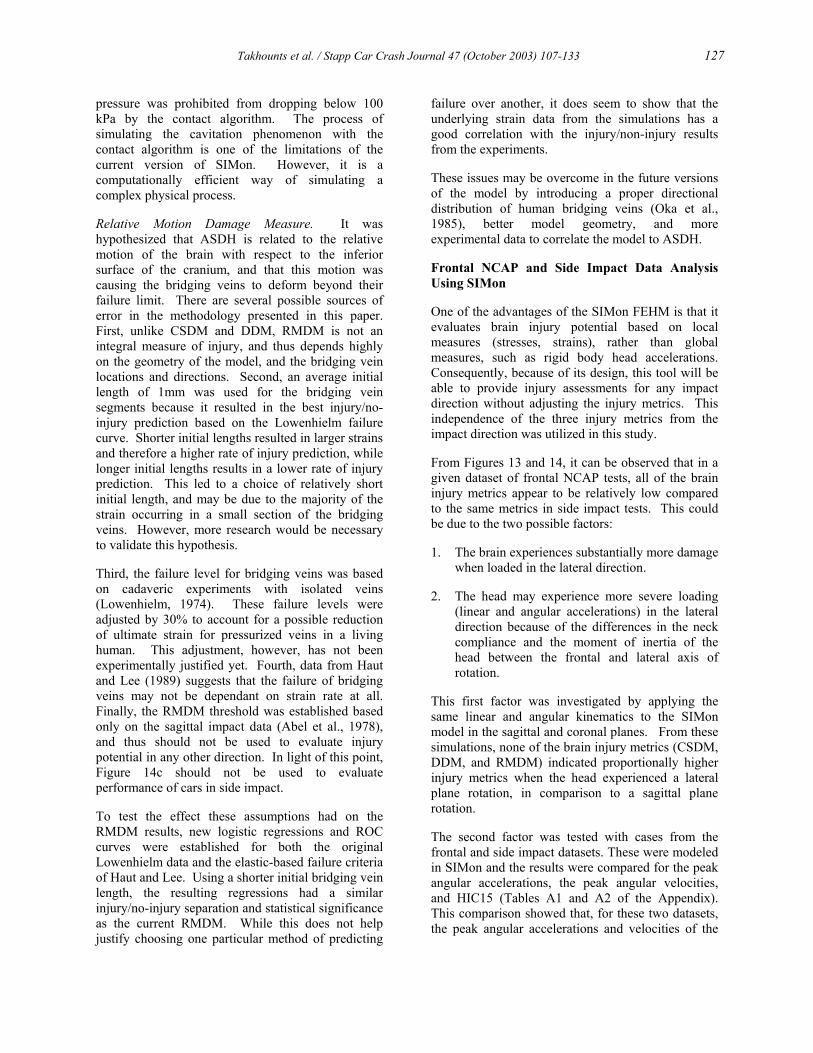
As mentioned earlier, the goal of the SIMon software package is to be able to use existing kinematic and kinetic dummy measurements to drive imbedded finite element models of the head. To test the current version of the validated SIMon model, data from the 3D translational and rotational kinematics of the dummy head served as the input boundary condition for the model’s rigid skull. For these tests, the data was obtained using the 3D linear and rotational kinematics of several Hybrid III and ES2 dummies that had been instrumented with the nine accelerometer array package (NAAP). The brain material properties used in these test were G0 = 10.3 kPa, G∞ = 5 kPa, and τ = 0.01 sec.
Overall, the data from 43 NCAP tests (drivers and passengers) and 37 side impact tests were evaluated using the current version of the SIMon FEHM. This was done to evaluate the robustness of the SIMon FEHM to realistic automotive crash inputs and effectiveness of the three injury metrics in predicting brain injury in motor vehicle accidents. All three proposed brain injury metrics were computed and compared with the existing head injury criteria, HIC and HIC15. The results are shown in Tables A1 and A2 of Appendix A.
RESULTS
Model Validation
For this simulation, the displacement-time histories with respect to the skull for nodes nearest in location to the experimental NDT targets were output from the model. The nodal displacements were then compared to the experimental NDT displacements for one test. The test used for the model tune up is presented here (Figure 5). A variety of properties were tested and compared to the experimental data. The brain properties that resulted in the best correlation with the experimental data were: G0 = 2.4 kPa, G∞ = 1.2 kPa, τ = 0.01 sec, and a damping based hourglass control (gray line in Figure 5). Figure 6 shows the trajectories of the measured and computed NDTs relative to the skull from the same test. Using the properties above, the remaining tests were simulated and had similar model-to-experiment trends. The black line in Figure 5 shows the NDT
response with the brain material properties used in simulations of the animal injury data and the NCAP/side impact evaluation study.
Computational Issues Examined in SIMon
Brain Mesh Density Study. With the finer meshed model, a 120-millisecond simulation required about 36 hours to solve, versus 1.5 hours with the current, coarsely meshed model. The maximum displacements of the NDT nodes increased somewhat without a noticeable change in the duration of their relative motion (Figure 7). The hourglass energy was slightly reduced, but the ratio of hourglass to internal energy increased. This was due to a reduction of internal energy and an increase in contact energy seen in the finer meshed model.
Hourglass Control Study. This study utilized the reduced integration method with various hourglass control methods. It was determined that any form of elastic based hourglass control is inappropriate for modeling soft biological tissue because it results in a dramatically stiffened material response. This is illustrated in Figure 8, which compares the NDT displacement-time histories for two models: one with viscous based hourglass control, and one with a relatively small amount of elastic based hourglass control. The viscous based hourglass control method best correlated with experimental data, and was therefore used in the SIMon FEHM.
Model Stability. No stability issues were detected in the model when subjected to the combination of a peak translational acceleration A = 640 g with a duration of 11 ms, and a peak rotational acceleration of 40,000 rad/sec2 with a duration of 16.5 ms. The ratio of hourglass to internal energy reported by LS-Dyna was high for the final version of the model (reduced integrated brain with viscous form of hourglass control). In contradiction to this ratio, the accuracy of the model was still high and the solution did not deteriorate. When the ratio of the hourglass energy to the sum of the internal and kinetic energies was inspected, it was found to be under 6% for most tests. A discussion on the appropriateness of using the hourglass to internal energy ratio as a measure of model accuracy, especially for those with soft biological materials, is given in the Discussion section.

Takhounts et al. / Stapp Car Crash Journal 47 (October 2003) 107-133 117
NDT a1
-10
-5
0
5
10
0 30 60
NDT a6
-10
-5
0
5
10
0 30 60
NDT p1
-10
-5
0
5
10
0 30 60
NDT p6
-10
-5
0
5
10
0 30 60
NDT a1
-10
-5
0
5
10
0 30 60
NDT a6
-10
-5
0
5
10
0 30 60
NDT p1
-10
-5
0
5
10
0 30 60
NDT p6
-10
-5
0
5
10
0 30 60
Time (ms)
-X-re
l. di
spl.
(mm
)
Time (ms)
-X-re
l. di
spl.
(mm
)Z-
rel.
disp
l. (m
m)
Z-re
l. di
spl.
(mm
)
NDT a6ExpSim Go=2.4kPaSim G=10.3kPa
Figure 5. Test C755-T2 displacement-time histories of the neutral density targets measured experimentally (Hardy et al., 2001) and computed using SIMon finite element head model.
-100
-88
-76-64
-52
-40
-28
-16-4
8
20
32
4456
-66 -54 -42 -30 -18 -6 6 18 30 42 54 66 78 90
<-Anterior - X (mm) - Posterior ->
<- S
uper
ior -
Z (m
m) -
Infe
rior -
>
C.G. P1A1
P5A5
Figure 6. Test C755-T2, comparison of the experimentally measured (Hardy et al., 2001) and numerically simulated trajectories of neutral density targets.

118 Takhounts et al. / Stapp Car Crash Journal 47 (October 2003) 107-133
Time (ms)
-X-re
l. di
spl.
(mm
)
Time (ms)
-X-re
l. di
spl.
(mm
)Z-
rel.
disp
l. (m
m)
Z-re
l. di
spl.
(mm
)
NDT a1
-10
-5
0
5
10
0 30 60 90 120
NDT a6
-10
-5
0
5
10
0 30 60 90 120
NDT p1
-10
-5
0
5
10
0 30 60 90 120
NDT p6
-10
-5
0
5
10
0 30 60 90 120
NDT a1
-10
-5
0
5
10
0 30 60 90 120
NDT a6
-10
-5
0
5
10
0 30 60 90 120
NDT p1
-10
-5
0
5
10
0 30 60 90 120
NDT p6
-10
-5
0
5
10
0 30 60 90 120
CoarseRefined
Figure 7. NHTSA test 2322, comparison of the NDT displacement-time histories of the current (coarse) head model and refined head model.

Takhounts et al. / Stapp Car Crash Journal 47 (October 2003) 107-133 119
NDT a1
-10
-5
0
5
10
0 30 60
NDT a6
-10
-5
0
5
10
0 30 60
NDT p1
-10
-5
0
5
10
0 30 60
NDT p6
-10
-5
0
5
10
0 30 60
NDT a1
-10
-5
0
5
10
0 30 60
NDT a6
-10
-5
0
5
10
0 30 60
NDT p1
-10
-5
0
5
10
0 30 60
NDT p6
-10
-5
0
5
10
0 30 60
Time (ms)
-X-r
el. d
ispl
. (m
m)
Time (ms)
-X-r
el. d
ispl
. (m
m)
Z-re
l. di
spl.
(mm
)Z-
rel.
disp
l. (m
m)
ViscousStiffness
Figure 8. Test 755-T2 NDT displacement-time histories of the reduced integrated models with viscous based hourglass control and with stiffness form of hourglass control.
Injury Metrics
Once injury metric values were assigned that appeared to separate injury from non-injury cases, the metrics were evaluated to find their critical values using the existing animal data. This data set was used as a ‘trial case’ to see how well the model predicted injury.
Cumulative Strain Damage Measure. Animal injury data reported by Abel et al. (1978), Stalnaker et al. (1977), Nusholtz et al. (1984), and Meaney et al. (1993) was used to establish the injury threshold for DAI. This was accomplished using logistic regression, in which the independent variable was the
CSDM criterion. Several levels of maximum principal strains were investigated (from 0.05 to 0.5) to obtain the best correlation with the experimental data. Figure 9 presents the logistic regression results for strain levels of 0.15, 0.2, 0.25, and 0.3. The ROC curves shown in Figure 10 provide an evaluation of each strain level without respect to the specific CSDM volume thresholds. It can be observed in Figure 9 that the best correlation is achieved at the strain level 0.15 (p < 0.001, χ2 = 66.5). The CSDM level corresponding to a 50% probability of concussion was thus established to be when 55% of the volume of the brain has experienced a 15% strain level.

120 Takhounts et al. / Stapp Car Crash Journal 47 (October 2003) 107-133
0
0.2
0.4
0.6
0.8
1
0 0.2 0.4 0.6 0.8 1
CSDM (Strain = 0.3)
0
0.2
0.4
0.6
0.8
1
0 0.2 0.4 0.6 0.8 1
CSDM (Strain = 0.25)
0
0.2
0.4
0.6
0.8
1
0 0.2 0.4 0.6 0.8 1
CSDM (Strain = 0.2)
0
0.2
0.4
0.6
0.8
1
0 0.2 0.4 0.6 0.8 1
CSDM (Strain = 0.15)
Prob
abili
ty
DAI / No DAIRegression
Pro
babi
lity
Figure 9. Logistic fit curves for CSDM at strain levels of 0.15, 0.2, 0.25, and 0.3.
Figure 10. ROC curves for CSDM at various strain levels.
Dilatation Damage Measure. To establish the threshold for contusions, the DDM was correlated to the animal experimental data (Stalnaker et al., 1977; and Nusholtz et al., 1984) using logistic regression analysis (Figure 11). The 50% probability of contusions was established to correspond to a DDM of 7.2%, i.e. when 7.2% of the brain tissue volume experiences a pressure of –100 kPa (-14.7 psi), the brain is assumed to be injured (p < 0.001, χ2 = 13.7).
Relative Motion Damage Measure. The probability of occurrence of acute subdural hematoma in humans as a function of RMDM was established based on the primate injury data from Abel et al. (1978). The logistic regression results are shown in Figure 12 (p < 0.001, χ2 = 23.7), where, when using the curve representing the 70% threshold level of the Lowenhielm failure curve, a bridging vein initially 1mm long, resulted in the logistic regression assigning a 50% failure rate to a RMDM value of 1.
0
0.2
0.4
0.6
0.8
1
0 0.2 0.4 0.6 0.8 1
1-Specificity
Sen
sitiv
ity Strain 0.5Strain 0.4Strain 0.3Strain 0.2Strain 0.15

Takhounts et al. / Stapp Car Crash Journal 47 (October 2003) 107-133 121
00.10.20.30.40.50.60.70.80.9
1
0 0.05 0.1 0.15 0.2
DDM
Pro
babi
lity
Injury / Non-InjuryRegression
Figure 11. Probability curve of focal lesions as a function of DDM.
00.10.20.30.40.50.60.70.80.9
1
0 0.5 1 1.5 2 2.5 3
RMDM
Prob
abili
ty
ASDH / No ASDHRegression
Figure 12. Risk curve relating the probability of occurrence of acute subdural hematoma in humans as a function of RMDM.
Frontal NCAP and Side Impact Data Analysis Using SIMon
After the current version of the SIMon model was validated, it was applied to frontal NCAP test data from the NHTSA database with the simulation results shown in Figure 13 (a) for CSDM, (b) for DDM, and (c) for RMDM. For the X-axis labels in Figure 13, the first four digits represent the vehicle test number assigned by NHTSA, and the second two digits designate the standard occupant location in the vehicle, i.e., 01 = driver and 04 = driver-side rear passenger. Each chart was plotted against HIC15 for comparison and further analysis. In this same manner, the side impact data is presented in Figure 14.
SIMon failed only one of the cars tested in the frontal NCAP configuration, and it failed twelve cars in side impact tests (Figures 13a and 14a). All of the failures were seen in the CSDM metric. For this analysis, a 25% preset “survivability” level for CSDM was assumed.
Six of these twelve side impact cases also failed the HIC15 criterion (> 700), but the remaining six had lower HIC15 values (ranging from 93 to 694). Three out of the six tests that failed CSDM but passed the HIC15 criterion involved the driver of the same car make under different test configurations (Table A2). In addition to failing CSDM and belonging to the same car make, these three tests had another common denominator: the highest peak angular velocities with relatively small peak angular accelerations.

122 Takhounts et al. / Stapp Car Crash Journal 47 (October 2003) 107-133
0.0%
0.5%
1.0%
1.5%
2.0%
2.5%
DD
M, %
Vol
ume
Faile
d
0
100
200
300
400
500
600
700
800
900
HIC
15
DDM
HIC15
a)
b)
c)
0%
10%
20%
30%
40%
50%
60%
70%
80%
90%
100%
CSD
M, %
Vol
ume
Faile
d
0
100
200
300
400
500
600
700
800
900
HIC
15
CSDM
HIC15
0
0.1
0.2
0.3
0.4
0.5
0.6
0.7
4303
-01
4242
-01
4205
-02
4273
-01
4198
-01
3897
-01
4266
-02
4247
-01
3916
-01
4081
-02
4264
-02
3901
-02
4250
-01
4251
-01
4215
-02
4237
-02
4080
-01
4205
-01
4090
-01
4264
-01
4090
-02
4223
-02
4267
-02
4215
-01
4242
-02
4259
-01
3987
-01
3915
-01
4255
-02
4235
-01
4235
-02
4265
-02
4249
-02
4240
-01
4237
-01
4259
-02
4198
-02
3915
-02
3952
-01
3901
-01
4241
-01
4252
-01
3952
-02
Frontal NCAP Test Number
RM
DM
, Max
Str
ain
/ Fai
l Str
ain
0
100
200
300
400
500
600
700
800
900
HIC
15RMDM
HIC15
Figure 13. Results of frontal NCAP test data simulations: a) CSDM vs. test number, b) DDM vs. test number, and c) RMDM vs. test number.

Takhounts et al. / Stapp Car Crash Journal 47 (October 2003) 107-133 123
0%
5%
10%
15%
20%
25%
DD
M, %
Vol
ume
Faile
d
0
2000
4000
6000
8000
10000
12000
14000
16000
18000
HIC
15
DDM
HIC15
a)
c)
b)
0%
10%
20%
30%
40%
50%
60%
70%
80%
90%
100%
CSD
M, %
Vol
ume
Faile
d
0
2000
4000
6000
8000
10000
12000
14000
16000
18000
HIC
15
CSDM
HIC15
0
2
4
6
8
10
12
3800
-01
4551
-01
3875
-01
3899
-01
3818
-01
4547
-01
4380
-01
3845
-01
4497
-01
4547
-04
3898
-01
4551
-04
3799
-04
4380
-04
3820
-01
4456
-04
3819
-04
4456
-01
3799
-01
4378
-01
4292
-01
4498
-01
3803
-04
3802
-01
4292
-04
3803
-01
4482
-01
3800
-04
4471
-01
4313
-01
3819
-01
4086
-01
4284
-01
4285
-01
4423
-01
4246
-01
4365
-01
Side Impact Test Number
RM
DM
, Max
Str
ain
/ Fai
l Str
ain
0
2000
4000
6000
8000
10000
12000
14000
16000
18000
HIC
15RMDM
HIC15
Figure 14. Results of side impact data simulations: a) CSDM vs. test number, b) DDM vs. test number, and c) RMDM vs. test number. HIC15 values are given for convenience (there is no side impact head or brain injury criteria available to date).

124 Takhounts et al. / Stapp Car Crash Journal 47 (October 2003) 107-133
DISCUSSION
To develop the SIMon FEHM, first the computational and physical parameters that affect the model’s performance were investigated and appropriate values were selected. Next, the SIMon model was tested using the NDT data. The model properties were adjusted to correctly fit the dataset.
Given the validated model, the next step was to use the larger subset of animal data to gauge the ability of SIMon to predict injuries. However, because of the severity of these cases, the material properties had to be stiffened. Using the animal data, critical values were established to predict injuries for each of the three metrics.
The current step being taken in the development of SIMon is to use existing NCAP and side impact crash data and apply it to the model. After the data is applied, the results are evaluated to see if SIMon predicts TBI injury in these cases, and if the predicted injuries are consistent with current studies of TBI in motor vehicle crashes.
Important points from each of these developmental steps are discussed in this section. They include issues considered in development that may be of interest to other modelers and future improvements that could be made to the model.
Model Parameters
Material Property Study. A variety of different material formulations were investigated in the development of the SIMon FEHM. The results from the various linear, viscoelastic material formulations available in LS-DYNA v.970 were found to be identical. Of these, the Kelvin-Maxwell linear, viscoelastic formulation was selected as a candidate material because its use allowed for direct computations of CSDM and DDM.
Two nonlinear, viscoelastic formulations were then used: Ogden rubber and Mooney-Rivlin rubber. Both formulations yielded similar results, but were difficult to fit to the Takhounts (1998) experimental data at both extremes of the time spectrum. Therefore, neither nonlinear rubber formulation was sufficient in fully describing the nonlinear relaxation behavior of brain tissue.
When using a linear viscoelastic material with brain tissue material properties similar to those reported in the literature, the model performed well (Figure 5) when simulating the relatively low severity NDT test conditions. However, stability of the model was
jeopardized when simulating the high severity test conditions of the animal injury tests. In order to increase the numerical stability in these cases, the short-term shear modulus G0 was stiffened to 10.3kPa (G∞ = G0/2), while the time constant was left unchanged.
The elastic properties of the dura-CSF layer were also softened to increase the model’s stability. This layer in the model represents the dura mater, arachnoid trabeculae, pia mater, and the CSF combined. Its relative compressibility (Poisson’s ratio ν = 0.45) allowed for the simulation of the global motion of the brain within the skull, and accounted for the motion of the brain through the foramen magnum (not modeled). The elastic properties of this aggregate layer were varied from 1.4 to 14 MPa, while the NDT displacement-time histories and model stability were monitored. The best performance was achieved with a modulus of elasticity E = 3.4 MPa. It should be noted that it would have been impossible to achieve the current level of overall model stability without the selection of the correct elastic properties of the dura-CSF layer.
However, the use of a linear viscoelastic constitutive model for the brain tissue is one of the current limitations of the current SIMon FEHM. Since brain tissue itself is nonlinear, it can be seen to stiffen as it is loaded. When subjected to small deformations, it is relatively soft (G0 ~ 1 kPa), but then, as the strain level increases, it becomes much stiffer (G0 ~ 10kPa). The current linear material model does not replicate this type of nonlinear hyperelastic deformation response. To account for this behavior, future improvements will include the use of a quasi-linear material characterization for the brain tissue. This will allow the model to more accurately represent the brain tissue response under all loading conditions, i.e., allow improved performance when modeling the NDT data while at the same time being able to handle more severe loading conditions such as those associated with the animal and NCAP data.
Hourglass Control. Much of the time and effort spent on this project was dedicated to studying and understanding the effects of numerical integration methods, hourglass modes, and various hourglass control methods on the solution of the SIMon FEHM. One of the main motivations of this study was the guideline that suggests suppressing the hourglass energy below 5% of the internal deformation energy.
Initially, a reduced integration scheme was used in the SIMon FEHM because it typically provides shorter solution times and increased model stability.

Takhounts et al. / Stapp Car Crash Journal 47 (October 2003) 107-133 125
However, this method can lead to hourglass modes which can lead to instabilities. Over the years, two methods of resisting hourglass modes have emerged: viscous (or damping) and elastic (or stiffness).
Using a reduced integration scheme, both damping and stiffness hourglass controls were tested with the NDT data. With the viscous hourglass control, a good correlation with the NDT data was achieved; however, LS-Dyna’s reported ratio of hourglass to internal energy was always between 200-300%. This high energy ratio was surprising because there was no mesh distortion and the solution remained stable. When using a stiffness hourglass control, the energy ratio was much better (around 10%), but it resulted in non-physical nodal displacement-time histories (Figure 8).
In an attempt to achieve good NDT results while minimizing hourglass energy, a number of other techniques were used. Fully integrated elements result in zero hourglass energy, but they are susceptible to volumetric locking. Selectively reduced integration methods avoid volumetric locking but can have instabilities due to shear locking when large element distortions are encountered (LS-DYNA Keyword User’s Manual, 2003). Both of these methods were applied to the SIMon FEHM to investigate their effects. Using the fully integrated method the model locked up and quit after only a few milliseconds into the 120-millisecond event. Use of the selective reduced integration method, did not improve the outcome, as the model quit running after about 10 milliseconds into the event due to shear locking. This shear locking dramatically reduced the integration time interval.
An extensive literature search was initiated in an effort to understand the problem at hand. However, a reference source that explained the methodology behind the 5% guideline for the energy ratio could not be found. The only rationale found for keeping the energy ratio in check was the model stability (Belytschko, 1974; Belytschko and Kennedy, 1978; Kosloff and Frazier, 1978; Belytschko and Tsay, 1983; Belytschko and Bindeman, 1993; Flanagan and Belytschko, 1981), i.e., when the hourglass energy is relatively high compared to the internal deformation energy, it quickly deteriorates the numerical solution. If numerical stability of the solution is the only concern, then, as described in the Model Stability Study, the SIMon FEHM is arguably the most stable head model currently available.
Does this suggest that high hourglass energy should not be a concern? The answer is not straight-
forward. As a general practice, the energy ratio of a model is limited to 5% or less as a design constraint. However, this appears to have little effect on the model’s accuracy or validity. As evidenced here, using the hourglass energy as a “stand alone” indicator of the validity of a numerical solution would not be an accurate measure of the model. For example, an extensive parametric study was done in which numerical and physical parameters were altered, and the results compared to the experimental NDT data. In this case, following the 5% guideline would have been misleading, since the model with the lower hourglass energy was actually less accurate due to the influence of the stiffness hourglass control. The 5% rule of thumb should be used with caution until this can be thoroughly investigated.
Model Validation
During the validation process, the model was found to be most sensitive to changes in the short-term shear modulus G0, while less sensitive to changes in both the long-term shear modulus G∞and the time constant τ. In general, the model correlated better with the experimental NDT data when the brain tissue shear moduli were softened.
In addition to monitoring the magnitudes of all NDTs in all directions, the durations were monitored as well (Figure 5). From the hourglass study, it became evident that comparing only the NDT trajectories relative to the skull was not sufficient (Figures 5, 7, and 8). Two other models have been validated with the NDT experimental dataset (Zhang et al., 2001 and Kleiven and Hardy, 2002). In Zhang et al. (2001), the authors presented the trajectories of their NDT validation results. This made it difficult to judge the performance of the two models, as no displacement-time histories were given. Kleiven and Hardy (2002) presented the NDT displacement-time histories for various brain shear stiffnesses. Kleiven and Hardy observed similar trends, i.e., the model correlated better with the experimental NDT data when the shear stiffness of the brain tissue was reduced. However, their model used a selective reduced integration method, which avoids volumetric locking, but is susceptible to shear locking at higher severities, and thus, is less stable than the reduced integration methods.

126 Takhounts et al. / Stapp Car Crash Journal 47 (October 2003) 107-133
Injury Metrics
Cumulative Strain Damage Measure. Three different approaches were used to correlate the animal brain injury data to the occurrence of DAI in the brain. It was hoped that the results from all three approaches would converge. First, the CSDM critical value was established based on the logistic regression of the animal tests simulation results (Figure 9). These results were obtained through scaling the animal linear/angular kinematics (magnitudes and timing) to their human equivalents and applying them to the full-size SIMon model. Next, information about the levels of strain that can damage axons was gathered from Maxwell et al. (1997), Thibault et al. (1981), and Bain and Meaney (2000). From the animal data (Figure 9), it was observed that a 50% probability of DAI corresponds to CSDM values of 55%, 36%, 21%, and 13%, at strain levels of 0.15, 0.2, 0.25, and 0.3 respectively. The ROC curves shown in Figure 10 provide an evaluation of each strain level without respect to the specific CSDM volume thresholds. Using Figures 9 and 10, a strain level of 0.15 was selected as the critical strain value. This value also corresponds to the experimentally determined threshold level of strain that causes damage to individual axons (Maxwell et al., 1997; Thibault et al., 1981; and Bain and Meaney, 2000).
To compare this level of strain to that seen in humans, the values of CSDM were computed using the only known quantitative description of DAI in the human brain (Blumbergs et al., 1995), (Table 1). The values shown in Table 1 indicate the possible volume of critically damaged tissue in the human brain, but they do not contain information about the individual levels of strain that are experienced by each damaged axon. Table 1 indicates that the critical CSDM level is probably in the range of 40 to 70%. This is consistent with the values selected.
Table 1. Data from Blumbergs et al. (1995) along with calculated levels of CSDM.
Injury
Number of Injured sections AISS CSDM, %
0 4 0.034 3.45
0 8 0.069 6.90
0 6 0.052 5.17
0 27 0.233 233
0 17 0.147 14.7
0 88 0.759 75.9
1 91 0.784 78.4
1 107 0.922 92.2
1 105 0.905 90.5
1 88 0.759 75.9
1 110 0.948 94.8
1 106 0.914 91.4
Thus, the development of the SIMon FEHM draws upon various data sets to establish a preliminary critical value for the injury metric that is mechanically equivalent to DAI: CSDM. The current version of CSDM does not account for the “functional importance” of various regions of the brain. It assumes that every region is equally important and contributes uniformly to the overall assessment of DAI. More experimental data is needed to establish the functional importance of the various brain regions. Once the data becomes available, the CSDM algorithm can be modified by weighting each of the various regions of the brain according to their functional importance.
Dilatation Damage Measure. The results of the animal experimental data (Stalnaker et al., 1977; Nusholtz et al., 1984) indicated that a 50% probability of contusions occurs when the DDM equals 7.2% (Figure 11). In other words, this means that when 7.2% volume of the human brain experiences negative dilatation pressures of ~100 kPa, contusions are likely to develop. A negative dilatation pressure of ~100kPa coincides with the threshold of cavitation in water (Nusholtz et al., 1995). The challenge of simulating cavitation with a Lagrangian mesh was overcome by utilizing a “tie-break” contact algorithm implemented within LS-DYNA (Bandak and Eppinger, 1995). The defined dilatation pressure (-100 kPa for water) was set as the breaking limit for the tie-break contact interface in tension. In addition to the tension limit, the breaking limit in shear can also be defined. This shear limit was set to a very small value to allow free shear sliding at the brain to dura-CSF and the dura-CSF to skull interfaces. The shear sliding was also controlled with a coefficient of friction. If at any time, the dilatation pressure between two contacting faces reached –100 kPa, the contact is released in tension, thus allowing relative motion between the contacting faces in the direction of their normal vectors (without penetrations). The dilatation
Takhounts et al. / Stapp Car Crash Journal 47 (October 2003) 107-133 127
pressure was prohibited from dropping below 100 kPa by the contact algorithm. The process of simulating the cavitation phenomenon with the contact algorithm is one of the limitations of the current version of SIMon. However, it is a computationally efficient way of simulating a complex physical process.
Relative Motion Damage Measure. It was hypothesized that ASDH is related to the relative motion of the brain with respect to the inferior surface of the cranium, and that this motion was causing the bridging veins to deform beyond their failure limit. There are several possible sources of error in the methodology presented in this paper. First, unlike CSDM and DDM, RMDM is not an integral measure of injury, and thus depends highly on the geometry of the model, and the bridging vein locations and directions. Second, an average initial length of 1mm was used for the bridging vein segments because it resulted in the best injury/no-injury prediction based on the Lowenhielm failure curve. Shorter initial lengths resulted in larger strains and therefore a higher rate of injury prediction, while longer initial lengths results in a lower rate of injury prediction. This led to a choice of relatively short initial length, and may be due to the majority of the strain occurring in a small section of the bridging veins. However, more research would be necessary to validate this hypothesis.
Third, the failure level for bridging veins was based on cadaveric experiments with isolated veins (Lowenhielm, 1974). These failure levels were adjusted by 30% to account for a possible reduction of ultimate strain for pressurized veins in a living human. This adjustment, however, has not been experimentally justified yet. Fourth, data from Haut and Lee (1989) suggests that the failure of bridging veins may not be dependant on strain rate at all. Finally, the RMDM threshold was established based only on the sagittal impact data (Abel et al., 1978), and thus should not be used to evaluate injury potential in any other direction. In light of this point, Figure 14c should not be used to evaluate performance of cars in side impact.
To test the effect these assumptions had on the RMDM results, new logistic regressions and ROC curves were established for both the original Lowenhielm data and the elastic-based failure criteria of Haut and Lee. Using a shorter initial bridging vein length, the resulting regressions had a similar injury/no-injury separation and statistical significance as the current RMDM. While this does not help justify choosing one particular method of predicting
failure over another, it does seem to show that the underlying strain data from the simulations has a good correlation with the injury/non-injury results from the experiments.
These issues may be overcome in the future versions of the model by introducing a proper directional distribution of human bridging veins (Oka et al., 1985), better model geometry, and more experimental data to correlate the model to ASDH.
Frontal NCAP and Side Impact Data Analysis Using SIMon
One of the advantages of the SIMon FEHM is that it evaluates brain injury potential based on local measures (stresses, strains), rather than global measures, such as rigid body head accelerations. Consequently, because of its design, this tool will be able to provide injury assessments for any impact direction without adjusting the injury metrics. This independence of the three injury metrics from the impact direction was utilized in this study.
From Figures 13 and 14, it can be observed that in a given dataset of frontal NCAP tests, all of the brain injury metrics appear to be relatively low compared to the same metrics in side impact tests. This could be due to the two possible factors:
1. The brain experiences substantially more damage when loaded in the lateral direction.
2. The head may experience more severe loading (linear and angular accelerations) in the lateral direction because of the differences in the neck compliance and the moment of inertia of the head between the frontal and lateral axis of rotation.
This first factor was investigated by applying the same linear and angular kinematics to the SIMon model in the sagittal and coronal planes. From these simulations, none of the brain injury metrics (CSDM, DDM, and RMDM) indicated proportionally higher injury metrics when the head experienced a lateral plane rotation, in comparison to a sagittal plane rotation.
The second factor was tested with cases from the frontal and side impact datasets. These were modeled in SIMon and the results were compared for the peak angular accelerations, the peak angular velocities, and HIC15 (Tables A1 and A2 of the Appendix). This comparison showed that, for these two datasets, the peak angular accelerations and velocities of the

128 Takhounts et al. / Stapp Car Crash Journal 47 (October 2003) 107-133
head were much greater in the side than in the frontal impact tests.
CONCLUSIONS
A mathematical surrogate of the human head solving approximately 30,000 equations simultaneously every microsecond, called the SIMon FEHM, was developed and presented in this paper. This mathematical surrogate was not meant to replicate the behavior of every isolated region of the human head. Instead, it was designed to fit all available experimental data as best as possible under specified run time constraint (solving a 150 ms event in under 2 hours on a high-end PC). Simulations of, and validations against available experimental data were supplemented by extensive studies of numerical issues, including integration methods, hourglass control, contact algorithms and penalty scale factors. Physical properties of the brain tissue and dura-CSF layer were also altered to assess their influence on the model’s performance and stability. Below is a summary of the main points of this research:
• Temporal changes in the strain field within the brain were validated using experimental neutral density targets data from Hardy et al. (2001). The model correlated best with the experimental NDT data when the instantaneous shear modulus of brain tissue was set to 2.4 kPa, i.e., close to the recently reported shear properties of brain tissue.
• Mechanical equivalents for three brain injury mechanisms were proposed and evaluated using animal experimental data. These are: cumulative strain damage measure, or CSDM, as a correlate for DAI; dilatation damage measure, or DDM, as a correlate for contusions; and relative motion damage measure, or RMDM, as a correlate for acute subdural hematoma. Probability curves for each injury metric were established, and injury limits were compared to other data sources whenever available.
• The current version of the model was exercised using frontal NCAP and side impact data available in the NHTSA database. The three proposed injury metrics were then compared to the existing head injury criteria, such as HIC15. For the given datasets, it appeared that the brain experienced greater deformations in side impact tests than in the frontal impact tests, mostly due to higher angular accelerations measured by the side impact dummies (ES2).
• Numerical integration methods and hourglass control techniques were studied. Only the reduced integration method combined with a damping based hourglass control was found to be appropriate when simulating all available experimental data.
• The SIMon model should be used within the specified limits, i.e., only the presented injury metrics should be used to evaluate TBI. Also, the model was not meant to simulate the proper response of every region of the head. Rather, it was designed to best replicate all available experimental data.
Future improvements may include utilizing a quasi-linear constitutive model for the brain tissue, modeling the falx cerebri with shell elements, improving the aspect ratio of the solid elements surrounding the falx, and improving performance of the RMDM algorithm.
ACKNOWLEDGMENTS
Several people from different organizations were essential in the final success of this research. Among them, Drs. J.O. Hallquist and C.T. Wu from LSTC, Dr. P.J. Masiello from Jaycor, and Dr. F. Bandak from Volpe TRC.
REFERENCES
Abel, J., Gennarelli, T.A., Seagawa, H. (1978) In cadence and severity of cerebral concussion in the rhesus monkey following sagittal plane angular acceleration. Proc. 22nd Stapp Car Crash Conference, pp. 33-53. Society of Automotive Engineers, Warrendale, PA.
Adams, J.H., Mitchell, D.E., Graham, D.I., Doyle, D. (1977) Diffuse brain damage of immediate impact type. Its relationship to “primary brain stem damage” in head injury. Brain 100: 489-502.
Adams, J.H., Doyle, D., Gennarelli, T.A., Graham, D.I., McClellan, D.R. (1989) Diffuse axonal injury in head injury: Definition, diagnosis and grading. Histopathology 15: 49-59.
Arbogast, K. B., Meaney, D. F., and Thibault, L. E. (1995) Biomechanical characterization of the constitutive relationship for the brainstem. Proc. 39th Stapp Car Crash Conference, pp. 153-159. Society of Automotive Engineers, Warrendale, PA.
Bain A.C., Meaney D.F. (2000) Tissue-level thresholds for axonal damage in an experimental

Takhounts et al. / Stapp Car Crash Journal 47 (October 2003) 107-133 129
model of central nervous system white matter injury. J Biomech Eng. 122(6): 615-22.
Bandak, F.A., and Eppinger, R.H. (1995) A three-
dimensional finite element analysis of the human brain under combined rotational and translational acceleration. Stapp Car Crash Journal 38:145-163.
Bandak, F.A., Zhang, A. X., Tannous, R. E., DiMasi, F., Masiello, P., Eppinger, R., (2001) Simon: a simulated injury monitor; application to head injury assessment. ESV 17th International Technical Conference on the Enhanced Safety of Vehicles, National Highway Traffic Safety Administration, Washington, DC.
Belytschko, T.B. (1974) Finite element approach to hydrodynamics and mesh stabilization. In Computation Methods in Nonlinear Mechanics, ed. Oden, J.T. et al. The Texas Institute for Computational Mechanics.
Belytschko, T.B. and Kennedy, J.M. (1978) Computer models for subassembly simulation. Nucl. Engng. Des. 49: 17-38.
Belytschko, T.B. and Tsay, C.S. (1983). A stabilization procedure for the quadrilateral plate element with one-point quadrature. International Journal for Numerical Methods in Engineering, Volume 19, 405-420.
Belytschko, T.B. and Bindeman, L.P. (1993) Assumed strain stabilization of the eight node hexahedral element. Computer Methods in Applied Mechanics and Engineering, Volume 105, 225-260.
Blumbergs, P.C., Grace, S., Manavis, J., Wainwright, H., Simpson, D.A., McLean, A.J. (1995) Topography of axonal injury as defined by amyloid precursor protein and the sector scoring method in mild and severe closed head injury. J. Neurotrauma 12(4): 565-572.
CDC, National Center for Injury Prevention and Control, ‘Traumatic Brain Injury Facts’, http://www.cdc.gov/ncipc/factsheets/tbi.htm, 2003.
Christman, C.W., Grady, M.S., Walker, S.A., Holloway, K.L., Povlishock, J.T. (1994) Ultrastructural studies of diffuse axonal injury in humans. J. Neurotrauma 11: 173-186.
Darvish, K.K., Crandall, J.R. (2001) Nonlinear viscoelastic effects in oscillatory shear deformation
of brain tissue. Medical Engineering and Physics 23: 633-645.
DiMasi, F.P., Eppinger, R.H., Bandak, F.A. (1995) Computational analysis of head impact response under car crash loadings. Proc. 39th Stapp Car Crash Conference, pp. 425-438. Society of Automotive Engineers, Warrendale, PA.
Donnelly, B. R. and Medige, J. (1997) Shear properties of human brain tissue. J. Biomech. Engng 119, 423-432.
Flanagan, D.P. and Belytschko, T. (1981) A uniform strain hexahedron and quadrilateral with orthogonal hourglass control. Int. J. Numer. Meth. Eng. 17: 679-706.
Gennarelli, T.A., Thibault, L.E., Adams, J.H., Graham, D.I., Thompson, C.J., and Marcincin, R.P. (1982a) Diffuse axonal injury and traumatic coma in the primate. Annals of Neurology 12(6): 564-574.
Gennarelli, T.A. and Thibault, L.E. (1982b) Biomechanics of acute subdural hematoma. J. Trauma 22(8): 680-686.
Hardy, W.N., Foster, C., Mason, M., Yang, K., King, A., Tashman, S. (2001) Investigation of head injury mechanisms using neutral density technology and high-speed biplanar X-ray. Stapp Car Crash Journal 45: 337-368.
Haut, R.C. and Lee, M.C. (1989) Insensitivity of tensile failure properties of human bridging veins to strain rate: implications in biomechanics of subdural hematoma. Journal of Biomech. 22(6-7):537-42.
Hodgson VR, Gurdjian ES, Thomas LM. (1966)
Experimental skull deformation and brain displacement demonstrated by flash x-ray technique. Journal of Neurosurgery. Nov 25(5):549-52.
Kleiven, S. and Hardy, W.N. (2002) Correlation of an
FE model of the human head with local brain motion – consequences for injury prediction. Stapp Car Crash Journal 46: 123-144.
Kosloff, D. and Frazier G.A. (1978) Treatment of hourglass patterns in low order finite element codes. Int. J. Num. Anal. Meth. Geomech. 2: 57-72.
130 Takhounts et al. / Stapp Car Crash Journal 47 (October 2003) 107-133
LS-DYNA Keyword User’s Manual (2003) Vol I and II, Version 960, Livermore Software Technology Corporation, Livermore, CA.
Lowenhielm, P. (1974) Dynamic properties of the parasagittal bridging veins, Z. Rechtsmedizin 74: 55-62.
Maxwell, W.L., Povlishock, J.T., Graham, D.L. (1997) A mechanistic analysis of nondisruptive axonal injury: A review. J. Neurotrauma 14(7): 419-440.
Meaney, D.F, Smith, D., Ross, D.T., and Gennarelli, T.A. (1993) Diffuse axonal injury in the miniature pig: Biomechanical development and injury threshold. ASME Crashworthiness and occupant protection in transportation systems 25: 169-175.
Monson, K.L. (2001) Mechanical and failure properties of human cerebral blood vessels. Dissertation. University of California, Berkeley.
Nusholtz, G.S., Lux, P., Kaiker, P., and Janicki, M.A., (1984) Head impact response skull deformation and angular accelerations. Proc. 28th Stapp Car Crash Conference, pp. 41-74. Society of Automotive Engineers, Warrendale, PA.
Nusholtz, G.S., Wylie, B., and Glascoe, L.G. (1995) Cavitation/boundary effects in a simple head impact model. Aviation Space & Environmental Medicine 66(7): 661-667.
Oka, K., Rhoton, A.L., Barry, M., and Rodriguez, R.
(1985) Microsurgical anatomy of the superficial veins of the cerebrum. Neurosurgery. 17(5), 711-748.
Omori, K., Zhang, L., Yang, K.H., and King, A. I
(2000) Effect of cerebral vasculatures on the mechanical response of brain tissue: A preliminary study. ASME International Mechanical Engineering Congress & Exposition. Orlando, Florida.
Ono, K., Kikuchi, A., and Nakamura, M. (1980)
Human head tolerance to sagittal impact - reliable estimation deduced from experimental head injury using subhuman primates and human cadaver skulls. Proc. 24th Stapp Car Crash Conference, pp 101-160. Society of Automotive Engineers, Warrendale, PA.
Oppenheimer, D.R. (1968) Microscopic lesions in the brain following head injury. J. Neurol. Neurosurg. Psychiatry 31: 299-306.
Povlishock, J.T. and Christman, C.W. (1995) The pathobiology of traumatically induced axonal injury in animals and humans: A review of current thoughts. J. Neurotrauma 12(4): 555-564.
Ruan, J.S., Khalil, T., King, A.I. (1993) Finite element modeling of direct head impact. Stapp Car Crash Journal 37:69-81.
Simpson, R.H.W., Berson, D.S., Shapiro, H.A. (1985) The diagnosis of diffuse axonal injury in routine autopsy practice. Forensic Sci. Int. 27: 229-235.
Stalnaker, R.L., Alem, N.M., Benson, J.B., Melvin, J.W. (1977) Validation studies for head impact injury model. Final report DOT HS-802 566. National Highway Traffic Safety Administration, U.S., Department of Transportation, Washington, DC.
Takhounts, E. G. (1998) Experimental determination of constitutive equations for human and bovine brain tissue. Ph. D. thesis. University of Virginia, Charlottesville, Virginia.
Takhounts, E.G., Crandall, J.R., Darvish, K.K. (2003) On the importance of nonlinearity of brain tissue under large deformations. Stapp Car Crash Journal 47: 79-92.
Thibault, L.E., Galbraith, J.A., Thompson, C.J., Gennarelli, T.A. (1981) The effects of high strain rate uniaxial extension on the electrophysiology of isolated neural tissue. ASME Advances in Bioengineering: 211-214.
Thurman D. (2001) The epidemiology and economics of head trauma. In: Miller L. and Hayes R., editors. Head Trauma: Basic, Preclinical, and Clinical Directions. Wiley and Sons, New York.
Yoganandan, N., Pintar FA, Sances A Jr, Walsh PR, Ewing CL, Thomas DJ, Snyder RG. (1995) Biomechanics of skull fracture. Journal of Neurotrauma. Aug. 12(4):659-68.
Zhang, L., Yang, K.H., Dwarampudi, R., Omori, K.,
Li, T., Chang, K., Hardy, W.N., Khalil, T.B., King, A.I. (2001) Recent advances in brain injury research: a new human head model development and validation. Stapp Car Crash Journal 45: 369-394.

Takhounts et al. / Stapp Car Crash Journal 47 (October 2003) 107-133 131
APPENDIX A: Frontal NCAP and Side Impact Data
Table A1. Frontal NCAP impact data.
NHTSA Test #/
Occupant HIC15 HIC36
Max Absolute Angular Accel
(rad/s^2)
Max Absolute Angular Velocity
(rad/s) Vehicle Description Test Configuration
4303-01 156.4 270.8 1725.4 25.0 2003 HONDA PILOT Vehicle into Barrier
4242-01 177.9 300.6 1757.1 24.6 2002 HONDA ODYSSEY Vehicle into Barrier
4205-02 187.6 340.4 3068.8 20.7 2002 FORD THUNDERBIRD Vehicle into Barrier
4273-01 192.8 341.5 2774.2 18.9 2002 MINI COOPER Vehicle into Barrier
4198-01 220.4 362.6 2318.5 21.5 2002 SATURN VUE Vehicle into Barrier
3897-01 238.4 389.8 2891.7 29.2 2002 MITSUBISHI ECLIPSE Vehicle into Barrier
4266-02 243.3 392.0 1756.9 22.9 2003 TOYOTA COROLLA Vehicle into Barrier
4247-01 285.1 425.0 1761.3 21.7 2002 MAZDA MPV Vehicle into Barrier
3916-01 286.6 473.1 1962.7 28.2 2002 TOYOTA SEQUOIA Vehicle into Barrier
4081-02 287.3 453.9 2952.2 39.2 2002 JEEP LIBERTY Vehicle into Barrier
4264-02 287.7 552.8 2167.6 30.7 2002 SUBARU IMPREZA Vehicle into Barrier
3901-02 294.5 460.0 1972.7 29.6 2002 CHEVROLET BLAZER Vehicle into Barrier
4250-01 315.6 459.5 1653.8 28.4 2002 KIA SPECTRA Vehicle into Barrier
4251-01 317.7 560.4 2930.5 22.4 2002 SUBARU LEGACY Vehicle into Barrier
4215-02 322.3 519.3 3603.6 20.4 2002 NISSAN ALTIMA Vehicle into Barrier
4237-02 328.7 502.7 3852.7 40.0 2002 NISSAN FRONTIER Vehicle into Barrier
4080-01 335.6 403.2 2317.7 28.4 2002 FORD FOCUS Vehicle into Barrier
4205-01 337.3 516.3 3855.4 29.0 2002 FORD THUNDERBIRD Vehicle into Barrier
4090-01 341.1 492.4 1303.0 25.9 2002 MITSUBISHI LANCER Vehicle into Barrier
4264-01 345.3 478.6 1706.1 19.5 2002 SUBARU IMPREZA Vehicle into Barrier
4090-02 350.2 539.5 2903.3 25.3 2002 MITSUBISHI LANCER Vehicle into Barrier
4223-02 354.6 533.0 1968.6 32.9 2002 FORD EXPLORER Vehicle into Barrier
4267-02 362.4 583.6 3207.9 25.4 2002 ISUZU AXIOM Vehicle into Barrier
4215-01 364.1 497.9 1591.2 21.1 2002 NISSAN ALTIMA Vehicle into Barrier
4242-02 365.9 454.8 2508.3 27.1 2002 HONDA ODYSSEY Vehicle into Barrier
4259-01 369.7 522.1 2519.9 30.8 2003 CADILLAC CTS Vehicle into Barrier
3987-01 375.8 490.7 2013.7 27.3 2002 LEXUS ES300 Vehicle into Barrier
3915-01 378.0 652.4 7942.4 36.5 2002 TOYOTA TUNDRA Vehicle into Barrier
4255-02 378.5 597.7 2438.1 22.5 2003 ACURA 3.2 TL Vehicle into Barrier
4235-01 380.6 537.6 1532.5 18.9 2002 LAND ROVER DISC. II Vehicle into Barrier
4235-02 388.3 567.3 2132.2 16.3 2002 LAND ROVER DISC. II Vehicle into Barrier
4265-02 405.2 466.9 3405.5 48.4 2002 TOYOTA HIGHLANDER Vehicle into Barrier
4249-02 410.6 570.4 2525.9 37.5 2002 NISSAN XTERRA Vehicle into Barrier
4240-01 413.2 656.6 1931.2 25.2 2002 DODGE RAM1500 Vehicle into Barrier

132 Takhounts et al. / Stapp Car Crash Journal 47 (October 2003) 107-133
4237-01 414.0 592.2 1844.1 27.5 2002 NISSAN FRONTIER Vehicle into Barrier
4259-02 438.8 661.6 2775.6 31.8 2003 CADILLAC CTS Vehicle into Barrier
4198-02 525.0 770.9 2201.4 28.0 2002 SATURN VUE Vehicle into Barrier
3915-02 532.9 737.2 7282.5 40.3 2002 TOYOTA TUNDRA Vehicle into Barrier
3952-01 540.8 787.6 4079.9 31.7 2002 BUICK RENDEZVOUS Vehicle into Barrier
3901-01 613.2 777.3 2433.4 31.0 2002 CHEVROLET BLAZER Vehicle into Barrier
4241-01 648.0 907.0 3094.7 24.0 2002 ISUZU RODEO Vehicle into Barrier
4252-01 652.2 969.9 3301.9 23.5 2002 DODGE DAKOTA Vehicle into Barrier
3952-02 820.8 940.6 4903.9 35.2 2002 BUICK RENDEZVOUS Vehicle into Barrier
Table A2. Side impact data.
NHTSA Test #/
Occupant HIC15 HIC36
Max Absolute Angular Accel
(rad/s^2)
Max Absolute Angular Velocity
(rad/s) Vehicle Description Test Configuration
3800-01 42.5 73.8 4527 30.3 2002 FORD ESCAPE ES-2 ATD Evaluation NCAP lateral impact test
4551-01 53.7 69.0 2574 26.3 2002 CHEVROLET IMPALA FMVSS 214 side impact test - 2002 Chevrolet Impala 4 door
3875-01 56.9 67.7 3537 46.7 2001 HONDA ODYSSEY ES-2 ATD Evaluation NCAP side impact test
3899-01 71.1 73.8 4800 33.2 2002 TOYOTA TUNDRA ES-2 ATD Evaluation NCAP side impact test
3818-01 90.9 114.1 2497 23.4 1999 SAAB 9-5 ES-2 ATD Evaluation rigid pole side impact
4547-01 93.4 136.7 5455 60.5 2001 FORD FOCUS FMVSS 214 - 2001 Ford Focus 4 door
4380-01 110.0 137.9 5216 32.2 2002 CHEVROLET IMPALA NCAP side impact test - 2002 Chevrolet Impala 4 door
3845-01 142.0 164.4 4559 31.8 1999 FORD WINDSTAR ES-2 ATD Evaluation - rigid pole side impact
4497-01 143.9 170.8 2248 25.7 2000 SAAB 9-5 Rigid pole side impact - 2000 SAAB 9-5, 4 door with side airbag
4547-04 161.3 174.2 7362 36.4 2001 FORD FOCUS FMVSS 214 - 2001 Ford Focus 4 door
3898-01 185.8 208.1 3720 21.1 2002 FORD EXPLORER ES-2 ATD Evaluation – Rigid pole side impact
4551-04 186.5 186.5 3785 30.1 2002 CHEVROLET IMPALA FMVSS 214 side impact test - 2002 Chevrolet Impala 4 door
3799-04 188.0 188.0 8771 38.4 2001 FORD FOCUS ES2 ATD Evaluation NCAP lateral impact test
4380-04 189.7 213.2 7545 35.3 2002 CHEVROLET IMPALA NCAP side impact test - 2002 Chevrolet Impala 4 door
3820-01 214.2 238.7 5184 28.1 1999 VOLVO S80 ES-2 ATD Evaluation - Rigid pole side impact

Takhounts et al. / Stapp Car Crash Journal 47 (October 2003) 107-133 133
4456-04 216.0 236.1 7358 32.9 2001 FORD FOCUS NCAP side impact test - 2001 Ford Focus 4 door
3819-04 218.7 220.2 2764 38.9 2001 BUICK LESABRE ES-2 ATD Evaluation NCAP side impact test
4456-01 224.7 272.2 6042 75.4 2001 FORD FOCUS NCAP side impact test - 2001 Ford Focus 4 door
3799-01 226.8 299.3 6501 73.4 2001 FORD FOCUS ES2 ATD Evaluation NCAP lateral impact test
4378-01 242.7 243.0 8599 25.6 2000 SAAB 9-5 Rigid pole side impact -2000 SAAB 9-5, 4 door with side airbag
4292-01 249.2 249.3 5792 41.6 1999 CHEVROLET PRIZM Lateral impact test - 1999 Ford F-150 into 1999 Chevrolet Prizm
4498-01 260.3 328.9 4450 35.4 1999 VOLVO S80 Rigid pole side impact -1999 Volvo S80, side seat & curtain airbags
3803-04 283.7 283.7 4571 31.0 2002 CHEVROLET IMPALA ES-2 ATD Evaluation NCAP type side impact test
3802-01 292.0 313.4 2149 29.4 1999 MERCURY COUGAR ES2 ATD Evaluation - Rigid pole side impact
4292-04 298.8 298.8 12229 32.6 1999 CHEVROLET PRIZM Lateral impact test- 1999 Ford F-150 into 1999 Chevrolet Prizm
3803-01 307.1 307.1 7660 36.4 2002 CHEVROLET IMPALA ES-2 ATD Evaluation NCAP type side impact test
4482-01 314.3 314.3 6513 34.1 1999 CHEVROLET PRIZM
Lateral impact test - 1999 Ford F-150 into 1999 Chevrolet Prizm 4 door
3800-04 370.2 370.2 12770 54.9 2002 FORD ESCAPE ES-2 ATD Evaluation NCAP lateral impact test
4471-01 609.3 629.4 4381 30.2 2002 FORD EXPLORER Rigid pole side impact - 2002 Ford Explorer
4313-01 667.6 670.4 3793 24.1 2001 SATURN L200
Rigid pole side impact - 2001 Saturn L200 4 door w/side curtain airbag
3819-01 694.1 694.1 18609 48.2 2001 BUICK LESABRE ES-2 ATD Evaluation NCAP side impact test
4086-01 3985.5 3985.5 20250 65.2 1999 CADILLAC DE VILLE IIHS lateral impact test - 1999 Cadillac Deville, no side airbags
4284-01 5253.5 5253.5 76365 32.3 2000 NISSAN MAXIMA
285 deg Rigid pole side impact- 2000 Nissan Maxima with side airbag
4285-01 11982.6 11982.6 124080 43.5 2000 NISSAN MAXIMA
285 deg Rigid pole side impact- 2000 Nissan Maxima w/out side airbag
4423-01 12143.4 12143.4 120980 41.5 2000 NISSAN MAXIMA Rigid pole side impact -2000 Nissan Maxima, 4 door
4246-01 15151.2 15151.2 136910 41.8 2001 SATURN L200
Rigid pole side impact -2001 Saturn L200 – no side or curtain airbag
4365-01 15590.6 15590.6 128960 49.9 2000 NISSAN MAXIMA Rigid pole side impact -2000 Nissan Maxima - no airbag