Embed Size (px)
Citation preview
Deep-Sea Research, 1965, Vol. 12, pp. 129 1o 142. Pergamon Press Ltd. Printed in Great Britain.
On the contribution of overflow water from the Norwegian Sea to the hydrographic structure of the North Atlantic Ocean
ARTHUR LEE* a n d DAVID ELLETT*
(Received 28 August 1964)
Abstract - -The spread of Norwegian Sea deep water, which overflows the Scotland-Greenland Ridge, into the north-eastern and north-western basins of the Nor th Atlantic is examined on the basis of salinity anomaly and dissolved oxygen content. It is shown that the water mass produced by the overflow into the north-eastern basin is found on the eastern flank of the Mid-Atlantic Ridge and eventually forms a belt across the basin at 2500-3500m depth. This water can be traced to latitude 47°N, and perhaps to 43°N. The water mass produced by the overflow into the north- western basin occurs on the East Greenland continental slope and eventually fills the bot tom of tha t basin and gives rise to a southerly flow along the western boundary of the Atlantic. It mixes with the Labrador Sea water above it to form the Nor th Atlantic Deep Water.
I N T R O D U C T I O N
THE structure of the eastern North Atlantic has recently been examined by COOPER (1961) who has used temperature, salinity and dissolved oxygen observations made with closely-spaced water bottles at a station named Cavall in the northern Bay of Biscay, 70 nautical miles from the continental slope in 4700 m depth. He puts forward the speculative suggestion that below about 2000 m depth there is a multiple sandwich structure consisting of a series of resident water masses, each in completely neutral adiabatic equilibrium and separated from each other by intrusive plates of water derived from the overflow of the Greenland-Scotland submarine ridge by boluses of Norwegian Sea deep water. To see whether the type of structure found by Cooper occurs elsewhere in the north-eastern Atlantic we have made temperature and salinity observations with closely-spaced bottles from the Research Vessel Ernest Holt at a station .(F) to the south-west of Ireland in position 50 ° 15'N, 13 ° 56'W, and from weather ships at Ocean Weather Stations duliett (52 ° 38'N, 20 ° 00'W) and Kilo (45 ° 00'N, 16 ° 00'W). In addition to sampling at the usual standard depths an attempt was made to sample at 25 m intervals between 1700 and 2250 m and particularly between 1800 and 2000 m, the depths where the so- called Merlin complex of Cooper occurs. The observations at station F have already been examined by COOPER, JONES and LEE 0962).
O B S E R V A T I O N S B E T W E E N 1 7 0 0 A N D 2 2 5 0 m
The vertical potential temperature and salinity profiles between 1700 and 2250 m at the three stations are shown in Fig. 1. Salinities were determined with a conduc- tivity bridge and the standard deviations of the temperature and salinity observations
*Fisheries Laboratory, Lowestoft, Suffolk, England.
129

130 ARTHUR LEE and DAVID ELLETT
are 0.02°C and 0"003~oo respectively : the profiles have been smoothed in accordance with these values. The main feature of all three s~ilinity profiles is the minimum at about 1850 m at Ocean Weather Station Juliett a.nd station F, and at about 1900 m at Ocean Weather Station Kilo.
In Fig. 2 the observations at the three stations have been plotted on a potential temperature-salinity (0-S) diagram. All the 0-S curves show a pronounced change of slope near the sigma-theta value of 27.8, i.e. at the salinity minimum. Also plotted in Fig. 2 are (a) the 0-S curve which is made up of over 3000 I.G.Y. measurements below 4°C in water deeper than 1000 m in the western North
180C
2000
2200
netres
4 , , , , i , , , , I
I I S°/*"
6, 3 4°; I • l ( ' 'L ' ' ' ' , . . . . ]
ji 34.9
K I LO
4
II
S %, %'9 350 950 349 350
STN. F JULIETT
Fig. 1. Temperature and salinity profiles at Station F and at Ocean Weather Stations Kilo and Juliett.
Atlantic south of the South-East Newfoundland Ridge and which is given by WORTHINGTON and MEXCALF (1961): (b) the extreme characteristics of the two water masses which according to Worthington and Metcalf cause deviations f rom this curve in the eastern Nor th Atlantic north of 40°N : these are deep water from the Labrador Sea and the overflow from the Norwegian Sea into the north-eastern Atlantic across the Iceland-Scotland Ridge. It can be seen that the salinity minima in our curves are due to the influence of Labrador Sea water, but that below these minima the curves tend to the point marking the Norwegian Sea overflow rather

On the contribution of overflow water from the Norwegian Sea 131
than that marking the North Atlantic Deep Wate r : the change in slope of Worthington and Metcalf's 8-S curve at 1.9°C represents the transition from North Atlantic Deep Water to Antarctic Bottom Water. Our curves would seem to indicate that the influence of the overflow water can be felt below 2000 m in the triangle in the north-eastern Atlantic formed by our stations. Using the deviations from their 8-S curve Worthington and Metcalf give salinity anomaly charts for the 8 ranges 3.51°-4-00°C, 3.01°-3.51°C and 1.76°-2.00°C in the Atlantic Ocean.
l,.O
3.5
,~ 3.0
.~ 2"5
E
2.0
1.5
/ o x.;. .- . / . .
LAORADOR SEA 5
1 ' ~ I r
MEAN W.ATLANTIC 9-S CURVE ( WORTHINGTON i METCALF ]
0 0
ICELAHD-$COTLANO OVERFLOW WATER
DEEP WATER
-ANTARCTIC BOTTOM WATER
* $tn.'F ' x " lil0" o • Julie',t'
3&.B5 3t,,go 3c,.95 35.00 35.05 SALINITY % ,
F i g . 2. P o t e n t i a l t e m p e r a t u r e - s a l i n i t y ( 0 - S ) d i a g r a m f o r S t a t i o n F a n d O c e a n W e a t h e r S t a t i o n s Kilo a n d Juliett.
The Labrador Sea water causes a negative anomaly and the Norwegian Sea overflow causes a positive anomaly : Mediterranean water also causes a positive anomaly. These three water masses are clearly delineated in their charts for the two higher temperature ranges, and the Norwegian Sea overflow is seen to be confined to the eastern flank of the Mid-Atlantic Ridge north of 57°N latitude. To see if its influence extends further afield we have constructed vertical sections showing the salinity in the north-eastern Atlantic at depths greater than 1000 m. To do this we have used
132 ARTHUR LEE and DAVID ELLEIT
I.G.Y. sections shown in the atlas of FUGLISTER (1960) and have expressed the temperature and salinity data given in it as salinity anomalies from the O-S curve of Worthington and Metcalf. These latter authors put the standard deviation f rom
O/ their mean curve below 2.5~C as being between 0.003 ° and 0"006:00. This is remarkably small and it has allowed us to draw the contours on our sections with a fair amount of confidence. We have used an interval of 0.01 °/ ,'oo and thus an
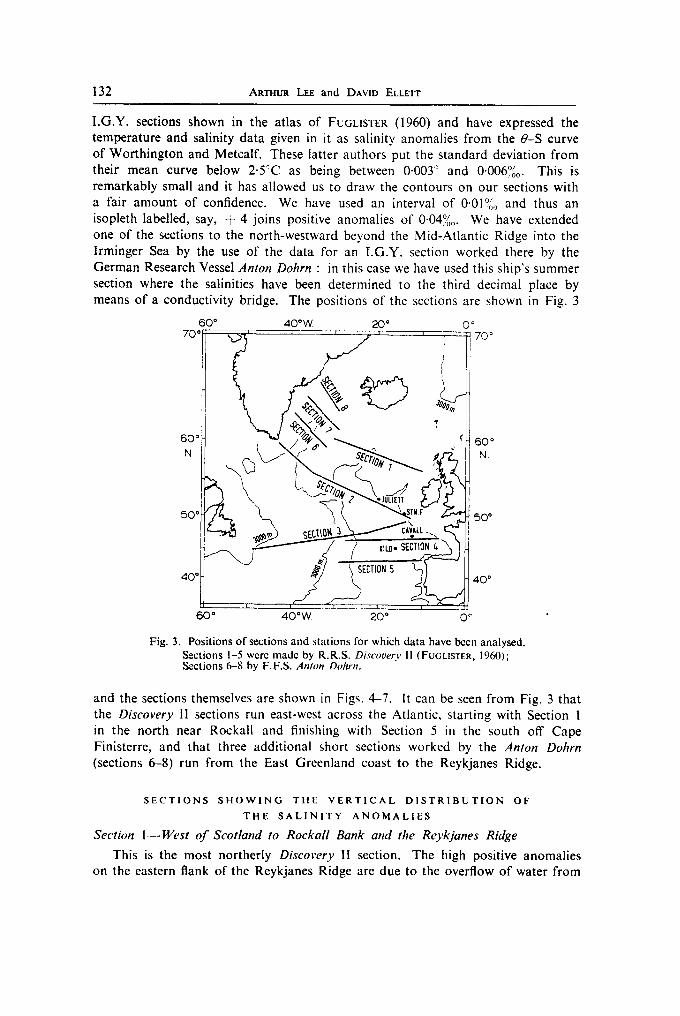
o/ isopleth labelled, say, ,-7- 4 joins positive anomalies of 0.04°°. We have extended one of the sections to the north-westward beyond the Mid-Atlantic Ridge into the Irminger Sea by the use of the data for an I .G.Y. section worked there by the German Research Vessel Anton Dohrn : in this case we have used this ship's summer section where the salinities have been determined to the third decimal place by means of a conductivity bridge. The positions of the sections are shown in Fig. 3
60* 40*W. 20 ° 0 °
/
t .
.7 t
I 6N':' --, .
40* X ~ ~ , ~
I I I
60* 40*W 20* 0"
I 70°
i
60 ° N
50*
40 °
Fig. 3. Positions of sections and stations for which data have been analysed. Sections I-5 were made by R.R.S. Discovery 11 (FUGLlSTER, 1960); Sections 6-8 by F.F.S. Anton Dohrn.
and the sections themselves are shown in Figs. 4-7. It can be seen from Fig. 3 that the Discovery II sections run east-west across the Atlantic, starting with Section 1 in the north near Rockall and finishing with Section 5 in the south off Cape Finisterre, and that three additional short sections worked by the Anton Dohrn (sections 6-8) run from the East Greenland coast to the Reykjanes Ridge.
SECTIONS SHOWING THE VERTICAL DISTRIBUTION OF THE SAL1NITY ANOMALIES
Section 1--West of Scotland to Rockall Bank and the Reykjanes Ridge
This is the most northerly Discovery II section. The high positive anomalies on the eastern flank of the Reykjanes Ridge are due to the overflow of water from

On the contribution of overflow water from the Norwegian Sea 133
2000
31111
l}I ~1[I11 II lll, l lt~O l]l 1130 31~I
~ i . O, 1
~ z C * u
+6
SEC'f ION 7
IN~gN ~#IN O~$~vtlh I1
~~~ ! ~;~ - , ...2.-~,.
" ' " . ~ t ~:i'i~,'-'<-",~./," "-:-"~ •
• ' 7 ~ V } . " A - ~ : h . . : - - " : - - "
SECTION 2
/
- 200:3
- 3000
&O00
0 500 kms /
m e t r e s m e t r e l
Fig. 4. Sections 1 and 2 : Salinity anomalies in parts per 100,000. The zone of positive anomaly is shaded.
the Norwegian Sea through the channel between the Faroe Islands and Faroe Bank and across the Iceland-Faroe Ridge, while the negative anomalies are due to Labrador Sea water• It would appear that the Norwegian Sea overflow also makes its influence felt at the eastern foot of the Rockall Bank and at depths between
~PSCIVE~ H 0 ~11 ~1S ~20 3~2~ 3~30 353S 3S~O 2~2 0
1;; . . . . . . . . . . . . . . . . . . . . . . . . . . . . ~ . . ~ . ; ~ . , . ~ ,. l : ~.//: ! ~ooo
2o0o r.~-.'~kl/L,._:...\ ~"/,., . "~ t , - - , . / . - 4 - - ' , , . ~ " / ~'\ . . . . . . ' • .-:--.-2~_" ~ 2000 • " ~ i ' , . k S J / ' _ > / - _ - - / ' " ~ . j ~ - ~ f • /-'(
= , . , , - , < . . . . ,o,o
..... '~:~':': ' . j . " " ">:: t~: , • ::i
&O00 ~ ? * " ............. :! " ............. ' : ~ SECTION 3 ' l : ~ " ~ ~ &BOO
• 2 0 500 kms , 5 0 0 0 ' ' ' ' ' ' 5 0 0 0
metres • metres
Fig. 5. Section 3 : Salinity anomalies in parts per 100,000. The zone of positive anomaly is shaded.

134 ARTHUR LEE and DAVID ELLETr
1000
3006
,5000
. , , , , , , ,
"[]~\'L~" "i e7 ~)I. l~i,/I.l~\':~7,,, , . \ . v / : ~ ' . '.-~lit f l " I ! i . . t t ~
© •
, \_I N . ; / ' ~
74- ~'~~.1~o ,~-,, • • ( \ " i ;1 \
S E C T I O N 4
J
metres
0 500
OlStOv[ l t : :
3190 ~ lg i 3 i ~ 3900
7 0 i i
10[~
7
2000
i
I t 3000 7
! I I ~000
1
J 5~ metres
Fig. 6. Sections 4 and 5 : Salinity anomalies in parts per 100,000. The zone of positive anomaly is shaded.
1500 and 2000 m in the channel between Rockall Bank and Scotland. It is not easy to see how this can occur unless there is a so far undiscovered gap in the Wyville Thomson Ridge which allows Norwegian Sea deep water to enter the Atlantic to the east of the Rockall Bank: this is unlikely. Another explanation of these positive anomalies is that they are due to water of high salinity which is cooled in
ANION BO Hltld
Z~27 2 ~ 0 l % ] ~11 ZSI..~ 2MO ~ 0 6 T '~ I 2506 2 5 % 2S90 2~N 21,96 ? L ~
0 . . . . . 1000
~ ~\ i,7 ~ I~ ~I '~j~ / ? :~ ~ I ~ ~ ~ i ~ ? 2~0 .~;t ~~2~ u ! ~ j j 0 " ~ -2~i '!. " ~000
• . ". • . ~ . L ~ . . ~i:i~;i!iiiil ~
SECTION 8
I +: SECTION 7
3000 01 , i 3100kms ~ 3[][~ ,SECTION 6 metres metres
Fig. 7. Sect ions 6, 7 and 8 : Salinity anomal ies in parts per 100,000. The zone o f posit ive a n o m a ly is shaded.

On the contribution of overflow water from the Norwegian Sea 135
winter on the Rockall Bank and the continental shelf west of the British Isles and which cascades down into the deep channel. This process has been described by NANSEN (1913) as taking place at Rockall and by COOPER and VAUX (1949) as taking place to the south of Ireland, but Cooper and Vaux were only able to trace the cascading down to 1200 m depth. Yet a further possibility is that part of the over- flow through the channel between the Faroe Islands and Faroe Bank turns southward along the foot of the western slope of Bill Bailey's Bank and Lousy Bank to enter the basin east of Rockall, either by passing through a gap between George Bligh Bank and Lousy Bank or by rounding the southern extremity of the Rockall Bank. Support for this explanation is given by the fact that STEELE, BARRETT and WORTHINGTON (1962) show water of overflow origin at the foot of the western slope of Lousy Bank. TULLOCH and TAIT (1959) on the basis of a survey carried out in June 1951 between Ireland and Scotland in the east and Rockall Bank in the west claim that two waters reach the trough east of Rockall Bank by a route around the southern .end of that bank. These waters are Norwegian Sea deep water and the Arctic Intermediate Water of HELLAND-HANSEN and NANSEN (1909), which occurs on the northern slope of the Iceland-Faroe Ridge at 300- 400 m depth. We have examined Tulloch and Tait's data and found that all the O-S curves follow a line joining the points defining North Atlantic Central Water and Labrador Sea water respectively. We can find no evidence of positive anomalies due to the Norwegian Sea overflow, except at one point near the Porcupine Bank close to the bottom at 3000 m depth. As will be seen below, our Section 2 passes near this point and shows positive anomalies at that depth. There is no sign of any Norwegian Sea overflow as defined by us rounding the southern end of the Rockall Bank.
Section 2--South of lreland to the Reykjanes Ridge and Cape Farewell
A zone of high positive anomalies can be seen on the eastern side of the Reykjanes Ridge but they are smaller than those on Section 1 : this shows the southward progress of the Norwegian Sea overflow. At about 2500-3500 metres a belt of positive anomalies stretches right across the section from the Reykjanes Ridge and the magnitude of the anomalies seems to decrease from west to east. It seems evident that the Norwegian Sea overflow is influencing the whole of this zone. Above it, to at least 1500 m depth in the eastern part of the section and to 1000 m depth in the western part, large negative anomalies due to Labrador Sea water are found. Below it very small negative anomalies occur.
The section passes close to two of the three stations where we have taken closely- spaced samples, viz. Ocean Weather Station Juliett and station F. These stations have been compared with the section and the magnitude of the anomalies at them is in good agreement with the anomalies found for the I.G,Y. stations. The anomalies for Ocean Weather Station Juliett agree particularly closely with those for Discovery Station 3857, and those for our station to the south-west of Ireland are of the same magnitude as those for Discovery Station 3861 but indicate a thinner zone of Labrador Sea water.
This section has been extended to the westward of the Reykjanes Ridge to Cape Farewell by the use of the I.G.Y. observations made by the German Research Vessel Anton Dohrn. Positive anomalies occur on the westward slope of the ridge,
136 AR'rm~ LEE and DAVrD Eu.E'r'r
showing that at some point the overflow water has passed through a gap in it and entered the western basin of the North Atlantic: this is in agreement with the findings of HERMANlq (1956). At the western end of the section, off southern Greenland, high positive anomalies are found on the continental slope below 2000 m depth. These are caused by the overflow of Norwegian Sea water across the Iceland-Greenland Ridge into the Irminger Sea shown by DmTRXCH (1961). Thus the Irminger Sea basin receives two overflows.
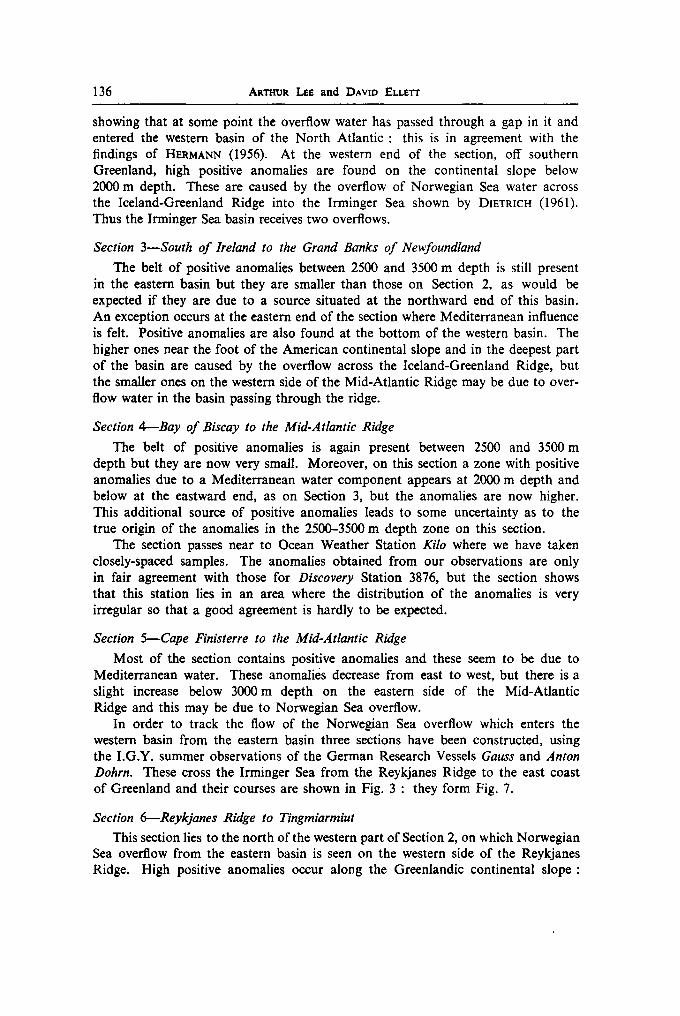
Section 3mSouth of Ireland to the Grand Banks of Newfoundland
The belt of positive anomalies between 2500 and 3500 m depth is still present in the eastern basin but they are smaller than those on Section 2, as would be expected if they are due to a source situated at the northward end of this basin. An exception occurs at the eastern end of the section where Mediterranean influence is felt. Positive anomalies are also found at the bottom of the western basin. The higher ones near the foot of the American continental slope and in the deepest part of the basin are caused by the overflow across the Iceland-Greenland Ridge, but the smaller ones on the western side of the Mid-Atlantic Ridge may be due to over- flow water in the basin passing through the ridge.
Section 4 Bay of Biscay to the Mid-Atlantic Ridge
The belt of positive anomalies is again present between 2500 and 3500 m depth but they are now very small. Moreover, on this section a zone with positive anomalies due to a Mediterranean water component appears at 2000 m depth and below at the eastward end, as on Section 3, but the anomalies are now higher. This additional source of positive anomalies leads to some uncertainty as to the true origin of the anomalies in the 2500-3500 m depth zone on this section.
The section passes near to Ocean Weather Station Kilo where we have taken closely-spaced samples. The anomalies obtained from our observations are only in fair agreement with those for Discovery Station 3876, but the section shows that this station lies in an area where the distribution of the anomalies is very irregular so that a good agreement is hardly to be expected.
Section 5---Cape Finisterre to the Mid-Atlantic Ridge
Most of the section contains positive anomalies and these seem to be due to Mediterranean water. These anomalies decrease from east to west, but there is a slight increase below 3000 m depth on the eastern side of the Mid-Atlantic Ridge and this may be due to Norwegian Sea overflow.
In order to track the flow of the Norwegian Sea overflow which enters the western basin from the eastern basin three sections have been constructed, using the I.G.Y. summer observations of the German Research Vessels Gauss and Anton Dohrn. These cross the Irminger Sea from the Reykjanes Ridge to the east coast of Greenland and their courses are shown in Fig. 3 : they form Fig. 7.
Section 6---Reykjanes Ridge to Tingmiarmiut
This section lies to the north of the western part of Section 2, on which Norwegian Sea overflow from the eastern basin is seen on the western side of the Reykjanes Ridge. High positive anomalies occur along the Greenlandic continental slope •

On the contribution of overflow water from the Norwegian Sea i 37
these are caused by overflow across the Iceland-Greenland Ridge. Smaller positive anomalies occur on the western side of the Reykjanes Ridge below 1000 m depth. On the whole they are smaller in magnitude and are less extensive than those found on this side of the ridge on Section 2. Two rather higher anomalies occur between 1240 and 1485 m, however. The eastern end of this section is only a short distance southward from the western end of Section 1. On Section 1 the overflow water can be seen reaching to within 1000 m of the surface, and it thus appears likely that in about 60°N latitude the upper part of the overflow in the eastern basin crosses the Reykjanes Ridge at a depth of about 1000 m. As the ridge decreases in height towards the south so the deeper parts of the overflow cross it as they proceed south.
Section 7---Reykjanes Ridge to Angmagssalik Although this section shows high positive anomalies on the Greenlandic conti-
nental slope and low ones at. the bottom of the Irminger Sea basin, no positive anomalies occur on the western side of the Reykjanes Ridge above 2500 m depth unless they are in the 100 m above the bottom which were not sampled.
Section 8--Reykjanes Ridge to Cape G. Holm This is the most northerly of the sections in the lrminger Sea. The overflow
of the Iceland-Greenland Ridge can be clearly seen but no positive anomalies occur on the western slope of the Reykjanes Ridge. The size of the positive anomalies on the Greenlandic continental slope is smaller on this section and on Section 7 than on Section 6---one would imagine that it would be greater as Sections 6 and 7 are nearer the scene of the overflow. This discrepancy may be due to the core of the overflow not being sampled on Sections 6 and 7, or to the overflow taking place in the form of boluses as has been suggested by Cooper (loc. cit).
D I S C U S S I O N
STEELE, BARRETT and WORTHINGTON (loc. cit) have calculated that in October 1960 the overflow of Norwegian Sea water across the Iceland-Scotland Ridge amounted to 1.4 × 10⁶ m3]sec, which is similar to the calculated outflow from the Mediterranean of 1-7 × 10 e mS/sec given by SVERDRUP, JOHNSON and FLEMING (1946). STEELE et al. point out that the spread of Norwegian Sea water has never been so apparent as that of the Mediterranean water and consider that this is due to its much smaller salinity anomaly and to its passage through the Mid-Atlantic Ridge into the western basin. Our analysis shows that the Norwegian Sea water is not confined to the eastern slope of the Mid-Atlantic Ridge but that it forms a belt right across the basin of the north-eastern Atlantic at between 2500 and 3500 m depth. This belt can be found from about 53°N latitude south to 47°N and perhaps to 43°N latitude. Beyond this it cannot be traced owing to the influence of the outflow from the Mediterranean. Some of the Norwegian Sea water passes into the western basin south of about 60°N latitude at depths below 1000 m. After crossing the Mid-Atlantic Ridge some of this water turns to the north and flows along the western slope o f the ridge but it cannot be traced very far only to about 62°N latitude. The water can be seen on the western slope to as far south as 47°N latitude.
138 ARTHUR LEE and DAVID ELLETT
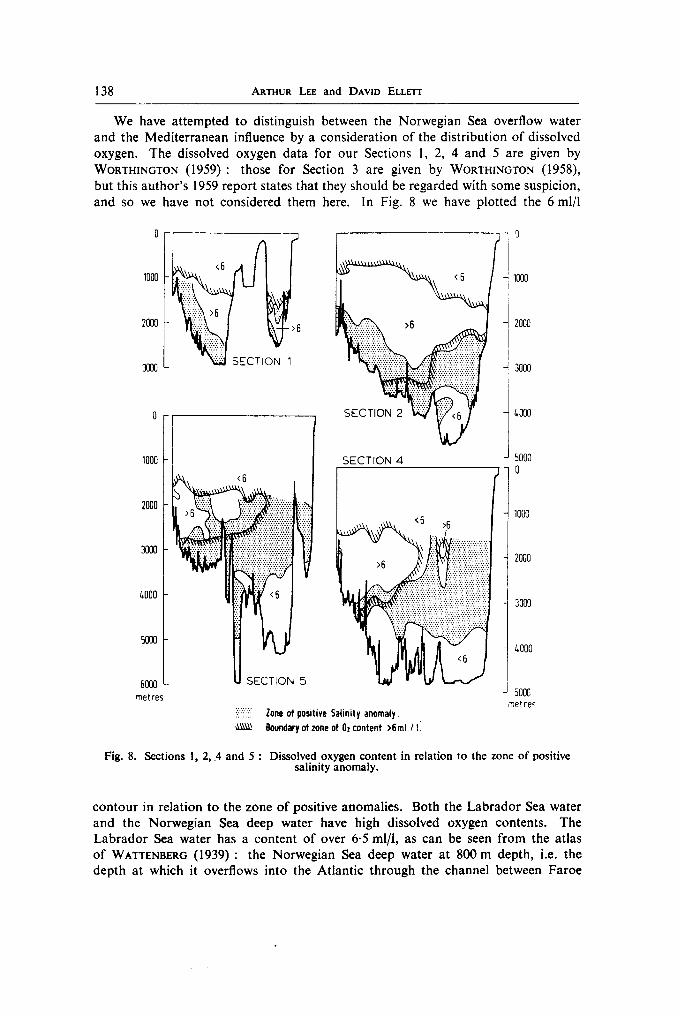
We have attempted to distinguish between the Norwegian Sea overflow water and the Mediterranean influence by a consideration of the distribution of dissolved oxygen. The dissolved oxygen data for our Sections 1, 2, 4 and 5 are given by WORTHINGTON (1959): those for Section 3 are given by WORTHINGTON 0958), but this author 's 1959 report states that they should be regarded with some suspicion, and so we have not considered them here. In Fig. 8 we have plotted the 6 ml/l
1000
2000
3000
I000
2000
3000
0 0
~000
5000
6OO0 metres
I <6
SECTION I
j i":'
<6
>6
•.....,..-.....!: ":ii!iiiiiiii: .:.:.::~ ::
SECTION 4
1000
2000
3000
~,O00
5000
i 0 1000
,6 ..!i 2ooo
30O0
~000
5O00 metres
i:i:i:i:i:i:i Zone of positive Salinity anomaly. goundary of zone of Oz content >6rot./Ii
Fig. 8. Sections 1, 2, .4 and 5 : Dissolved oxygen content in relation to the zone of positive salinity anomaly.
contour in relation to the zone of positive anomalies. Both the Labrador Sea water and the Norwegian Sea deep water have high dissolved oxygen contents. The Labrador Sea water has a content of over 6.5 ml/l, as can be seen f rom the atlas of WATtENBERO (1939) : the Norwegian Sea deep water at 800 m depth, i.e. the depth at which it overflows into the Atlantic through the channel between Faroe

On the contribution of overflow water from the Norwegian Sea 139
and Faroe Bank, has a content of 7.0ml/l according to MosBY (1959). The Mediterranean water, on the other hand, has a low dissolved oxygen content. From the data given by THOMSEN (1937) for Dana stations 4027-4029 just east of the Straits of Gibraltar, the dissolved oxygen content at 300-400 m depth, i.e. in the region of the sill depth in the straits, is seen to be between 4.1 and 4.6 ml/l. From Fig. 8 it can be seen that on Sections !, 2, 4 and 5 the zone of highest dissolved oxygen content, above 6 ml/l, lies at the western end of the sections and that in these areas this.zone overlaps the zone of positive salinity anomaly, suggesting that here the positive salinity anomaly is due to the influence of Norwegian Sea deep water. At the eastern ends of the sections the dissolved oxygen content is still high,
' 0 -
9
BT- "
7 -
6 "
Y 5 7 "
~ 3 J
2 -
1 -
oJ 3/,-6
, . , ,LA,T,E EE,,RAL WA,ER I , , R O E , r
~ J
IRMtNOER SEA ~ WATER -~--~' , ( : J / LABRADOR SEA WATER--j.~ / ~ /'1/ •
J~ICELAND-SCOTLAND OVERFLOW W'R N.ATLANIIE DEEP WATER ~ J ANTARCTIC BOI"TOH W'R "e
ICELAND-GREENLAND OVERFLOW" / WATER / I J
3t,.B 35.0 35-2 354 SALINITY "/**
Fig. 9. Temperature-salinity (T-S) diagram for the water masses of the north-eastern and north-western basins of the North Atlantic.
being not less than 5"5 ml/l in the zone of positive anomaly, but this cannot be clearly shown to be due to the influence of Norwegian Sea deep water. It could equally be due to a water which is the product of mixing of Labrador Sea and Mediterranean waters.
The overflow of Norwegian Sea deep water across the Iceland-Greenland Ridge makes a significant contribution to the hydrographic structure of the western basin and it can be traced from this ridge, along the coast of Greenland to Cape Farewell, and then southwards along the floor of the western basin. WORTHINGTON and METCALF (Ioc. cit.) show that the larger salinity anomalies caused by this overflow

140 ARTHUR LEE and DAVID ELL~Z'r
are confined to the area north of the South-East Newfoundland Ridge, but that south of this ridge there is a southerly flow of water with a smaller positive anomaly along the western boundary of the Atlantic.
The two overflows of Norwegian Sea water produce water masses in the North Atlantic having different T-S characteristics, as can be seen from Fig. 9. The characteristics of the water mass resulting from the overflow across the Iceland- Greenland Ridge into the western basin have been obtained from a study of the Anton Dohrn I.G.Y. data. Also shown in Fig. 9 are the characteristics of the Norwegian Sea deep water, of Irminger Sea water, and of North Atlantic water in the area where overflow occurs near Faroe. Mosav (1959) gives the mean vertical distribution of temperature and salinity in the Norwegian Sea based on Armauer Hansen cruises in 1935-6. The temperature and salinity at 800 m are - -0 .4 to - - 0"5°C and 34.92%0 : 800 m is approximately the least depth in the channel between Faroe and Faroe Bank through which a large part of the overflow of the Iceland-Scotland Ridge takes place. The depth at which overflow occurs across the Iceland-Greenland Ridge is about 600 m and the temperature and salinity at this depth on Mosby's profiles are -- 0.2°C and 34-92%0. 'The North Atlantic water in the vicinity of Faroe can be taken as having a temperature of 9°C and salinity of 35"33%0, judging by data which were collected during the Iceland-Faroe Ridge Overflow Survey carried out in 1960 by the International Council for the Exploration of the Sea (I.C.E.S.), and which are at present being analysed by us. The overflow across the Iceland-Greenland Ridge, although initially in contact with North Atlantic water, flows for a considerable distance in contact with Irminger Sea water, which according to DIETRICH (1957) has a temperature of 4°C and a salinity of 34"90%0. It can be seen from Fig. 9 that the line joining the points marking Norwegian Sea deep water and lrminger Sea water passes very close to that marking the water mass caused by the overflow into the western basin. Further, the line joining the points marking Norwegian Sea deep water and North Atlantic water does not pass so close to that marking the water mass caused by overflow into the eastern basin. This may be due to there being some Irminger Sea influence in the eastern basin, as suggested by STEELE, BARRETT and WORTHINGTON (Ioc. cit.), or it may be due to the addition to the overflow, which passes between Faroe and Faroe Bank, of another water mass at a point close to Iceland. This water mass is found on the northern side of the Iceland-Faroe Ridge at 300-400 m depth and it overflows the lceland-Faroe Ridge close to Iceland. It is said by STEFANSSON (1962) to be North Icelandic Winter water, but our analysis of the 1960 I.C.E.S. Greenland-Faroe Ridge Overflow Survey data suggests that it might be the Arctic Intermediate water of HELLAND-HANSEN and NANSEN (Ioc. cit.). It is hoped to publish this analysis in due course in the report of the International Council for the Exploration of the Sea on this survey.
From Fig. 9 it would appear that in the western basin the water mass caused by the mixing of the Iceland-Greenland Ridge overflow with Irminger Sea water consists of two parts of Norwegian Sea deep water to one part of Irminger Sea water, and that in the eastern basin the equivalent water mass appears to consist of two parts of Norwegian Sea deep water to one part of North Atlantic Central Water. This is not in very good agreement with the findings of STEELE, BARRETT and WORTHINGTON who show that in the eastern basin the proportion of Norwegian

On the contribution of overflow water from the Norwegian Sea 14 !
Sea deep water in the core of the overflow when it has reached a point to the south- east of Iceland is 0.5.
The water mass caused by :he mixing of the Iceland-Greenland Ridge overflow with Irminger Sea water is the heaviest water in the western basin of the North Atlantic and forms the bottom water there. The corresponding water mass in the eastern basin is not the heaviest water in that basin : the bottom water here has an Antarctic component according to COOPER (loc. cit.) and WORTHINGTON and METCALF (.lot. cit.). It should be noted that, as far as the western basin is concerned, the points marking the following waters all fall close to the same straight line : Irminger Sea, Labrador Sea, Norwegian Sea deep, Iceland-Greenland Ridge over- flow and North Atlantic Deep. It would therefore appear that the North Atlantic Deep Water is essentially the product of the mixing of overflowing Norwegian Sea deep water, lrminger Sea water and Labrador Sea water, with Labrador Sea water and the water which is a product of the Iceland-Greenland Ridge overflow mixed in more or less equal l~roportions.
The speculative suggestion of COOPER (loc. cir.) that the overflow water, which crosses the Greenland-Scotland Ridge, lies as plates between the resident water masses of the north-eastern Atlantic seems to require modification in the light of our analysis. The station at which Cooper made his observations, Cavall, lies near the eastern end of our Section 4 close to Discovery Stations 3870 and 3871. He postulates that there is a zone of conflict between thin strata of contesting waters at about a potential temperature of 2.5°C i.e. at about 3200 m depth. This depth falls near the bottom of our zone of positive anomalies. We have pointed out that on this section the origin of these anomalies is not entirely clear : some may be due to overflow water crossing the Iceland-Scotland Ridge, but others to Mediterranean water. If there is conflict at this depth, then it is probably between waters influenced by Arctic overflow on the one hand and by Mediterranean water on the other. It is of interest to note that Cooper 's station Cavall falls close to the region in which the positive anomalies tend to a minimum, increasing both east- wards, because of the influence of the overflow from the Mediterranean basin, and westwards because of the influence of the overflow from the Norwegian Sea. The situation of Cooper 's station in an area where the two water masses caused by these overflows seem to meet probably accounts for the structure he finds there. He also suggests that there may be another zone of conflict at a potential temperature of 3.0°C i.e. at about 2500 m depth : he finds a sudden jump in density here. Section 4 shows that it is at this depth at its eastern end that the positive anomalies due to Mediterranean influence become prominent. Finally, Cooper finds a highly hetero- geneous water around a potential temperature of 3.8 ° and a depth of 1900 m : this he calls the " Merlin Complex." COOPER, JONES and LEE (loc. tit.) report a similar structure at 1850 m at station F. It can be seen from Section 2 that the influence of Labrador Sea water occurs at this depth at the eastern end of that section, close to the south of Ireland. The zone of negative anomalies due to this water narrows as it approaches the European shelf, and the complicated structure at about 1900 m depth near the shelf is undoubtedly due to the zone's becoming exceedingly thin there. Thus, the narrow band of lower salinity water found at Station F at this depth by COOPER, JONES and LEE (loc. cit.) and the high oxygen

142 ARXn-tm L~E and DAVm ELLE1"r
content found by Cooper is due to a Labrador Sea water component and not to any Norwegian Sea influence, this occurring below 2500 m.
R E F E R E N C E S
CooPER L. H. N. and VAUX D. (1949) Cascading over the continental slope of water from the Celtic Sea. J. mar. biol. Ass. U.K. 28, 719-750.
COOPER L. H. N. (1961) Vertical and horizontal movements in the ocean. Publ. Amer. Ass. Advanc. Sci. No. 67, 599-621. (Oceanography: ed. M. Sears).
COOrER L. H. N., JONES P. G. W. and LEE A. J. (1962) Hydrographical conditions along the 14°W meridian south-west of Ireland, July 1960. Ann. biol., Copenhague. 17, 73-76.
DIETRICH G. 0957) Sehichtung und Zirkulation der Irminger-See im Jtmi 1955. Ber. dtsch. Komm. Meeresforsch. 14, 255-312.
DIETRICH G. (1961) Some thoughts on the working-up of the observations made during the " Polar Front Survey" in the I.G.Y. 1958. Rapp. Cons. Explor. Met, 149, 103-110.
FUGLL~TER F. C. (1960) Atlantic Ocean atlas of temperature and salinity profiles and data from the International Geophysical Year of 1957-1958. Wood's Hole Oceanogr. Inst. Atlas Set. 1,209 pp.
HELLAND-HANSEN B., and NANSEN F. (1909) The Norwegian Sea. Its physical oceano- graphy based upon the Norwegian researches 1900--1904. Rep. Norweg. Fish. Invest. 2, Pt. 1 (2).
HEme~ANN F. (1956) Influence of overflow over the Scotland-Greenland Ridge on the bottom water of the northern North Atlantic. ICES Hydrogr. Comm. Dec. No. 63, (mimeo).
Mosnv H. (1959) Deep water in the Norwegian Sea. Geofys. Publ. 21 (3). NANSEN F. (1913) The waters of the north-eastern North Atlantic. Investigations made
during the crttise of the "Frithjof," of the Norwegian Royal Navy in July 1910. Int. Rev. Hydrobiol. Suppl. to Bd. 4.
SXEELE J. H., BARl~Tr J. R. and WORTmNHTON L. V. (1962) Deep currents south of Iceland. Deep-Sea Res. 9, 465-474.
STEEgNSSON U. (1962) North Icelandic waters. Rit Fiskid. 3. SVERDRtYP H. U., JOHNSON M. W. and FLEMING R. M. (1946) The oceans, their physics,
chemistry and general biology. Prentice-Hall Inc., New York. 1087 pp. THOMSEN H. (1937) Hydrographical observations made during the " D a n a "-Expedition
1928-1930. Dana Rep. 2 (12). TULLOCH D. S. and TArr J. B. (1959) Hydrography of the North-Western Approaches
to the British Isles. Mar. Res., Scot., 1959 No. 1., 32 pp. WATrEI'qBERH H. (1939) Atlas zu die Verteilung des Sauerstoffs im Atlantischen Ozean.
Wiss. Ergebn. dtsch, atlant. Exped. 'Meteor." Bd. 9 - Atlas. WORTmNGTON L. V. (1958) Oceanographic data from the R.R.S. Discovery II. Inter-
national Geographysical year cruises one and two, 1957. W.H.O.I. Ref No. 58-30. (Unpublished manuscript).
WOgTmNHTON L. V. (1959) Oceanographic data from the R.R.S. Discovery II. Inter- national Geophysical Year cruise 3, 1958. W.H.O.L Ref. No. 59-54. (Unpublished manuscript).
WOgTmNGTON L. V. and METCALF W. G. (1961) The relationship between potential temperature and salinity in deep Atlantic water. Rapp. Cons. Explor. Mer, 149, 122-128.