Embed Size (px)
Citation preview

On the characterization of continuous fibres fracture by quantifying
acoustic emission and acousto-ultrasonics waveforms
Y.Z. Pappas, A. Kontsos1, T.H. Loutas, V. Kostopoulos*,2
Applied Mechanics Laboratory, Department of Mechanical Engineering and Aeronautics, University of Patras, 265 00 Rio Patras, Greece
Received 22 October 2003; revised 13 November 2003; accepted 14 November 2003
Abstract
The aim of the present work is the classification of the characteristics of elastic waves, which are generated by fibre failures during quasi-
static tensile fibre bundle tests and captured by the use of acoustic emission (AE) method. In addition, elastic waves generated out of the fibre
bundle gauge length and propagated through the bundle at different stages of the loading process using an acousto-ultrasonic (AU) technique
are also classified. To this target, a large number of tests were conducted on organic, ceramic and carbon fibre bundles according to DIN
53942. An in-house developed analysis and quantification methodology of the captured AE and AU waveforms is proposed in order to
identify the frequency content of the fibre failure event, to characterize the medium of propagation and to investigate the effect of the
acquisition system on the monitored signals. In fact, the application of the proposed analysis on the results of the conducted mechanical tests
leads to the development of a useful database, concerning the ranges of AE features and the representative sets of frequency values that
correspond to fibre fracture. Furthermore, the proposed database offers valuable knowledge for the role of material parameters, such as fibre
structure and properties, on the characteristics of the recorded waveforms, constituting in this way a valuable tool that enables a better
understanding of elastic waves initiation and propagation through continuous fibres.
q 2003 Published by Elsevier Ltd.
Keywords: Acoustic emission; Acousto-ultrasonics; Database; Wave propagation; Fibre failure
1. Introduction
Several non-destructive inspection methods are currently
used as valuable and reliable tools for the characterization of
the structural integrity and the identification of the damage
mechanisms of complex material systems and structures,
which are subjected to different loading conditions. In the
case of continuous fibre reinforced composites, the fracture
of single as well as multiple fibres is strongly correlated to
the final failure of the structural component [1]. For these
complex materials, it is the integrity of the reinforcing phase
that determines the capability of the internal micro-structure
to withstand the external loads. Thus, the ability to identify
and quantify the failure of reinforcing fibres during the
loading process could provide valuable information
concerning the remaining life of a macro-structure.
In general, the genesis of this type of destructive events is
accompanied by the release of a considerable amount of
elastic energy, part of which propagates through the other
intact fibres of the reinforcement phase and/or through the
surrounding matrix of the composite structure. The
identification of an electrical signal, captured by a piezo-
electric transducer, as the result of fibre breakage offers
great advantages in the health monitoring process of the
overall composite structure. However, this result could not
be achieved using a straight-forward approach, since the
captured electrical signals (waveforms) contain information
coming not only from the source of the event but is also
affected by the medium that propagates the elastic energy,
the propagation path [2], the statistical nature of the physical
phenomenon and the system used for the acquisition [3].
Thus, any effort to extract knowledge about the elastic
waves that correspond to fibre failures should be based on
well-controlled testing conditions and the characterization
of the source of the failure event, under a statistical and
multi-dimensional analysis scheme.
In the present work, the characteristics of the elastic
waves generated as acoustic emission (AE) activity by
0963-8695/$ - see front matter q 2003 Published by Elsevier Ltd.
doi:10.1016/j.ndteint.2003.11.004
NDT&E International 37 (2004) 389–401
www.elsevier.com/locate/ndteint
1 Present address: Department of Mechanical Engineering and Materials
Science, Rice University, 6100 Main Street, Houston, TX 77005, USA.2 Institute of Chemical Engineering and High Temperature Chemical
Processes/FORTH, Platani Rio, Patras, Greece.
* Corresponding author. Tel.: þ30-2610997234; fax: þ30-2610992644.
E-mail address: [email protected] (V. Kostopoulos).

the failure of various types of fibres are classified in the time
and frequency domain. To this aim, a large number of quasi-
static mechanical tensile tests were conducted on commer-
cially available and extensively used fibre bundles, such as
Al2O3, carbon, SiC, Kevlar, glass and polyethylene, using a
special testing device according to DIN 53942 [4]. The
classification of the AE activity is achieved adopting
efficient de-convolution methodologies and results in a
database that characterizes the ‘signature’, in time and
frequency domain, of each fibre type failure. This approach
establishes a new methodology for the characterization of
the source of the failure event and the effect of the
propagation path.
2. Methodology for database development
The idea of a database development with representative
values of characteristic AE features corresponding to
several failure phenomena is not a new issue, since many
researchers have given this kind of information for specific
testing conditions, material structures and damage mechan-
isms before. A useful discussion concerning this aspect is
whether these values can be used to evaluate the response of
the same material in different structures and testing
conditions. Thus, the real question that arises is whether a
developed database created by information extracted from a
micro-scale approach (single filament, fibre bundle and
mini-composite tests) is applicable to the macro-scale
(plates, big structures, etc.) and vice-versa. In fact, many
efforts have been made towards this direction. Hamstad [5]
worked in single and multiple Kevlar 49 filaments tensile
tests using AE, and proposed that these results could be used
in a macro-scale approach for fibre failure identification,
while Giordano [6] assumed that there is only one fibre
failure mechanism in polymer-composites, enforcing
the same idea. The latter standardized the AE signatures
of single fibre failures and proposed a time/frequency
analysis, which can be applied to any captured waveform
from materials testing with more complex failure modes. In
2001, Pappas [7] proposed a complete scheme of micro-to-
macro scale utilization of the AE findings in composites, by
creating a database for several damage mechanisms.
Finally, in 2002, Ni [8] worked on the investigation of
model composites fracture with single carbon fibre, and
proposed a stage-by-stage approach for the given problem.
Probably, the most effective methodology to solve the stated
problem is to work on the AE waveforms, in time and
frequency domain, assuming that, in micro-scale, matter
vibration is related to eigenmodes, and that the classical
frequency domain analysis techniques (Fourier transform
(FT), dispersion curves, etc.) are applicable. This approach
is called modal AE, and is based on the assumption that the
most dominant eignemodes of the micro-structure are
present during any kind of AE activation and acousto-
ultrasonic (AU) response. Examples of this approach are
given by Prosser [9] and Mizutani [10].
An important issue in the analysis of the AE waveforms
and the efforts to construct a valid and useful database is the
ability to characterize efficiently the source event of each
captured waveform. In the case of fibre bundle testing,
source events could be single fibre failures, sliding friction
between fibres, etc. However, the propagation of an emitted
elastic wave from the source to the sensor and then to the
recording system is affected, in time and frequency domain,
by a set of external factors, such as the propagation medium
(properties, damage state, attenuation), the acquisition
system (sensors, acoustic coupling, pre-amplifiers, record-
ing system) and the boundary conditions (gripping/support-
ing apparatus, etc.). Thus, in order to create a valid database
for the evaluation of each waveform, it is important to know
the contribution of these factors in the overall response.
Nomenclature
AE acoustic emission
Amp amplitude
AvF average frequency
AU acousto-ultrasonic
Co counts
CNTP counts to peak
d fibre diameter
Dur duration
Di damage set of fibre i
Di;j common damage set between fibres i and j
E11 modulus of elasticity in loading axis
FFT fast Fourier transform
FT Fourier transform
GL fibre bundle gauge length
HDT hit definition time
HLT hit loc-out time
RiF rise frequency
PAC Physical Acoustics Corporation
PDT peak definition time
Pi propagation set of fibre i
Pi;j common propagation set between fibres i and j
ReF reverberation frequency
RT rise time
Sy ‘system’ set
STFT short time Fourier transform
TE true energy
TH feature extraction threshold
THA threshold/amplitude
UTS ultimate tensile strength
WFT windowed Fourier transformation
WTC wavelet transformation coefficients
r volume density
Y.Z. Pappas et al. / NDT&E International 37 (2004) 389–401390
Alternatively, it has been proposed that a characteristic set
of AE features/parameters could help to identify the
signature of specific damage mechanisms and thus to assist
the evaluation of the monitored AE activity. In the first
approach (continuous in frequency domain), de-convolution
methodologies are usually applied in order to determine the
characteristics of the overall system (acquisition system,
propagation medium, boundary conditions) separating this
knowledge from the source event contribution. Some
examples of this approach are given by Qi [11] who used
pencil breaks to estimate system transfer functions on
carbon fibre reinforced composites at several loading stages,
Giordano [6] who worked on polymer composites and
Ageorges [12] who worked on carbon fibres reinforced
composites. In the second approach (discrete in time and
frequency domain), a representative set of significant
frequencies that corresponds, with high probability, to
specific damage mechanisms is proposed. In 1977, Russell
[13] introduced the issue of AE signature in the case of
graphite/epoxy composites, while in 1981, Clough [14]
referred to the same issue for fatigue/stress corrosion
cracking in aluminum alloys.
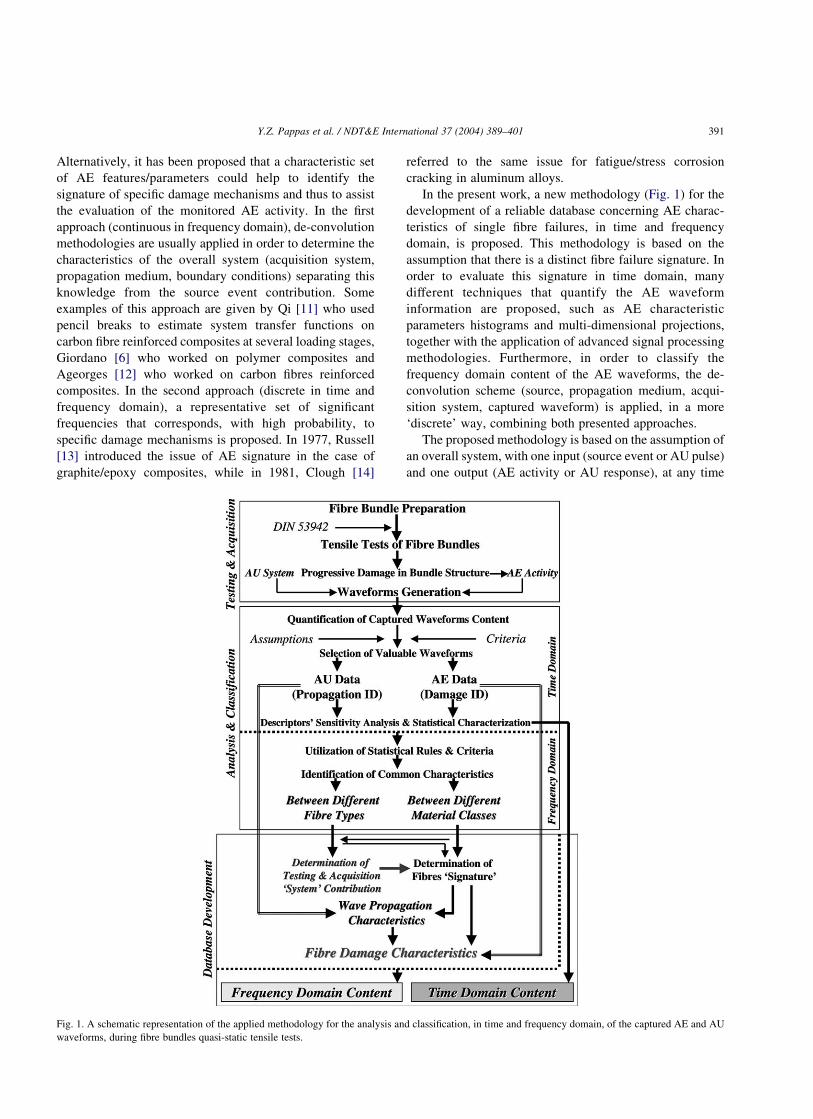
In the present work, a new methodology (Fig. 1) for the
development of a reliable database concerning AE charac-
teristics of single fibre failures, in time and frequency
domain, is proposed. This methodology is based on the
assumption that there is a distinct fibre failure signature. In
order to evaluate this signature in time domain, many
different techniques that quantify the AE waveform
information are proposed, such as AE characteristic
parameters histograms and multi-dimensional projections,
together with the application of advanced signal processing
methodologies. Furthermore, in order to classify the
frequency domain content of the AE waveforms, the de-
convolution scheme (source, propagation medium, acqui-
sition system, captured waveform) is applied, in a more
‘discrete’ way, combining both presented approaches.
The proposed methodology is based on the assumption of
an overall system, with one input (source event or AU pulse)
and one output (AE activity or AU response), at any time
Fig. 1. A schematic representation of the applied methodology for the analysis and classification, in time and frequency domain, of the captured AE and AU
waveforms, during fibre bundles quasi-static tensile tests.
Y.Z. Pappas et al. / NDT&E International 37 (2004) 389–401 391

step. However, this overall system is assumed to be identical
for all the executed experiments, except the part of the
propagation medium, which is dependent on the fibre type.
Under these assumptions, it is possible to identify the AE
signature in the frequency domain, since the differences
between the AE and AU captured waveforms are due to the
variety of the source of failure events and the propagation
medium characteristics corresponding to the different types
of fibre bundles.
3. Testing procedure
3.1. Material
In order to investigate the role of essential material
parameters, such as fibre mechanical and physical proper-
ties, fibre structure and anisotropy level (material class), on
the characteristics of the generated elastic waves during
tensile loading, a number of different fibre types were tested.
The selected fibre types belong in one of the three following
material classes: organic, ceramic and carbon, providing in
this way the necessary diversity in material origin for the
justification of the proposed methodology for database
development. The most important properties of the selected
fibres are shown in Table 1 [1], where r is the volume
density, d the fibre diameter, UTS the ultimate tensile
strength and E11 the modulus of elasticity in the loading
direction (axial).
3.2. Testing conditions
For the failure modes investigation of the selected fibre
types, a number of fibre bundle quasi-static tensile tests were
performed according to DIN 53942/1984. For the justifica-
tion of this standard, all tensile tests were conducted
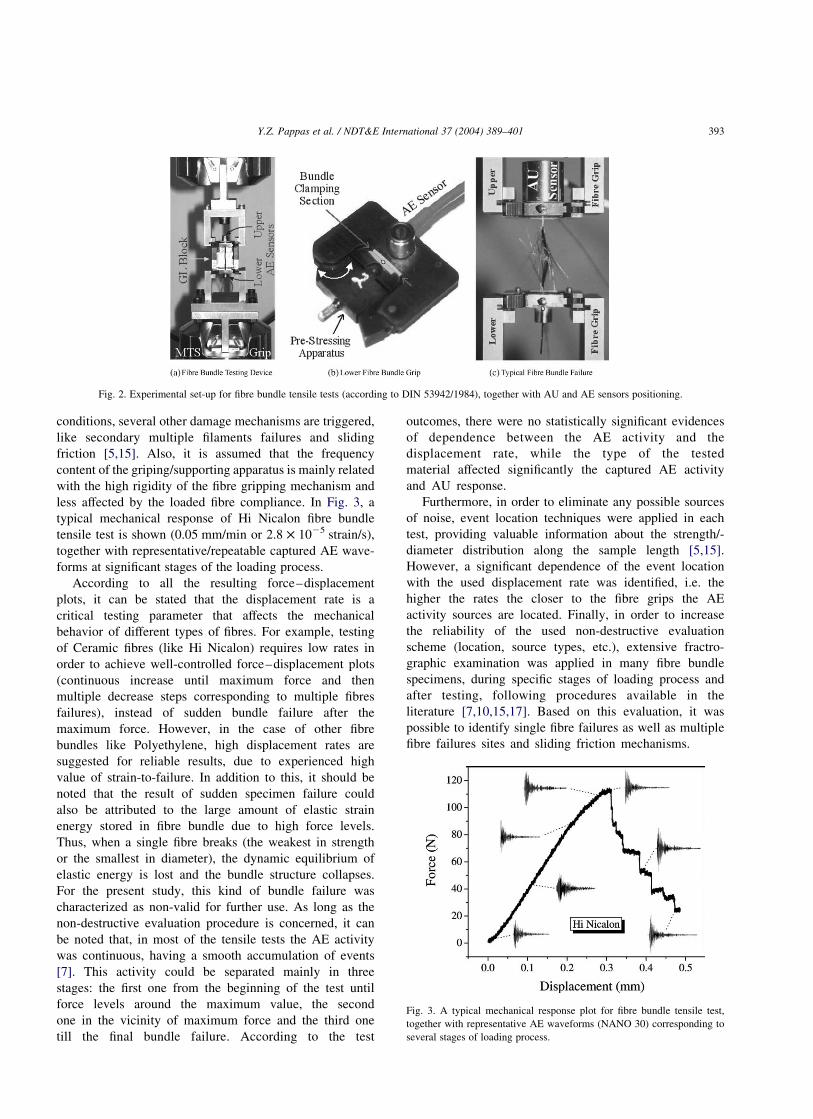
utilizing a special metallic device (Fig. 2a), attached on the
grips of a MTS Testing Machine (Type 858 Mini Bionix,
equipped with a 2.5 kN load cell), under displacement
control (LVDT measurements) and controlled environmen-
tal conditions of 25 8C and 70% relative humidity [7]. For
each material type, a gauge length (GL) of 30 mm was used
and three different displacement rates (0.05, 0.1 and
0.5 mm/min) where applied in order to investigate the
dependence of the testing results and captured waveforms
on the applied rates.
In these experiments, each fibre bundle specimen was
aligned by two steel miniature grips, called fibre grips,
which are attached on the main frame of the fibre testing
device. The distance between the fibre grips was pre-
determined by the use of an aluminum block, which set the
gauge length of each sample, called GL Block. For the
stabilization of each fibre bundle, a pre-stressing apparatus
included at each fibre grip was employed, generating the
necessary gripping pressure at the bundle clamping section
(Fig. 2b). Due to the fragile nature of the selected fibre
types, thin pieces of plastic foil were attached on both sides
of the clamping section in order to avoid any fibre damage
before the testing procedure.
During the testing procedure, AU signals were generated
by a pulsing system (excitation every 0.5 s of a wide band
transducer (WD), placed on the upper fibre grip (Fig. 2c) and
with sensitivity:261 dB V/mbar at 525 kHz, by a C-101-HV
device). Two miniature sensors (NANO 30) were placed on
the upper and lower fibre grips, respectively (Fig. 2a), and
detected AE activity and AU response (sensitivity of AE
sensor placed on the upper fibre grip: 267 dB V/mbar at
326 kHz and AE sensor placed on the lower fibre grip:
266 dB V/mbar at 452 kHz). All the sensors were mounted
permanently on the fibre grips by the use of cyanoacrilic glue.
The pulsing system and the sensors are provided by Physical
Acoustic Corporation (PAC), while 2/4/6-AST pre-ampli-
fiers were used for the AE (NANO 30) sensors (gain 40 dB
and band pass filtering of 20–1200 kHz). AE and AU signals
were captured and recorded, as pairs for each AE sensor, by a
Mistras 2001 acquisition system from PAC, using a 4 MHz
sampling rate and 4k-sample signal size. For the active
channels, Threshold (TH) and gain were set at 40 and 20 dB,
respectively, while the peak definition time (PDT), hit
definition time (HDT) and hit lockout time (HLT) were set at
80,800 and 1200 ms, respectively. For any mechanical noise
elimination, aDt filter was used together with the application
of event location software.
4. Results and discussion
4.1. Mechanical response and non-destructive evaluation
The applied testing program was based on the dry-bundle
approach [5,15,16], which enables the stimulation and
identification of single fibre failure events due to captured
elastic waves with high energy (presence of single fibre/air
interface). However, by the use of dry-bundle testing
Table 1
A list of physical and mechanical properties of the tested fibres, together
with the used coding
Fibre type r
(g/cc)
d
(mm)
E11
(GPa)
UTS
(GPa)
Fibres # Code
Nextel 312 2.70 12 150 1.70 400 H
Nextel 440 3.05 12 190 2.00 400 J
Nextel 610 3.88 12 373 2.93 400 K
Nextel 720 3.40 12 260 2.10 400 A
Altex SN-11 3.30 15 210 2.00 1000 B
S-Glass 2.48 20 87 4.89 6000 E
Hi Nicalon 2.74 14 270 2.79 800 T
Carbon M40-B 1.81 7 392 3.90 3000 P
Carbon M40-J 1.77 7 377 4.41 6000 S
Kevlar 29 1.44 12 83 3.60 1000 L
Spectra PE-40 0.97 6 101 3.08 120 C
Spectra PE-30 0.97 10 73 2.57 120 D
Y.Z. Pappas et al. / NDT&E International 37 (2004) 389–401392
conditions, several other damage mechanisms are triggered,
like secondary multiple filaments failures and sliding
friction [5,15]. Also, it is assumed that the frequency
content of the griping/supporting apparatus is mainly related
with the high rigidity of the fibre gripping mechanism and
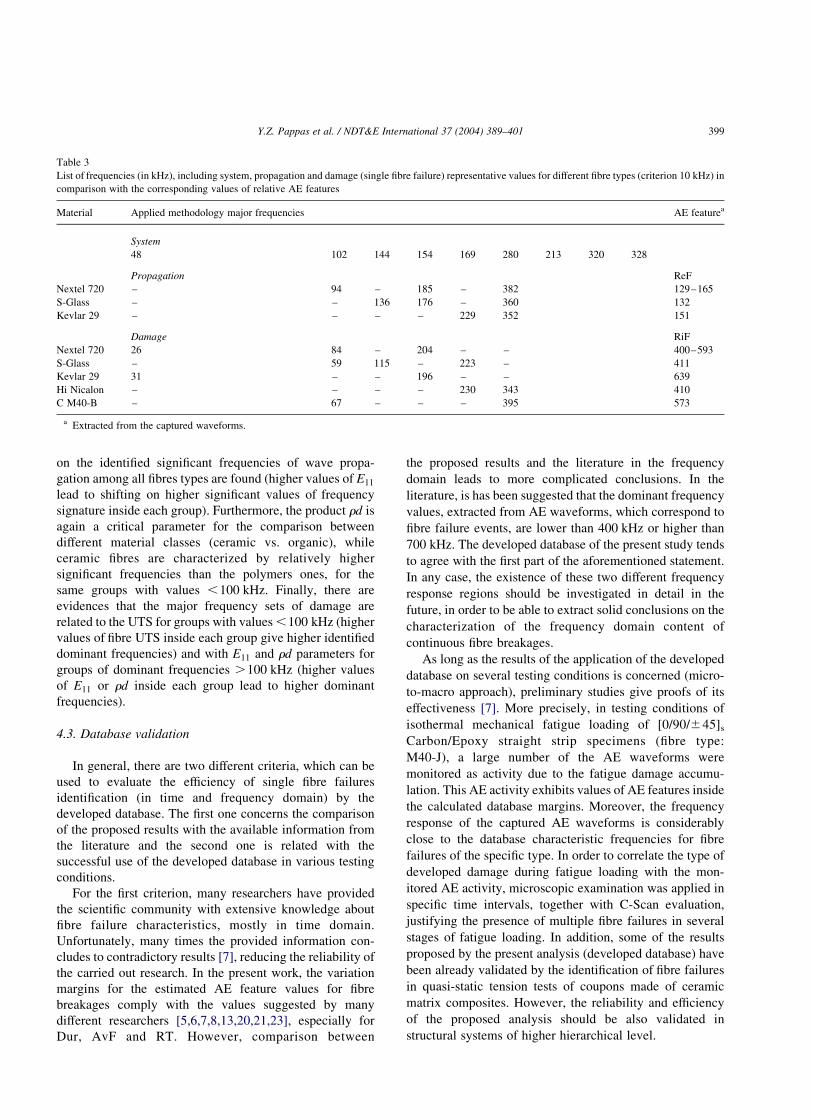
less affected by the loaded fibre compliance. In Fig. 3, a
typical mechanical response of Hi Nicalon fibre bundle
tensile test is shown (0.05 mm/min or 2.8 £ 1025 strain/s),
together with representative/repeatable captured AE wave-
forms at significant stages of the loading process.
According to all the resulting force–displacement
plots, it can be stated that the displacement rate is a
critical testing parameter that affects the mechanical
behavior of different types of fibres. For example, testing
of Ceramic fibres (like Hi Nicalon) requires low rates in
order to achieve well-controlled force–displacement plots
(continuous increase until maximum force and then
multiple decrease steps corresponding to multiple fibres
failures), instead of sudden bundle failure after the
maximum force. However, in the case of other fibre
bundles like Polyethylene, high displacement rates are
suggested for reliable results, due to experienced high
value of strain-to-failure. In addition to this, it should be
noted that the result of sudden specimen failure could
also be attributed to the large amount of elastic strain
energy stored in fibre bundle due to high force levels.
Thus, when a single fibre breaks (the weakest in strength
or the smallest in diameter), the dynamic equilibrium of
elastic energy is lost and the bundle structure collapses.
For the present study, this kind of bundle failure was
characterized as non-valid for further use. As long as the
non-destructive evaluation procedure is concerned, it can
be noted that, in most of the tensile tests the AE activity
was continuous, having a smooth accumulation of events
[7]. This activity could be separated mainly in three
stages: the first one from the beginning of the test until
force levels around the maximum value, the second
one in the vicinity of maximum force and the third one
till the final bundle failure. According to the test
outcomes, there were no statistically significant evidences
of dependence between the AE activity and the
displacement rate, while the type of the tested
material affected significantly the captured AE activity
and AU response.
Furthermore, in order to eliminate any possible sources
of noise, event location techniques were applied in each
test, providing valuable information about the strength/-
diameter distribution along the sample length [5,15].
However, a significant dependence of the event location
with the used displacement rate was identified, i.e. the
higher the rates the closer to the fibre grips the AE
activity sources are located. Finally, in order to increase
the reliability of the used non-destructive evaluation
scheme (location, source types, etc.), extensive fractro-
graphic examination was applied in many fibre bundle
specimens, during specific stages of loading process and
after testing, following procedures available in the
literature [7,10,15,17]. Based on this evaluation, it was
possible to identify single fibre failures as well as multiple
fibre failures sites and sliding friction mechanisms.
Fig. 2. Experimental set-up for fibre bundle tensile tests (according to DIN 53942/1984), together with AU and AE sensors positioning.
Fig. 3. A typical mechanical response plot for fibre bundle tensile test,
together with representative AE waveforms (NANO 30) corresponding to
several stages of loading process.
Y.Z. Pappas et al. / NDT&E International 37 (2004) 389–401 393

4.2. Quantification and evaluation of the waveform content
4.2.1. Selection of valuable waveforms
In order to perform the characterization of the fibre
failure events, it is necessary to create a representative set of
waveforms. However, the existence of such a set is
obviously an assumption that can be applied in most types
of fibres for the larger part of the loading process, but before
the maximum force is reached (Fig. 3) due to undefined
attenuation caused by damage in the bundle after this point.
Moreover, this assumption is valid in the particular case that
there is no dependence of the captured waveform with the
corresponding force/stress level, which apparently is not
true for some fibre types [7]. For all these reasons,
waveform selection criteria for single fibre failure were
established, taking into account the available knowledge
from the literature [5,7,9,12,15,16,18]:
† Voltage level: values of single fibre failures should be
10–100 times lower than multiple fibre failures.
† Force–displacement plot: selection area should start at
the first non-linearity (if this exists) until the maximum
value. The area after the maximum force should be
avoided due to many friction or pull-out phenomena and
uncontrolled attenuation values.
† Location events: the source location of the selected
waveforms should not be close to the fibre grips, but near
the middle of the gauge length.
† Sensitivity analysis: the dependence of each AE feature
values on the applied TH should be taken into account.
† Fast Fourier transform (FFT), spectrogram and wavelet
analysis: information gained from the use of the
candidate waveforms’ frequency response could become
essential in the selection procedure.
† Statistical aspects: the higher the number of representa-
tive waveforms of single fibre failure events the lower
sampling uncertainty and force dependency.
† Literature review: use of all the available information
about AE feature values for fibre failures.
The selection of each candidate AE waveform is
accompanied by the proper AU one, identified as the first
waveform prior to the selected AE waveform. However, the
success of the proposed overall selection procedure has to
be evaluated, taking into account the fact that random single
fibre failures occur at every stage of loading process.
4.2.2. Database development—time domain
The development of the time domain part of the proposed
database is presented in this section. The aim of the
proposed approach is the identification of specific events by
the use of AE features. This asset was introduced at early
70s by Curtis [19], who investigated material damage
mechanisms by means of AE and it was continued by
Russell [13] on AE signals from Graphite/Epoxy compo-
sites. In 1986, Suzuki [20] correlated AE features with
structural factors of composite materials damage mechan-
isms and 1 year later, Okada [21] investigated the fracture
behavior of Carbon fibre reinforced aluminum by the use of
AE method. Finally, in 1995, Anastasopoulos [22] studied
the actual use of AE features for damage mechanisms
identification in composite materials and Groot [23] applied
AE method for the identification of different fracture
mechanisms in Carbon/Epoxy composites.
The first step in the proposed analysis is the use of the
established waveform selection criteria in order to create the
necessary representative set of captured AU/AE waveform
pairs for each single event. To this aim, the most important
parameter is the TH (an Amplitude level). It should be noted
that, in general, many extracted AE features in the time
domain are affected by this parameter. This correlation
becomes even stronger in the case of time dependent
features such as rise time (RT), duration (Dur) and average
frequency (AvF). Minimization of this effect can be
achieved by means of a proper parametric sensitivity
analysis, identifying the TH value which affects less the
results of the feature extraction procedure [7]. This study
has to be performed for every fibre type and the minimum
acceptable TH value for all fibre types should be used for the
final feature extraction. Moreover, it has been proved [7]
that the threshold/amplitude ratio (THA) is a useful tool for
AE features comparison between different materials and
damage mechanisms. For the present study, feature extrac-
tion was executed only for signals with THA ,0.8, in order
to increase the reliability and the efficiency of the developed
database.
In Table 2, ranges of some basic AE features are
presented for both AE sensors corresponding to the failure
of different fibre types (Amp, waveform amplitude, TE, true
energy). Based on these values, a general comment could be
that a single fibre failure generates AE waveforms with
medium Amp (50–80 dB), low RT (,40 ms) and medium
Dur (150–400 ms). Furthermore, it is obvious that different
fibre types emit AE waveforms with different time
envelopes at failure, even those that belong in the same
material classes (Nextel or Spectra). In addition, the
calculated distributions of many AE features values are
neither Uniform nor Gaussian, but non-symmetrical. There-
fore, use of feature mean values is not a reliable tool for AE
event characterization. Finally, the estimated variation of
AE features for each fibre type is related with the available
population of AE waveforms for statistical analysis and in
some cases affected the final results in the developed
database (for example types E and S).
A schematic representation of the failure areas of several
fibre types are given in Fig. 4, by using the values of two AE
features taken from the developed database. In general,
identification of well-defined failure areas using 2-D
projections of AE features are possible for each fibre type,
with often limited overlapping in the projected plane,
constituting in this way a useful tool of comparative
evaluation. The fact that different fibre types have different
Y.Z. Pappas et al. / NDT&E International 37 (2004) 389–401394

ranges of values should be quantified and correlated with
specific fibre characteristics (physical and mechanical
properties). An example of the proposed correlation
concerns the TE feature (integral of the captured waveform
voltage over the time). According to Tables 1 and 2, there
are evidences that the UTS and the product rd (mass per
fibre cross-section) are the most important parameters
(driving force) for the final formation of TE values of the
captured waveforms, which is related with the AE energy
released during a fibre failure. As a general rule for Ceramic
and Carbon classes, the higher the UTS the higher the TE for
fibre failures (the highest for Carbon fibres). However, for
the comparison of Ceramic and Organic classes, the rd
product is more important than the UTS or the diameter d
[24], and a rule is assigned: the lower the rd product the
higher the TE of the captured AE waveform after fibre
failure. Although the former proposed rules could be
applicable in many material cases investigated in the
present work, a more thorough examination of AE features
dependence (time domain) with fibre properties (diameter,
density, modulus of elasticity, tensile strength) should be
performed.
Another very informative graph is given in Fig. 5, where
the ranges of three AE features of the developed database,
which are related with ‘equivalent’ frequency domain
characteristics, are presented: rise frequency, RiF ¼
CNTP/RT (CNTP, counts to peak), AvF ¼ Co/Dur (Co,
counts) and reverberation frequency, ReF ¼ (Co-CNTP)/
(Dur-RT). Although, the values of these features do not
correspond to ‘real’ frequencies, they can provide useful
information about the captured waveforms. Indeed, RiF, for
example, seems to be a useful feature since it is related with
the source characterization of the emitted AE energy.
4.2.3. Database development—frequency domain
The procedure followed for the classification of the fibre
failure response in the frequency domain is given in the
present section. The efforts to assess the AE activity in the
frequency domain in order to enrich the damage identifica-
tion/characterization process started in 1971, when the fast
Fourier transform (FFT) analysis of AE waveforms was
introduced for the identification of material failure modes
[25,26]. Additional work in this area has been done by
Prosser [9], who applied an advanced AE waveform-based
detection technique of matrix cracking in composites based
on the modal analysis approach and by Ageorges [12], who
used an FFT analysis for damage identification in composite
materials (matrix cracking and fibre failure in single and
Carbon fibre bundles).
In general, a frequency domain database must be able to
identify all the possible ‘sources’ of the dominant
frequencies in the FT of the captured waveforms. These
sources characterize the overall system and the goal is to
‘extract’ and identify these frequencies from the wave-
forms’ FT. In the present study, such sources, which
constitute the overall system, are identified: the acquisition
Table 2
A representative part of the developed database based on AE features’
values, related with fibre failures under quasi-static tensile tests in room
temperature
Fibre type THA Amp (dB) RT (ms) Dur (ms) TE (fJ)
Nextel 312 0.46–0.80 61.8–72.0 13–27 160–370 11–17
Nextel 440 0.54–0.79 58.5–74.3 12–26 180–356 8–29
Nextel 610 0.58–0.77 57.5–68.9 9–39 149–341 1–14
Nextel 720 0.51–0.71 64.6–71.2 23–35 189–455 3–23
Altex SN-11 0.52–0.84 54.4–71.2 8–24 323–447 4–24
S-Glass 0.61–0.71 60.0–63.4 12–18 186–332 4–20
Hi Nicalon 0.51–0.83 58.0–71.8 23–71 166–298 5–30
Carbon M40-B 0.45–0.83 64.6–81.2 14–36 200–324 22–148
Carbon M40-J 0.63–0.75 57.8–65.1 20–24 171–275 22–126
Kevlar 29 0.61–0.74 58.1–77.9 8–27 229–331 38–69
Spectra PE-40 0.47–0.65 70.9–73.8 21–43 352–412 19–42
Spectra PE-30 0.55–0.87 55.0–73.6 39–51 254–410 6–39
Mistras 2001, NANO 30 and fibre grips based on DIN 53942/1984.
Fig. 4. A schematic representation of the developed database concerning
the failure areas of several fibre types at room temperature, by the use of AE
features (NANO 30).
Fig. 5. Mean values and variations of AE features (NANO 30) in time
domain representing the failure of different types of filaments at room
temperature.
Y.Z. Pappas et al. / NDT&E International 37 (2004) 389–401 395

system (sensors, acoustic coupling, pre-amplifiers and
calibrated A/D board), the pulsing system (pulsing system
and transducer), the gripping/supporting apparatus for fibre
testing (vibration eigenvalues) and the propagation path
(elastic waves in a medium with the specific geometric,
anisotropy and material properties of the fibres). In order to
evaluate the frequency content of each captured waveform,
a number of assumptions had to be made. Thus, the subset of
the overall system called system (overall system except the
propagation path characteristics) is considered constant for
every test, since the settings are kept constant (HDT,
sampling rate, sensors type and positioning, pulsing
settings, preamplifiers and settings). Furthermore, it is
assumed that, for a given fibre type, there should exist
common significant frequencies between the AE and AU
waveforms, because AE activity must include the propa-
gation signature of the medium (in frequency domain). This
propagation path could be every intact fibre or fibre
fragment after a local failure along the remaining length,
towards the fibre grips. However, for different fibre types,
AE activity and AU response should be different due to the
contribution of different source events and propagation path
characteristics. A precise estimation of the characteristics of
the system could be achieved by implementing these
assumptions into the results of a large number of tensile
tests on different fibre types and material classes. In
addition, it is assumed that the fibre breakage mechanism
generates elastic waves in the micro-structure, which
contain a unique set of dominant frequencies for each
fibre type. However, this set is present only in the AE
waveform and not into the AU one of each pair. Given this
knowledge, and following a discrete step-wise approach in
the frequency domain, it is possible to determine the sets of
dominant frequencies that correspond to the failure events
(single and multiple fibres breakage) for each fibre type and
the propagation of the emitted elastic waves in the medium
of each specific fibre type, by extracting/filtering the
characteristics of the system from the captured AE and
AU waveforms, in a FT level and evaluating the frequency
content of the AU waveforms. A schematic representation
of the above assumptions is given in Fig. 6, where the
frequency content is analyzed at the following sets: Sy
(system set), Pi (propagation set of fibre i), Pi;j (common
propagation set between fibres i and j), Di (damage set of
fibre i) and Di;j (common damage set between fibres i and j).
In the present study, the propagation medium character-
istics were identified by the use of the AU method (AU/AE
waveforms pairs) instead of the pencil break method [3].
The advantages of the AU method compared with pencil
breaks are: generation of a repeatable and well-controlled
pulse, characterization of the full propagation path, simple
and continuous application during each test. The disadvan-
tages are limited in the use of complex electronics and the
frequency ‘coloring’ by the used sensor. For each AU/AE
waveforms pair, the AE waveform includes the source
event of fibre failure, the effect of the propagation path
(through the intact fibres) and the system, while the AU
signal contains the same information, considering as source
event the generated AU pulse. An example of such a pair of
waveforms captured by the AE sensor at the lower fibre
grip, in the time and time/frequency domain, is presented in
Fig. 7, corresponding to a quasi-static tensile test of a Nextel
720 fibre bundle. This representative pair was selected by
applying the proposed criteria described in Section 4.2.1,
while the AU waveform is considered as the one that was
first recorded before the candidate AE waveform of fibre
failure at the same acquisition channel.
The identification of the frequency set that can determine
damage mechanisms requires a detailed analysis of the
captured AU/AE waveforms (such as Fig. 7(c) and (d)),
which must take into account the non-stationary character of
this kind of captured electrical signals. In general, the
analysis of non-stationary or transient signals is conducted
by means of joint time/frequency domain methods based on
windowed FT (Spectrogram or WFT), short-time FT
(STFT) or recently Wavelet analysis. However, in the
present work, the aspect of frequency signature existence in
AE waveforms is followed. The existence of such a
frequency signature in the AE waveforms is actually a
recent approach. In 1995, Groot [23] proposed a real-time
frequency determination of AE waveforms for different
damage mechanisms in Carbon/Epoxy composites, identi-
fying Carbon fibre failures at 180–240 kHz ranges. More-
over, in 1997 Qi [11] worked on Carbon fibre reinforced
composites using Wavelets analysis and proposed that fibre
failure is represented by events with high intensity, low
duration and high frequencies. In 1998, Giordano [6]
characterized failure modes in polymer-composites by an
FFT analysis of the AE waveforms, where single Carbon
fibre failures were identified and their AE signature
corresponding to failure was determined below 450 kHz.
In 2002, Mizutani [10] applied Wavelet analysis for the
identification of wave modes, using the signal power
Fig. 6. A schematic representation of the basic assumptions adopted for the
determination of the frequency content of captured AE waveform during
fibre bundle tests.
Y.Z. Pappas et al. / NDT&E International 37 (2004) 389–401396

as a function of time and frequency in cross-ply Carbon
composites. At the same year, Ni identified as AE signature
a number of peaks in the FFT plot, which are correlated with
damage mechanisms in model Carbon fibre composites, and
Park [24] identified frequency response characteristics of
the AE waveforms for single Carbon, SiC and E-glass fibre
failures, applying fragmentation tests. Finally, in 2003,
Mattei [17] used the aspect of AE signature for a real time
identification of delamination onset in Carbon fibre
reinforced plastic laminates under fatigue testing, by
treating a number of significant FFT peaks as indicators of
damage mechanisms.
According to the above literature references, the use of
the joint time/frequency domain instead of the typical FT is
suggested as an efficient method, especially in AE modal
analysis. The results of such an investigation of joint time
frequency response of the captured AU/AE waveforms pair,
which is not the subject of the present work, is given at the
second part of the Fig. 7, where a Wavelet transformation of
the captured waveforms is applied (Wavelet transformation
coefficients (WTC), relevant to FT amplitude). For this
purpose, the AGU-Vallen Waveletq (V. 2.31) software was
used, which is based on the Gabor mother wavelet of 200
samples size and 5 kHz resolution, for each 4096-samples
captured AU/AE waveforms. This particular time/frequency
domain transformation was presented in the literature as an
efficient tool in the case of AE waveforms [27]. For the
waveform pair of Fig. 7 (Fig. 7(a) and (b)), a different
frequency content of the AU and AE waveforms can be
identified (propagation medium and damage mechanism,
together with system filter), while different micro-structural
perturbations during any type of excitation (damage or AU)
reflects to different decrease slopes of several frequency
ranges (transient character of AE and AU waveforms).
However, in order to classify and isolate the damage
frequency set, the main damage mechanisms that produce
significant elastic waves during a dry-bundle test should be
identified. These are fibre failures (single or multiple) and
sliding friction between the fibres. Each source event caused
by these mechanisms has different characteristics (for
example sliding friction appears to have longer duration
and slower velocities than the fibre breakage) and each fibre
failure event could stimulate others (i.e. vibrations after
single fibre failure can stimulate additional fractures due to
longitudinal wave propagation, causing single, double,
triple or more fibre failures). In the present work, in order
Fig. 7. Time and time/frequency domain representation of a AU/AE waveforms pair, captured during a quasi-static tensile test of a Nextel 720 fibre bundle,
under 0.1 mm/min displacement rate.
Y.Z. Pappas et al. / NDT&E International 37 (2004) 389–401 397

to perform a statistical analysis in the frequency domain
content of the valuable waveforms, a general procedure
scheme was utilized to assure that the same rules and criteria
were used for all the input data that produce the extracted
information. To this aim, the FFT analysis is applied, with
the same parameters for each waveform that the analysis
indicated as valuable (512 samples, Hanning window, 75%
overlapping). The range of the investigated frequencies was
determined by setting a threshold in the linear normalized
FFT amplitude vs. frequency plot of each waveform. The
dominant frequencies were selected by using pre-deter-
mined criteria (40, 20, 10 and 5 kHz), which determine the
minimum separation level of two close peaks and the
selection of the dominant frequency out of a group of
frequencies that are very close to each other. The results of
the applied procedure were compared to different tests of the
same fibre type in order to extract the most ‘pure’ damage
and propagation frequency content. Hence, the following
iterative scheme was applied on the AE and AU waveforms,
in order to develop the frequency domain part of the
proposed database:
† Identification of the common frequencies in each fibre
type (by using statistical rules and criteria) and subtrac-
tion of these frequencies from the main set.
† Repetition of the same procedure among the
different fibre types for the same material class.
† Repetition of the same procedure among the different
fibre types and material classes.
† Identification of system frequencies set, by comparing
the common frequencies between the extracted sets
from both the AE and the AU waveforms.
† Characterization of the remaining set of frequencies as
the one that contains information about the fibres. Any
common frequency between the FFT of AE and AU
waveforms corresponds to the propagation frequencies
while the remaining are representative of the fibre
breakage damage mechanism.
A representative example of the above-described pro-
cedure is given graphically in Fig. 8. In this plot, the
identification of dominant frequencies in the framework of a
FFT analysis is presented, for the selected pair of AU/AE
waveforms of Fig. 7, constituting the frequency signature of
propagation and fibre failure in the case of Nextel 720 fibres.
According to this plot and taking into account the outcomes
of Fig. 7, the main energy contribution in the AU waveform
is made by frequencies higher than 350 kHz (middle to high
frequencies), while in the AE waveform this region is below
250 kHz (middle to low frequencies). However, there are
overlapping areas of significant frequencies that should be
investigated in detail by the use of the proposed method-
ology. This identification procedure is recursive and it has
been proved that the larger the number of available AU and
AE waveforms (representative set size) the more reliable
this signature will be.
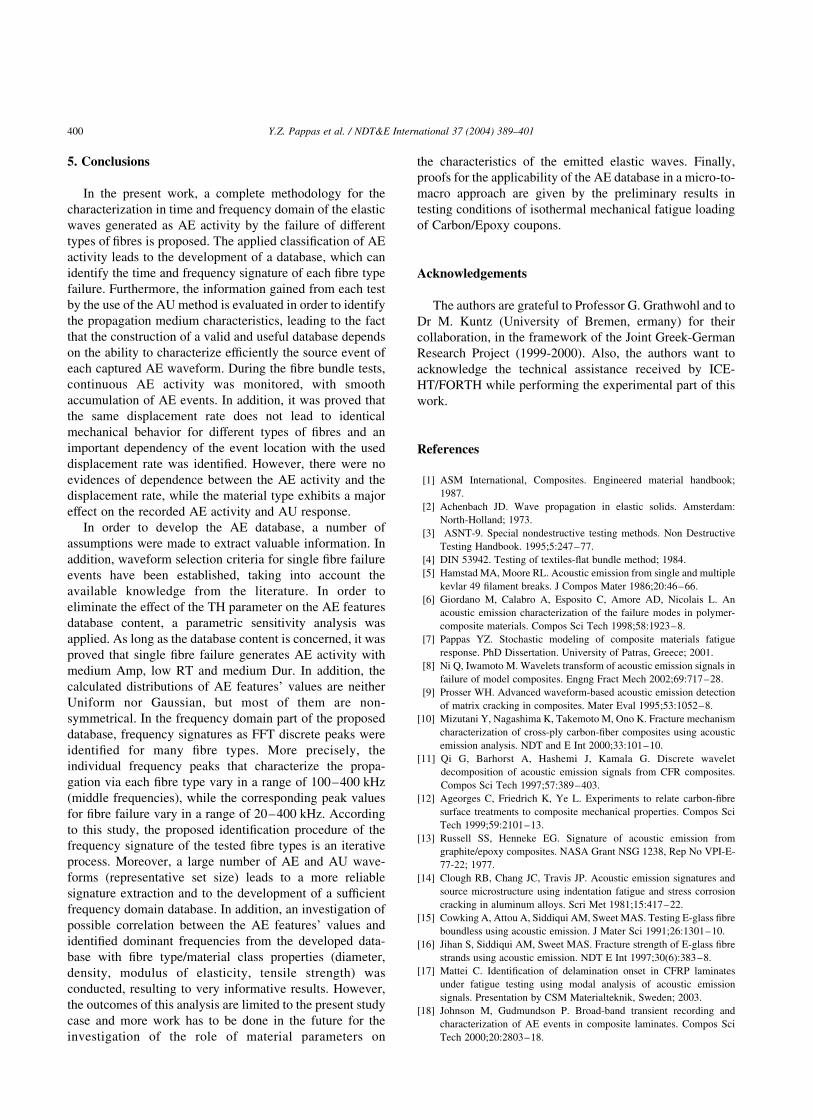
In Table 3, a list of frequencies identified by the
developed database is given, evaluating information from
both AE sensors. For the determination of these frequency
sets and their classification, a criterion of 10 kHz was used,
while the accuracy of the applied FFT was equal to ^1 kHz.
Moreover, these outcomes correspond to the most con-
servative criteria and selection rules in order to develop the
most reliable and sufficient database. For comparison
reasons, the estimated mean values of the ReF (propagation
characteristics) and RiF (source properties) are given for
every presented fibre type. According to these results,
frequency ‘signatures’ as FFT discrete peaks exist for many
fibre types, associated with system frequency coloring,
propagation ‘filtering’ and damage mechanisms. However,
the individual frequency peaks that characterize
the propagation via each fibre type vary in a range of
100–400 kHz (middle frequencies), while the correspond-
ing peak values for fibre failure varies in a range of
20–400 kHz. Moreover, it is obvious that values of ReF
(AE feature in time domain) can be used in a reliable way as
a mean approximation of the list of propagation frequency
peaks for the presented fibre types. Unfortunately, this is not
the case for the RiF, the values of which overestimate the
frequency response of the failure events.
In order to correlate the fibre properties (Table 1) with
the outcomes of the proposed methodology in the frequency
domain (Table 3), a new analysis scheme should be
established. The developed frequency database consists of
selected significant frequencies, after FFT mapping and
classification/shorting. However, any comparison of fre-
quency values among different fibre types and material
classes is difficult and another group re-arrangement should
be applied. The resulted groups will include significant
frequencies values (i.e. one class of frequencies is around
350 ^ 70 kHz), assuming a representation of specific
micro-structure deformation modes. Following this analysis
scheme for the present study, evidences of E11 dependence
Fig. 8. Frequency domain analysis of the captured AU/AE waveforms pair,
monitored during a quasi-static tensile test of a Nextel 720 fibre bundle at
27 N (80% of maximum force), under 0.1 mm/min displacement rate.
Y.Z. Pappas et al. / NDT&E International 37 (2004) 389–401398
on the identified significant frequencies of wave propa-
gation among all fibres types are found (higher values of E11
lead to shifting on higher significant values of frequency
signature inside each group). Furthermore, the product rd is
again a critical parameter for the comparison between
different material classes (ceramic vs. organic), while
ceramic fibres are characterized by relatively higher
significant frequencies than the polymers ones, for the
same groups with values ,100 kHz. Finally, there are
evidences that the major frequency sets of damage are
related to the UTS for groups with values ,100 kHz (higher
values of fibre UTS inside each group give higher identified
dominant frequencies) and with E11 and rd parameters for
groups of dominant frequencies .100 kHz (higher values
of E11 or rd inside each group lead to higher dominant
frequencies).
4.3. Database validation
In general, there are two different criteria, which can be
used to evaluate the efficiency of single fibre failures
identification (in time and frequency domain) by the
developed database. The first one concerns the comparison
of the proposed results with the available information from
the literature and the second one is related with the
successful use of the developed database in various testing
conditions.
For the first criterion, many researchers have provided
the scientific community with extensive knowledge about
fibre failure characteristics, mostly in time domain.
Unfortunately, many times the provided information con-
cludes to contradictory results [7], reducing the reliability of
the carried out research. In the present work, the variation
margins for the estimated AE feature values for fibre
breakages comply with the values suggested by many
different researchers [5,6,7,8,13,20,21,23], especially for
Dur, AvF and RT. However, comparison between
the proposed results and the literature in the frequency
domain leads to more complicated conclusions. In the
literature, is has been suggested that the dominant frequency
values, extracted from AE waveforms, which correspond to
fibre failure events, are lower than 400 kHz or higher than
700 kHz. The developed database of the present study tends
to agree with the first part of the aforementioned statement.
In any case, the existence of these two different frequency
response regions should be investigated in detail in the
future, in order to be able to extract solid conclusions on the
characterization of the frequency domain content of
continuous fibre breakages.
As long as the results of the application of the developed
database on several testing conditions is concerned (micro-
to-macro approach), preliminary studies give proofs of its
effectiveness [7]. More precisely, in testing conditions of
isothermal mechanical fatigue loading of [0/90/^45]s
Carbon/Epoxy straight strip specimens (fibre type:
M40-J), a large number of the AE waveforms were
monitored as activity due to the fatigue damage accumu-
lation. This AE activity exhibits values of AE features inside
the calculated database margins. Moreover, the frequency
response of the captured AE waveforms is considerably
close to the database characteristic frequencies for fibre
failures of the specific type. In order to correlate the type of
developed damage during fatigue loading with the mon-
itored AE activity, microscopic examination was applied in
specific time intervals, together with C-Scan evaluation,
justifying the presence of multiple fibre failures in several
stages of fatigue loading. In addition, some of the results
proposed by the present analysis (developed database) have
been already validated by the identification of fibre failures
in quasi-static tension tests of coupons made of ceramic
matrix composites. However, the reliability and efficiency
of the proposed analysis should be also validated in
structural systems of higher hierarchical level.
Table 3
List of frequencies (in kHz), including system, propagation and damage (single fibre failure) representative values for different fibre types (criterion 10 kHz) in
comparison with the corresponding values of relative AE features
Material Applied methodology major frequencies AE featurea
System
48 102 144 154 169 280 213 320 328
Propagation ReF
Nextel 720 – 94 – 185 – 382 129–165
S-Glass – – 136 176 – 360 132
Kevlar 29 – – – – 229 352 151
Damage RiF
Nextel 720 26 84 – 204 – – 400–593
S-Glass – 59 115 – 223 – 411
Kevlar 29 31 – – 196 – – 639
Hi Nicalon – – – – 230 343 410
C M40-B – 67 – – – 395 573
a Extracted from the captured waveforms.
Y.Z. Pappas et al. / NDT&E International 37 (2004) 389–401 399
5. Conclusions
In the present work, a complete methodology for the
characterization in time and frequency domain of the elastic
waves generated as AE activity by the failure of different
types of fibres is proposed. The applied classification of AE
activity leads to the development of a database, which can
identify the time and frequency signature of each fibre type
failure. Furthermore, the information gained from each test
by the use of the AU method is evaluated in order to identify
the propagation medium characteristics, leading to the fact
that the construction of a valid and useful database depends
on the ability to characterize efficiently the source event of
each captured AE waveform. During the fibre bundle tests,
continuous AE activity was monitored, with smooth
accumulation of AE events. In addition, it was proved that
the same displacement rate does not lead to identical
mechanical behavior for different types of fibres and an
important dependency of the event location with the used
displacement rate was identified. However, there were no
evidences of dependence between the AE activity and the
displacement rate, while the material type exhibits a major
effect on the recorded AE activity and AU response.
In order to develop the AE database, a number of
assumptions were made to extract valuable information. In
addition, waveform selection criteria for single fibre failure
events have been established, taking into account the
available knowledge from the literature. In order to
eliminate the effect of the TH parameter on the AE features
database content, a parametric sensitivity analysis was
applied. As long as the database content is concerned, it was
proved that single fibre failure generates AE activity with
medium Amp, low RT and medium Dur. In addition, the
calculated distributions of AE features’ values are neither
Uniform nor Gaussian, but most of them are non-
symmetrical. In the frequency domain part of the proposed
database, frequency signatures as FFT discrete peaks were
identified for many fibre types. More precisely, the
individual frequency peaks that characterize the propa-
gation via each fibre type vary in a range of 100–400 kHz
(middle frequencies), while the corresponding peak values
for fibre failure vary in a range of 20–400 kHz. According
to this study, the proposed identification procedure of the
frequency signature of the tested fibre types is an iterative
process. Moreover, a large number of AE and AU wave-
forms (representative set size) leads to a more reliable
signature extraction and to the development of a sufficient
frequency domain database. In addition, an investigation of
possible correlation between the AE features’ values and
identified dominant frequencies from the developed data-
base with fibre type/material class properties (diameter,
density, modulus of elasticity, tensile strength) was
conducted, resulting to very informative results. However,
the outcomes of this analysis are limited to the present study
case and more work has to be done in the future for the
investigation of the role of material parameters on
the characteristics of the emitted elastic waves. Finally,
proofs for the applicability of the AE database in a micro-to-
macro approach are given by the preliminary results in
testing conditions of isothermal mechanical fatigue loading
of Carbon/Epoxy coupons.
Acknowledgements
The authors are grateful to Professor G. Grathwohl and to
Dr M. Kuntz (University of Bremen, ermany) for their
collaboration, in the framework of the Joint Greek-German
Research Project (1999-2000). Also, the authors want to
acknowledge the technical assistance received by ICE-
HT/FORTH while performing the experimental part of this
work.
References
[1] ASM International, Composites. Engineered material handbook;
1987.
[2] Achenbach JD. Wave propagation in elastic solids. Amsterdam:
North-Holland; 1973.
[3] ASNT-9. Special nondestructive testing methods. Non Destructive
Testing Handbook. 1995;5:247–77.
[4] DIN 53942. Testing of textiles-flat bundle method; 1984.
[5] Hamstad MA, Moore RL. Acoustic emission from single and multiple
kevlar 49 filament breaks. J Compos Mater 1986;20:46–66.
[6] Giordano M, Calabro A, Esposito C, Amore AD, Nicolais L. An
acoustic emission characterization of the failure modes in polymer-
composite materials. Compos Sci Tech 1998;58:1923–8.
[7] Pappas YZ. Stochastic modeling of composite materials fatigue
response. PhD Dissertation. University of Patras, Greece; 2001.
[8] Ni Q, Iwamoto M. Wavelets transform of acoustic emission signals in
failure of model composites. Engng Fract Mech 2002;69:717–28.
[9] Prosser WH. Advanced waveform-based acoustic emission detection
of matrix cracking in composites. Mater Eval 1995;53:1052–8.
[10] Mizutani Y, Nagashima K, Takemoto M, Ono K. Fracture mechanism
characterization of cross-ply carbon-fiber composites using acoustic
emission analysis. NDT and E Int 2000;33:101–10.
[11] Qi G, Barhorst A, Hashemi J, Kamala G. Discrete wavelet
decomposition of acoustic emission signals from CFR composites.
Compos Sci Tech 1997;57:389–403.
[12] Ageorges C, Friedrich K, Ye L. Experiments to relate carbon-fibre
surface treatments to composite mechanical properties. Compos Sci
Tech 1999;59:2101–13.
[13] Russell SS, Henneke EG. Signature of acoustic emission from
graphite/epoxy composites. NASA Grant NSG 1238, Rep No VPI-E-
77-22; 1977.
[14] Clough RB, Chang JC, Travis JP. Acoustic emission signatures and
source microstructure using indentation fatigue and stress corrosion
cracking in aluminum alloys. Scri Met 1981;15:417–22.
[15] Cowking A, Attou A, Siddiqui AM, Sweet MAS. Testing E-glass fibre
boundless using acoustic emission. J Mater Sci 1991;26:1301–10.
[16] Jihan S, Siddiqui AM, Sweet MAS. Fracture strength of E-glass fibre
strands using acoustic emission. NDT E Int 1997;30(6):383–8.
[17] Mattei C. Identification of delamination onset in CFRP laminates
under fatigue testing using modal analysis of acoustic emission
signals. Presentation by CSM Materialteknik, Sweden; 2003.
[18] Johnson M, Gudmundson P. Broad-band transient recording and
characterization of AE events in composite laminates. Compos Sci
Tech 2000;20:2803–18.
Y.Z. Pappas et al. / NDT&E International 37 (2004) 389–401400

[19] Curtis GJ. The characterization of failure mechanisms by means of
acoustic emission. In Proceedings of Symposium on Acoustic
Emission, Imperial College; 1972.
[20] Suzuki M, Nakanishi H, Iwamoto M, Jinen E, Maekawa Z, Mori A.
Relationship between acoustic emission characteristics and structural
factors of composite materials. In Proceedings of Japan-US CCM-III,
Tokyo; 1986.
[21] Okada A, Yasujima T, Tazawa T. Fracture behavior and AE signals in
carbon fiber reinforced aluminium. Trans Jpn Inst Mat 1987;28:
1004–11.
[22] Anastasopoulos AA. Failure mechanism identification in composite
materials by means of acoustic emission: is it possible? In: Van
Hemelrijck D, Anastassopoulos AA, editors. Proceedings of Non
Destructive Testing, vol. 1. Rotterdam: Balkema; 1996. p. 143–9.
[23] Groot PJ, Wijnen PAM, Janseen BF. Real-time frequency determi-
nation of acoustic emission for different fracture mechanisms in
carbon/epoxy composites. Compos Sci Tech 1995;55:405–12.
[24] Park JM, Kim JW, Yoon DJ. Interfacial evaluation and microfailure
mechanisms of single carbon fiber/bismaleimide composites by
tensile and compressive fragmentation tests and acoustic emission.
Compos Sci Tech 2002;62:743–56.
[25] Mehan RL, Mullin JV. Analysis of composite failure mechanisms
using acoustic emission. J Compos Mater 1971;5:266–9.
[26] Stephens R, Pollock AA. Waveforms and frequency spectra of
acoustic emission. J Acou Soc Am 1971;50(3/2):904–10.
[27] Suzuki H, Kinjo T, Hayashi Y, Takemoto M, Ono K. Wavelet
transform of acoustic emission signals. J Acou Em 1996;14(2):
69–84.
Y.Z. Pappas et al. / NDT&E International 37 (2004) 389–401 401