Embed Size (px)
Citation preview

On the capability of static code analysis to detect security vulnerabilities
Katerina Goseva-Popstojanovaa,1, Andrei Perhinschib,2
aLane Department of Computer Science and Electrical Engineering, West Virginia University, Morgantown, WVbTASC Inc, Fairmont, WV
Abstract
Context: Static analysis of source code is a scalable method for discovery of software faults and security vulnera-bilities. Techniques for static code analysis have matured in the last decade and many tools have been developed tosupport automatic detection.Objective: This research work is focused on empirical evaluation of the ability of static code analysis tools to detectsecurity vulnerabilities with an objective to better understand their strengths and shortcomings.Method: We conducted an experiment which consisted of using the benchmarking test suite Juliet to evaluate threewidely used commercial tools for static code analysis. Using design of experiments approach to conduct the analysisand evaluation and including statistical testing of the results are unique characteristics of this work. In addition to thecontrolled experiment, the empirical evaluation included case studies based on three open source programs.Results: Our experiment showed that 27% of C/C++ vulnerabilities and 11% of Java vulnerabilities were missed byall three tools. Some vulnerabilities were detected by only one or combination of two tools; 41% of C/C++ and 21%of Java vulnerabilities were detected by all three tools. More importantly, static code analysis tools did not show sta-tistically significant difference in their ability to detect security vulnerabilities for both C/C++ and Java. Interestingly,all tools had median and mean of the per CWE recall values and overall recall across all CWEs close to or below 50%,which indicates comparable or worse performance than random guessing. While for C/C++ vulnerabilities one of thetools had better performance in terms of probability of false alarm than the other two tools, there was no statisticallysignificant difference among tools’ probability of false alarm for Java test cases.Conclusions: Despite recent advances in methods for static code analysis, the state-of-the-art tools are not very effec-tive in detecting security vulnerabilities.
Keywords: Security vulnerabilities, Common Weakness Enumeration (CWE), Static code analysis evaluation,Experiment, Case studies.
1. Introduction
Today’s economy is heavily reliant on computer systems and networks and many sectors, including finance, e-commerce, supply chain, transportation, energy, and health care cannot function without them. The growth of theonline commercial environment and associated transactions, and the increasing volume of sensitive information ac-cessible online have fueled the growth of cyber attacks by organized criminal elements and other adversaries [1].According to the 2014 report by the Ponemon Institute, the mean annualized cost of the cyber crime for 257 bench-marked organizations was $7.6 million per year, with average of 31 days to contain a cyber attack [2].
Deficiencies in software quality are among leading reasons behind security vulnerabilities. Vulnerability is de-fined as a property of system security requirements, design, implementation, or operation that could be accidentallytriggered or intentionally exploited and result in a security failure [3]. Basically, if a security failure has been experi-enced, there must have been a vulnerability. Based on the estimates made by the National Institute of Standards and
1Corresponding author. E-mail: [email protected]. Phone: + 1 304 293 9691. Postal address: Lane Department of ComputerScience and Electrical Engineering, West Virginia University, PO Box 6109, Morgantown, WV, 26506, USA
2This work was done while Andrei Perhinschi was affiliated with West Virginia University.
Preprint submitted to Information and Software Technology August 16, 2015

Technology (NIST), the US economy loses $60 billion annually in costs associated with developing and distributingpatches that fix software faults and vulnerabilities, as well as cost from lost productivity due to computer malware andother problems caused by software faults [4].
Therefore, it is becoming an imperative to account for security when software systems are designed and de-veloped, and to extend the verification and validation capabilities to cover information assurance and cybersecurityconcerns. Anecdotal evidence [5] and prior empirical studies [6, 7] indicated the need of using a variety of vulnerabil-ity prevention and discovery techniques throughout software development cycle. One of these vulnerability discoverytechniques is a static analysis of source code, which provides a scalable way for security code review that can be usedearly in the life cycle, does not require the system to be executable, and can be used on parts of the overall code base.Tools for static analysis have rapidly matured in the last decade; they have evolved from simple lexical analysis toemploy much more complex techniques. However, in general, static analysis problems are undecidable [8] (i.e., it isimpossible to construct an algorithm which always leads to a correct answer in every case). Therefore, static codeanalysis tools do not detect all vulnerabilities in source code (i.e., false negatives) and are prone to report findingswhich upon closer examination turn out not to be security vulnerabilities (i.e., false positives). To be of practical use,a static code analysis tool should find as many vulnerabilities as possible, ideally all, with a minimum amount of falsepositives, ideally none.
This paper is focused on empirical evaluation of static code analysis tools’ ability to detect security vulnerabilities,with a goal to better understand their strengths and shortcomings. For this purpose we chose three state-of-the-art,commercial static code analysis tools, denoted throughout the paper as tools A, B, and C. The criteria used to select thetools included: (1) have to be widely used, (2) specifically identify security vulnerabilities (e.g., using the CommonWeakness Enumeration (CWE) [9]) and support detection of significant number of different types of vulnerabilities,(3) support C, C++ and Java languages, and (4) are capable of analyzing large software applications, i.e., scale well.An additional consideration in the selection process was to choose one tool from each of the three main classes ofstatic code analysis tools [10] (given here in no particular order): ‘program verification and property checking’, ‘bugfinding’, and ‘security review’.
With respect to the vulnerabilities included in the evaluation, as in works focused on software fault detection [11],synthetic vulnerabilities can be provided in large numbers, which allows more data to be gathered than otherwisepossible, but likely with less external validity. On the other side, naturally occurring vulnerabilities typically cannotbe found in large numbers, but they represent actual events. Obviously either approach has its own advantages anddisadvantages; therefore, we decided to use both approaches.
The first evaluation approach is based on a controlled experiment using the benchmark test suite Juliet which wasoriginally developed by the Center for Assured Software at the National Security Agency (NSA) [12] and is publiclyavailable. Juliet test suite consists of many sets of synthetically generated test cases; each set covers only one kindof flaw documented by the Common Weakness Enumeration (CWE) [9]. Specifically, we used the largest subset ofthe Juliet test suite claimed to be detectable by all three tools, which consisted of 22 CWEs for C/C++ and 19 CWEsfor Java, with 21,265 and 7,516 test cases, respectively. Testing static code analysis tools with this benchmark testsuite allowed us: to cover a reasonably large number of vulnerabilities of many types; to automate the evaluation andcomputation of the tools’ performance metrics, such as accuracy, recall (i.e., probability of detection), and probabilityof false alarm; and to run statistical tests.
In addition to the experimental approach, our empirical evaluation includes three case studies based on opensource programs, two of which were implemented in C and one implemented in Java. Each program has a knownset of vulnerabilities that allow for quantitative analysis of the tools’ ability to detect security vulnerabilities. For thispart of the study, because of the relatively small number of known vulnerabilities the results were obtained by manualinspection of the static code analysis tools’ outputs. The evaluation based on case studies allowed us to gauge theability of static code analysis to detect security vulnerabilities in more complex settings.
The main contributions of this paper are as follows:
• The experimental evaluation was based on the Juliet test suite, a benchmark for assessing the effectiveness ofstatic code analyzers and other software assurance tools. Previous evaluations based on Juliet either did notreport quantitative results [13, 14] or used very small sample of test cases related to vulnerabilities in C codeonly [15].
• Our study reports several performance metrics – accuracy, recall, probability of false alarm, and G-score – for
2

individual CWEs, as well as across all considered CWEs. We used formal statistical testing to compare thetools in terms of performance metrics and determine if any significant differences exist. None of the relatedworks included statistical testing of the results.
• In addition to the experimental approach, three widely-used open source programs were used as case studies.By combining experimentation with case studies, we were able to get sound experimental results supported bystatistical tests and verify them in realistic settings.
Main empirical observations include:
• None of the selected tools was able to detect all vulnerabilities. Specifically, out of the 22 C/C++ CWEs, noneof the three tools was able to detect six CWEs (i.e., 27%), seven CWEs (i.e., 32%) were detected by a singletool or a combination of two tools, and only nine CWEs (around 41%) were detected by all three tools. Theresults obtained when running the Java test cases were similar. Out of the 19 CWEs, two CWEs (i.e., around11%) were not detected by any tool, thirteen CWEs (i.e., 68%) were detected by a single tool or a combinationof two tools, and only four were detected by all three tools. Note that ‘detect’ in this context does not meansdetecting 100% of ‘bad’ functions for that specific CWE. Rather, it means correctly classifying at least one badfunction.
• The selected static code analysis tools did not show statistically significant difference in their ability to detectsecurity vulnerabilities for both C/C++ and Java. In addition, the mean, median, and overall recall values for alltools were close to or below 50%, which indicates comparable or worse performance than random guessing.
• For C/C++ vulnerabilities, one of the tools had better performance in terms of probability of false alarm andaccuracy than the other two tools. No significant difference existed for Java vulnerabilities.
• No statistically significant difference existed in the values of G-score (i.e., harmonic mean of the recall and 1-probability of false alarm) neither for C/C++ nor for Java vulnerabilities. (G-score combines in a single measuretools’ effectiveness in detecting security vulnerabilities with their ability to discriminate vulnerabilities fromnon-flawed code constructs.)
• The experimental results related to tools’ ability to detect security vulnerabilities were confirmed on three opensource applications used as case studies.
The rest of the paper is organized as follows. Related work is presented in section 2, followed by the backgrounddescription of the structure and organization of the Common Weakness Enumeration (CWE) and the Juliet test suitein section 3. The design of the experimental study, its execution, and the analysis per individual CWEs and acrossall CWEs, including the results of statistical tests are given in section 4. Section 5 presents the findings based on thethree open source case studies. The threats to validity are presented in section 6, followed by the discussion of theresults in section 7 and concluding remarks in section 8.
2. Related Work
Despite the widespread use of static code analysis, only a few public evaluation efforts of static code analysis toolshave been undertaken, and even fewer with a focus on detection of security vulnerabilities.
We start with description of related works that used the Juliet benchmark as an input in evaluation of static codeanalysis tools [13, 14, 15, 16, 17]. These works are the closest to our work. The Software Assurance Metrics andTool Evaluation (SAMATE) project, sponsored by the U.S. Department of Homeland Security (DHS) National CyberSecurity Division and the National Institute of Standards and Technology (NIST), led to development of the Juliet testsuite – a collection of thousands of test programs with known security flaws. Since 2008 SAMATE has hosted severalStatic Analysis Tool Expositions (SATE) [18], which reviewed a wide variety of different static code analysis tools.NSA’s Center for Assured Software presented a methodology for studying static code analysis tools based on set ofartificially created test cases with known answers, such as Juliet [13]. The methodology included reporting on therecall, precision, and F-score, including bar graphs and precision-recall plots, per weakness. This work did not report
3

specific results of tools’ evaluations. Another study by the NSA [16], presented at the SATE IV workshop, tested eightcommercial and one open source static analysis tool for C/C++ and seven commercial and one open source tool forJava using the Juliet test suite. In that study, the evaluated tools were not identified and the quantitative results for eachtool were not made public. However, it was reported that 21% of the vulnerabilities in the C/C++ test cases and 27%of vulnerabilities in Java test cases were not detected by any tool. Furthermore, although open source tools detectedsome vulnerabilities, they were not among the best in any class of test cases. NIST’s report presented at SATE IV[14] provided details on evaluating five tools on Juliet 1.0 test suite. The reported results included the number of truepositives and false positives for thirteen weakness categories (i.e., groups of CWEs) and it was concluded that theanalysis can be improved by changing the categories and fine-tuning the procedure for matching the warnings to testcases. This report also described an evaluation based on four open source applications (two implemented in C/C++and two in Java) with known vulnerabilities and reported the numbers of directly and indirectly related warningsproduced by the tools.
One of the goals for developing the Juliet test suite was to enable empirical research based on large test sets.Recently, researchers have started to use Juliet test suite for evaluation of static code analysis [15, 17]. A small subsetof Juliet test suite was used in [15] to compare the performance of nine tools in detecting security vulnerabilities in Ccode. Specifically, this study used the SAMATE test-suite 45 with 78 test cases for a total of 21 CWEs to determinethe percentage of detected vulnerabilities (i.e., recall) and the SAMATE test-suite 46 with 74 test cases for a total of20 CWEs to determine the false positive percentage (i.e., false positive rate). The examined tools had recall valuesin the range from 52.8% to 76.9% and false positive rate from 6.5% to 63%. (These values were called ‘absolute’ in[15] and were obtained by taking into account only the vulnerabilities that specific tools were designed to detect, thatis, ‘vulnerabilities not covered’ were excluded.) A 2014 study [17] evaluated two commercial static analysis tools(which were not identified) using the Juliet test suite. This work did not provide detailed results; it only provided abar graph of recall values per CWE and the true positive, false positive, and false negative numbers for two selectedCWEs (i.e., CWE 134 and CWE 401).
Several studies evaluated static code analysis tools using other test suites or case studies [19, 20, 21, 22]. Universityof Hamburg in collaboration with the Siemens CERT [19] created a test suite consisting of injected vulnerabilities inotherwise clean code. This test suite was then used to compare the performance of six tools in detection of securityvulnerabilities. The findings showed that tools for analyzing C code scored within a range of 50-72 points out of thepossible 168, and that tools for analyzing Java code scored within a range of 53-89 points out of the possible 147.Similar to the work done by NSA [16], this study neither identified the evaluated tools nor presented results for eachtool.
The performance of three commercials tools, Polyspace Verifier, Coverity Prevent and Klocwork Insight, werecompared in [20]. Even through the evaluation was based on real industrial applications from Ericsson, the presentedresults were mainly qualitative, in a form of lessons learned. This work concluded that Coverity and Klocwork foundlargely disjoint sets of vulnerabilities. These two tools also seemed to sacrifice finding vulnerabilities in favor ofreducing the number of false positives, while PolySpace produced a high rate of false positives.
The effect of the false positive warnings produced by a static code analysis tool was studied in [21]. The researchteam found that while the developers were good at identifying true positives, false positive identification rates werenot better than chance and the developers’ experience had no effect on the false positive classification accuracy. Ina more recent study [22], the same research team used a single static code analysis tool to analyze four commercialproducts from Ericsson. The results indicated that most of the tool’s output was not security related and that falsepositives were an issue. Interestingly, the study showed that only 37.5% of false positives were correctly identifiedby the developers as false positives. Furthermore, it appeared that high numbers of false positives were detrimental tothe development process not only through the amount of time spent classifying them, but also through the added riskof “fixing” improperly classified false positives [22].
The last work in the group of papers that evaluated only static code analysis tools was focused on qualitativecomparison of eleven open source and one commercial static code analysis tools [23]. Tools were compared withrespect to the installation process, configuration, support, vulnerabilities coverage degree and support for handlingprojects. Although interesting, the study lacked quantitative comparison of tools’ performance.
Other related works considered multiple quality assurance techniques, such as static code analysis and penetrationtesting, and conducted comparative analysis using case studies [6, 7, 24]. Comparative evaluation of static codeanalysis, manual inspection, and execution-based testing using three large network service products from Nortel as
4

case studies was presented in [6]. Fault removal rates of the three static code analysis tools (i.e., Flexelint, Klocwork,and Illuma) were not different than the fault removal rate of manual inspection. On the other side, fault removal rateof execution-based testing was found to be two to three times higher than those of the static analysis tools. Note thatthis study was not exclusively focused on security vulnerabilities, which only comprised a small subset of the faultsexplored.
A recent study [7] compared four vulnerability detection techniques: automated static code analysis, exploratorymanual penetration testing, systematic manual penetration testing, and automated penetration testing. This study usedthree electronic health record systems as case studies to evaluate the four vulnerability detection approaches. Becausereal, large systems were used for evaluation, only true positives and false positives were reported (i.e., it was notfeasible to determine the false negatives). The results showed that the systematic manual penetration testing found themost design vulnerabilities, while automated static analysis found the most implementation related vulnerabilities.Furthermore, automated penetration testing was the most efficient discovery technique in terms of vulnerabilitiesdiscovered per hour. Static analysis resulted in many more false positives than the other three techniques and did quitepoorly on certain types of vulnerabilities.
The study presented in [24] was focused on security of Web services vulnerabilities and compared static codeanalysis and penetration testing with regard to SQL injection vulnerabilities. Three static code analysis tools and fourautomated penetration testing tools were used to detect vulnerabilities in a set of eight Web services. The performanceof the tools was evaluated in terms of vulnerability coverage and false positive rate. The study was concluded withthree key observations: static analysis provided more coverage than penetration testing, false positives were a problemfor both approaches but static analysis was affected more, and different tools often reported different vulnerabilitiesfor the same piece of source code.
The work presented in this paper combines experimental approach based on the Juliet test suite with case studyapproach based on three open source programs with known vulnerabilities. For our experiment, we used over 21,000test cases for 22 C/C++ CWEs and over 7,500 test cases for 19 Java CWEs. Previous evaluations based on Julieteither did not report detailed quantitative results [13, 14] or used a very small sample of only 152 test cases related tovulnerabilities in C code only [15]. Our study reports several performance metrics (i.e., accuracy, recall, probability offalse alarm, and G-score) for individual CWEs, as well as across all considered CWEs. Even more, we use the designof experiments approach and include formal statistical testing to compare the selected tools in terms of performancemetrics and determine if any significant differences exist. None of the related works included statistical testing ofthe results. Since experiments and case studies have their own advantages and disadvantages [25], by using bothapproaches, we were able to get sound experimental results supported by statistical tests and then verify them in arealistic setting based on using open source programs as case studies.
3. Background on the Common Weakness Enumeration and Juliet test suite
In this section we provide background information on the Common Weakness Enumeration [9] taxonomy regard-ing its design and hierarchical structure. We then describe the Juliet test suite [26] and briefly cover the structure ofits test cases. (More details on the Juliet test suite are given in Appendix A.)
The Common Weakness Enumeration (CWE) taxonomy aims at creating a catalog of software weaknesses andvulnerabilities. It is maintained by the MITRE Corporation with support from the Department of Homeland Security[9]. Each individual CWE represents a single vulnerability type or category. For example, CWE 121 is “Stack-basedBuffer Overflow”, CWE 78 is “OS Command Injection” and so on. The CWEs are organized in a hierarchical structurewith broad category CWEs at the top level. These top level CWEs may have multiple children, which in turn may ormay not have further children. Each CWE may have one or more parents and zero or more children. The further downthis hierarchy one goes the more specific the vulnerabilities become. Many static code analysis tools, either explicitlyor implicitly, map the warnings they produce to CWEs.
The Juliet test suite was developed by the National Security Agency (NSA) Center for Assured Software [12, 27]and has been made publicly available at the NIST web site [26]. It is a collection of test cases with known outcomes forassessing the effectiveness of static analyzers and other software-assurance tools in detecting security vulnerabilities.The test cases included in Juliet are synthetic, that is, they were created to represent well-characterized vulnerabilitiesmapped to large number of CWEs.
5

Out of more than 500 existing weaknesses in the CWE [9], some are hard to define and/or check for. Therefore,creators of the Juliet test suite selected a “minimum” set of weaknesses to be covered by Juliet, which includes CWEsthat are most common, CWEs that are most easily exploited, and CWEs that are caught by existing tools [27]. Ingeneral, static code analysis tools are focused on detecting code related weaknesses, and have very limited abilityto detect requirements and design related weaknesses. Nevertheless, they hold potential to significantly improve thesecurity of software applications because roughly half of all security weaknesses are introduced during coding [5].
Juliet test cases are organized in directories – one for each selected CWE. Each CWE directory has one or more (insome cases thousands) test cases. Multiple test cases for a single CWE exist because often one kind of vulnerabilitycan be coded in different ways, some more complex than others.
Juliet test cases were designed to allow automatic evaluation of static analysis results, which was accomplishedby having a strict naming convention for functions and methods3. Each Juliet test case consists of one or two pages ofcode, and targets only one CWE. The incorrect code constructs (i.e., code with a vulnerability) are found in functionswhich have the string “bad” in their names. Each test case contains exactly one bad function and similar, but non-flawed code constructs to test the tool’s discrimination. These correct code constructs are found in functions whichhave the string “good” in their names. One or more good functions exist in each Juliet test case considered in thispaper4. This naming convention allows for automatic computation of the number of true positives, false positives, truenegatives, and false negatives.
4. Experimental evaluation using the Juliet benchmark test suite
The main motivations for using experimental approach with a benchmark test suite as input include (1) conductingthe analysis and evaluation in a sound context, (2) being able to automatically evaluate large number of well-designedtest cases that cover wide range of vulnerabilities, (3) being able, in addition to true positives and false positives, todetermine the true negatives (i.e., vulnerabilities not detected by the tools), which allowed us to evaluate the probabilityof vulnerability detection (i.e., recall), (4) using statistical tests to compare tools’ performance, and last but not least(5) allowing for repeatable empirical studies.
In this section, following the report structure for experimental studies recommended in [25], we first describe theexperimental design and execution, and then present the analyses per individual CWEs and across all CWEs.
4.1. Experimental designThe evaluation based on the Juliet test suite can be seen as a two factorial experimental design aimed to explore
the ability of the three selected static code analysis tools to detect security vulnerabilities across sets of C/C++ andJava CWEs, each consisting of multiple test cases. Thus, we have two factors (i.e., independent variables): (1) staticcode analysis tool and (2) type of CWE. Next, we discuss how we selected the levels of each factor.
The levels (i.e., treatments) of the first factor “static code analysis tool” are the specific tools used for evaluation.We started the tool selection process by compiling a survey which consisted of fifteen commercial tools and seventools licensed under some kind of open source license. The main characteristics of each tool were extracted fromtools’ Web sites and related works. The criteria used to select the tools included: (1) have to be widely used, (2)specifically identify security vulnerabilities (e.g., using the Common Weakness Enumeration (CWE) [9]) and supportdetection of significant number of different types of vulnerabilities, (3) support C, C++ and Java languages, and (4)are capable of analyzing large software applications, i.e., scale well. An additional criterion in the selection processwas to choose one tool from each of the three main classes of static code analysis tools defined in [10]: ‘programverification and property checking’, ‘bug finding’, and ‘security review’ static analysis tools. This way we were ableto cover a broad set of different methods used for detection of security vulnerabilities by the state-of-the-art staticcode analysis tools.
Therefore, from the list of 22 static code analysis tools we first excluded the tools that did not support C, C++,or Java, tools that did not include specific identification of security vulnerabilities, and tools that may be hard or im-possible to use for analysis of large scale software applications. We also excluded from the potential candidates those
3Throughout the paper we use the term “function” when referring to either C/C++ functions or Java methods.4It should be noted that, in addition to good and bad functions, Juliet test cases also contain source, sink, and helper functions. A more detailed
description of the Juliet test suite and these constructs are given in Appendix A.
6

tools that operate as ‘software as a service’ because that model of operation was likely to limit the experimentationand lead to acquiring cost.
For each of the remaining tools we considered the class it belongs to and the number of different vulnerability typesit was designed to support. This led to selection of three commercial tools, one from each class ‘program verificationand property checking’, ‘bug finding’, and ‘security review’. These tools are denoted throughout the paper as tools A,B and C (in no particular order).
Even though our initial list of candidates had seven open source tools, none of these tools was selected due toone or more of the following reasons: the tool was simplistic, was not widely used, and/or did not support detectionof security vulnerabilities. It should be noted that most of the related works presented in Section 2 also used onlycommercial tools [6, 7, 20, 21, 22]. Even more, in [21] authors claimed that “free-ware tools were too simplistic inan industrial setting.” This claim was supported by the results of the NSA study [16], which experimented with eightcommercial and one open source tools for C/C++ and seven commercial and two open source tools for Java. Theseresults showed that none of the open source tools performed the strongest in any of the weakness classes, and forsome weakness classes the open source tools were the weakest tools. The only open source tool on our short list ofcandidates was FindBugs (http://findbugs.sourceforge.net), which is considered to be a good tool for identifying bugsin Java code [10]. However, the preliminary exploration showed that FindBugs covers only five of the Java CWEsconsidered in this paper, and therefore was not included in the set of selected tools.
Next, we briefly describe the basic principles and methods used by static code analysis tools in each of the threeclasses. Note that for most commercial tools, it is hard to find detailed public documentation on the underlyingmethods and algorithms.
The tools from the ‘program verification and property checking’ class typically create an abstract model of theentire code and then use sophisticated symbolic execution to explore the program paths through the control-flow graph,and to reason about program variables and how they are related. Theorem-proving is used to prune the infeasibleprogram paths from the exploration. These tools also use checkers that traverse or query the model, looking forparticular properties or patterns that indicate software bugs. They also have capabilities to detect concurrency relatedfaults, such as race conditions, deadlocks, and livelocks.
The tools from the ‘bug finding’ class contain a predefined set of rules that describe patterns in code that mayindicate bugs, including a range of rules dedicated to finding security vulnerabilities. While some vulnerabilities aregeneric (e.g., buffer overflow), other are very specific (e.g., check the use of specific system calls that are known tobe used in security attacks). These tools also appear to extend their built-in patterns by inferring requirements fromthe code itself, doing some sort of inter-procedural analysis to prune some of the impossible paths, and establishingsimple relationships between variables.
The tools from the ‘security review’ class seem to combine techniques used by ‘property checkers’ and ‘bugfinding’ tools, with a narrower goal to identify security vulnerabilities. One approach is to convert the source codeto an intermediate format which is then used to locate security vulnerabilities. The analysis engine uses multiplealgorithms and secure coding rules to find vulnerabilities that can be exploited by attackers. In addition, the toolsanalyze the execution flow and data flow.
Next, we discuss the process used to select the levels of the second factor “type of CWE”. For this purpose, wefirst identified the set of CWEs covered by all three tools (i.e., CWEs that all tools were designed to support). Then,we selected the largest possible subset of Juliet test cases associated with these CWEs. This process resulted in 22different CWEs as levels of the second factor for C/C++ and 19 different CWEs as levels of the second factor for Java.These CWEs consist of over 21,000 test cases for C/C++ and over 7,500 test cases for Java, respectively. The listsof the 22 C/C++ CWEs and 19 Java CWEs used in our experiment and the numbers of corresponding good and badfunctions are given in subsection 4.2, Tables 1 and 2, respectively.
As response variables we used four metrics – accuracy, recall, probability of false alarm, and G-score – that rep-resent different aspects of static code analysis tools performance in detection of security vulnerabilities. To computethese response variables, for each of the three static code analysis tools and for each CWE i listed in Tables 1 and2, we first needed to compute the confusion matrix (i.e., the number of true positives TPi, false negatives FNi, falsepositives FPi, and true negatives TNi). These confusion matrices were then used to compute the response variables inour experiment (i.e., the metrics of tools’ performance):
7

Acci =TNi + TPi
TNi + FNi + FPi + TPi(1)
Ri =TPi
FNi + TPi(2)
Fi =FPi
TNi + FPi(3)
Gi =2Ri(1− Fi)
Ri + 1− Fi(4)
The accuracy, given with equation (1), provides the percentage of correctly classified instances, both bad and goodfunctions. The accuracy is in the range [0, 1] and higher values indicate better performance. It should be noted thatusing accuracy in cases when the data is imbalanced (i.e., one of the classes is significantly smaller than the other)may provide misleading results due to the fact that the smaller class will not contribute significantly to the accuracyvalues. We decided to use accuracy as one of the metrics in this paper because the Juliet test suite is fairly balanced(i.e., the number of bad and good functions do not differ significantly).
Probability of detection (often called recall), given with (2), accounts for the probability of correctly detectingvulnerabilities, i.e., it is defined as the ratio of true positives to the sum of true positives and false negatives. Recall isthus focused only on bad functions and represents the fraction of bad functions correctly classified by a tool.
Probability of false alarm, defined by (3), provides the probability of incorrectly classifying non-flawed constructsas flawed, or the ratio of false positives to the sum of true negatives and false positives. Probability of false alarm isfocused only on good functions and represents the fractions of good functions that were misclassified as vulnerabili-ties.
Recall Ri and probability of false alarm Fi quantify two different aspects of the static code analyzers performance.Recall is an important metric because it quantifies how successful static code analysis tools are in accomplishing theirfunctionality, i.e., detecting security vulnerabilities. However, these tools are not perfect and sometimes incorrectlyreport that a piece of code contains a vulnerability when no vulnerability exists, which is quantified by the probabilityof false alarm. This is an important metric because developers must manually examine each warning to establish ifit is true positive or false positive. In cases when the probability of false alarm is high (i.e., significant percentage ofgood functions are reported as bad), significant effort will be wasted. Both Ri and Fi are in the interval [0, 1], andhigh recall and low probability of false alarm values indicate better performance. Ideally, we want recall to be 1 andprobability of false alarm to be 0.
Using the Gi-score, which is a harmonic mean of Ri and 1 − Fi (4), allows us to integrate these two importantmetrics in a single number. Harmonic mean is particularly useful when dealing with rates or ratios, as in case ofrecall and probability of false alarm. It has several desirable properties, such as it is not very sensitive to outliersand min(Ri; 1− Fi) ≤ Gi ≤ max(Ri; 1− Fi). Also, the harmonic mean is smaller than both the geometric andarithmetic mean. The Gi-score values are in the interval [0, 1] and larger Gi-score values correspond to better perfor-mance. Ideally, we want Ri = 1 and Fi = 0 (i.e., 1 − Fi = 1), which leads to Gi = 1. If either Ri or (1 − Fi) is 0,Gi-score is 0 by definition.
The analyses of our experimental results consist of analysis per individual CWEs, which was based on perfor-mance metrics given with equations (1), (2), (3), and (4), and analysis of tools’ performance across all C/C++ CWEsand then across all Java CWEs. The goal of comparing the three selected tools across all CWEs was to find outwhether one or more tools have better overall ability to detect security vulnerabilities (i.e., better recall), preferablywith smaller number of false positives. For this purpose, we computed the standard measures of central tendency:median and mean (i.e., simple arithmetic average). In addition, we computed the overall metrics across all CWEs (forC/C++ CWEs and for Java CWEs separately) by lumping the confusion matrices for all CWEs i and computing theoverall accuracy Acc, overall recall R, overall probability of false alarm F , and overall G-score. These overall met-rics, computed across all CWEs, allowed us to compare our results with the results from related work [15]. (Overallrecall R is equivalent with ‘Absolute detection % of vulnerabilities covered’ used in [15] and overall probability offalse alarm F is equivalent with ‘% Absolute false positives’ used in [15].)
However, mean, median, and overall metrics each have their own limitations. Thus, mean values are susceptible
8

to outliers. Therefore, they allow tool’s excellent performance on one CWE to compensate for the overall bad per-formance. Or the opposite, a bad performance on several CWEs can prevail over the fair results on most of the otherCWEs. In general, such behavior may misrepresent tool’s performance. On the other side, outliers have little or noeffect on the median value of a performance metric (which is the middle number of a set of ordered values). However,if the gap between some numbers is large, while it is small between other numbers in the data, this can cause themedian to be an inaccurate representation of the middle of a set of values. Finally, overall metrics are predominatelyaffected by the CWEs with larger number of test cases. To overcome these pitfalls, we used statistical tests whichprovide more powerful, specialized procedures for testing the differences in the tools’ performance measured in termsof accuracy, recall, probability of false alarm, and G-score.
As mentioned above, the analysis based on the Juliet test suite can be seen as a two factorial experimental designaimed to detect the differences in three static code analysis tools (i.e., treatments) across sets of CWEs, each withmultiple test cases. In our experiment, we measured the performance of the tools on the same test cases, whichmeans that the samples are related (i.e., matched groups). Since the assumptions of the parametric repeated-measuresANOVA test (used for related samples) were not met, we used its non-parametric equivalent – the Friedman test –which is often called the two-way analysis of variance by ranks. Basically, the Friedman test ranks the tools for eachCWE (i.e., each row in Tables 1 and 2) separately; the best performing tool gets rank 1, the second best rank 2, andthe worst tool gets rank 3. Friedman test then compares the average ranks of tools across all CWEs.
For each performance metric (i.e., Acc, R, F , and G-score), the null-hypothesis being tested was that all threetools perform the same and the observed differences are merely random. If the null-hypothesis is rejected, Friedmantest indicates that at least one of the tools tends to yield larger values than at least one other tool (i.e., at least two toolshave different performance). Friedman test, however, does not identify where is the difference. For that purpose, apost-hoc test is used.
The instruments used in the experiment include guidelines and measurement instruments. The guidelines wererelated to Juliet test suite and how to treat the warnings produced by the static code analysis tools, and were mainlybased on the suggestions given in [28]. The measurement instruments consisted of several Python scripts developedby our team, which allowed automatic data collection and computation of the response variables. Details on theguidelines and measurement instruments are provided in the next subsection, in the context of the execution of theexperiment.
4.2. Execution of the experiment
Figure 1 presents the execution flowchart of our experiment. Next, we describe briefly each of the six steps shownin Figure 1.
Step 1: Identify the set of CWEs covered by all three tools & Select a subset of the Juliet test suite.Based on the tools’ documentation we identified the set of CWEs covered by all three tools (i.e., CWEs that all toolswere designed to detect). Then, we selected the largest possible subset of Juliet test cases associated with these CWEs.
Step 2: Run each tool on the subset of Juliet & Transform tools’ output in a common format.We used Juliet test cases identified in Step 1 as input to each of the three tools A, B, and C. Since tools produce reportsin different formats we wrote Python script to convert these reports into a common format. Our common format is anASCII text file containing in each line one warning massage produced by a static code analysis tool. Each line is acomma-separated value list containing information such as file name, function name, line number where the potentialvulnerability is located, and one or more CWEs that identify the type of vulnerability.
Step 3: Parse each CWE directory & Assemble a list of test cases and associated bad and good functions.This step is specific to the Juliet test suite and is common for the evaluation of all three tools. Its goal was to assemblea complete list of test cases used as an input in the evaluation and it was done by parsing each CWE directory in Julietto identify all test cases associated with that specific CWE. Then, for each test case included in our test suite, thescript parses the test case source files to obtain the lists of bad functions and good functions. This resulted in a list oftest cases for each CWE, with associated bad and good functions for each test case. The lists of CWEs for C/C++ andJava covered in our experiment and the numbers of corresponding good and bad functions are presented in Tables 1and 2, respectively. (As described in section 3, each test case contains exactly one bad function and one or more goodfunctions. Consequently, there are more good than bad functions in both Table 1 and 2 and the number of test casesused in our experiment is equal to the number of bad functions.)
9

Figure 1: Flow chart representing the execution of our experimentTable 1: List of C/C++ CWEs and the number of associated good and bad functions used in our experiments. Each test case has exactly one badfunction and one or more good functions. (The number of C/C++ test cases is 21,265.)
CWE (ID) Description # of good functions # of bad functions(78) OS Command Injection 5,770 4,410(122) Heap Based Buffer Overflow 8,407 5,665(134) Uncontrolled Format String 7,440 2,820(197) Numeric Truncation Error 1,116 846(242) Use of Inherently Dangerous Function 32 19(367) TOC TOU 64 38(391) Unchecked Error Condition 96 57(401) Memory Leak 4,434 1,684(415) Double Free 2,154 799(416) Use After Free 1,256 410(457) Use of Uninitialized Variable 2,940 924(467) Use of sizeof on Pointer Type 186 141(468) Incorrect Pointer Scaling 65 39(476) NULL Pointer Dereference 733 270(478) Missing Default Case in Switch 32 19(480) Use of Incorrect Operator 32 19(482) Comparing Instead of Assigning 32 19(561) Dead Code 2 2(562) Return of Stack Variable Address 3 3(563) Unused Variable 878 396(590) Free Memory Not on Heap 3,534 2,679(835) Infinite Loop 7 6Total 39,213 21,265
Step 4: For each tool, parse tool’s output & Compute the confusion matrix for each CWE.For each tool, this step computed automatically the confusion matrix for each CWE given in Tables 1 and 2. This wasdone by iterating through the tool’s output file in a common format produced in Step 2 and matching the warningsproduced by the tool to the list of bad and good functions assembled in Step 3. To allow for reproducibility, weprovide details on the test cases and warnings that were excluded from the evaluation, which was done following thesuggestions in [28].
10

Table 2: List of Java CWEs and the number of associated good and bad functions used in our experiments. Each test case has exactly one badfunction and one or more good functions. (The number of Java test cases is 7,516.)
CWE (ID) Description # of good functions # of bad functions(80) XSS 636 456(113) HTTP Response Splitting 5,088 1,824(129) Improper Validation of Array Index 6,148 2,204(190) Integer Overflow 7,314 2,622(259) Hard Coded Password 159 114(330) Insufficiently Random Values 31 18(382) Use of System Exit 31 18(396) Catch Generic Exception 62 36(404) Improper Resource Shutdown 3 3(476) NULL Pointer Dereference 422 151(486) Compare Classes by Name 31 18(489) Leftover Debug Code 31 18(497) Exposure of System Data 31 18(500) Public Static Field Not Final 1 1(568) Finalize Without Super 1 1(570) Expression Always FALSE 6 6(571) Expression Always TRUE 6 6(580) Clone Without Super 1 1(581) Object Model Violation 1 1Total 20,003 7,516
• Warnings that were not related to security vulnerabilities were excluded because this study is focused on theability of static code analysis tools to detect security vulnerabilities. Incidental flaws, which exist in almost allJuliet test cases, were also ignored because typically they are considered to be unrelated to security vulnera-bilities. The only exception were test cases specifically designed to address unreachable code (CWE 561) andunused variables (CWE 563).
• Windows-only test cases were also excluded from the experiment because the installation of one of the toolswas Linux-only. Around 2,100 test cases were Windows-only.
• Class-based flaw test cases were ignored because their naming convention clashes with the naming conventionof the much more numerous virtual function/abstract method test cases. It should be noted that class-based flawtest cases are a very small subset of the total number of Juliet test cases.
• Bad-only test cases, i.e., test cases that do not have a good function (with non-flawed construct) counterpartswere excluded from our analysis because they cannot be properly evaluated (i.e., false positives and true nega-tives cannot be counted). Note that only six C/C++ and eight Java test cases were bad-only.
• Warnings flagged within helper functions were ignored. This was done because in the event that a test casecontains more than one secondary good function as well as one or more helper function, the helper functioncannot be mapped to the secondary good function from which it was called. Note that this is an artifact of theautomatically generated nature of the Juliet test suite. (See Appendix A for definitions of helper, primary, andsecondary functions.)
The confusion matrices for each CWE were computed as follows. For each test case, the script parsed throughthe warnings associated with it and evaluated whether each warning message should be ignored as described aboveor it constitutes a true positive (TP), false negative (FN), false positive (FP), or true negative (TN). Basically, for eachCWE i
• If the CWE reported by the tool matched the CWE associated with the bad function we counted one true positive(TPi). For each bad function, only one true positive was counted regardless of how many warnings matched thecriteria for true positives.
11

• If the tool did not report a warning or reported different (i.e., incorrect) CWE that did not match the oneassociated with the specific bad function we counted one false negative (FNi).
• If the tool reported any CWE within a good function we counted one false positive (FPi).
• If the tool reported no warnings related to a good function we counted one true negative (TNi).
We believe that determining if the CWE reported by a static code analysis tool ‘matches’ the CWE associatedwith the specific bad function in the Juliet test suite goes beyond the exact match. This is due to the fact that, asdiscussed in Section 3, CWEs are related. Specifically, they form a hierarchical structure in which a given CWE mayhave one or more parents and zero or more children, with CWEs at lower levels of the hierarchy being more specific.For example, CWE 129 Improper Validation of Array Index listed in Table 2 is a more specific instance of its parents,which include CWE 20 Improper Input Validation and CWE 633 Weaknesses that Affect Memory. Consequently,warnings labeled CWE 129, CWE 20, and CWE 633 may refer to the same weakness, that is, if a static code analysistool reports CWE 20 or CWE 633 for a bad test case related to CWE 129, it is justifiable to treat that as a ‘match’ andcount the outcome as TP. Note that in the NIST’s report on the Static Analysis Tool Exposition (SATE) IV [14] CWEswere grouped into categories that were then used for evaluation, but concluded that improvements of the groupingshave to be made to improve the evaluation accuracy. Instead of coming up with groups of CWEs, we decided to relyon the existing relationships in the CWE taxonomy. Specifically, in computing the confusion matrices, we consideredthe CWE reported by a static code analysis tool to be a match to the CWE associated with the bad function if it was anexact match or one of its immediate parents or children in the CWE hierarchy. This approach enabled an evaluationthat is not too restrictive to penalize the static code analysis tools for reporting closely related CWEs (either moregeneral or more specific) to the one specified in the Juliet test cases.
To validate our automatic process for computing the confusion matrix for each CWE, we used as a sanity checkthe total number of bad functions and the total number of good functions counted in Step 3. That is, for each CWE i,a correct automatic computation of the corresponding confusion matrix results in
Number of bad functions for CWE i = TPi + FNi
Number of good functions for CWE i = FPi + TNi
Step 5: For each tool, compute the per CWE performance metrics.For each of the three static code analysis tools, in Step 4 we compute the confusion matrices (i.e., the number of TPi,FNi, FPi, and TNi) for each CWE i listed in Tables 1 and 2. These confusion matrices were then used to compute theresponse variables: accuracy Acci, recall Ri, probability of false alarm Fi, and Gi score given with equations (1), (2),(3), and (4), respectively.
Step 6: For each tool, compute the performance metrics across all CWEs & Run statistical tests.For each of the per CWE performance metrics computed in Step 5 (i.e., accuracy, recall, probability of false alarm,and G-score), we computed the standard measures of central tendency (i.e., mean and median) and the overall metricsacross all CWEs (for C/C++ CWEs and for Java CWEs separately). In addition, as discussed in subsection 4.1, foreach performance metric (i.e., Acc, R, F , and G-score), we tested the null-hypothesis that all three tools performed thesame (i.e., the observed differences were merely random) using the Friedman test. For the cases when the Friedmantest rejected the null hypothesis we used a post-hoc test to identify where was the difference.
4.3. Analysis per individual CWEsIn this section we report the analysis of tools’ performance per individual CWEs, for 22 C/C++ CWEs and 19
Java CWEs of the Juliet test suite that all three tools were designed to identify.The tools’ performance in terms of per CWE accuracy, recall, probability of false alarm and G-scores on the
C/C++ test cases associated with the CWEs listed in Table 1, are presented in the bar graphs shown in Figure 2.Figure 2a presents the per CWE accuracy Acci of the three tools for each of the C/C++ CWEs i. The accuracy
measures how good is the classification for both the bad and good functions. Higher accuracy values indicate betterperformance. From Figure 2a it can be observed that the three tools have similar performance with respect to accuracy,with Tool C performing slightly better. It should be noted that the accuracy values for all three tools for many CWEsare close or slightly above 50%, which is comparable or slightly better than random guessing.
12

The recall values Ri for the C/C++ CWEs are shown in Figure 2b. Higher recall values represent better perfor-mance, that is, a tool that can successfully detect specific type of vulnerability. The results showed that each tool had0% recall for some CWEs, i.e., performed rather poorly when it comes to detecting certain flawed constructs. Someof the CWEs were detected by one (i.e., CWE 467, CWE 468, CWE 562) or two tools (i.e., CWE 78, CWE 242, CWE367, CWE 590), and furthermore there were CWEs that were not detected by any of the three tools (i.e., CWE 197,CWE 391, CWE 478, CWE 480, CWE 482, CWE 835).
Figure 2c displays the values for the probability of false alarm Fi in analyzing the C/C++ CWEs. Here smallervalues indicate better performance as they represent less non-flawed constructs being misclassified as flawed. As canbe observed from Figure 2c, tool C had lower false positive rate than both tool A and tool B for all CWEs except CWE134 and CWE 242.
In general, recall and probability of false alarm when considered together provide much better picture of tools’performance. For example, if a high recall rate for a given CWE is associated with a high probability of false alarm(e.g., as tool A performed on CWE 78) it means that the tool does not discriminate well that particular CWE; ratherit tends to report related warnings regardless of the presence or absence of the flawed construct in the code. Asdescribed in section 4.1, the Gi-score allows us to evaluate both recall and probability of false alarm at once, with asingle metric. Gi-score values close to 1 indicate that the tool can detect a specific CWE well, with no or very littlefalse positives. As it can be seen from Figure 2d static code analysis tools did not perform particularly well; each ofthe tools had low or 0 Gi-score for many CWEs. Tool C had better Gi-scores than tools A and B on several CWEs,but worse on other CWEs (e.g., Gi = 0 on CWE 467 and CWE 468).
Another way to visualize static code analysis tools performance in term of both recall and probability of falsealarm is to use a ROC square. Figures 3a through 3c present the ROC squares for each of the three tools. In thesefigures the probability of false alarm is shown on the x-axis, while recall (i.e., probability of detection) is shown onthe y-axis. The closer a point is to the ideal point (0, 1), the better the tools performance is on that particular CWE.Based on these figures we made the following observations:
• For each of the three tools not many points are close to the ideal (0, 1) point.
• Tool C has a noticeably lower false alarm rate than both tool A and tool B.
• For each tool there are multiple CWEs at the (0, 0) point (represented by a large bubble) as a consequence ofthe tools failing to detect any of the test cases associated with those CWEs.
Next, we compare the per CWE performance of the three tools for the Java vulnerabilities listed in Table 2. As itcan be seen from Figure 4a accuracy values for Java vary more than those for C/C++ shown in Figure 2a. Furthermorewe observe that a combination of two or all three tools have 100% accuracy for several CWEs (i.e., CWE 500, CWE568, CWE 580, CWE 581), which means that for these CWEs the respective tool(s) classified correctly all constructs,both flawed and non-flawed.
Figure 4b presents the recall values for the Java CWEs. Similarly as in case of C/C++ CWEs, each tool has 0%recall for some CWEs. Specifically, some of the CWEs were detected by one (i.e., CWE 129, CWE 190, CWE 396)or two tools (i.e., CWE 330, CWE 382, CWE 404, CWE 476, CWE 497, CWE 500, CWE 568, CWE 570, CWE 571,CWE 580), and none of these three tools detected two CWEs (i.e., CWE 486, CWE 489).
Figure 4c displays the probability of false alarm values for the Java CWEs. Based on bar graphs, it appears thattool C performed better, with smaller probability of false alarm for some Java CWEs.
G-score values for the Java CWEs are shown in Figure 4d. Similarly as in case of C/C++ CWEs, each of thetools had low or 0% Gi-scores for many CWEs. Compared to C/C+ CWEs, on the negative side, all three tools hadGi-scores below 50% for more CWEs, while on the positive side two of the tools or all three tools had ideal 100%Gi-scores for several Java CWEs.
The ROC squares for the Java CWEs for tool A, tool B, and tool C are shown in Figures 5a, 5b, and 5c, respectively.The closer the points are to the ideal point (0, 1), the better the tools performance. Based on these figures we madethe following main observations:
• For each of the three tools not many points are close to the ideal (0, 1) point.
• For many CWEs, tool C had smaller false alarm rate than tools A and B.
13

(a) Accuracy (b) Recall
(c) Probability of false alarm (d) G-score
Figure 2: Per CWE performance metrics for the C/C++ CWEs
(a) Tool A (b) Tool B (c) Tool C
Figure 3: ROC squares for the C/C++ CWEs. The size of each bubble is proportional to the number of instances (i.e., CWEs) that specific bubblerepresents.
• For each tool there are multiple CWEs at the (0, 0) point (represented by a large bubble) as a consequence offailing to detect any of the bad functions associated with those CWEs.
4.4. Analysis across all CWEs
The per CWE evaluation presented in Section 4.3 provided insights into the performance of the static code analysistools for different CWEs. However, because there is a high variation of tools’ performance for different CWEs it ishard to draw conclusions about overall tools’ performance. Therefore, in this section we compare the performance oftools across all CWEs, with a goal to find out if any tool has better overall performance than others.
14

(a) Accuracy (b) Recall
(c) Probability of False Alarm (d) G-Score
Figure 4: Performance metrics for the Java CWEs
(a) Tool A (b) Tool B (c) Tool C
Figure 5: ROC squares for the Java CWEs. The size of each bubble is proportional to the number of instances (i.e.,CWEs) that specific bubblerepresents.
For each of the performance metrics (i.e., accuracy, recall, probability of false alarm, and G-score) Table 3 presentsthe median and the mean of the per individual CWE values, and the overall values computed across all CWEs, for allthree tools. (Note that all metrics have values between 0-100%, i.e., are in the interval [0, 1]. Higher values indicatebetter results for accuracy, recall, and G-score, while lower values are better for the probability of false alarm.)
As it can be seen from Table 3, tool C performed slightly better than the other tools for most metrics, except forthe recall for the Java CWEs for which tool A had the highest median and mean, while tool B had the highest overallrecall. Tool B also had higher overall G-score for Java CWEs. However, as discussed in Section 4.1, comparisons
15
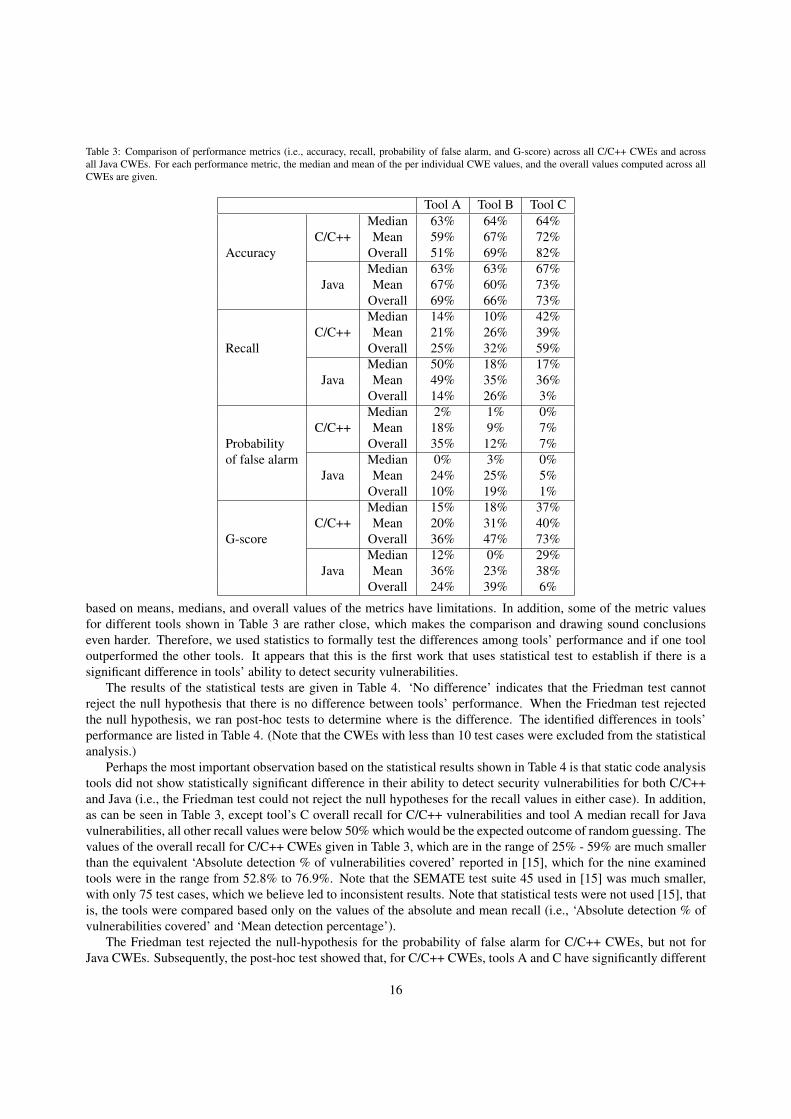
Table 3: Comparison of performance metrics (i.e., accuracy, recall, probability of false alarm, and G-score) across all C/C++ CWEs and acrossall Java CWEs. For each performance metric, the median and mean of the per individual CWE values, and the overall values computed across allCWEs are given.
Tool A Tool B Tool CMedian 63% 64% 64%
C/C++ Mean 59% 67% 72%Accuracy Overall 51% 69% 82%
Median 63% 63% 67%Java Mean 67% 60% 73%
Overall 69% 66% 73%Median 14% 10% 42%
C/C++ Mean 21% 26% 39%Recall Overall 25% 32% 59%
Median 50% 18% 17%Java Mean 49% 35% 36%
Overall 14% 26% 3%Median 2% 1% 0%
C/C++ Mean 18% 9% 7%Probability Overall 35% 12% 7%of false alarm Median 0% 3% 0%
Java Mean 24% 25% 5%Overall 10% 19% 1%Median 15% 18% 37%
C/C++ Mean 20% 31% 40%G-score Overall 36% 47% 73%
Median 12% 0% 29%Java Mean 36% 23% 38%
Overall 24% 39% 6%
based on means, medians, and overall values of the metrics have limitations. In addition, some of the metric valuesfor different tools shown in Table 3 are rather close, which makes the comparison and drawing sound conclusionseven harder. Therefore, we used statistics to formally test the differences among tools’ performance and if one tooloutperformed the other tools. It appears that this is the first work that uses statistical test to establish if there is asignificant difference in tools’ ability to detect security vulnerabilities.
The results of the statistical tests are given in Table 4. ‘No difference’ indicates that the Friedman test cannotreject the null hypothesis that there is no difference between tools’ performance. When the Friedman test rejectedthe null hypothesis, we ran post-hoc tests to determine where is the difference. The identified differences in tools’performance are listed in Table 4. (Note that the CWEs with less than 10 test cases were excluded from the statisticalanalysis.)
Perhaps the most important observation based on the statistical results shown in Table 4 is that static code analysistools did not show statistically significant difference in their ability to detect security vulnerabilities for both C/C++and Java (i.e., the Friedman test could not reject the null hypotheses for the recall values in either case). In addition,as can be seen in Table 3, except tool’s C overall recall for C/C++ vulnerabilities and tool A median recall for Javavulnerabilities, all other recall values were below 50% which would be the expected outcome of random guessing. Thevalues of the overall recall for C/C++ CWEs given in Table 3, which are in the range of 25% - 59% are much smallerthan the equivalent ‘Absolute detection % of vulnerabilities covered’ reported in [15], which for the nine examinedtools were in the range from 52.8% to 76.9%. Note that the SEMATE test suite 45 used in [15] was much smaller,with only 75 test cases, which we believe led to inconsistent results. Note that statistical tests were not used [15], thatis, the tools were compared based only on the values of the absolute and mean recall (i.e., ‘Absolute detection % ofvulnerabilities covered’ and ‘Mean detection percentage’).
The Friedman test rejected the null-hypothesis for the probability of false alarm for C/C++ CWEs, but not forJava CWEs. Subsequently, the post-hoc test showed that, for C/C++ CWEs, tools A and C have significantly different
16
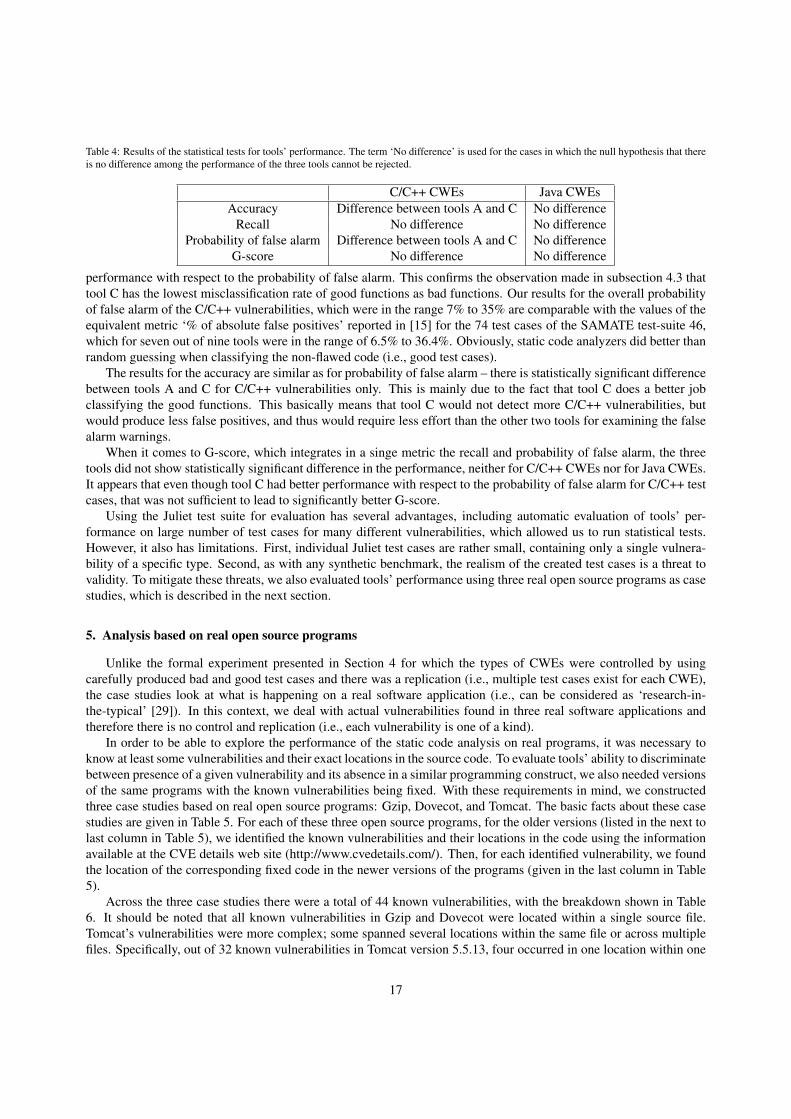
Table 4: Results of the statistical tests for tools’ performance. The term ‘No difference’ is used for the cases in which the null hypothesis that thereis no difference among the performance of the three tools cannot be rejected.
C/C++ CWEs Java CWEsAccuracy Difference between tools A and C No difference
Recall No difference No differenceProbability of false alarm Difference between tools A and C No difference
G-score No difference No difference
performance with respect to the probability of false alarm. This confirms the observation made in subsection 4.3 thattool C has the lowest misclassification rate of good functions as bad functions. Our results for the overall probabilityof false alarm of the C/C++ vulnerabilities, which were in the range 7% to 35% are comparable with the values of theequivalent metric ‘% of absolute false positives’ reported in [15] for the 74 test cases of the SAMATE test-suite 46,which for seven out of nine tools were in the range of 6.5% to 36.4%. Obviously, static code analyzers did better thanrandom guessing when classifying the non-flawed code (i.e., good test cases).
The results for the accuracy are similar as for probability of false alarm – there is statistically significant differencebetween tools A and C for C/C++ vulnerabilities only. This is mainly due to the fact that tool C does a better jobclassifying the good functions. This basically means that tool C would not detect more C/C++ vulnerabilities, butwould produce less false positives, and thus would require less effort than the other two tools for examining the falsealarm warnings.
When it comes to G-score, which integrates in a singe metric the recall and probability of false alarm, the threetools did not show statistically significant difference in the performance, neither for C/C++ CWEs nor for Java CWEs.It appears that even though tool C had better performance with respect to the probability of false alarm for C/C++ testcases, that was not sufficient to lead to significantly better G-score.
Using the Juliet test suite for evaluation has several advantages, including automatic evaluation of tools’ per-formance on large number of test cases for many different vulnerabilities, which allowed us to run statistical tests.However, it also has limitations. First, individual Juliet test cases are rather small, containing only a single vulnera-bility of a specific type. Second, as with any synthetic benchmark, the realism of the created test cases is a threat tovalidity. To mitigate these threats, we also evaluated tools’ performance using three real open source programs as casestudies, which is described in the next section.
5. Analysis based on real open source programs
Unlike the formal experiment presented in Section 4 for which the types of CWEs were controlled by usingcarefully produced bad and good test cases and there was a replication (i.e., multiple test cases exist for each CWE),the case studies look at what is happening on a real software application (i.e., can be considered as ‘research-in-the-typical’ [29]). In this context, we deal with actual vulnerabilities found in three real software applications andtherefore there is no control and replication (i.e., each vulnerability is one of a kind).
In order to be able to explore the performance of the static code analysis on real programs, it was necessary toknow at least some vulnerabilities and their exact locations in the source code. To evaluate tools’ ability to discriminatebetween presence of a given vulnerability and its absence in a similar programming construct, we also needed versionsof the same programs with the known vulnerabilities being fixed. With these requirements in mind, we constructedthree case studies based on real open source programs: Gzip, Dovecot, and Tomcat. The basic facts about these casestudies are given in Table 5. For each of these three open source programs, for the older versions (listed in the next tolast column in Table 5), we identified the known vulnerabilities and their locations in the code using the informationavailable at the CVE details web site (http://www.cvedetails.com/). Then, for each identified vulnerability, we foundthe location of the corresponding fixed code in the newer versions of the programs (given in the last column in Table5).
Across the three case studies there were a total of 44 known vulnerabilities, with the breakdown shown in Table6. It should be noted that all known vulnerabilities in Gzip and Dovecot were located within a single source file.Tomcat’s vulnerabilities were more complex; some spanned several locations within the same file or across multiplefiles. Specifically, out of 32 known vulnerabilities in Tomcat version 5.5.13, four occurred in one location within one
17

Table 5: Basic facts about open source programs used as case studies for evaluation of the static code analysis tools
Name (URL) Functionality LOC Language
Numberof knownvulnera-bilities
Versionwithknownvulnera-bilities
Versionwith fixedvulnera-bilities
Gzip Open source ˜8,500 C 4 1.3.5 1.3.6(www.gzip.org) archiving tool
Dovecot Open source ˜280,000 C 8 1.2.0 1.2.17(www.dovecot.org) IMAP/POP3 server
Tomcat Open source Java(tomcat.apache.org) Servlet & JavaServer ˜4,800,000 Java 32 5.5.13 5.5.33
Pages implementationTable 6: Types of vulnerabilities in the three open source case studies
Open Number ofsource Vulnerability type vulnerabilitiesprogramGzip Could not be mapped to any existing CWE 4
CWE 264 Permissions, privileges, and access controls 5Dovecot CWE 20 Improper input validation 1
CWE 399 Resource management errors 1Could not be mapped to any existing CWE 1CWE 22 Path traversal 7CWE 200 Information exposure 7CWE 79 Cross-site scripting 5
Tomcat CWE 20 Improper input validation 3CWE 264 Permissions, privileges, and access controls 3CWE 119 Improper restriction of operations within the bounds of a memory buffer 1CWE 16 Configuration 1Could not be mapped to any existing CWE 5
Total 44
file, nine occurred at multiple locations within one file, and 19 occurred across multiple files. (Note that CWE 399given in Table 6 is a parent of CWEs 401, 415, and 416 given in Table 1.)
Since the number of known vulnerabilities was small (i.e., 44 across all three case studies), matching tools’warning messages to the existing vulnerabilities and their fixed counterparts was done manually. We considered a truepositive (i.e., vulnerability being detected) if at least one of the file(s)/location(s) were matched by a tool’s warningwith the appropriate type of vulnerability.
Using case studies allowed us to evaluate tools’ performance on real vulnerabilities that existed in widely usedprograms. This type of evaluation, however, have different kind of limitations than evaluation with a benchmark suchas Juliet. Thus, since unknown vulnerabilities may still be present in the source code, the assessment of all falsenegatives is impossible, and therefore metrics such as recall cannot be estimated. Therefore, for the three case studieswe only analyzed the warnings related to the locations of the known vulnerabilities and used the versions with fixedvulnerabilities to evaluate the ability of the tools to discriminate between vulnerabilities (i.e., bad code that exists inthe older version) and similar code with fixed vulnerabilities (i.e., good code in the newer version).
Another limitation of using real, large case studies for evaluation is due to the fact that static code analysis toolsproduce significant number of warnings (see Table 7) that have to be inspected manually in order to determine thenumber of false positives. Since false positives are less important than true positives, we decided to restrict ouranalysis only to the known vulnerabilities and whether they were detected (i.e., true positive) or missed (i.e., falsenegative) by each of the three tools.
18

Table 7: Number of detected known vulnerabilities in the vulnerable versions of the three open source case studies
Tool A Tool B Tool CProgram Version number of detected/ number of detected/ number of detected/
warnings total known warnings total known warnings total knownvulnerabilities vulnerabilities vulnerabilities
Gzip 1.3.5 112 1/4 36 0/4 119 1/4Dovecot 1.2.0 8,263 0/8 538 0/8 1,356 0/8Tomcat 5.5.13 12,399 7/32 12,904 3/32 20,608 5/32
The results of tools’ evaluation based on the three open source programs are shown in Table 7. These resultsconfirm the findings based on the Juliet test suite - static code analysis tools were not very successful in detectingthe known vulnerabilities. Specifically, in case of the smallest program, Gzip, tools A and C detected one of the fourknown vulnerabilities in the version 1.3.5, but also reported the same vulnerability in the fixed version 1.3.6, which isactually a false positive. This result indicates that, for this specific vulnerability, tools A and C did not discriminatethe vulnerable code that existed in the older version and the similar code with fixed vulnerability in the newer versionof Gzip. Tool B did not identify any of the four know vulnerabilities in Gzip version 1.3.5. The results based onDovecot as a case study were even worse; none of the selected tools detected any of the eight known vulnerabilitiesin Dovecot version 1.2.0. For Tomcat, the largest of the three programs with the most complex vulnerabilities, toolA was the most successful; it detected seven out of the 32 known vulnerabilities in version 5.5.13, compared to threevulnerabilities detected by tool B and five vulnerabilities detected by tool C. However, when using the newer Tomcatversion 5.5.33 in which the known vulnerabilities from version 5.5.13 were fixed, tools A and C reported two and onevulnerabilities at the same locations as in version 5.5.13, respectively.
6. Threats to Validity
Empirical studies are subject to threats to validity, which we discuss in this section in terms of construct, internal,conclusion, and external threats.
Construct validity is concerned with ensuring that we are actually testing in practice what we meant to test. Thefirst threat to construct validity is related to the choice of static code analysis tools. The number of static code analysistools is steadily increasing. The tools we selected may not be representative of all other available tools that performstatic code analysis. Nevertheless, we believe that the results presented in the paper are representative for the currentstate-of-the-art in static code analysis because the three selected tools are widely-used commercial tools that belongto three different classes of static code analysis.
The tools’ output and consequently performance certainly depend on the code used as an input and the type ofvulnerabilities in the code. Using the Juliet test suite, which is publicly available benchmark that covers large numberof different vulnerabilities allowed for fair and repeatable evaluation. To allow for repeatability, we listed all CWEconsidered in the study, as well details on different types of test cases that have been ignored. It should be noted thatthe 22 C/C++ CWEs and 19 Java CWEs used in this paper were the largest possible set of Juliet CWEs ‘covered’ byall three selected tools. Two of the tools were designed to cover significantly larger number of CWEs. We used thislarger set of CWEs and repeated the analysis in order to mitigate the construct treat to validity due to limited numberof levels (i.e., types of CWEs). The results were consistent with those presented in subsection 4.3. Specifically, foreach of the two tools not many CWEs were detected with high recall (close to 1) and low probability of false alarm(close to 0). Furthermore, both tools failed to detect any of the test cases associated with multiple CWEs (i.e., hadzero recall). Last but not least, with respect to the code used for evaluation, in order to mitigate the threat that is dueto the fact that the Juliet test cases were synthetically generated and thus may not be realistic, we also used three opensource application to evaluate the selected tools on actual vulnerabilities.
Another threat to construct validity is related to how the CWEs reported by the tools are matched to the CWEsspecified in the Juliet test cases. Note that the exact matching is likely to underestimate the tools performance becauseCWEs are related and form a hierarchical structure in which lower level CWEs are more specific instances of theirparent(s) CWEs. Earlier works used groupings of CWEs in the evaluation [14], but concluded that these groupingshave to be improved. In general, due to the complex relationships among CWEs, there is no easy and consistent way togroup CWEs in groups of related types of weaknesses [14]. To avoid the two extremes – too restrictive exact matching
19

that may underestimate tools’ ability to detect vulnerabilities and using broad groups that may include not very closelyrelated vulnerabilities and overestimate tools’ ability to detect vulnerabilities – for determining if the CWE reportedby the static code analysis tool matched the CWE specified in the code we decided to use the established relationshipsin the CWE hierarchy, as described in subsection 4.2 (see Step 4).
The final threat to construct validity is related to the mono-method bias, i.e., to the use of a single metric to makeobservations. We addressed this threat by using several performance metrics (i.e., accuracy, recall, and probability offalse alarm) that measure different aspects of the static code analysis tools’ ability to detect security vulnerabilitiesand distinguish them from non-flawed code.
Internal validity threats arise when there are sources of influence that can affect the independent variables and/ormeasurements without researchers’ knowledge. In case of static code analysis, tools report large number of warningmessages that have to be manually inspected by developers and independent verification and validation analysts inorder to be classified as true positives or false positives. As with any classification, there is a potential for misclassifica-tion. An empirical study done in industrial setting [21] has shown that on average developers did not correctly classifythe warnings produced by a static code analysis tool and that only developers with specific experiences performed bet-ter than chance. Obviously, the human classification error is a threat to internal validity that could significantly affectthe reliability of the results. Using a benchmark test suite, such as Juliet, which clearly identifies the part of the codewith vulnerabilities (i.e., bad functions) and the counterparts with the same code without a flaw (i.e., good function)and allows for automatic classification of the warnings produced by the static code analysis tool eliminated the threatto validity due to human errors in the classification of the warnings produced by the tools. For the three case studiesbased on real, open source applications we determined manually if the tools reported true positives (in the versionswith known vulnerabilities) and false positives (in the versions with fixed vulnerabilities). No classification errorswere made in these cases because we knew the correct outcome (i.e., the existence or lack of a specific vulnerabilityin the exact location of the code) and the number of vulnerabilities was small.
Conclusion threats to validity are related to the ability to draw correct conclusions. We addressed this threat byutilizing a formal statistical experimental design using a benchmark to evaluate the tools. We carefully checked ourdata and applied appropriate non-parametric statistical tests. A small sample size is another threat to the conclusionvalidity of the results. Using the Juliet test suite, with many different well-defined CWEs and running the statisticaltests on CWEs that have large number of test cases, eliminated this threat to validity.
External validity considerations determine to what extent results can generalize. Since Juliet test cases are syn-thetically generated, we addressed this threat to validity by using case studies based on three widely-used, successfulopen source applications. The tools’ performance based on real software applications was consistent with the resultsbased on using the Juliet test suite. To further explore the external validity of the results, in the Section 7 we compareour results (both experimental based on Juliet and case studies based on open source applications) with related works.These works used one or more static analysis tools (some of which are likely different than the ones used in this paper)on Juliet and another synthetically generated benchmark, and on open source and industrial applications. It shouldbe noted that conducting these comparisons is not straightforward due to lack of details and/or different performancemetrics used in related works.
7. Discussion
The techniques for static code analysis have experienced rapid development in the last decade and many toolsthat automate the process have been developed. The implications of the empirical investigations described in thispaper for software developers lie primarily in supporting better understanding of the strengths and limitations of thestatic code analysis and the level of assurance that it can provide. The goal of this section is to summarize the mainfindings, to compare and contrast them with findings from related works, and most importantly to discuss the practicalimplications.
• (In)ability to detect vulnerabilities. In cases when a static analysis tool is used by a security assurance team,the capability of the tool to identify as many existing vulnerabilities as possible (preferably all) is of utmostimportance. Our main finding with respect to the tools’ per CWE performance include:
– None of the three tools performed well across all vulnerabilities.
20

– While in some cases tools detected different vulnerabilities, significant number of vulnerabilities were notdetected by any of the selected three tools. Specifically, none of the tools detected any of the bad test cases(i.e., vulnerability variants) associated with around 27% of C/C++ CWEs and close to 11% of Java CWEsfrom Juliet test suite used in our evaluation.
The first finding is consistent with results reported by all related works discussed in Section 2, some of whichused only one tool while others used multiple tools. Similar results to our second finding were reported bythree studies that used experimental approach based on multiple static code analysis tools [14, 16, 19]. (Notethat neither of these studies identified the tools used in their experiments.) Thus, the 2012 NSA study [16],which evaluated eight commercial and one open source static analysis tool for C/C++ and seven commercialand one open source tool for Java using the Juliet 1.1 test suite, reported that 21% of the vulnerabilities in theC/C++ test cases and 27% of vulnerabilities in Java test cases were not detected by any tool. The NIST’s reportpublished in 2013 [14] presented in a tabular form the number of true positives and false positives reported byfive static code analysis tools for the Juliet 1.0 C/C++ CWEs which were grouped into ten categories. Each ofthe five tools had zero true positives in multiple categories. Even though the comparison is not straightforward,it appears that similar results were also reported in the 2008 study [19], which explored the performance of sixtools using a test suite created for that purpose. Based on the scoring system that assigned three points for eachtrue positive, one point for each false positive, and zero points for each false negative result, the six tools scored30-43% of the total points for C vulnerabilities and 36-61% for Java vulnerabilities. These results are strongindication of a high number of false negatives.
Perhaps the most important findings, which were made for the first time in this paper, are related to the tools’performance across all types of vulnerabilities:
– There were no statistically significant differences among selected tools’ ability to detect vulnerabilities.
– The capability of the selected static code analyzers to detect vulnerabilities was close to or worse thanrandom guessing (i.e., recall values were close to or below 50%).
Note that none of the related works used formal statistical tests to compare tools’ performance and few reportedquantitative values for the probability of detection (i.e., recall). The closest to our work is the 2013 study [15],which only considered vulnerabilities in C code and for the nine examined tools reported ‘absolute detection %of vulnerabilities covered’ in the range from 52.8% to 76.9%. These results were obtained using much smallertest suite of only 75 test cases, which most likely is the reason for somewhat inconsistent results.
The three open source case studies used in this paper, which had a total of 44 known vulnerabilities, confirmedthe limited capability of the selected static code analysis tools to detect security vulnerabilities. The tools wereable to detect from 0-25% of the known C vulnerabilities and from 9-21% of the known Java vulnerabilities.
It should be noted that most of the related works that used case studies did not report the number of falsenegatives. This is due to several reasons: lack of quantitative evaluation of security vulnerabilities [6], theexistence and location of the security vulnerabilities were not known [7, 20], and the goal of the study wasdifferent (such as for example to study the ability of human experts to classify the tool generated warnings toeither true positives or false positives [22]). Only a few studies reported the false negatives. Thus, a study ofstatic code analysis tools used in industry reported the false negatives for two of the evaluations that were basedon industrial case studies from Ericsson (see Evaluations 3 and 5) [20]. Specifically, in an old version of anapplication none of the two static code analysis tools reported any of the known memory leaks, although theywere able to find memory leaks in different locations and other bugs. For another Ericsson product, which wasimplemented in Java and had a number of known software bugs (i.e., faults), none of the known bugs weredetected by the three commercial tools used in [20]. (The specific number of known bugs and discussion onthe types of security vulnerabilities were not given in [20].) Another related work that was focused only onSQL injection vulnerabilities and used eight Web services as case studies [24] reported that the three staticcode analysis tools were able to detect (i.e., cover) 39%, 82%, and 100% of the known vulnerabilities identifiedby experts. These more favorable results, which were based on one specific type of applications (i.e., Webservices) and one specific type of vulnerability (i.e., SQL injection), were not supported by the broader rangeof applications and types of vulnerabilities present in our three case studies.
21

Our results and similar findings by related works indicate that the state-or-the-art static code analysis cannotprovide assurance that software systems are free of vulnerabilities and therefore have to be used in combinationwith other vulnerability detection techniques.
• The price of false positives. Static code analysis tools produced significant number of false positives (withoverall probability of false alarm from 7% to 35% for C/C++ and from 1% to 19% for Java). Having inmind that false alarm is the ratio of the non-flawed functions reported as vulnerabilities over the all non-flawedfunctions, it appears that static code analyzers performed better than random guessing when classifying the non-flawed code constructs (i.e., good functions) in Juliet. Furthermore, unlike in the case of recall (i.e., probabilityof detection), one of the tools had significantly better performance with respect to reporting false alarms forC/C++ vulnerabilities, but not for Java.
The high number of false positives, in addition to high probability of false alarm, may result in low precision,which is defined as the ratio of detected vulnerabilities (i.e., true positives) over the total number of warnings(i.e., both true positives and false positives). In case of Juliet, our results showed overall precision from 28-82% for C/C++ CWEs and 34-56% for Java CWEs. These values were not reported in Table 3 for brevity,but are given here to allow for comparison with related works. Specifically, a recent study [7], which amongseveral other vulnerability detection techniques evaluated the static code analysis using only one commercialtool, reported precision from 2-26% for three open source electronic health record systems that were used ascase studies. These precision values are comparable to the lower-end precision values obtained for the Julietbenchmark in our study. The lower values obtained for the real software applications used in [7] may be due tothe fact that, unlike Juliet, real software applications have significantly more good code than bad code, whichmay increase the chances of reporting false positives and result in lower precision. In addition, the lowerprecision may be a characteristic of the specific tool used in [7], that is, other static code analysis tools mayhave resulted in higher precision.
In general, static code analysis tools report high number of false positives which leads to several practicalimplications:
– If the product is large, it will likely result in a large number of false positives to be inspected manually andconsequently in significant waste of resources. For some sensitive products, however, it may be acceptableto spend more analysis time in order to detect more vulnerabilities.
– High probability of false alarm may be more acceptable when the static code analysis tool is used as anearly vulnerability detector on a daily basis during development than if it is used late in the life cycle (e.g.,for verification and validation).
– Even if the cost of inspecting many false positives is acceptable, industrial experience has shown that thereare several other challenges [21]: developers were not better than random guessing in identifying the falsepositive warnings produced by a tool; a combination of practical experience from projects, security, anduse of the specific static code analysis tools were needed to improve the identification of false positives;and there is a risk of introducing new vulnerabilities while attempting to “fix” false positives incorrectlyclassified as true positives by the developers.
Having this in mind, selecting a tool with smaller probability of false alarm (assuming there is no difference inthe probability of vulnerability detection) is advantageous.
• Further improvements to techniques and tools for static code analysis are needed. Static code analysis canbe used during software development to support accounting for security and other software quality concernsearly in the life cycle. It can be used on incomplete systems and in most cases scales well with a large codebase. Therefore, automated static code analysis holds potential to improve products security. However, theevaluation results presented in this paper showed that even though using state-of-the-art static code analysistools may improve software products security, they do not provide any assurance and require significant manualeffort for classification of reported warnings. In order to achieve more cost efficient identification of securityvulnerabilities and higher assurance in software quality, static code analysis techniques and tools need to befurther improved.
22

8. Conclusion
This paper is focused on evaluation of the ability of static code analyzers to detect security vulnerabilities. Forthis purpose we used an experimental approach based on using the Juliet benchmark test suite which allowed us (1)to automatically evaluate tools’ performance on large number of test cases that cover wide variety of C/C++ and Javavulnerabilities, (2) to assess quantitatively tools’ performance, both per CWE and overall, across all CWEs, and (3)to conduct the analysis and evaluation in a statistically sound context, including testing the statistical significance ofthe results, which has not been done in the related work.
Our experimental results showed that, despite the recent advances in this area and the claims made by the tools’vendors, static code analyzers do not perform well in detecting security vulnerabilities in the source code. Specifically,
• Some CWEs were detected by all three tools, by a combination of two tools, or by a single tool. In this context‘detect’ means correctly classifying at least one of (in some cases) many bad functions created for specificCWE, that is, having per CWE recall greater than zero (rather than detecting all bad functions and having perCWE recall value of 100%).
• Other CWEs were completely missed by all three selected tools. In particular, all three tools had zero recall,that is, missed reporting all bad functions associated with six (i.e., 27%) of the C/C++ CWEs and two (i.e.,11%) of the Java CWEs.
• While tools’ ability to identify security vulnerabilities (i.e., correctly classify CWEs) significantly differed byweakness category, overall across all weakness categories none of the tools we explored significantly outper-formed the other tools (i.e., there was no statistically significant difference among the recall values). Even more,many per CWE recall values and across all CWE recall measures (i.e., median, mean, and overall recall) wereclose to or below 50%, thus exhibiting worse performance than random guessing.
These results suggest that one cannot rely solely on static code analysis because doing so would leave a large numberof vulnerabilities undiscovered.
Our empirical investigation combined the controlled experiment with case studies approach based on three opensource programs that had a total of 44 known vulnerabilities. The results of the case study based evaluation wereconsistent with the experimental evaluation based on the Juliet test suite, that is, validated the conclusion that staticcode analysis tools have high false negative rates (i.e., have a limited ability to identify security vulnerabilities).
Appendix A: Description of the Juliet test case format
This appendix provides more detailed description of the format of the Juliet test cases.
• All C test cases and the vast majority of C++ and Java test cases implement flaws contained in arbitrary func-tions. These test cases are called non-class-based flaw test cases. The simplest of these test cases consist of asingle source file, while the more complex test cases are often implemented within multiple files.
• Each non-class-based flaw test case contains exactly one primary bad function. For test cases which spanmultiple files this primary bad function is located in the primary file.
• Each non-class-based flaw test case contains exactly one primary good function. This primary good functiondoes not contain non-flawed constructs, its only purpose is to call the secondary good functions.
• Each non-class-based flaw test case contains one or more secondary good functions. Simpler test cases will havethe non-flawed construct in the secondary good function(s), however in more complex test cases the secondarygood function(s) can also be used to call some source and/or sink functions.
• Non-class-based flaw test cases which test for different data flow variants use source and sink functions. Thesesource and sink functions can be either good or bad. Each such function can be mapped to either the primarybad function or exactly one secondary good function.
23

• When the implementation of a flaw cannot be represented within a single function, helper functions are used.Helper functions are mapped to either the bad function or one of the good functions. The source and sinkfunctions mentioned above are not considered helper functions.
• Very few C++ and Java test cases implement vulnerabilities which are based on entire classes as opposed toindividual statements or blocks of code. These are called class-based flaw test cases and are implemented acrossmultiple files with each file containing a separate class.
• Each class-based flaw test case has one bad file. This file contains the required bad function.
• Each class-based flaw test case has one good file. This file contains a primary good function as well as one ormore secondary good functions.
• There are some test cases for certain flaw variants for C++ and Java which use virtual functions, in the case ofC++, or abstract methods, in the case of Java. These test cases can be comprised of four or five files.
• Very few of the test cases contain only flawed constructs. As Juliet was being designed it was found that non-flawed constructs which correctly rectify the flaw being tested could not be generated for a small number ofnon-class-based vulnerabilities, which resulted in these bad-only test cases.
Acknowledgments
This work was funded in part by the NASA Independent Verification and Validation Facility in Fairmont, WVthrough grant managed by TASC Inc. Authors thank Keenan Bowens, Travis Dawson, Roger Harris, Joelle Loretta,Jerry Sims, and Christopher Williams for their input and feedback. We also thank the anonymous reviewers for theircomments and suggestions.
Any opinions, findings, and conclusions or recommendations expressed in this material are those of the authorsand do not necessarily reflect the views of NASA and TASC Inc.
References
[1] Cyberspace policy review: Assuring a trusted and resilient information and communications infrastructure (2009).[2] 2014 Global report on the cost of cyber crime. Ponemon Institute research report (2014).[3] Source code security analysis tool functional specification version 1.0, National Institute of Standards and Technology, Special Publication
500-268 (2007).[4] M. Zhivich, R. K. Cunningham, The real cost of software errors, IEEE Security & Privacy 7 (2) (2009) 87–90.[5] G. McGraw, Software Security: Building Security In, Addison-Wesley Professional, Boston, 2006.[6] J. Zheng, L. Williams, N. Nagappan, W. Snipes, J. P. Hudepohl, M. A. Vouk, On the value of static analysis for fault detection in software,
IEEE Transactions on Software Engineering 32 (4) (2006) 240–253.[7] A. Austin, C. Holmgreen, L. Williams, A comparison of the efficiency and effectiveness of vulnerability discovery techniques, Information
and Software Technology 55 (7) (2013) 1279–1288.[8] B. Chess, G. McGraw, Static analysis for security, IEEE Security & Privacy 2 (6) (2004) 76–79.[9] Common Weakness Enumeration, https://cwe.mitre.org/ (accessed December 21, 2014) (September 2013).
[10] B. Chess, J. West, Secure Programming with Static Analysis, Addison-Wesley Software Security Series, Boston, 2007.[11] H. Do, S. Elbaum, G. Rothermel, Supporting controlled experimentation with testing techniques: An infrastructure and its potential impact,
Empirical Softw. Engineering 10 (4) (2005) 405–435.[12] T. Boland, P. E. Black, The Juliet 1.1 C/C++ and Java test suite, IEEE Computer 45 (10) (2012) 88–90.[13] CAS Static Analysis Tool Study - Methodology, Center for Assured Software, National Security Agency,
http://samate.nist.gov/docs/CAS(accessed December 21, 2014) (December 2012).[14] V. Okun, A. Delaitre, P. E. Black, Report on the static analysis tool exposition (SATE) IV, Tech. rep., NIST (January 2013).[15] G. Dıaz, J. R. Bermejo, Static analysis of source code security: Assessment of tools against SAMATE tests, Information and Software
Technology 55 (2013) 1462–1476.[16] K. Erno, Sticking to the facts II: Scientific study of static analysis tools, in: Presentation at the SATE IV Workshop, Center for Assured
Software, National Security Agency, 2012.[17] L. M. R. Velicheti, D. C. Feiock, M. Peiris, R. Raje, J. H. Hill, Towards modeling the behavior of static code analysis tools, in: Proceedings
of the 9th Annual Cyber and Information Security Research Conference, ACM, 2014, pp. 17–20.[18] Static Analysis Tool Exposition, http://samate.nist.gov/SATE.html, (accessed December 21, 2014) (2013).[19] M. Johns, M. Jodeit, W. Koeppl, M. Wimmer, ScanStud: Evaluating static analysis tools, in: OWASP Europe, 2008.
24

[20] P. Emanuelsson, U. Nilsson, A comparative study of industrial static analysis tools, Electronic Notes in Theoretical Computer Science 217(2008) 5–21.
[21] D. Baca, K. Petersen, B. Carlsson, L. Lundberg, Static code analysis to detect software security vulnerabilities-does experience matter?, in:International Conference on Availability, Reliability and Security (ARES’09), IEEE, 2009, pp. 804–810.
[22] D. Baca, B. Carlsson, K. Petersen, L. Lundberg, Improving software security with static automated code analysis in an industry setting,Software – Practice and Experience 43 (2013) 259–279.
[23] T. Hofer, Evaluating static source code analysis tools, Master’s thesis, Ecole Polytechnique Federale de Lausanne (April 2010).[24] N. Antunes, M. Vieira, Comparing the effectiveness of penetration testing and static code analysis on the detection of SQL injection vul-
nerabilities in Web services, in: 15th IEEE Pacific Rim International Symposium on Dependable Computing (PRDC’09), IEEE, 2009, pp.301–306.
[25] C. Wohlin, P. Runeson, M. Host, M. C. Ohlsson, B. Regnell, A. Wesslen, Experimentation in Software Engineering, Springer-Verlag, NewYork, Dordrecht, London, 2012.
[26] Juliet test suite, http://samate.nist.gov/SRD/testsuite.php (accessed December 21, 2014) (2013).[27] P. E. Black, SAMATE and evaluating static analysis tools, Ada User Journal 28 (3) (2007) 184–188.[28] V. Okun, A. Delaitre, P. E. Black, Report on the third static analysis tool exposition (sate 2010), Tech. rep., SP-500-283, US Nat. Inst. Stand.
Techn (2011).[29] B. Kitchenham, L. Pickard, S. L. Pfleeger, Case studies for method and tool evaluation, IEEE Software 12 (4) (1995) 52–62.
25


![IEEE TRANSACTIONS ON SOFTWARE ENGINEERING, …community.wvu.edu/~kagoseva/Papers/MBPRA.pdf · Model-Based Performance Risk Analysis ... (RoseRT) [28] are ... proposed in the profile,](https://img.pdfslide.us/doc/110x75/5b0d8b387f8b9a952f8da80f/ieee-transactions-on-software-engineering-kagosevapapersmbprapdfmodel-based.jpg)