Embed Size (px)
Citation preview
On the application of morphometry and On the application of morphometry and fluid dynamics approaches for city fluid dynamics approaches for city
management and sustainabilitymanagement and sustainability
Dipartimento di Scienza dei Materiali - University of Salento (ITALY)[email protected]
[email protected]@unisalento.it
Silvana Di Sabatino, Laura Sandra Leo, Riccardo Buccolieri
AGE
Iglesias (Sardinia, Italy), 28-30 April 2011 O
n t
he
app
lica
tion
of
mor
ph
omet
ry a
nd
flu
id d
ynam
ics
app
roac
hes
for
cit
y…2
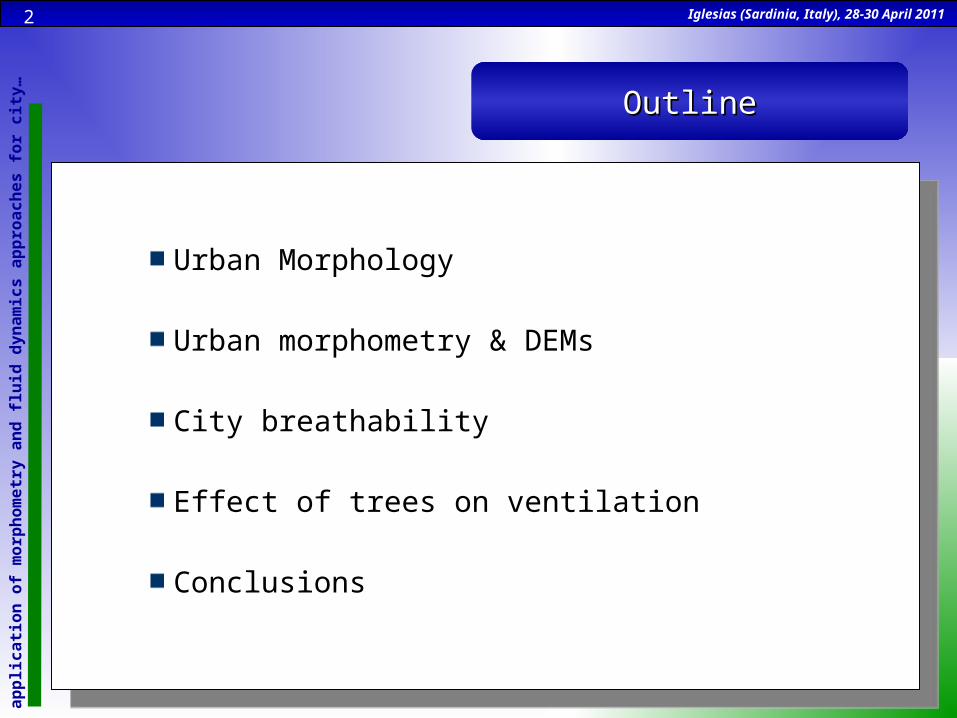
Urban Morphology
Urban morphometry & DEMs
City breathability
Effect of trees on ventilation
Conclusions
OutlineOutline

Iglesias (Sardinia, Italy), 28-30 April 2011 O
n t
he
app
lica
tion
of
mor
ph
omet
ry a
nd
flu
id d
ynam
ics
app
roac
hes
for
cit
y…3
Urban share of world’s population
Sustainable development:
“Development that meets the needs of the present without compromising the ability of future generations to meet their own needs." Brundtland Commission
Fluid dynamics contributes in various stages towards sustainability
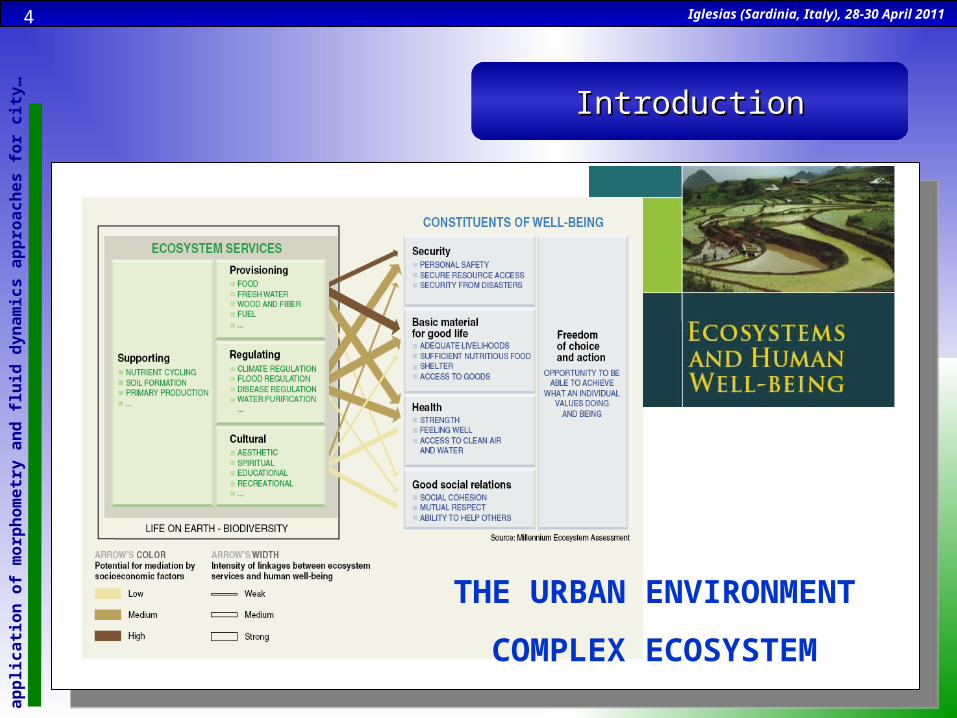
IntroductionIntroduction
The urbanisation growth is a worldwide issue. Society is facing a number of changes. We must consider if such a growth is sustainable, adaptability to new conditions (resilience), mitigation strategies…
Iglesias (Sardinia, Italy), 28-30 April 2011 O
n t
he
app
lica
tion
of
mor
ph
omet
ry a
nd
flu
id d
ynam
ics
app
roac
hes
for
cit
y…4
IntroductionIntroduction
THE URBAN ENVIRONMENT
COMPLEX ECOSYSTEM
Iglesias (Sardinia, Italy), 28-30 April 2011 O
n t
he
app
lica
tion
of
mor
ph
omet
ry a
nd
flu
id d
ynam
ics
app
roac
hes
for
cit
y…5
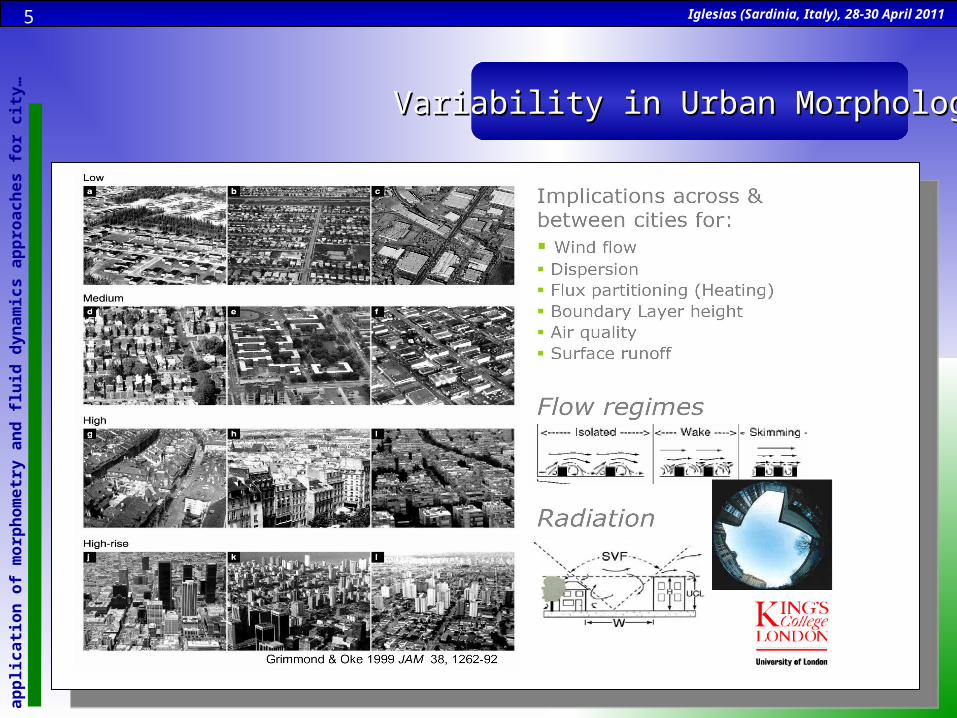
Variability in Urban MorphologyVariability in Urban Morphology
Iglesias (Sardinia, Italy), 28-30 April 2011 O
n t
he
app
lica
tion
of
mor
ph
omet
ry a
nd
flu
id d
ynam
ics
app
roac
hes
for
cit
y…6
Urban MorphometryUrban Morphometry
Iglesias (Sardinia, Italy), 28-30 April 2011 O
n t
he
app
lica
tion
of
mor
ph
omet
ry a
nd
flu
id d
ynam
ics
app
roac
hes
for
cit
y…7
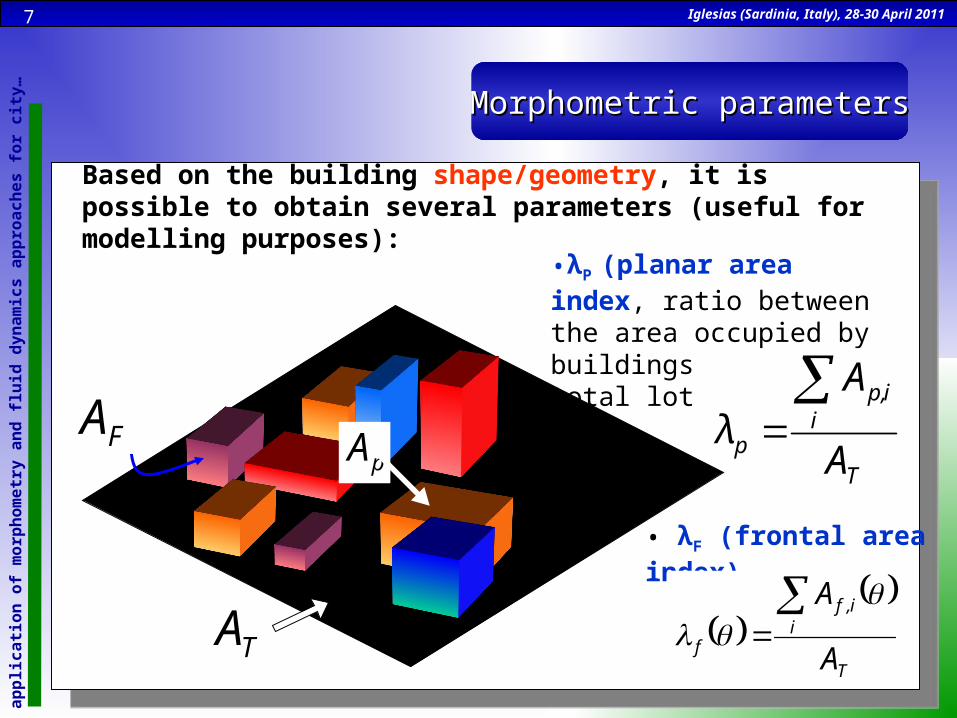
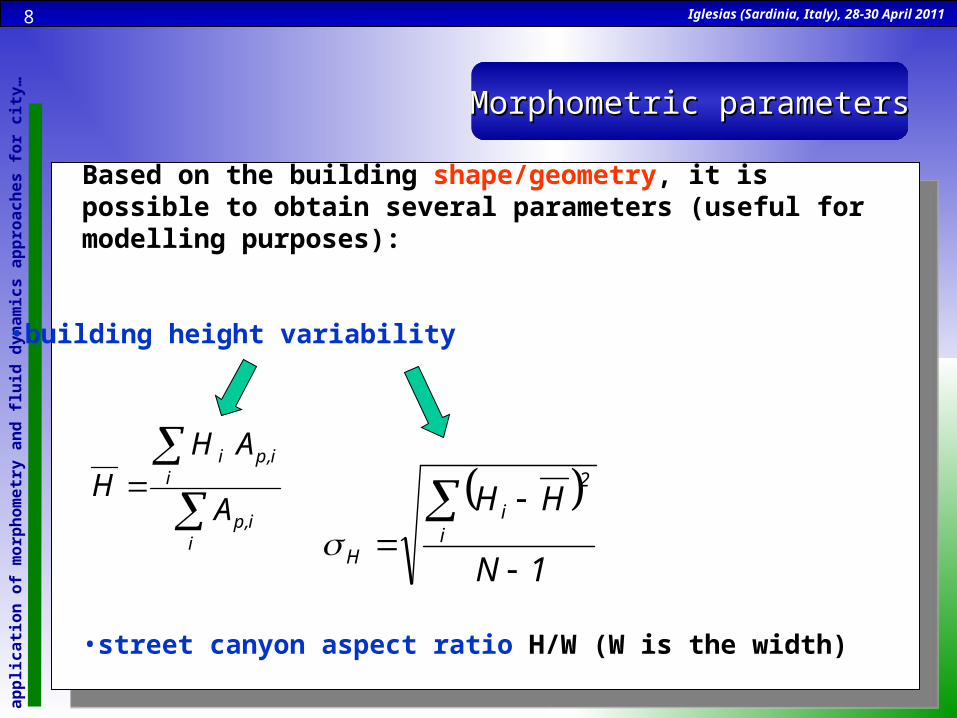
Based on the building shape/geometry, it is possible to obtain several parameters (useful for modelling purposes):
•λP (planar area index, ratio between the area occupied by buildings and the total lot area)
T
iip,
p A
Aλ
pA
Morphometric parametersMorphometric parameters
TA
• λF (frontal area index)
FA
T
ii,f
f A
A
Iglesias (Sardinia, Italy), 28-30 April 2011 O
n t
he
app
lica
tion
of
mor
ph
omet
ry a
nd
flu
id d
ynam
ics
app
roac
hes
for
cit
y…8
Morphometric parametersMorphometric parameters
•building height variability
•street canyon aspect ratio H/W (W is the width)
ii,p
ii,p i
A
AHH
1N
HHi
2
i
H
Based on the building shape/geometry, it is possible to obtain several parameters (useful for modelling purposes):
Iglesias (Sardinia, Italy), 28-30 April 2011 O
n t
he
app
lica
tion
of
mor
ph
omet
ry a
nd
flu
id d
ynam
ics
app
roac
hes
for
cit
y…9
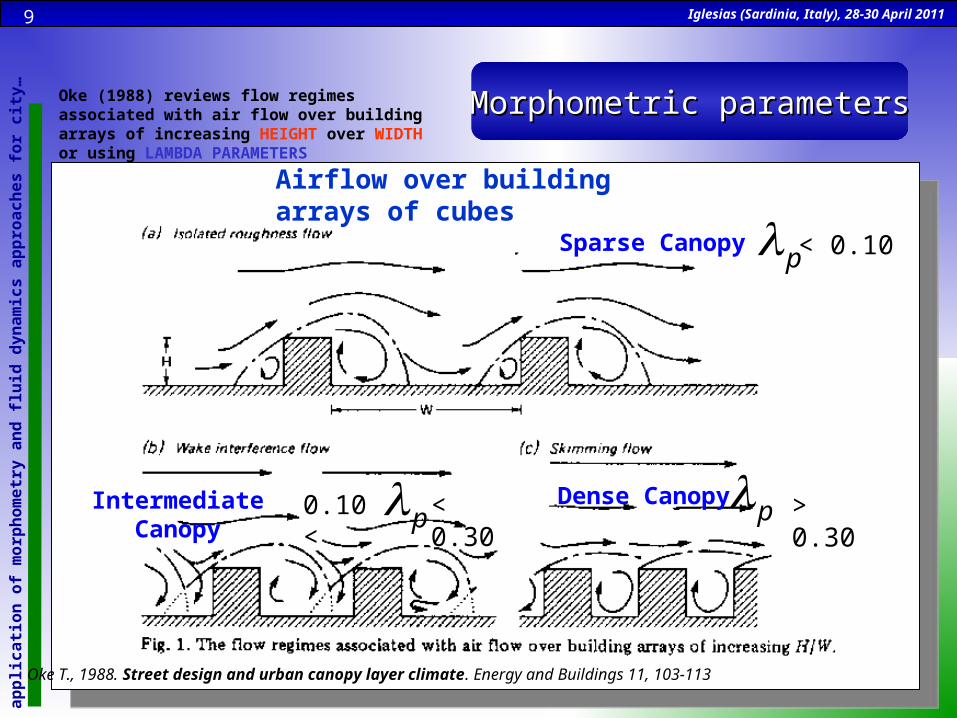
Morphometric parametersMorphometric parameters
p < 0.10 Sparse Canopy
Intermediate Canopy pp Dense Canopy0.10 < < 0.30 > 0.30
Airflow over building arrays of cubes
Oke (1988) reviews flow regimes associated with air flow over building arrays of increasing HEIGHT over WIDTHor using LAMBDA PARAMETERS
Oke T., 1988. Street design and urban canopy layer climate. Energy and Buildings 11, 103-113
Iglesias (Sardinia, Italy), 28-30 April 2011 O
n t
he
app
lica
tion
of
mor
ph
omet
ry a
nd
flu
id d
ynam
ics
app
roac
hes
for
cit
y…10
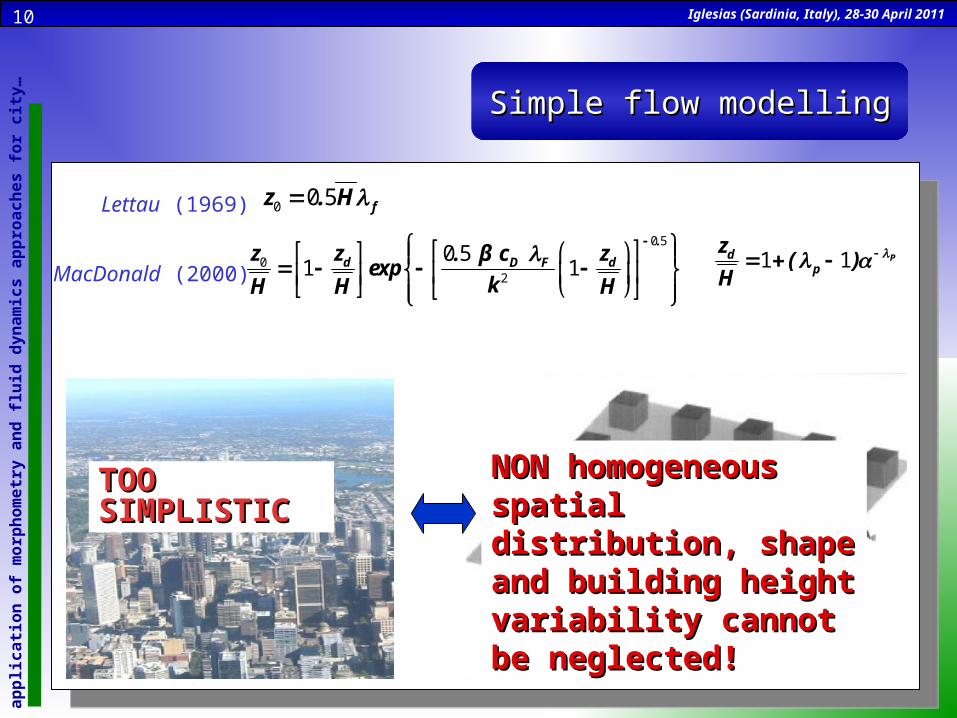
Simple flow modellingSimple flow modelling
0 5
02
0 51 1
.
d dD Fz z z. β cexp
kH H H
MacDonald (2000)
Lettau (1969) 0 0 5 fz . H
NON homogeneous spatial NON homogeneous spatial distribution, shape and distribution, shape and building height variability building height variability cannot be neglected!cannot be neglected!
1 1 Pdp
z( )
H
TOO TOO SIMPLISTICSIMPLISTIC
Iglesias (Sardinia, Italy), 28-30 April 2011 O
n t
he
app
lica
tion
of
mor
ph
omet
ry a
nd
flu
id d
ynam
ics
app
roac
hes
for
cit
y…11
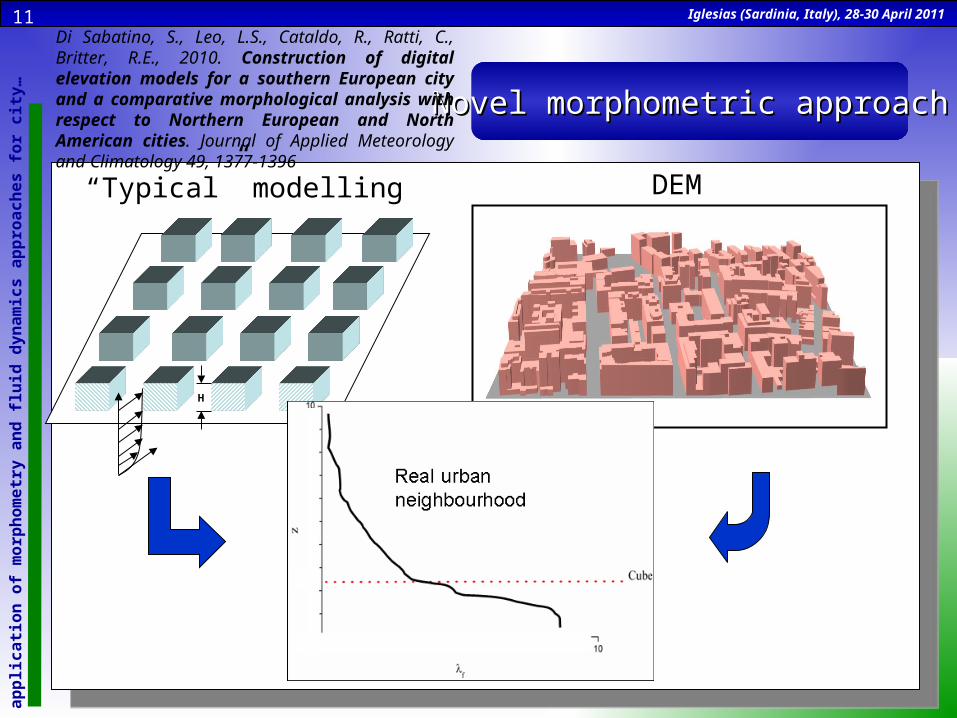
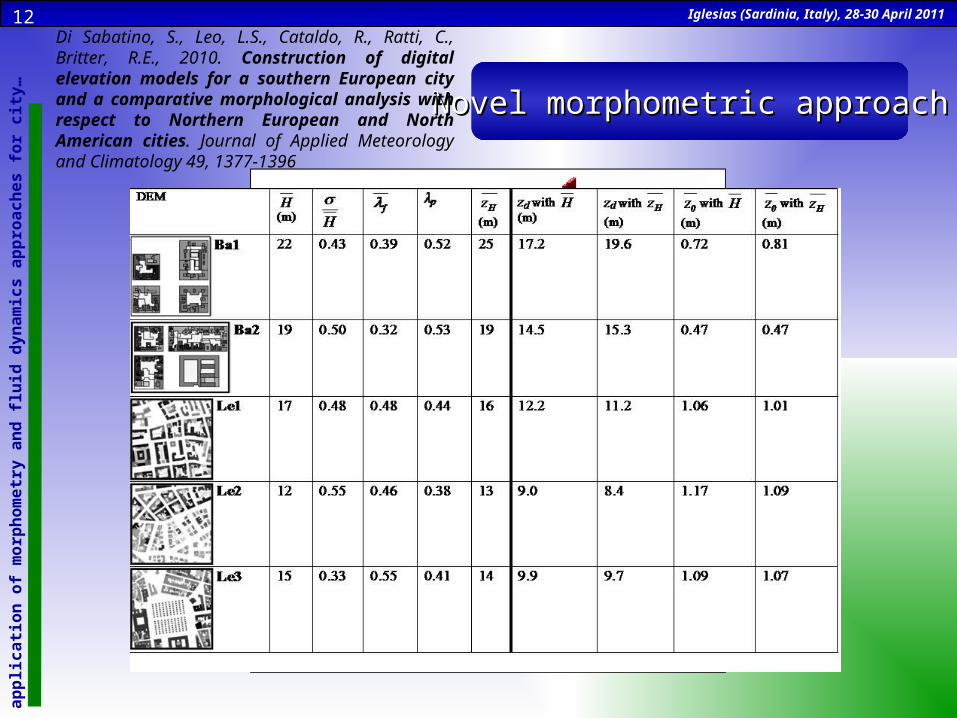
Novel morphometric approachNovel morphometric approach
H
DEM“Typical” modelling
Di Sabatino, S., Leo, L.S., Cataldo, R., Ratti, C., Britter, R.E., 2010. Construction of digital elevation models for a southern European city and a comparative morphological analysis with respect to Northern European and North American cities. Journal of Applied Meteorology and Climatology 49, 1377-1396
Iglesias (Sardinia, Italy), 28-30 April 2011 O
n t
he
app
lica
tion
of
mor
ph
omet
ry a
nd
flu
id d
ynam
ics
app
roac
hes
for
cit
y…12
Novel morphometric approachNovel morphometric approach
Di Sabatino, S., Leo, L.S., Cataldo, R., Ratti, C., Britter, R.E., 2010. Construction of digital elevation models for a southern European city and a comparative morphological analysis with respect to Northern European and North American cities. Journal of Applied Meteorology and Climatology 49, 1377-1396

Iglesias (Sardinia, Italy), 28-30 April 2011 O
n t
he
app
lica
tion
of
mor
ph
omet
ry a
nd
flu
id d
ynam
ics
app
roac
hes
for
cit
y…13
City breathabilityCity breathability
Iglesias (Sardinia, Italy), 28-30 April 2011 O
n t
he
app
lica
tion
of
mor
ph
omet
ry a
nd
flu
id d
ynam
ics
app
roac
hes
for
cit
y…14
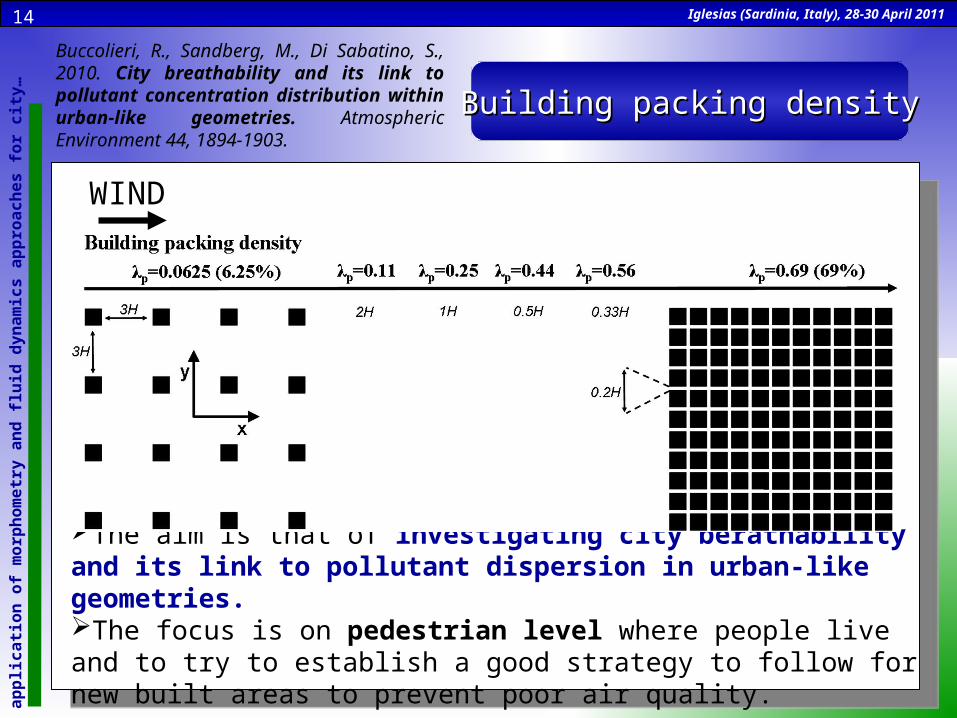
WIND
The aim is that of investigating city berathability and its link to pollutant dispersion in urban-like geometries. The focus is on pedestrian level where people live and to try to establish a good strategy to follow for new built areas to prevent poor air quality.
Building packing densityBuilding packing density
Buccolieri, R., Sandberg, M., Di Sabatino, S., 2010. City breathability and its link to pollutant concentration distribution within urban-like geometries. Atmospheric Environment 44, 1894-1903.
Iglesias (Sardinia, Italy), 28-30 April 2011 O
n t
he
app
lica
tion
of
mor
ph
omet
ry a
nd
flu
id d
ynam
ics
app
roac
hes
for
cit
y…15
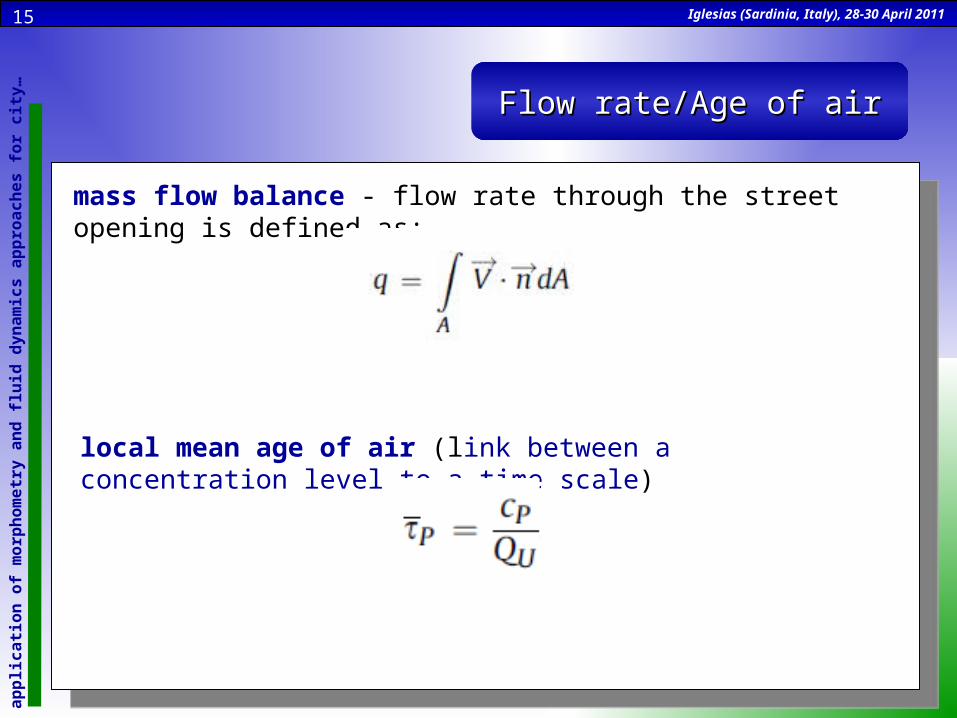
Flow rate/Age of airFlow rate/Age of air
mass flow balance - flow rate through the street opening is defined as:
local mean age of air (link between a concentration level to a time scale)
Iglesias (Sardinia, Italy), 28-30 April 2011 O
n t
he
app
lica
tion
of
mor
ph
omet
ry a
nd
flu
id d
ynam
ics
app
roac
hes
for
cit
y…16
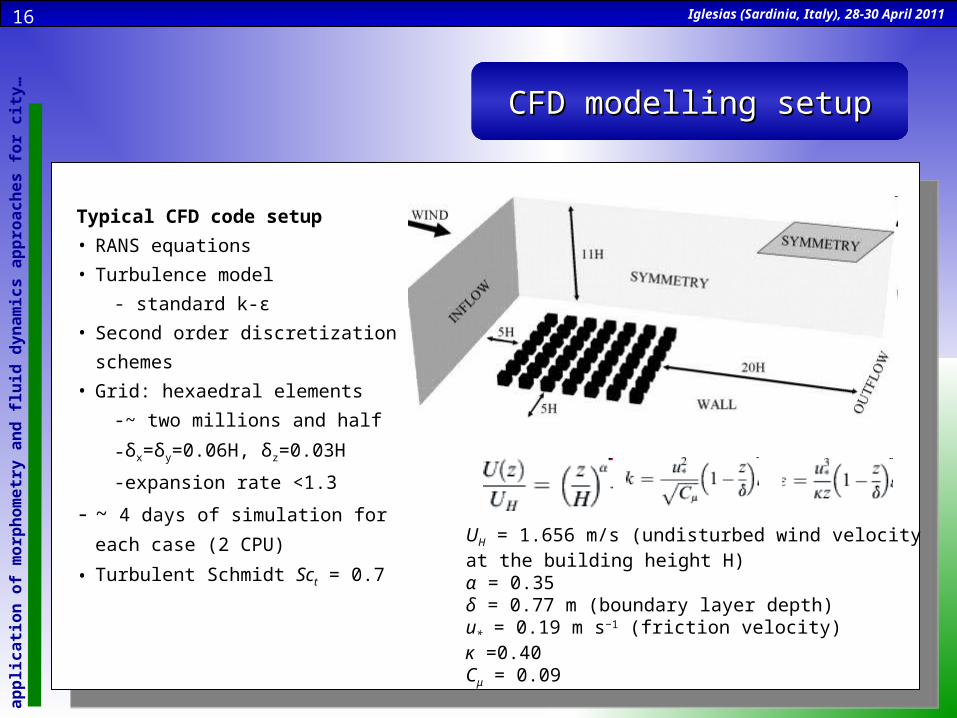
Typical CFD code setup
• RANS equations
• Turbulence model
- standard k-ε
• Second order discretization schemes
• Grid: hexaedral elements
- ~ two millions and half
- δx=δy=0.06H, δz=0.03H
- expansion rate <1.3
- ~ 4 days of simulation for each case (2 CPU)
• Turbulent Schmidt Sct = 0.7
CFD modelling setupCFD modelling setup
UH = 1.656 m/s (undisturbed wind velocity at the building height H)α = 0.35δ = 0.77 m (boundary layer depth) u* = 0.19 m s−1 (friction velocity)κ =0.40 Cμ = 0.09
Iglesias (Sardinia, Italy), 28-30 April 2011 O
n t
he
app
lica
tion
of
mor
ph
omet
ry a
nd
flu
id d
ynam
ics
app
roac
hes
for
cit
y…17
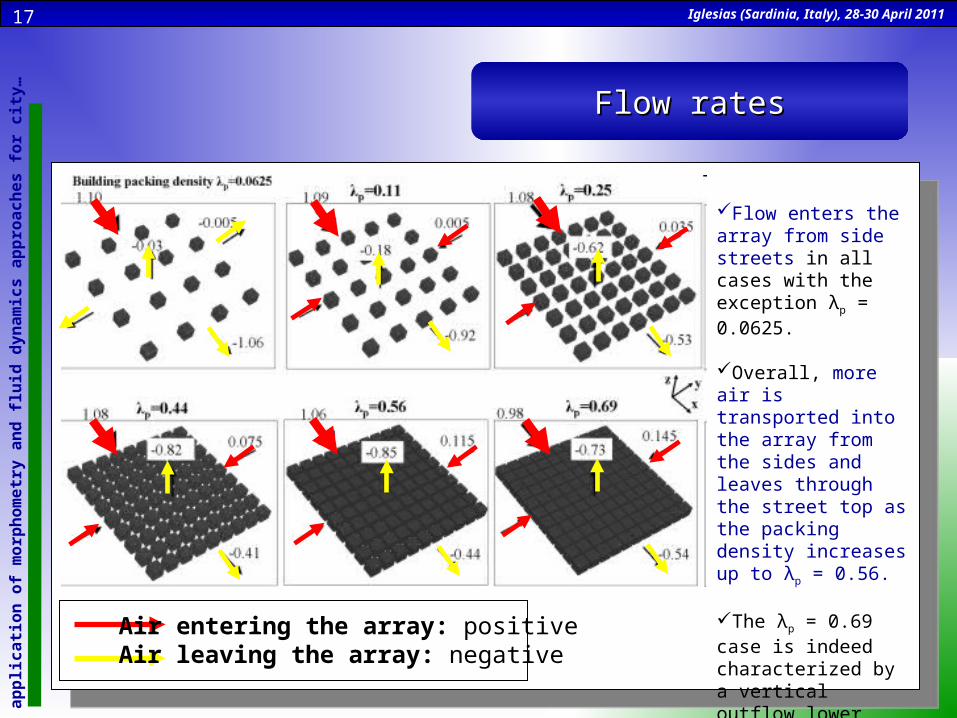
Flow ratesFlow rates
Flow enters the array from side streets in all cases with the exception λp = 0.0625.
Overall, more air is transported into the array from the sides and leaves through the street top as the packing density increases up to λp = 0.56.
The λp = 0.69 case is indeed characterized by a vertical outflow lower than that occurring in the packing density λp = 0.56.
Air entering the array: positiveAir leaving the array: negative
Iglesias (Sardinia, Italy), 28-30 April 2011 O
n t
he
app
lica
tion
of
mor
ph
omet
ry a
nd
flu
id d
ynam
ics
app
roac
hes
for
cit
y…18
a classificationa classification
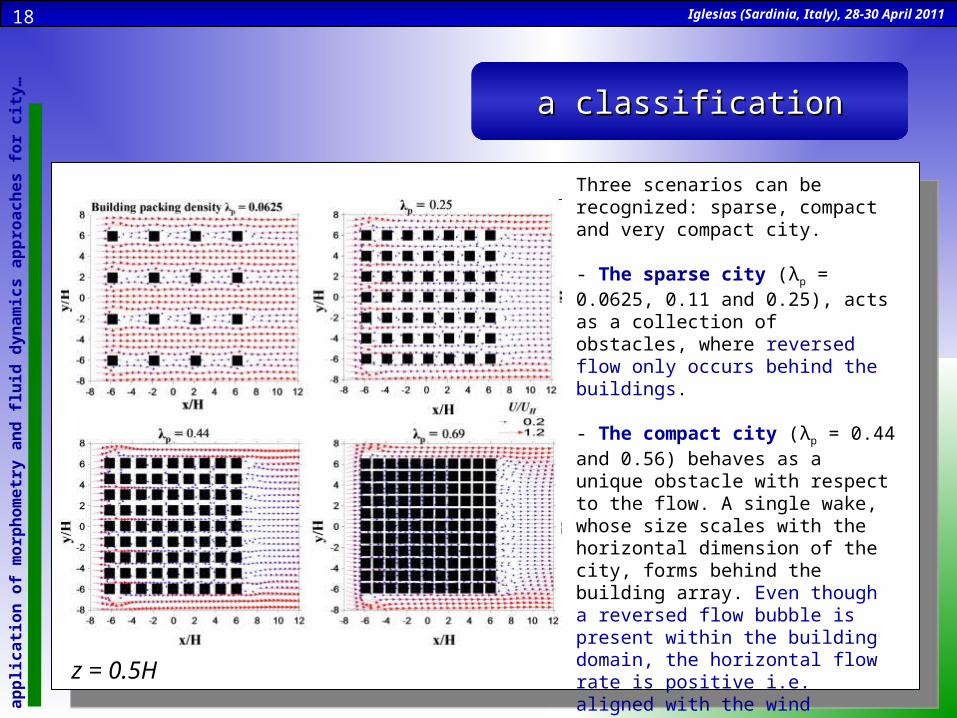
Three scenarios can be recognized: sparse, compact and very compact city.
- The sparse city (λp = 0.0625, 0.11 and 0.25), acts as a collection of obstacles, where reversed flow only occurs behind the buildings.
- The compact city (λp = 0.44 and 0.56) behaves as a unique obstacle with respect to the flow. A single wake, whose size scales with the horizontal dimension of the city, forms behind the building array. Even though a reversed flow bubble is present within the building domain, the horizontal flow rate is positive i.e. aligned with the wind direction.
- The very compact city (λp = 0.69) shows the presence of a strong reversed flow bubble. The horizontal flow rate is negative i.e. opposite to the approaching wind direction.
z = 0.5H
Iglesias (Sardinia, Italy), 28-30 April 2011 O
n t
he
app
lica
tion
of
mor
ph
omet
ry a
nd
flu
id d
ynam
ics
app
roac
hes
for
cit
y…19
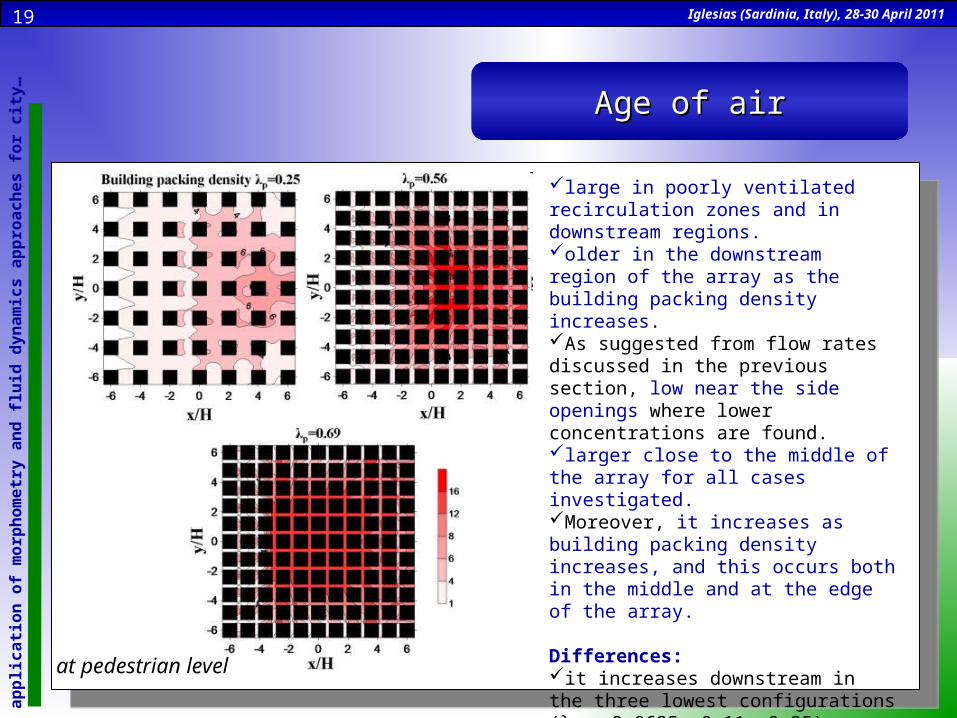
large in poorly ventilated recirculation zones and in downstream regions. older in the downstream region of the array as the building packing density increases. As suggested from flow rates discussed in the previous section, low near the side openings where lower concentrations are found.larger close to the middle of the array for all cases investigated. Moreover, it increases as building packing density increases, and this occurs both in the middle and at the edge of the array.
Differences: it increases downstream in the three lowest configurations (λp = 0.0625, 0.11, 0.25), while for the most compact cases (λp = 0.44, 0.56, 0.69), it reaches a maximum and then decreases close to the end of the array. This maximum value occurs at lower distance downstream as the packing density increases.
Age of airAge of air
at pedestrian level
Iglesias (Sardinia, Italy), 28-30 April 2011 O
n t
he
app
lica
tion
of
mor
ph
omet
ry a
nd
flu
id d
ynam
ics
app
roac
hes
for
cit
y…20
Age of airAge of air
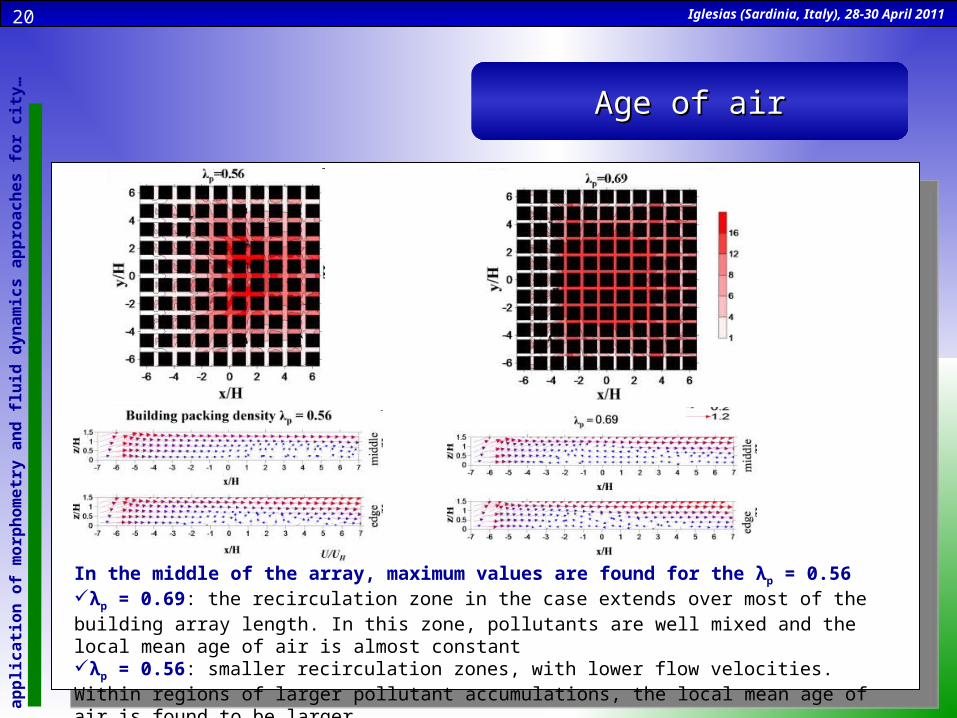
In the middle of the array, maximum values are found for the λp = 0.56λp = 0.69: the recirculation zone in the case extends over most of the building array length. In this zone, pollutants are well mixed and the local mean age of air is almost constantλp = 0.56: smaller recirculation zones, with lower flow velocities. Within regions of larger pollutant accumulations, the local mean age of air is found to be larger.
Iglesias (Sardinia, Italy), 28-30 April 2011 O
n t
he
app
lica
tion
of
mor
ph
omet
ry a
nd
flu
id d
ynam
ics
app
roac
hes
for
cit
y…21
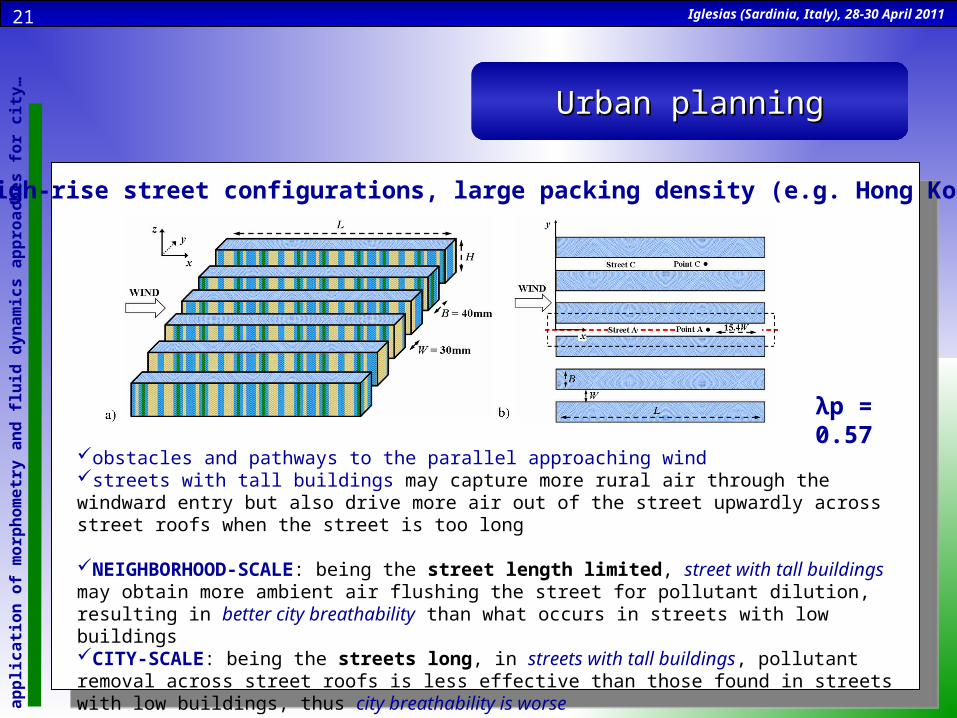
obstacles and pathways to the parallel approaching windstreets with tall buildings may capture more rural air through the windward entry but also drive more air out of the street upwardly across street roofs when the street is too long
NEIGHBORHOOD-SCALE: being the street length limited, street with tall buildings may obtain more ambient air flushing the street for pollutant dilution, resulting in better city breathability than what occurs in streets with low buildingsCITY-SCALE: being the streets long, in streets with tall buildings, pollutant removal across street roofs is less effective than those found in streets with low buildings, thus city breathability is worse
Urban planningUrban planning
λp = 0.57
High-rise street configurations, large packing density (e.g. Hong Kong)
Iglesias (Sardinia, Italy), 28-30 April 2011 O
n t
he
app
lica
tion
of
mor
ph
omet
ry a
nd
flu
id d
ynam
ics
app
roac
hes
for
cit
y…22
Urban planningUrban planning
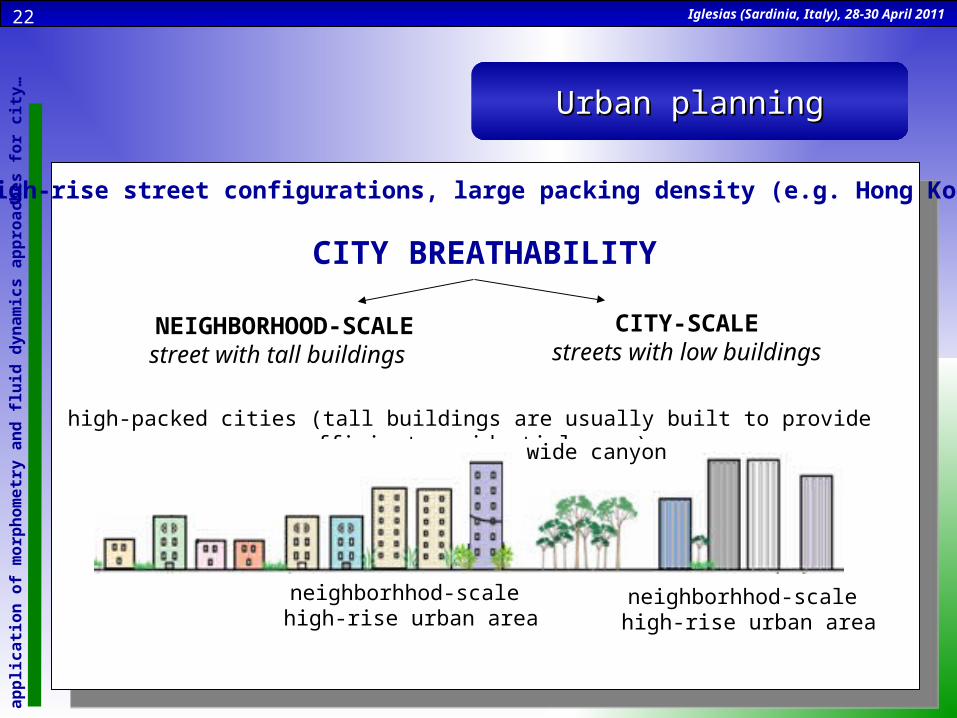
CITY BREATHABILITY
CITY-SCALEstreets with low buildings
NEIGHBORHOOD-SCALEstreet with tall buildings
high-packed cities (tall buildings are usually built to provide sufficient residential area)city-scale high-rise urban areas should be avoided!
High-rise street configurations, large packing density (e.g. Hong Kong)
wide canyon
neighborhhod-scale high-rise urban area
neighborhhod-scale high-rise urban area
Iglesias (Sardinia, Italy), 28-30 April 2011 O
n t
he
app
lica
tion
of
mor
ph
omet
ry a
nd
flu
id d
ynam
ics
app
roac
hes
for
cit
y…23
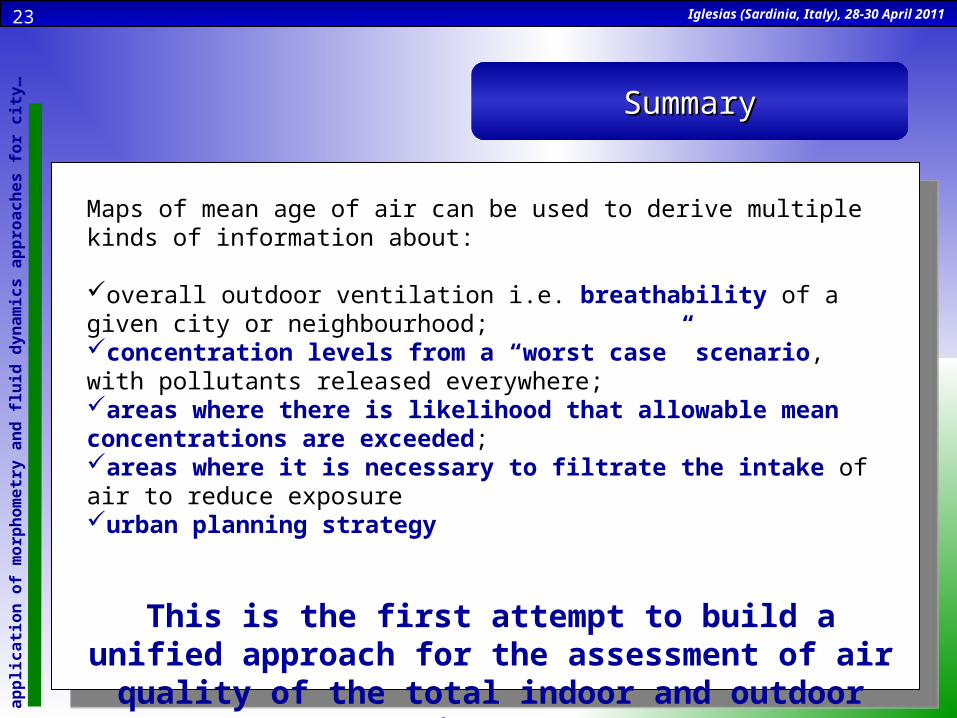
Maps of mean age of air can be used to derive multiple kinds of information about:
overall outdoor ventilation i.e. breathability of a given city or neighbourhood;concentration levels from a “worst case” scenario, with pollutants released everywhere;areas where there is likelihood that allowable mean concentrations are exceeded;areas where it is necessary to filtrate the intake of air to reduce exposureurban planning strategy
This is the first attempt to build a unified approach for the assessment of air quality of the total indoor and outdoor
environment.
SummarySummary
Iglesias (Sardinia, Italy), 28-30 April 2011 O
n t
he
app
lica
tion
of
mor
ph
omet
ry a
nd
flu
id d
ynam
ics
app
roac
hes
for
cit
y…24
Aerodynamic effects of trees Aerodynamic effects of trees in street canyons in street canyons
Iglesias (Sardinia, Italy), 28-30 April 2011 O
n t
he
app
lica
tion
of
mor
ph
omet
ry a
nd
flu
id d
ynam
ics
app
roac
hes
for
cit
y…25
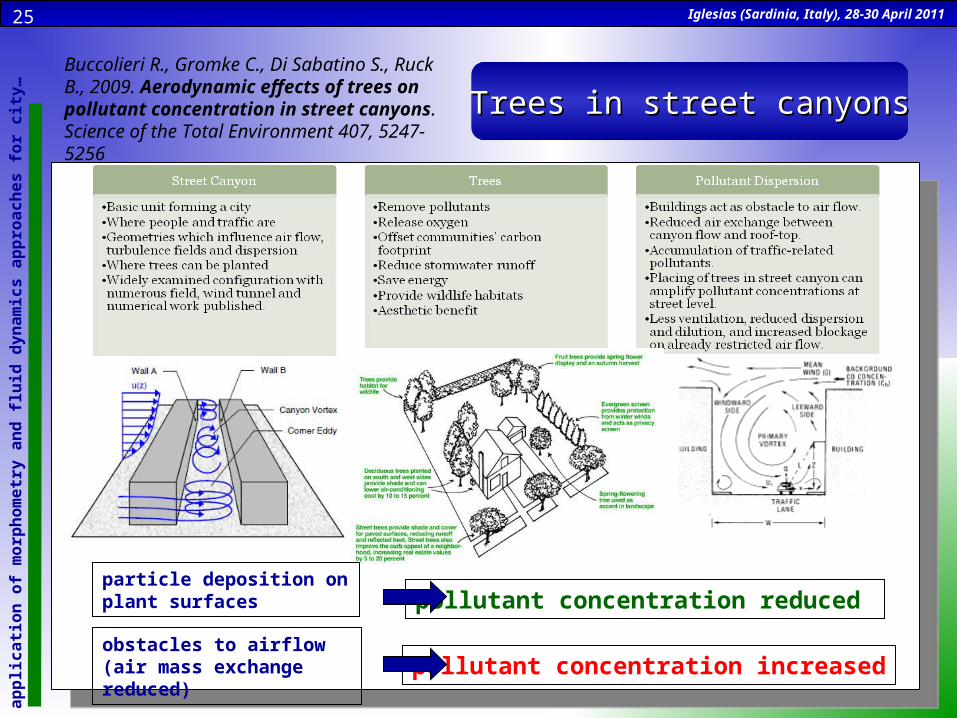
Trees in street canyonsTrees in street canyons
obstacles to airflow (air mass exchange reduced)
particle deposition on plant surfaces pollutant concentration reduced
pollutant concentration increased
Buccolieri R., Gromke C., Di Sabatino S., Ruck B., 2009. Aerodynamic effects of trees on pollutant concentration in street canyons. Science of the Total Environment 407, 5247-5256
Iglesias (Sardinia, Italy), 28-30 April 2011 O
n t
he
app
lica
tion
of
mor
ph
omet
ry a
nd
flu
id d
ynam
ics
app
roac
hes
for
cit
y…26
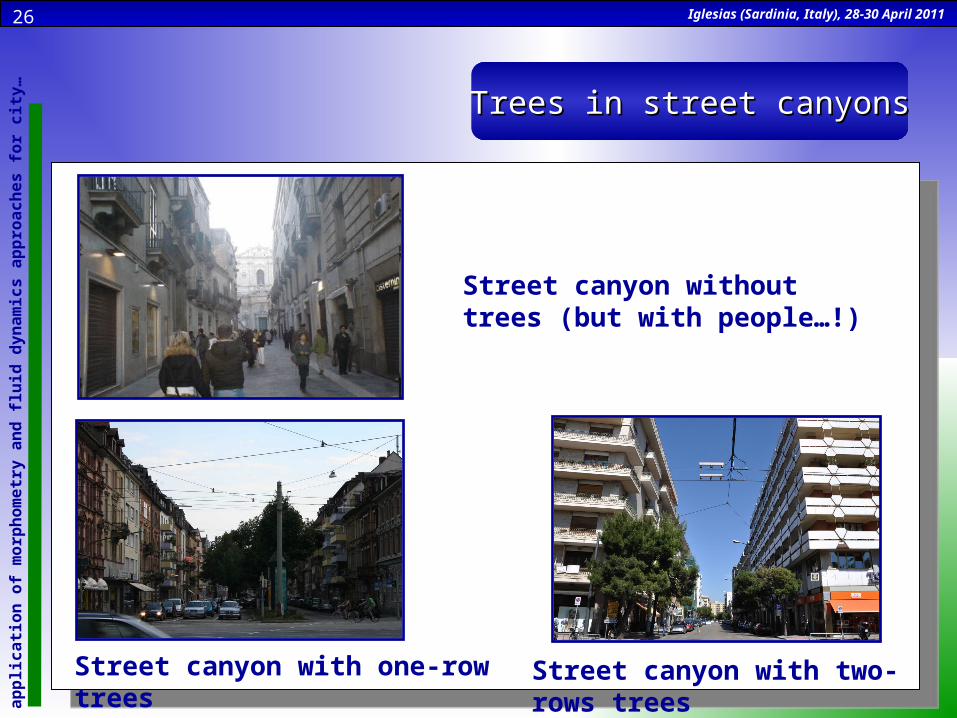
Street canyon without trees (but with people…!)
Street canyon with one-row trees Street canyon with two-rows trees
Trees in street canyonsTrees in street canyons
Iglesias (Sardinia, Italy), 28-30 April 2011 O
n t
he
app
lica
tion
of
mor
ph
omet
ry a
nd
flu
id d
ynam
ics
app
roac
hes
for
cit
y…27
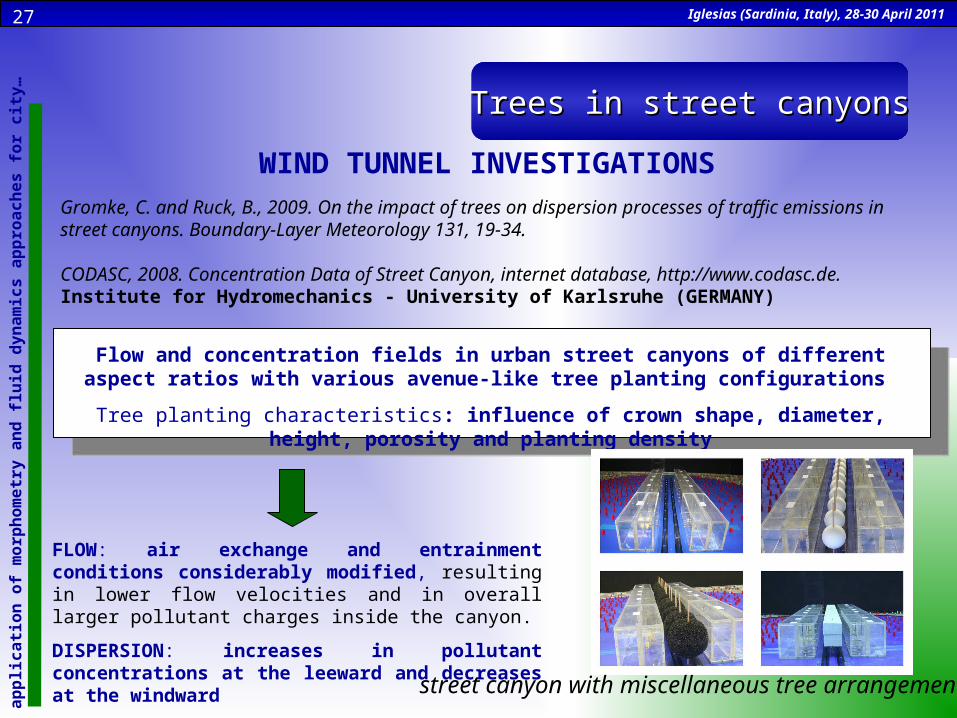
WIND TUNNEL INVESTIGATIONSGromke, C. and Ruck, B., 2009. On the impact of trees on dispersion processes of traffic emissions in street canyons. Boundary-Layer Meteorology 131, 19-34.
CODASC, 2008. Concentration Data of Street Canyon, internet database, http://www.codasc.de. Institute for Hydromechanics - University of Karlsruhe (GERMANY)
Flow and concentration fields in urban street canyons of different aspect ratios with various avenue-like tree planting configurations
Tree planting characteristics: influence of crown shape, diameter, height, porosity and planting density
FLOW: air exchange and entrainment conditions considerably modified, resulting in lower flow velocities and in overall larger pollutant charges inside the canyon.
DISPERSION: increases in pollutant concentrations at the leeward and decreases at the windward
street canyon with miscellaneous tree arrangements
Trees in street canyonsTrees in street canyons
Iglesias (Sardinia, Italy), 28-30 April 2011 O
n t
he
app
lica
tion
of
mor
ph
omet
ry a
nd
flu
id d
ynam
ics
app
roac
hes
for
cit
y…28
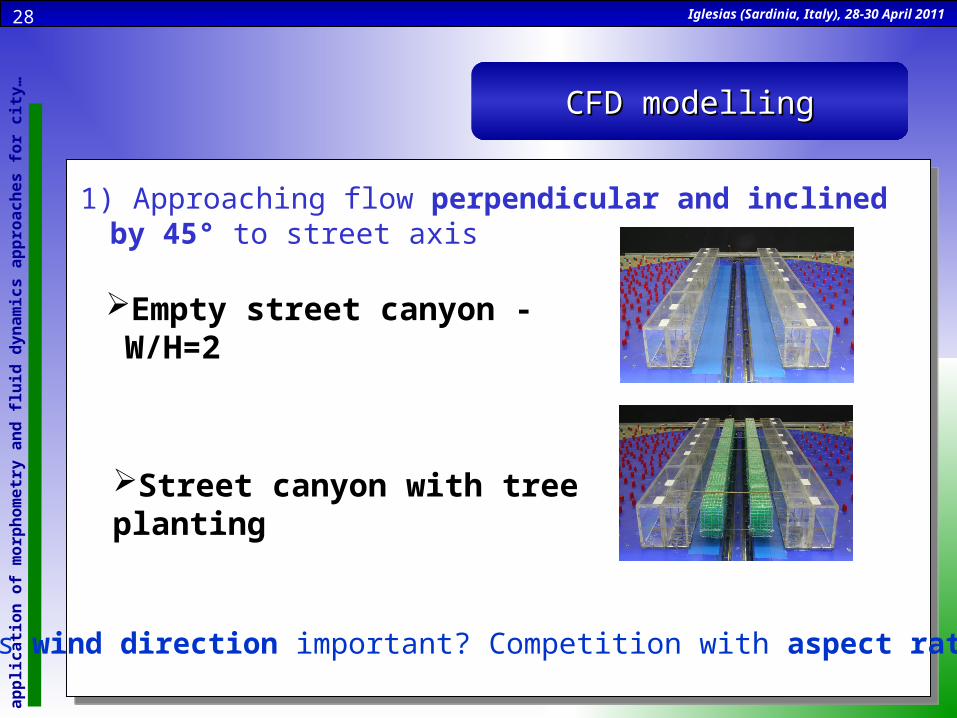
1) Approaching flow perpendicular and inclined by 45° to street axis
Empty street canyon - W/H=2
Street canyon with tree planting
CFD modellingCFD modelling
2) Is wind direction important? Competition with aspect ratio…
Iglesias (Sardinia, Italy), 28-30 April 2011 O
n t
he
app
lica
tion
of
mor
ph
omet
ry a
nd
flu
id d
ynam
ics
app
roac
hes
for
cit
y…29
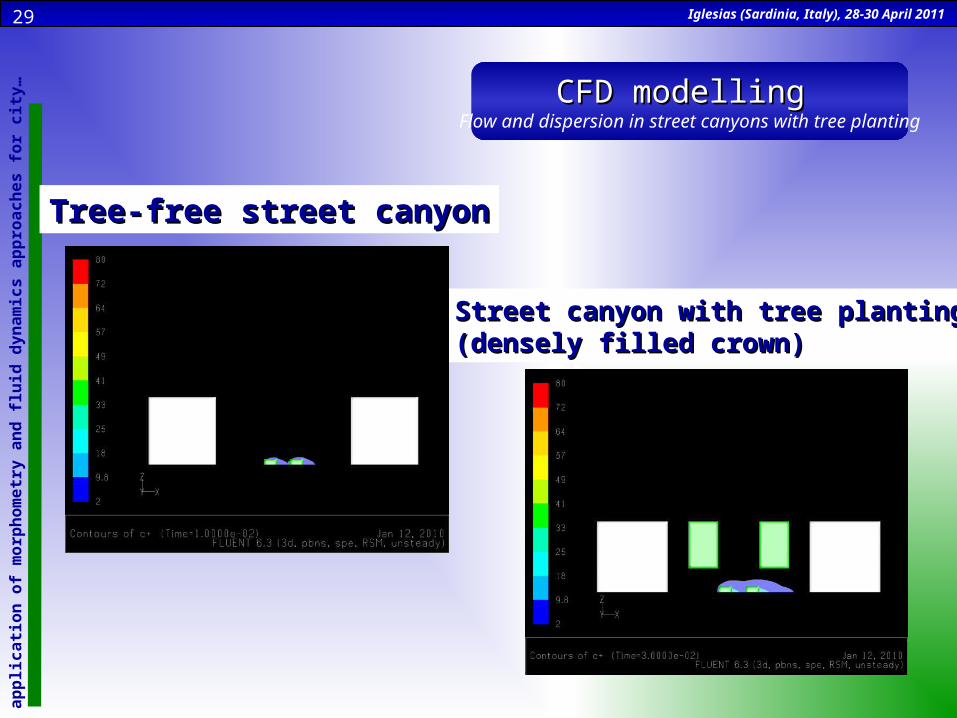
Tree-free street canyonTree-free street canyon
Street canyon with tree planting Street canyon with tree planting (densely filled crown)(densely filled crown)
CFD modelling CFD modelling Flow and dispersion in street canyons with tree planting
Iglesias (Sardinia, Italy), 28-30 April 2011 O
n t
he
app
lica
tion
of
mor
ph
omet
ry a
nd
flu
id d
ynam
ics
app
roac
hes
for
cit
y…30
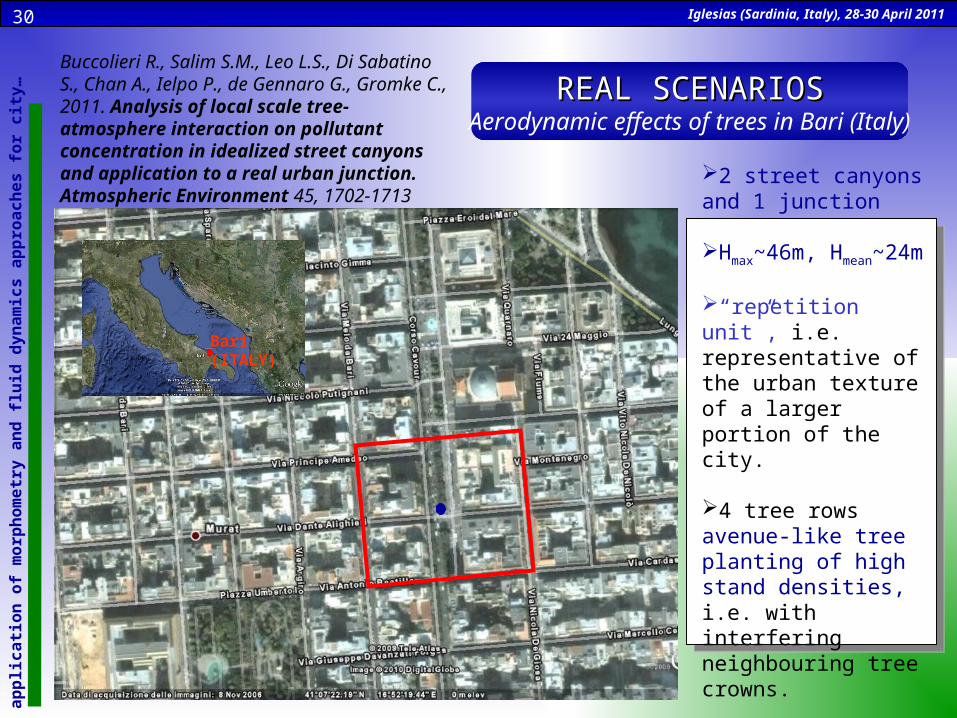
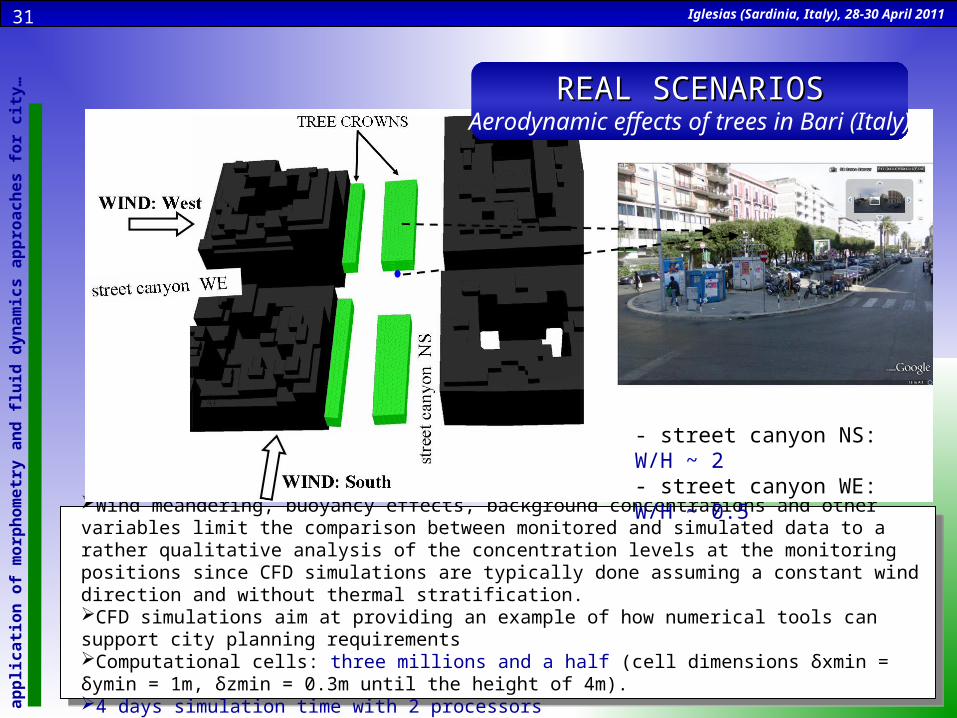
REAL SCENARIOSREAL SCENARIOSAerodynamic effects of trees in Bari (Italy)
2 street canyons and 1 junction
Hmax~46m, Hmean~24m
“repetition unit”, i.e. representative of the urban texture of a larger portion of the city.
4 tree rows avenue-like tree planting of high stand densities, i.e. with interfering neighbouring tree crowns.
Bari (ITALY)
Buccolieri R., Salim S.M., Leo L.S., Di Sabatino S., Chan A., Ielpo P., de Gennaro G., Gromke C., 2011. Analysis of local scale tree-atmosphere interaction on pollutant concentration in idealized street canyons and application to a real urban junction. Atmospheric Environment 45, 1702-1713
Iglesias (Sardinia, Italy), 28-30 April 2011 O
n t
he
app
lica
tion
of
mor
ph
omet
ry a
nd
flu
id d
ynam
ics
app
roac
hes
for
cit
y…31
Wind meandering, buoyancy effects, background concentrations and other variables limit the comparison between monitored and simulated data to a rather qualitative analysis of the concentration levels at the monitoring positions since CFD simulations are typically done assuming a constant wind direction and without thermal stratification. CFD simulations aim at providing an example of how numerical tools can support city planning requirements Computational cells: three millions and a half (cell dimensions δxmin = δymin = 1m, δzmin = 0.3m until the height of 4m). 4 days simulation time with 2 processors
Wind dir.: 5°
REAL SCENARIOSREAL SCENARIOSAerodynamic effects of trees in Bari (Italy)
- street canyon NS: W/H ~ 2- street canyon WE: W/H ~ 0.5
Iglesias (Sardinia, Italy), 28-30 April 2011 O
n t
he
app
lica
tion
of
mor
ph
omet
ry a
nd
flu
id d
ynam
ics
app
roac
hes
for
cit
y…32
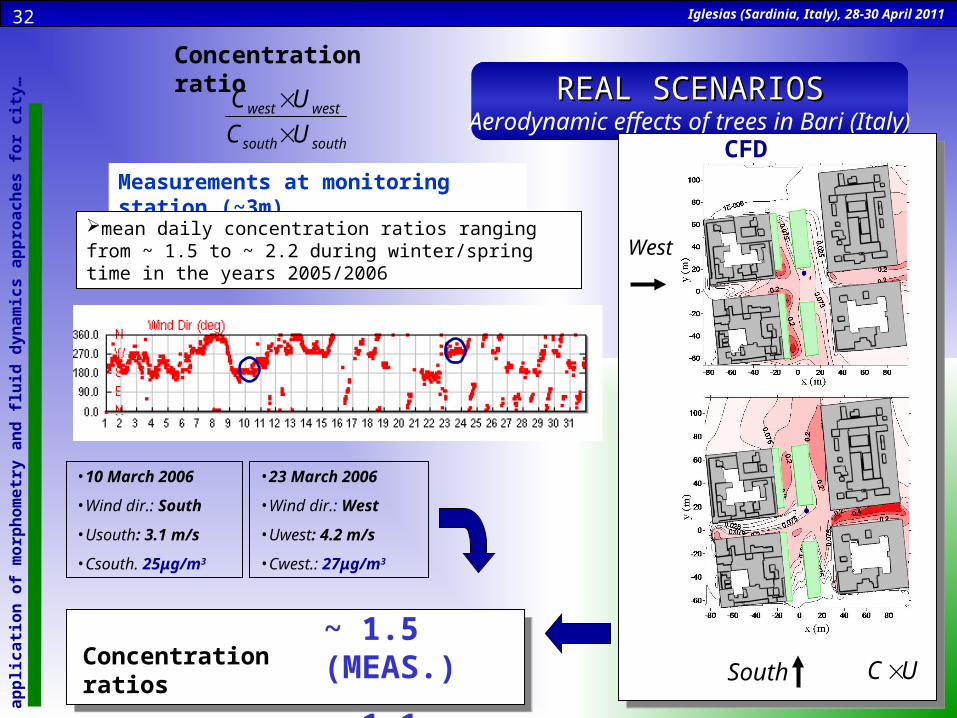
•23 March 2006
•Wind dir.: West
•Uwest: 4.2 m/s
•Cwest.: 27μg/m3
•10 March 2006
•Wind dir.: South
•Usouth: 3.1 m/s
•Csouth. 25μg/m3
Measurements at monitoring station (~3m)
REAL SCENARIOSREAL SCENARIOSAerodynamic effects of trees in Bari (Italy)
Concentration ratio
mean daily concentration ratios ranging from ~ 1.5 to ~ 2.2 during winter/spring time in the years 2005/2006
CFD simulations
~ 1.5 (MEAS.)
~ 1.1 (SIM.)
southsouth
westwest
UC
UC
South
West
UCConcentration ratios
Iglesias (Sardinia, Italy), 28-30 April 2011 O
n t
he
app
lica
tion
of
mor
ph
omet
ry a
nd
flu
id d
ynam
ics
app
roac
hes
for
cit
y…33
REAL SCENARIOSREAL SCENARIOSAerodynamic effects of trees in Bari (Italy)
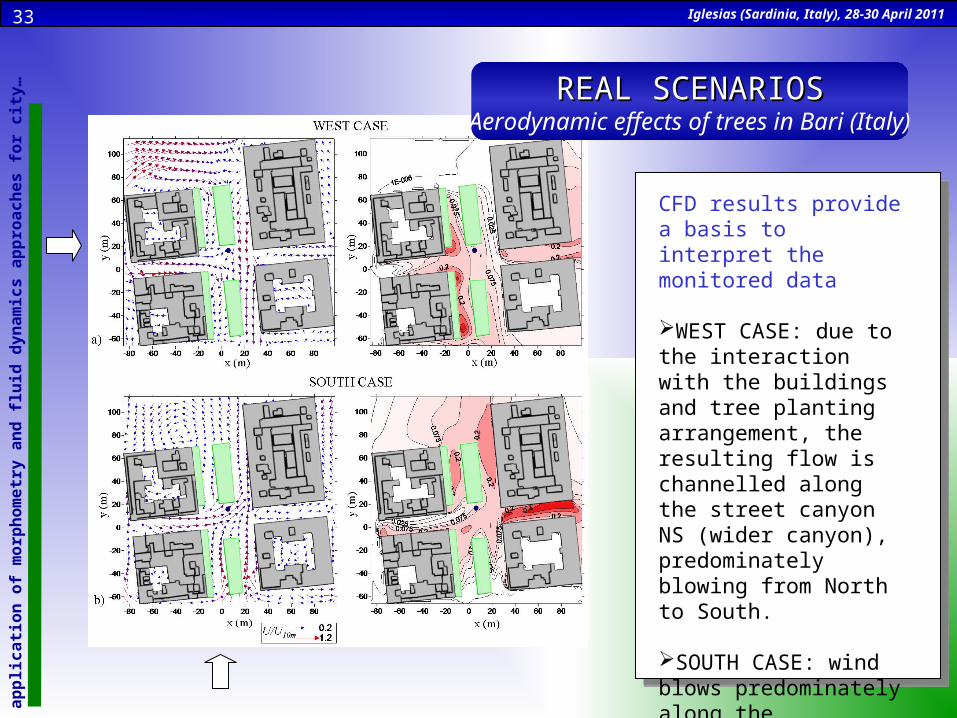
CFD results provide a basis to interpret the monitored data
WEST CASE: due to the interaction with the buildings and tree planting arrangement, the resulting flow is channelled along the street canyon NS (wider canyon), predominately blowing from North to South.
SOUTH CASE: wind blows predominately along the approaching direction which is from South to North.
Iglesias (Sardinia, Italy), 28-30 April 2011 O
n t
he
app
lica
tion
of
mor
ph
omet
ry a
nd
flu
id d
ynam
ics
app
roac
hes
for
cit
y…34
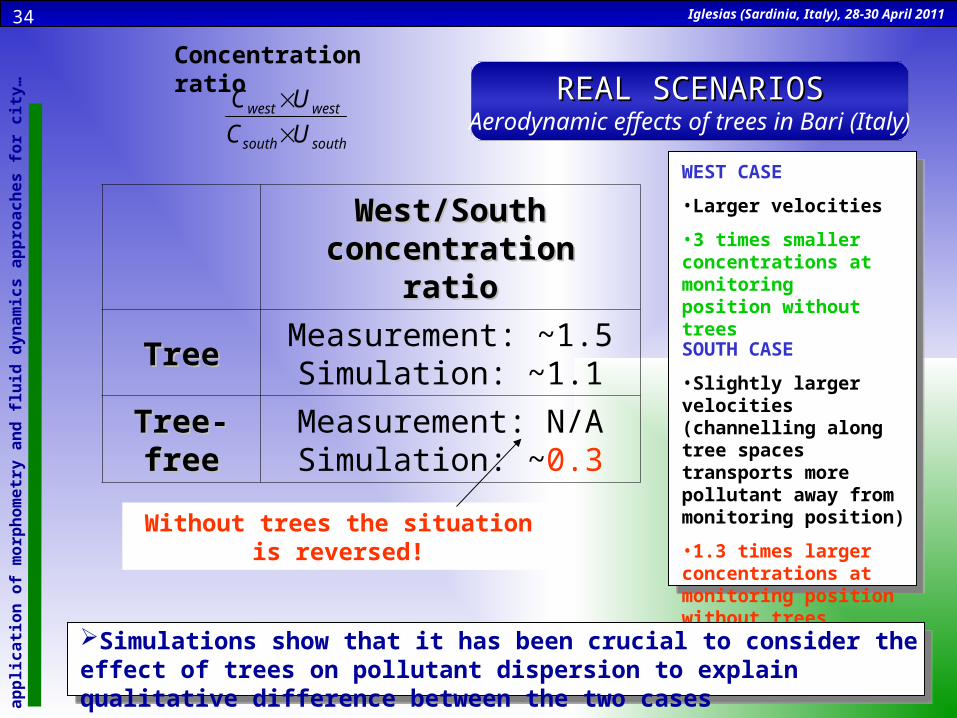
SOUTH CASE
•Slightly larger velocities (channelling along tree spaces transports more pollutant away from monitoring position)
•1.3 times larger concentrations at monitoring position without trees
West/South concentration West/South concentration ratioratio
TreeTreeMeasurement: ~1.5
Simulation: ~1.1
Tree-freeTree-freeMeasurement: N/ASimulation: ~0.3
WEST CASE
•Larger velocities
•3 times smaller concentrations at monitoring position without trees
Without trees the situation is reversed!
REAL SCENARIOSREAL SCENARIOSAerodynamic effects of trees in Bari (Italy)
Simulations show that it has been crucial to consider the effect of trees on pollutant dispersion to explain qualitative difference between the two cases
Concentration ratio
southsouth
westwest
UC
UC
Iglesias (Sardinia, Italy), 28-30 April 2011 O
n t
he
app
lica
tion
of
mor
ph
omet
ry a
nd
flu
id d
ynam
ics
app
roac
hes
for
cit
y…35
ConclusionsConclusions
Understanding fluid dynamics of urban flows through field and laboratory experiments and numerical modelling allows us to construct to put in place mitigation strategies in our cities
Some examples have shown that MORPHOMETRY ANALYSES offer a valid tool for wind and dispersion modelling in urban areas .
The combination of experimental and numerical approaches can provide a strategy for planning and re-development of urban areas
aiming in pedestrian exposure mitigation but also put the basis for urban effect understanding on climate!

THANK YOU
FOR
YOUR ATTENTION