Embed Size (px)
Citation preview
On the adsorption of a cationic artificial dye on spent tea leaves
S. Jung1, M. Naidoo2, S. Shairzai2 & A. E. Navarro3 1Loomis Chaffee School, Windsor, CT, USA 2School of Arts and Sciences, Hunter College, City University of New York, USA 3Science Department, Borough of Manhattan Community College, City University of New York, USA
Abstract
Colored wastewaters are the most obvious contamination due to the very small amount of artificial dyes. Activated carbon and sludge are the conventional treatment technique for this contamination. This research proposed the alternative use of spent tea leaves of green tea (GT), decaffeinated green tea (DGT), peppermint (PM) and chamomile (CM). Batch equilibrium experiments were conducted at room temperature to determine the optimum conditions that maximize the removal of malachite green (MG) as a model dye. Results indicate that the adsorption is strongly driven by pH, reporting an optimum value at 6. For all the adsorbents, less than 150 mg of the tea leaves reached the maximum adsorption. The absence of salts and heavy metals also maximize the adsorption of MG. Isotherm models of Langmuir, Freundlich, Dubining-Radushkevich and Temkin were used to fit the data. Modeling indicates an adsorption trend of PM˃DGT˃GT˃CM and a maximum adsorption capacity of 69.7 mg of MG per gram of PM adsorbent. Finally, instrumental analysis such as scanning electron microscopy and infrared spectroscopy were used to characterize the physical and chemical properties of the adsorbents, demonstrating their good potential as adsorbents for the removal of MG from wastewaters. This study will promote further investigation on naturally-occurring biomaterials for their application on the decontamination of water resources. Keywords: adsorption, malachite green, spent tea leaves, isotherm, wastewater, scanning electron microscopy, infrared spectroscopy.
Urban Water II 231
www.witpress.com, ISSN 1743-3509 (on-line) WIT Transactions on The Built Environment, Vol 139, © 2014 WIT Press
doi:10.2495/UW140201

1 Introduction
Environmental contamination is the incorporation of biological, chemical or physical agents in a medium at which they do not belong. Manhood has contributed to the environmental pollution from the beginning of its formation. However, the Industrial Revolution enhanced this contamination and nowadays the pollution levels are alarming. There are several industrial processes, especially in the chemical, textile, leather and other industries that generate liquid effluents with large amounts of contaminant agents. Amongst them, we find organic compounds such as artificial dyes. Artificial dyes are widely used in the dying of fabrics, food, pharmaceutical and research. They constitute one of the greatest challenges for their treatment due to their visual impact, increasing organic content and toxicity. Activated carbon is the most effective adsorbent for the removal of this type of contaminants due to its high porosity, surface area, and surface chemistry. The development of new adsorbing materials with low cost is the biggest concern of the scientific community. The preparation of activated carbon involves chemical and thermal treatment that causes extra expenses. Therefore, the search of alternative raw and inexpensive materials is constant [1]. Numerous studies have centered their attention to observing the adsorption capacity of biomaterials in their natural or modified forms (physical or chemical treatments) to increase their adsorption capacity. Activated carbons have been prepared from nutshells [2], rice husks [3], fruit seeds, and others [4]. However, raw materials have been left aside due to their low adsorption. This conclusion was made based on their adsorption of metals from wastewaters. Surprisingly, these raw materials exhibit high dye adsorption capacities [5–8]. Ligno-cellulosic materials are composed by different types of polysaccharides, mainly cellulose and the presence of hydroxyl, carboxyl and amino groups can potentially adsorb polar compounds like artificial dyes. Malachite green is a cationic dye (as shown in Figure 1). It has a positive charge that is delocalized in the entire compound by resonance. It belongs to the family of the triphenylmethanes and is amphipathic (behaves as a polar and non-polar compound). Malachite green (MG) is widely used with coloring purposes and is discharged in water resources at low concentrations. These discharges affect the aquatic life and in humans, it can cause gastrointestinal irritation by ingestion [9]. In the industry, it is used as a dye for acrylic fibers, silk, wool and cotton. Some other industries that use MG as raw material are wood, paper and leather. Lastly, MG is also used in pharmaceuticals as a bactericide [9].
Figure 1: Chemical structure of malachite green dye (MG).
232 Urban Water II
www.witpress.com, ISSN 1743-3509 (on-line) WIT Transactions on The Built Environment, Vol 139, © 2014 WIT Press
This project envisions the study of tea leaves from green tea, peppermint, chamomile, and decaffeinated green tea as alternative candidates for the removal of MG from aqueous solutions. These novel adsorbents are thought to become good alternatives to the use of activated carbon, and will represent a less expensive technique for the decontamination of water resources.
2 Experimental procedures
2.1 Conditioning of the adsorbents
Green tea (GT), Peppermint (PM), Chamomile (CM) and decaffeinated green tea (DGT) bags were obtained from a local market. Teabags were intensively boiled in tap water to discharge their characteristic color, smell and taste. The last rinses were done with boiling distilled water to eliminate any chemical residues such as salts and other soluble substances. Then, teabags were oven-dried at no more than 50°C for at least 24 h. Later, the teabags were cut and the leaves were crushed and stored in plastic containers until their use.
2.2 Dye solutions and quantification of MG
Malachite green was purchased from Sigma Aldrich (Reagent Grade) and used without further purification. Stock solutions of MG were made using distilled water and stored in the refrigerator. Experiments were carried out by dilution of the stock solution until reaching the desired concentrations. Amount of MG was quantified by its UV-visible light absorbance at 617 nm. Measurements were made by spectrophotometry using a microplate reader (Synergy4, BioTek). A calibration curve was elaborated to determine the residual dye concentrations.
2.3 Adsorption experiments
Batch experiments were performed at room temperature in an orbital shaker. Runs were done in duplicates and results were obtained by the average of their values. Samples were run with a control sample that had no adsorbent. Controls were used to compare the initial versus the final concentration after the adsorption. Polyethylene tubes were used for the batch experiments and sealed with parafilm to avoid any leakage. Several parameters were explored to optimize the adsorption of MG on the tealeaves. pH, adsorbent mass, dye concentration, salinity, and presence of heavy metals were studied.
2.4 Characterization of the adsorbents
These adsorbents will be compared with activated carbon; therefore instrumental analysis was performed to determine the most important physical and chemical properties of the four adsorbents. The texture and morphology of the adsorbents was observed by Scanning Electron Microscopy, using a TableTop Microscopy, TM3000 (Hitachi). Samples were directly observed in the microscopy without any conductive gold film. Finally, the chemical characterization was done
Urban Water II 233
www.witpress.com, ISSN 1743-3509 (on-line) WIT Transactions on The Built Environment, Vol 139, © 2014 WIT Press

through Infrared spectroscopy. This technique determines the organic functional groups that are present on the adsorbent’s surface. A FTIR Spectrum 100 (Perkin Elmer) was used and scans were collected from 4000 to 400 cm-1 wavenumbers.
2.5 Statistical treatment of the results
The amount of the adsorbed MG onto the adsorbents was expressed as Adsorption Capacity (q, mg/g) and calculated as shown in equation (1):
i eq(C -C )*Vq=
m (1)
where m is the mass of the adsorbent expressed in g, V is the volume of the solution in L and Ci and Ceq are the initial and at the equilibrium concentrations of MG expressed in ppm (mg/L), respectively. Alternative dye quantification was done using Adsorption Percentage (% Adsorption) which follows the Equation (2):
% Adsorption = i eq
i
(C -C )*100
C (2)
Mathematical and statistical treatment was done with excel (Microsoft) and Origin v5.0. Linear regression was used in the adsorption isotherm analysis.
3 Results and discussion
3.1 Adsorption experiments: pH effect
The role of the pH on the adsorption of MG was studied from 2 to 8. Higher pH values were not explored because of the low probability of finding contaminated water with such alkalinity. This study tried to closely resemble the situation of real wastewaters. The results of these experiments are shown in Figure 2. According to these results, it can be concluded that PM shows the strongest adsorption efficiency (around 95%) when compared to the other adsorbents. Conversely, CM (50%) is the weakest adsorbent of MG at the same experimental conditions. Likewise, all the adsorbents show the same curve type with increasing adsorption at increasing pH values. All the adsorbents reached the
2 3 4 5 6 7 80
10
20
30
40
50
60
70
80
90
100
CM DGT GT PM
% A
dso
rptio
n
pH
Figure 2: pH effect on the adsorption of MG.
234 Urban Water II
www.witpress.com, ISSN 1743-3509 (on-line) WIT Transactions on The Built Environment, Vol 139, © 2014 WIT Press

maximum adsorption at pH 6. This value is very close to the real wastewater, indicating that this alternative method by adsorption could be used in the treatment of real wastewaters. It can be postulated the reason why the adsorption occurs at this pH range is due to the chemical groups that are present on the adsorbents. Since they all belong to the same biological origin, it is reasonable to observe similar behavior [10–12].
3.2 Adsorption experiments: mass effect
Scaled-up processes for industrial applications need an optimization of the adsorbent dose to be used in the decontamination of the dye present in the solution. For this purpose, different masses of the adsorbents were studied with the same dye solution to determine the minimum amount of tea samples that is needed to observe the maximum adsorption. According to the results in Figure 3, PM confirms its superiority, reaching almost 100% removal with only 75 mg of adsorbent, followed by DGT and GT, both with 100 and 150 mg, respectively and finally CM with an optimum mass of 200 mg. The adsorption is greatly reduced at low masses due to the few adsorption sites that are available for the removal of MG. At high adsorbent masses, most of the dye has been adsorbed and therefore it is more difficult to remove the remainder of the pollutant and the process reaches a plateau [13, 14].
0 50 100 150 200
10
20
30
40
50
60
70
80
90
100
110
CM DGT GT PM
% A
dso
rptio
n
Mass of Adsorbent (mg)
Figure 3: Mass of adsorbent effect on the adsorption of MG.
3.3 Adsorption experiments: concentration effect
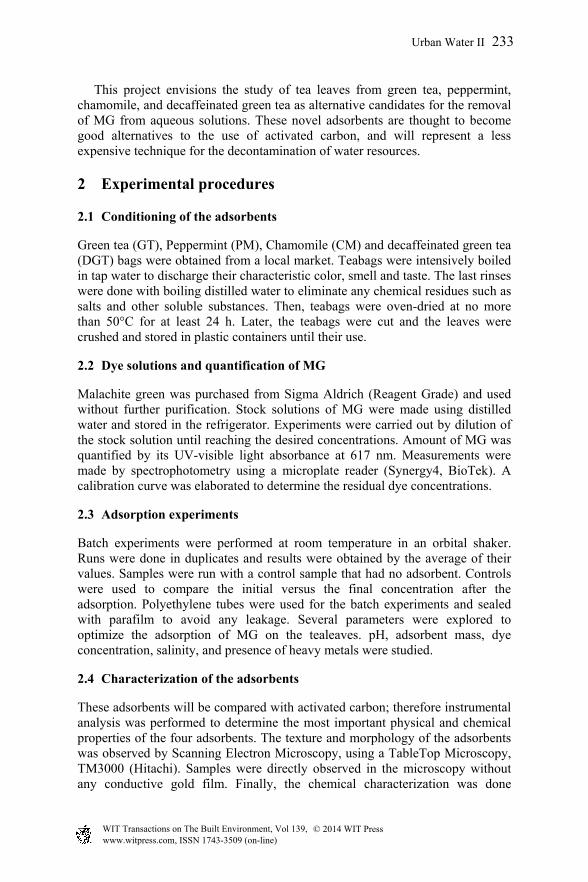
Every adsorbent reaches a saturation level, at which no more adsorbate can be adsorbed on the surface of the materials. Figure 4 shows the concentration dependence of the adsorption for the four adsorbents. From the results, PM achieves a very high adsorption capacity (q), whereas DGT, GT and CM show about the same adsorption capacities. A common feature that can be indicated is that all the adsorbents reach a saturation level. The experimental results were fitted to the conventional isotherm models of Langmuir, Freundlich, Dubinin-Radushkevich and Temkin [12, 14–16]. Modeling results are shown in Table 1. Isotherms allow us to calculate parameters with a physical meaning. For example Langmuir provides us with the maximum adsorption capacity (qmax) of a given adsorbent. For MG, the adsorbent PM reports the highest qmax = 69.8 mg of dye per gram of adsorbent.
Urban Water II 235
www.witpress.com, ISSN 1743-3509 (on-line) WIT Transactions on The Built Environment, Vol 139, © 2014 WIT Press
0.000 0.005 0.010 0.015 0.020 0.025 0.0300.00
0.01
0.02
0.03
0.04
0.05
0.06
0.07
CM DGT GT PM
q (
mg
Mg
/g a
dso
rben
t)C
eq(mg MG/L)
Figure 4: Dye concentration effect on the adsorption on the four adsorbents.
Table 1: Calculated isotherm parameters for the adsorption of MG.
ADSORBENTLangmuir Freundlich
Dubinin-Radushkevich
Temkin
qmax b R2 kF N R2 qRD E R2 aT bT R2
PM 69.78 2.315 0.99 45.67 3.91 0.90 58.69 3.31 0.97 26.66 2.80 0.99
GT 27.44 0.53 0.97 9.69 2.06 0.94 20.54 1.38 0.94 4.11 5.92 0.94
DGT 35.03 0.21 0.93 10.19 2.85 0.87 25.41 0.61 0.89 3.53 6.18 0.85
CM 24.46 1.26 0.99 12.32 3.11 0.82 23.16 1.05 0.94 26.14 9.44 0.90
qmax (mg/g), b (L/mg), kF (L/g), qDR (mg/g), E (kJ/mol), bT (J/mol)
The adsorption capacity can be ranked as follows: PM˃DGT˃GT˃CM. Freundlich model determines the kF constant that is associated with the binding affinity. This parameter also shows a trend that is similar to the previously observed qmax, previously observed. Finally, the Dubinin-Radushkevich model calculates the adsorption energy, one of the few thermodynamic parameters that can be calculated using equilibrium experiments. In this case the energies follow the trend: PM˃GT˃CM˃DGT. This adsorption energy is correlated to the strength of the adsorbent-adsorbate interaction. All the values indicate a physical adsorption, mostly due to weak forces like dipole-dipole, hydrogen bond and dispersion forces.
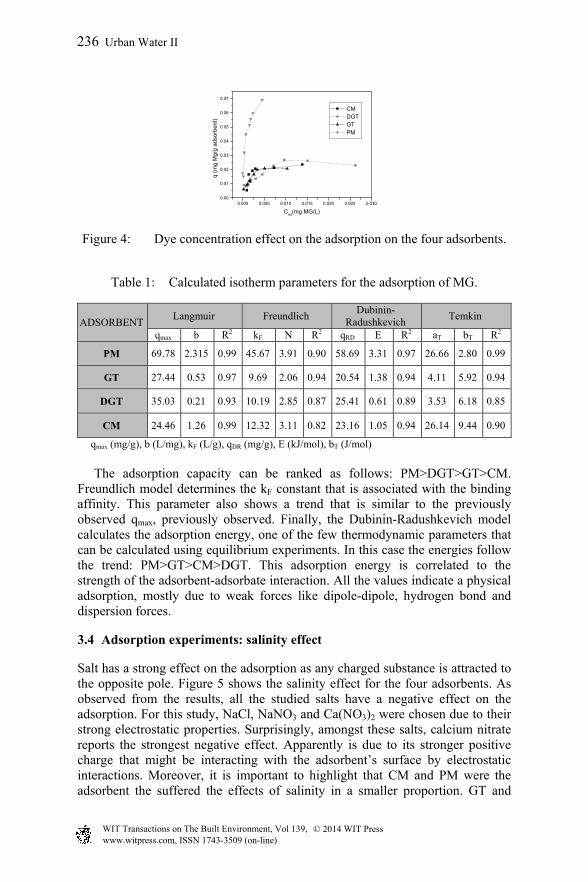
3.4 Adsorption experiments: salinity effect
Salt has a strong effect on the adsorption as any charged substance is attracted to the opposite pole. Figure 5 shows the salinity effect for the four adsorbents. As observed from the results, all the studied salts have a negative effect on the adsorption. For this study, NaCl, NaNO3 and Ca(NO3)2 were chosen due to their strong electrostatic properties. Surprisingly, amongst these salts, calcium nitrate reports the strongest negative effect. Apparently is due to its stronger positive charge that might be interacting with the adsorbent’s surface by electrostatic interactions. Moreover, it is important to highlight that CM and PM were the adsorbent the suffered the effects of salinity in a smaller proportion. GT and
236 Urban Water II
www.witpress.com, ISSN 1743-3509 (on-line) WIT Transactions on The Built Environment, Vol 139, © 2014 WIT Press
0.0 0.1 0.2 0.3 0.4 0.5 0.6
68
72
76
80
84
88
92
96
100
NaCl NaNO
3
Ca(NO3)
2
% A
dsor
ptio
n
Salt Concentration (M)
(a)
0.0 0.1 0.2 0.3 0.4 0.5 0.655
60
65
70
75
80
85
90
95
100
NaCl NaNO3
Ca(NO3)2
% A
dso
rptio
n
Salt Concentration (M)
(b)
0.0 0.1 0.2 0.3 0.4 0.5 0.6
30
40
50
60
70
80
90
NaCl NaNO
3
Ca(NO3)
2
% A
dso
rptio
n
Salt Concentration (M)
(c)
0.0 0.1 0.2 0.3 0.4 0.5 0.665
70
75
80
85
90
95
100
NaCl NaNO3
Ca(NO3)
2
% A
dso
rptio
n
Salt Concentration (M)
(d)
Figure 5: Salinity effect on the adsorption of MG by the four adsorbents: (a) PM, (b) GT, (c) DGT and (d) CM.
DGT decreased their adsorption to almost 50 and 30%, respectively. This property might be related to the organic composition of the tea samples as they will be studied later with FTIR spectroscopy.
3.5 Adsorption experiments: heavy metal ions effect
Wastewaters are a mixture of compounds, from inorganic to organic compounds. The purpose of this experiment was to evaluate the effect of larger ions such as heavy metals in the adsorption of MG. Biosorbents have proved to be excellent heavy metal adsorbents and a strong competition is expected when mixed with dye in the same solution system. Figure 6 shows the negative effect of heavy metals such as copper (II) and lead (II) ions on the adsorption of MG for all the adsorbents. From the results, we can observe that DGT is the most affected adsorbent by the presence of the heavy metals. This might indicate a preference of DGT towards heavy metals rather than MG. PM seems to resist the presence of heavy metals and decreases the adsorption of MG but in a smaller scale. This competition could be a response to the functional groups that are present on the adsorbents’ surface. It has been demonstrated that carboxylic acids are good adsorbents for heavy metals. This will be confirmed by FTIR analysis.
Urban Water II 237
www.witpress.com, ISSN 1743-3509 (on-line) WIT Transactions on The Built Environment, Vol 139, © 2014 WIT Press

0 10 20 30 40 5045
50
55
60
65
70
75
80
85
90
95
100
CM DGT GT PM
% A
dsor
ptio
n
Cu Concentration (mg/L)
0 10 20 30 40 50
80
82
84
86
88
90
92
94
96
98
CM DGT GT PM
% A
dsor
ptio
n
Pb Concentration (mg/L)
Figure 6: Heavy metal ions effect on the adsorption of MG by the four adsorbents.
3.6 Adsorbents characterization
Scanning Electron Microscopy (SEM) was also utilized to characterize the adsorbents. Figures 7 display micrographs of the adsorbents and indicate a very heterogeneous surface with hills and valleys that are perfect adsorption sites for pollutants. A very heterogeneous surface increases the possibility that an adsorbate will be trapped in the pores or imperfections of the surface. The micrographs also show the presence the leafy structures with vessels, fibers and veins where physiological liquids circulate when the leaf is alive. A more careful
(a)
(b)
(c)
(d)
Figure 7: Scanning electron micrographs of (a) PM, (b) GT, (c) CM and (d) DGT.
238 Urban Water II
www.witpress.com, ISSN 1743-3509 (on-line) WIT Transactions on The Built Environment, Vol 139, © 2014 WIT Press

analysis of the surface indicates a very similar structure in DGT and GT. This is understandable as they come from the same plant; the only difference is the decaffeination process, where the normal GT is placed under high pressures or supercritic fluids for the extraction of caffeine. On the other hand, CM shows a rather more uniform surface amongst the other adsorbents. This might be associated with its smaller adsorption capacity. Finally, PM presents a heterogeneous surface but at the same time the presence of small separations on the surface. It would give the impression of narrow furrows or wrinkles. These narrows could house the dye in a very secluded area where spontaneous desorption could be prevented and MG is fixed on the surface. Finally, FTIR analysis was also run on the adsorbents to explore the presence of important functional groups that might be relevant for the interaction with MG. In biosorption, the most important functional groups are carboxyl, amino, hydroxyl and thiol groups due to their high nucleophilicity. Carboxyl group is perhaps the most important as it has a stronger affinity towards heavy metals. However, considering that dyes are amphipathic compounds, less polar functional would become more relevant like amides and hydroxyl groups [11, 14, 15]. Figure 8 shows the FTIR spectra of the adsorbents. The results indicate that the four adsorbents share the same functional groups. We can identify hydroxyl groups by that broad peak around 3300 cm-1. Alkane C-H vibrations can also be identified in the adsorbents at a wavenumber of 2900–2990 cm-1. Carbonyl groups are also observed in the spectra at 1630 cm-1. The combination of a carbonyl and a hydroxyl group can potentially indicate carboxyl groups. The
4000 3600 3200 2800 2400 2000 1600 1200 80075
80
85
90
95
100
PM
% T
rans
mitt
ance
Wavenumber (cm-1)
4000 3600 3200 2800 2400 2000 1600 1200 800
40
50
60
70
80
90
100 GT
% T
rans
mitt
ance
Wavenumber (cm-1)
4000 3600 3200 2800 2400 2000 1600 1200 800
70
75
80
85
90
95
100 DGT
% T
rans
mitt
ance
Wavenumber (cm-1)
4000 3600 3200 2800 2400 2000 1600 1200 80050
60
70
80
90
100 CM
% T
rans
mitt
ance
Wavenumber (cm-1)
Figure 8: FT-infrared spectra of the four adsorbents.
Urban Water II 239
www.witpress.com, ISSN 1743-3509 (on-line) WIT Transactions on The Built Environment, Vol 139, © 2014 WIT Press

difference between the adsorbents could be explained based on the peak intensities of the mentioned functional groups. For example GT and DGT show a higher alkane content, indicating their more hydrophobic nature by the presence of aliphatic chains. CM and PM present small alkane peaks and we could conclude a more polar behavior. On the other hand, CM shows a relatively small carbonyl peak. This might explain its low adsorption that is attributed to the decreased presence of carboxyl groups or even carbonyl groups that can potentially form hydrogen bonds or dipole-dipoles with MG. GT has a strong carbonyl peak, indicating a possible increase in the number of carboxyl groups on its surface. A strong peak in the hydroxyl group, observed in CM and GT might be an indication of high cellulose content. Cellulose is a polysaccharide and therefore has many hydroxyl groups. Unfortunately, cellulose is not known as a great adsorbent. However, it can be the scaffold of other functional groups, so its presence is important in some aspects. PM does not show an intense hydroxyl peak, and it could be postulated that most of the hydroxyl is forming part of carboxyl groups that have a high affinity towards pollutants [9, 12, 13].
4 Conclusions
The adsorption of an artificial dye onto spent tea leaves has been studied as an alternative to the use of activated carbon. Industries are in dire need of new decontaminating technologies. Raw materials like spent teas offer the low cost and maintenance for their use in the adsorption of dye. Malachite green (MG) is widely used in many types of industries. The removal of MG was explored using the spent teas of peppermint (PM), green tea (GT), decaffeinated green tea (DGT) and chamomile (CM). The results indicate a positive adsorption capacity. The order of the adsorbents according to their adsorption capacity is PM, followed by DGT, then GT and finally CM. Results were modeled by Langmuir, Feundlich, Dubinin-Radushkevich and Temkin theories. Calculated parameters indicate that PM is able to remove up to 69 mg of MG per gram of adsorbent. Other parameters like adsorbent dose, salinity, and presence of heavy metals have a negative strong effect. Finally, the characterization of the adsorbents indicates a heterogeneous surface as shown by SEM and FTIR analysis shows a diversity of active functional groups that are able to adsorb medium polar compounds like MG. This project has satisfactorily concluded with the proposal of these raw tealeaves as potential adsorbents of dye such as MG. Their physical and chemical properties are comparable with activated carbon and become an inexpensive alternative for the decontamination of color-containing solutions.
Acknowledgements
We thank David Yang, Alvaro Sponza, Habib Zahir and Chiu H. Lee for their technical assistance, comments and discussion. This work was supported by the Science Department and CSTEP at BMCC. A.N. gives thanks to PSC-CUNY and to the 2013 BMCC Faculty Development Grant for their support.
240 Urban Water II
www.witpress.com, ISSN 1743-3509 (on-line) WIT Transactions on The Built Environment, Vol 139, © 2014 WIT Press

References
[1] Yalcin, N. & Sevinc, V. Studies of the surface area and porosity of activated carbons prepared from rice husks. Carbon, (2000), 38, 1943–1945.
[2] Bello, G., García R., Arriagada, R., Sepúlveda-Escribano, A. & Rodríguez-Reinoso F. Carbon molecular sieves from Eucalyptus globules charcoal. Microporous and Mesoporous Mater., 56 (2002) 139–145.
[3] Abdel-Nasser, A., El-Hendawy, S.E., Samra, B. & Girgis, S. Adsorption characteristics of activated carbons obtained from corncobs. Colloids and Surfaces A: Physicochemical and Engineering Aspects, (2001), 180, 209–221.
[4] Oliveira, L., Franca, A., Thiago, M., Alves, S. & Rocha, D.F., Evaluation of Untreated Coffee Husks as Potential Biosorbents for Treatment of Dye Contaminated Waters. J. Hazard. Mater., (2008), 155, 507–512.
[5] Robinson, T., Mcmullan, G., Marchant, R., Nigman, P., Remediation of dyes in textile effluent: A critical review on current treatment technologies with a proposed alternative. Biores. Technol. (2001), 77, 247–255.
[6] Derbyshire, F., Andrews, R., Jacques, D., Jagtoyen, M., Kimber, G. & Rantell, T. Synthesis of isotropic carbon fibers and activated carbon fibers from pitch precursors. Fuels (2001), 80 345–356.
[7] Bailey, S.E., Olin, T.J., Bricka, M. & Adrian, D.D. A review of potentially low-cost sorbents for heavy metals. Water Res. (1999), 33, 2469–2479.
[8] Ho, Y.S. & McKay, G. Sorption of dyes and copper ions onto biosorbents. Process Biochem., (2003), 38, 1047–1061.
[9] Annadurai, G., Ling, L.Y. & Lee, J.F. Adsorption of reactive dye from an aqueous solution by chitosan: isotherm, kinetic and thermodynamic analysis. J. Hazard. Mater., (2008), 152, 337–346.
[10] Thiago, M., Alves, S. & Rocha, D.F. Evaluation Of Untreated Coffee Husks As Potential Biosorbents For Treatment Of Dye Contaminated Waters. J. Hazard. Mater., (2008), 155, 507-512.
[11] Quezada, M. & Moreno, G. Aerobic degradation of the azo dye acid red 51 in a sequencing batch biofilter. Biores. Technol. (2004), 92. 143–149.
[12] Christie, R., Colour chemistry, Royal Society of Chemistry. UK. (2001), 46, 118–120.
[13] Maci, R., Química Orgánica simplificada, Editorial Reverté. 1986. 423–484.
[14] Axelsson, J., Nilsson, U., Terrazas, E., Alvarez, T. & Welander, U. Decolorization of the textile dyes Reactive Red 2 and Reactive Blue 4 using 124 Bjerkandera sp. Strain BOL 13 in a continuous rotating biological contactor reactor. Enzyme and Microbial Technol., (2006), 39, 32–37.
[15] Davisa, T.A., Volesky, B. & Mucci, A. A review of the biochemistry of heavy metal biosorption by brown algae. Water Res., (2003), 37, 4311–4330.
Urban Water II 241
www.witpress.com, ISSN 1743-3509 (on-line) WIT Transactions on The Built Environment, Vol 139, © 2014 WIT Press


![Cationic dye (MB) removal using polymer inclusion membrane ... · anionic and cationic dyes, from aqueous solutions by emulsion liquid membrane [10-12]. Removal of anionic reactive](https://img.pdfslide.us/doc/110x75/5fcce24a22f59e61c930be37/cationic-dye-mb-removal-using-polymer-inclusion-membrane-anionic-and-cationic.jpg)


![Oligonucleotide analogues with cationic backbone linkages · Such artificial neutral linkages include, among others, sulfone [14], amide [15-22], triazole [23-27], phosphoramidate](https://img.pdfslide.us/doc/110x75/602794e50850695db356d51f/oligonucleotide-analogues-with-cationic-backbone-linkages-such-artificial-neutral.jpg)
![Highly selective binding of methyl orange dye by cationic ... · Highly selective binding of methyl orange dye by cationic water-soluble pillar[5]arenes L. S. Yakimova, D. N. Shurpik,](https://img.pdfslide.us/doc/110x75/5f0a48517e708231d42ae57c/highly-selective-binding-of-methyl-orange-dye-by-cationic-highly-selective-binding.jpg)


![International Journal of Engineering · the highest rates of toxicity as well as diazo direct dyes [6]. Malachite green (MG), a cationic triphenylmethane dye, is conventionally used](https://img.pdfslide.us/doc/110x75/5fa887a56e41a639b9232570/international-journal-of-the-highest-rates-of-toxicity-as-well-as-diazo-direct-dyes.jpg)


![Removal of Cationic Dye Methylene Blue- from Aqueous Solution …€¦ · biological treatment [5], biochemical methods [6], membrane separation [7], ion-echange [8], ultrafiltration](https://img.pdfslide.us/doc/110x75/5f0fb5827e708231d4457f63/removal-of-cationic-dye-methylene-blue-from-aqueous-solution-biological-treatment.jpg)