Embed Size (px)
Citation preview
1
On the Acquisition of Equity Carve-Outs
Chintal A. Desaia,*, Mark S. Klockb, Sattar A. Mansic
a Department of Economics and Finance, College of Business Administration, The University of Texas-Pan American, 1201 West University Drive, Edinburg, TX 78539-2999, USA b Department of Finance, School of Business, The George Washington University, 2201 G. Street, NW, Washington, DC 20052, USA c Department of Finance, Insurance, and Law, Pamplin College of Business, Virginia Tech, Blacksburg, VA 24061, USA
This version: May 24, 2011 Published in 35 Journal of Banking and Finance (2011), pp. 3432-2449
Abstract
We examine the role played by the parent’s motive in undertaking a carve-out; the parent’s post-IPO influence over the carved-out subsidiary; and anti-takeover provisions and industry structure of a carve-out on its acquisition likelihood and its acquisition premium. We find that the probability and hazard of a carve-out acquisition increase when the parent’s objective is to unlock the value of a subsidiary and when the parent and the subsidiary are tied with a product-market relationship. We also find that the post-IPO parent ownership significantly affects the acquisition likelihood and the level of acquisition premium. Additional analyses examining the post-IPO carve-out status suggest that the product-market relationship and post-IPO parent ownership increase the probability of re-acquisition.
JEL classification: G34; G32 Keywords: Equity carve-outs; Acquisition; Parent-subsidiary; Corporate restructuring * Corresponding author. Tel.: +1 956 665 7358; fax: +1 956 665 5020. E-mail addresses: [email protected] (C. Desai), [email protected] (M. Klock), [email protected] (S. Mansi). Acknowledgement The authors would like to thank the anonymous referee, the editor (Ike Mathur), Gregory Elliehausen, Bharat Jain, Gergana Jostova, Irvin Morgan, Christo Pirinsky, Robert Savickas, Emanuel Zur, and seminar participants at Florida State University (College of Law), George Washington University, Ohio University, University of Texas-Pan American, Midwest Finance Association (2007), and Southern Finance Association (2009) for their comments and suggestions. Ditina Desai contributed by proofreading the manuscript. This paper is partially based on Desai’s Ph.D. dissertation at The George Washington University. A portion of this research was completed while Desai was at University of Maryland, College Park. All remaining errors are the authors’ responsibility.
2
1. Introduction
An equity carve-out (ECO) is a form of corporate restructuring whereby the parent firm
offers a subset of its subsidiary’s common shares to the public.1 Research evidence indicates that
ECOs are temporary arrangements for the parent firms and the majority of ECOs are acquired
within a few years after their initial public offerings (IPOs).2 In such a scenario, do we know a
priori the factors which can predict the eventual acquisition of an ECO? And do these factors
have an impact on the ECO shareholders’ wealth, when it actually gets acquired? To our
knowledge, these questions have not been explored in the corporate restructuring literature and
we attempt to fill this gap. Specifically, we analyze the effects of: the parent’s motive for
conducting a carve-out; parental control on the post-IPO carve-out; anti-takeover provisions in
the charter of a carve-out; and industry structure of the carve-out on the likelihood of an
acquisition and the level of acquisition premium. Within the likelihood of acquisition, we look
into the probability of acquisition and the hazard of acquisition. We also assess the impact of our
chosen variables on the subsamples of ECOs that are either re-acquired by the parent firm or
acquired by a third-party.
The prior work of other scholars facilitates our research endeavors. For example, Perotti
and Rossetto’s (2007) theoretical model implies that the likelihood of an ECO acquisition
increases when the parent’s motive for conducting a carve-out is to unlock the value of its
subsidiary. As per the authors, prior to the carve-out, the parent is unaware of the “fair” value of
its synergy with the subsidiary, which precludes it from making an informed decision to keep
either full or no ownership in the subsidiary. Subsequent to the carve-out, market participants
1 For a review on ECOs and other forms of corporate restructuring, see Eckbo and Thorburn (2008). 2 For example, Klein et al. (1991) show that 44 of 52 ECOs in their sample are either re-acquired or sold off to a third-party by the parent firms.
3
assist the parent firm in ascertaining the value of its synergy with the subsidiary. If the synergy is
positive, then the parent firm decides to re-acquire the carved-out subsidiary, else if the synergy
is negative, then the parent decides to sell it off to a third-party. Based on the authors’ insights,
we posit that, if the parent’s motive is to unlock the value of its subsidiary, it is likely to be
interested in determining its synergy with the subsidiary. Therefore, this carved-out subsidiary’s
acquisition is imminent, either by the parent itself or by a third-party.
An equity carve-out differs substantially from other forms of corporate restructuring such
as spinoffs and asset sales in terms of the post-divestiture parent role in the subsidiary.3 Allen
and McConnell (1998) show that, on average, the parent retains 69% of the ownership in the
subsidiary. The ownership in an ECO provides required voting rights to the parent, which allows
it to appoint its nominee on the board and on the audit committee of the carve-out.4 The parent
firm, generally, appoints its past employees to key executive positions of the carve-out. In
addition, prior to a carve-out transaction, a parent can sign long-term business agreements with
the subsidiary, which allows it not only to preserve the existing synergy but also to exert undue
influence over the subsidiary.5 We hypothesize, as explained in Section 2.2, that the post-IPO
parental control can have an effect on the ECO’s acquisition.
3 In spinoffs, the parent firm distributes its ownership in the subsidiary on a pro-rata basis to its existing shareholders, whereas in the case of an asset sale, the parent firm sells its ownership in the subsidiary to a third-party on a private negotiation basis. In both cases the parent retains no ownership in the post-divesture subsidiary, suggesting minimal parent control. However, a few papers show the significant role of the parent in the spun-off subsidiary. For example, Wruck and Wruck (2002) show the involvement of the parent in appointing the top-management team of the spinoff. 4 Throughout the paper, the term ownership refers to the voting ownership rather than cash flow ownership since the former can have a significant impact on the acquisition event. The difference between the two is relevant only for equity carve-outs with dual class shares. 5 The long-term agreements with the parent firm can prevent an ECO from obtaining a better deal in an arm’s-length transaction. For example, the Appendix of Atanasov et al. (2010) provides the case of Coca-Cola’s (KO) influence over its partially-owned (49% ownership) subsidiary Coca-Cola Enterprises (CCE) through long-term business agreements.
4
The anti-takeover provisions and the industry in which an ECO operates can also play a
role in its acquisition. Field and Karpoff (2002) find that the probability of acquisition of an IPO
decreases when it employs takeover defenses in its charter. Takeover defenses might also affect
the level of acquisition premium; though the evidence is mixed. For example, Megginson (1990)
finds an increase in premium for firms with anti-takeover provisions, while Field and Karpoff
(2002) do not find any significant relation between the level of premium and anti-takeover
provisions. Regarding the relevance of the industry, Perotti and Rossetto (2007) conjecture that
ECOs operating in high-technology (hi-tech) industries have a longer time-to-acquisition due to a
higher level of valuation uncertainty in those industries. In contrast, hi-tech firms also offer
changes in technology and above-market returns which can increase the probability of their
acquisition (Kohers and Kohers, 2000).
Using a sample of 222 equity carve-outs (of which 137 are acquired) for the period of
1986 to 2004, we find that the likelihood of acquisition increases when the parent’s motive for
undertaking an ECO is to unlock its value, when the parent retains majority ownership in the
post-IPO carved-out subsidiary, and when the parent and the subsidiary are tied with product-
market relations. We also find some evidence that when the ECO operates in the hi-tech
industry, the likelihood of acquisition increases. Further, we find an inverse relation between the
level of acquisition premium and whether the parent ownership in the ECO is above 50% prior to
the acquisition. In terms of the differences between the parent re-acquisition and a third-party
acquisition, we find that the probability of re-acquisition increases when the parent’s motive is to
unlock value, when the parent retains majority ownership in the post-IPO carve-out, and when
the parent and ECO have an ongoing product-market connection.
5
Our results are robust to self-selection and endogeneity issues. Michaely and Shaw
(1995) find that the bigger and less profitable parent firms are likely to divest their subsidiaries
by conducting carve-outs instead of spinoffs. This choice of going public in the first place is
likely to induce self-selection bias in our estimation. To address this, we perform a two-stage
Heckman analysis for the probit models. In the first stage, we analyze the choice between a
carve-out and a spinoff, and in the second stage, given that the parent has selected to perform an
ECO, we analyze its likelihood of acquisition. In terms of endogeneity, the parent might be
anticipating the ECO’s future acquisition at the time of consummating the carve-out transaction,
and accordingly decides the post-IPO ownership in the carve-out. In that case, the retained
ownership in the carve-out is likely to be endogenously determined. We address this issue by
performing an instrumental variable probit analysis and bivariate probit analysis, which are
similar to that of a two-stage least squares analysis. In the first stage, we explain the parent’s
post-IPO ownership in a carve-out, and in the second stage, we use the predicted value of the
parent retained ownership for explaining the probability of an acquisition. We do not report these
results in this paper to economize on space, but they are available in Desai et al. (2011).
Our paper contributes to the corporate restructuring literature in at least four ways. First,
we undertake a comprehensive study by collectively analyzing the IPO and acquisition events of
a carve-out.6 Second, we assess the likelihood of acquisition of carve-outs by analyzing the
probability and the hazard of acquisition. The latter part, to our knowledge, has not been
investigated. Third, we explore the impact of contributory factors, other than the parent retained
6 Several studies seek to establish a link between the IPO and the acquisition events of a carve-out. For example, Klein et al. (1991) show that the probability of re-acquisition increases with the increase in post-IPO parent ownership. Hulburt (2003) finds that the parent firms of the ECOs that were subsequently acquired experience greater wealth gains at the time of carve-out announcements. Otsubo (2009) shows that the market participants anticipate a third-party acquisition and accordingly adjust the share price of the parent on a carve-out announcement.
6
ownership, such as the parent motives for conducting a carve-out, parent-subsidiary business
relations, anti-takeover provisions, and the industry in which the carve-out operates on the carve-
out’s acquisition. Lastly, we explain differences in the likelihood of acquisition and the
acquisition premium for the subsamples of parent re-acquisitions and third-party acquisitions.
The remainder of the paper is organized as follows: Section 2 illustrates our hypotheses,
and Section 3 highlights the data, variable measurements, and descriptive statistics. Section 4
provides the empirical results. Section 5 concludes the paper.
2. Hypotheses development
2.1. Reasons for conducting a carve-out and its acquisition
When conducting a carve-out, the parent firms incur a substantial amount of explicit costs
such as legal, underwriting, and filing fees. They also underprice in order to successfully
consummate the offering; Hogan and Olson (2004) show a first-day return of 13%. In addition,
there are costs due to the ‘disincentive’ effect (Perotti and Rossetto, 2007). Before a carve-out,
the operating profits of the wholly-owned subsidiary belong entirely to the parent firm. After a
carve-out, the parent firm incurs costs in operating the partially-owned subsidiary, but the profits
are pro-rata distributed to the shareholders which also include minority shareholders. Then, what
are the benefits for the parent firm in conducting an equity carve-out?
Schipper and Smith (1986) describe three main reasons for conducting a carve-out:
financing, restructuring, and unlocking the value. The financing reason involves the instances
when the parent conducts an ECO to finance its own or its subsidiary’s growth projects, to
discharge parent debt, or to raise funds to meet capital expenditure requirements. The
restructuring reason involves the instances when the parent carves out the subsidiary to gain from
7
the divestiture.7 Finally, the unlocking the value reason involves the cases when the parent
undertakes an ECO for investors to better understand the operations of the carve-out. At the time
of an IPO and subsequent to it, the subsidiary needs to comply with the Securities and Exchange
Commission (SEC) by filing forms such as registration statements, proxy statements, 10-Ks, and
annual reports. From these filings, the investors can obtain the relevant information about the
carved-out subsidiary.
As mentioned earlier, the theoretical insights of Perotti and Rossetto (2007) help establish
a possible linkage between the parent motive at the time of a carve-out and the subsequent
acquisition of the carve-out. They argue that the status of a subsidiary as a fully-integrated and
an independent identity are two extremes, and it depends on the synergy between the parent and
the subsidiary. By selling out full ownership in a subsidiary, the parent firm carries an
irreversible loss if it finds a positive synergy with the subsidiary in the future. At the same time,
by keeping the subsidiary fully-integrated, the parent firm is unable to assess the value of the
synergy. An ECO of the subsidiary provides the parent a better alternative. On the one hand,
carving out the subsidiary at the first stage causes the parent firm to incur costs related to the
public issue and the loss of operational efficiency. On the other hand, it helps the parent firm
determine the value of its synergy with the subsidiary more accurately while retaining control
(through a majority ownership) in the subsidiary. Therefore, the carve-out of a subsidiary
provides the parent firm with an indefinite American style option to buy back the remaining
ownership from the minority shareholders or to sell out its ownership to a third-party.
7 The divestiture gains hypothesis posits that the carve-outs help the parent firms improve investment efficiency, focus on their core businesses, and reduce agency costs by aligning managers’ and shareholders’ interests through writing effective contracts (Hulburt et al., 2002; Vijh, 2002).
8
The exercise of this option depends on the value of the underlying synergy between the
parent and subsidiary. These synergies (operational, financial, etc.) can be positive or negative.
The positive value of the synergy indicates that the parent is better off by keeping 100%
ownership in the carved-out subsidiary. Thus, the parent can achieve synergistic gains such as
lower transaction costs than what it would gain in arm’s length transactions, and it can avoid
losses due to the ‘disincentive’ effect. The negative value of the synergy implies that the parent
is better off by removing the carved-out subsidiary from its portfolio. Therefore, the parent may
decide to sell its ownership to a third-party. We conjecture that if the parent’s motive is to unlock
the value of a subsidiary, then its intentions are likely to ascertain its synergy with the subsidiary,
and it would like to possess the real option of re-acquiring or selling off the remaining portion of
the subsidiary. Therefore, our first hypothesis is:
H1 : The parent’s motive of unlocking the value of the subsidiary suggests a higher
likelihood of the ECO’s acquisition.
2.2. Post-IPO parental control and the acquisition of a carve-out
In this subsection, while forming the hypothesis on the relationship between the post-IPO
parental control and the acquisition of the carved-out subsidiary, we mainly refer to two
mechanisms by which the parent can exert its undue influence over the carve-out. These are
parent retained ownership and its ongoing business connections with the carve-out.
The parent firm obtains a real option to re-acquire or to sell off the remaining portion by
retaining the majority ownership in the carved-out subsidiary (Perotti and Rossetto, 2007). The
majority ownership also helps the parent firm obtain the approval of the ECO board with less
effort should it decide to re-acquire the subsidiary, because through majority ownership the
9
parent can appoint its nominees to the carve-out’s board. Even in the case of a third-party
acquisition, the bidder effectively needs to convince only one shareholder (the parent firm) to
tender shares, which increases the likelihood of acquisition. In addition, majority ownership
creates less-dispersed ownership in the carve-out, which helps mitigate the free-rider problem as
pointed out in Grossman and Hart (1980). Majority ownership also allows the parent firm to
appoint its past employees to the key management positions in the carve-out. These top
executives can potentially affect the outcome of a major corporate event such as acquisition.
Therefore, the majority ownership in a post-IPO carve-out suggests an increase in the likelihood
of a carve-out’s acquisition.
Further, the property rights theory of Grossman and Hart (1986) and Hart and Moore
(1990) suggests that when Company A and Company B have a business relationship and
Company A has incentives to control assets and resources of Company B, then Company A will
maintain ownership in Company B. For ECOs, based on the predictions of the property rights
theory, Boone (2003) finds that the parent firms maintain high ownership in carve-outs if they
have a product-market or financial relationship. Therefore, we conjecture that if the parent and
subsidiary are linked through long-term business relationships such as product-market and
financial, then the parent firms are likely to retain majority ownership in the subsidiary which
will increase its likelihood of acquisition. Therefore, our second hypothesis is:
H2 : Majority ownership by the parent firm in the post-IPO carve-out and ongoing
business connections between the parent and the ECO increase the likelihood of acquisition of
the ECO.
The parent through its control over the subsidiary can impact the level of acquisition
premium. In the case of re-acquisitions, it is reasonable to claim that the parent may expropriate
10
wealth of the minority shareholders. However, the incentive to expropriate minority shareholder
wealth will be weaker when the parent retains a larger fraction of the ECO because a smaller
fraction of any premium paid will accrue to the minority shareholders.8 Additionally, the parent
firm’s re-acquisition bid needs to be approved by a special committee of independent directors
who do not have any vested interest with the parent firm. Therefore, the difference in the
acquisition premium between a third-party acquisition and a parent re-acquisition might be
insignificant. Indeed, prior empirical findings suggest mixed views. On the one hand, Slovin and
Sushka (1998) analyze a sample of parent-subsidiary mergers that also includes mergers of
equity carve-outs. As per their study, for the period 1970-1993, the subsidiary announcement day
return is 19% for 105 parent re-acquisitions; whereas that statistic is 21% for 38 third-party
acquisitions, and the difference between the two is statistically insignificant. On the other hand,
Atanasov et al. (2010) show the instances when the parent firms deliberately transfer risk to the
publicly-traded subsidiaries and expropriate wealth from the minority shareholders. These mixed
findings preclude a decisive hypothesis about the minority wealth expropriation in the case of
equity carve-outs, and we rely on our data and analyses to guide us on this.
2.3. Anti-takeover provisions in a carve-out and its acquisition
Managers adopt anti-takeover provisions in the charter of a firm mainly to avoid the
external market for corporate control.9 Ambrose and Megginson (1992) show that the probability
of acquisition decreases when the firm uses blank-check preferred stock – a form of an anti-
takeover provision. Megginson (1990) reports that the trading price and the acquisition premium
8 We thank the referee for bringing this important point to our attention. 9 For a review on different forms of anti-takeover provisions, see Gompers et al. (2003). For the impact of anti-takeover provisions on the performance of a spin-off parent firm, see Chemmanur et al. (2010).
11
of the superior voting shares are higher than those of the otherwise equivalent class of restricted
voting shares. In the case of IPOs, Field and Karpoff (2002) show that the probability of
acquisition of an IPO decreases when it has anti-takeover provisions in its charter at the time of
the IPO. Therefore, our next hypothesis is:
H3 : Anti-takeover provisions in the charter of an ECO decrease the likelihood of its
acquisition, and increase the level of acquisition premium.
3. Data and variables
3.1. Data description
We obtain the initial sample of 619 equity carve-outs, offered over the sample period of
1986 to 2004, from the Security Data Corporation (SDC)’s new issues database and issues of the
‘Mergers and Acquisitions’ magazine.10 From this sample, we eliminate carve-outs for which
parents/carve-outs are mutual trusts, limited partnerships, foreign firms, finance firms, limited
liability firms, and joint venture firms. We also exclude observations which are unit offerings,
target stocks, spinoffs, and for which data are missing from the Center of Research in Security
Prices (CRSP) tapes for the parent/carve-out. This screening reduces our sample to 295 carve-
outs. Finally, we eliminate carve-outs for which the parent firms have already announced plans
to divest their remaining ownership11 (44 carve-outs) and the data are missing in the (Q-data)
microfiche (29 carve-outs). This yields a final sample of 222 carve-outs from 199 parent firms. It
contains wholly-owned (163 carve-outs) and partially-owned (59 carve-outs) subsidiaries.
10 The cutoff year of 2004 allows us to follow all carve-outs for at least a three-year period, which provides sufficient time for parents to fully divest or re-acquire their subsidiaries should they choose. 11 In these cases, the parent firms generally announced plans to divest their remaining portion within a year of IPO by tax-free spinoffs. For more on such carve-out/spinoff combination transactions, see Thompson and Apilado (2006).
12
For each carve-out, we collect the parent firm’s reason for conducting a carve-out from
news articles in LexisNexis®. The ownership, board composition, top management team, and
business relationship data are from SEC filings including proxy statements, 10-Ks, and
prospectuses. We collect merger announcement dates and merger related details such as offer
price, exchange ratio, and winning bidder from news articles in LexisNexis® and Factiva®, and
available proxy statements before the acquisition. In order to avoid errors due to discrepancies in
the Standard Industrial Classification (SIC) codes in the Compustat and CRSP databases (Kahle
and Walkling, 1996), we collect SIC codes primarily from LexisNexis® and SEC filings, and the
missing ones from SDC, Compustat, and CRSP, in that order. We obtain offer size data from
Factiva®, SEC filings, and SDC. Finally, we extract data on the time-to-acquisition, size of the
carve-out, and size of the parent firm from CRSP.
3.2. Dependent variables
For the logit analysis on the probability of acquisition, we follow Field and Karpoff
(2002) and assign a value of one to a carve-out that was acquired within five years from its IPO
date, and zero to a survived one. For the hazard analysis, we define Acquisition Time as the
number of months between the last and the first trading dates of a carve-out as given in CRSP.
For carve-outs which are actively traded as of December 31, 2007, we take this date as the last
available trading date.
For the analysis on acquisition premium, we use three approaches to compute the level of
premium. First, we consider the possibility of an information leakage prior to the merger
announcement (Schwert, 1996). The variable Acquisition Premium_42 is the ratio of the price
offered per share of a carve-out to the carve-out’s price per share on the 42nd trading day prior to
13
the merger announcement, minus one. For the stock-to-stock exchange, we compute the carve-
out offer price using the available exchange ratio and the bidder’s price on the announcement
day. For five acquired carve-outs, since we do not find the price on the 42nd trading day prior to
the announcement, we use the price on the sixth trading day prior to the announcement.
For the second and the third approach of computing the acquisition premium, we follow
Moeller (2005). We define Acquisition Premium_Returns as the buy and hold (excess) return
during the merger announcement date. Specifically, we compute the carve-out’s buy and hold
return for 11 trading days starting with the five trading days prior to the merger announcement
and subtract the buy and hold return on the CRSP value-weighted index for the same time
period. Finally, we define Acquisition Premium_06 which is similar to Acquisition Premium_42,
except that we compute the ECO price on the sixth instead of 42nd trading day prior to the merger
announcement.
3.3. Explanatory variables
We group our explanatory variables into five sets of variables. The first set pertains to the
motive of the parent firm to undertake an equity carve-out. The second set consists of factors
through which the parent can exert control over the post-IPO carve-out. The third category
contains our proxies for the anti-takeover provisions in a carve-out and its industry structure. The
fourth category represents the set of control variables. Finally, the fifth category contains the set
of variables which are related to a merger transaction. The variable definitions, their detailed
description, and the data sources are available in the Appendix.
3.3.1. Factors related to the parent motive
14
We extensively review the news reports at the time of the IPO announcements and
identify three categories of reasons for conducting an equity carve-out. These are
financing/investing, restructuring, and unlocking the value.12 These are not mutually exclusive
categories due to the cases when the parent provides multiple reasons for conducting a carve-out.
There are also other instances when the reason for conducting a carve-out does not fall into any
of these three categories, for example, the reason of conducting a carve-out due to apartheid
concerns or to meet government regulations on an antitrust lawsuit; we note these cases under
the other category.
First, if a parent undertakes a carve-out for general corporate purposes, for working
capital, for repayment of debt, for capital expenditures, for possible acquisitions, or for taking
out the parent from financial distress, we consider these instances in the financing/investing
category. Second, we define the restructuring reason as the instances when the parent
consummates the carve-out transaction to focus on core business or as part of a larger
restructuring plan. Finally, the category of unlocking the value consists of the cases when the
parent undertakes a carve-out to create a liquid market for the subsidiary shares, to allow the
market to value the subsidiary, or to create a liquid market for employee shareholders.13
3.3.2. Factors related to the post-IPO parental control over the carve-out
We study the parental role in the post-IPO carve-out via equity ownership, board and
audit committee composition, top-management team, and long-term business relationships. The
12 For more detailed examples of the language used by parent firms when they announce carve-outs for unlocking the value, see Desai et al. (2011); Chemmanur and Liu (2011); and Nanda and Narayanan (1999). 13 We also define the parent’s motive to unlock the value by considering only those announcements in which the parent undertakes an ECO to allow the market to value the subsidiary. Our results remain qualitatively similar with this definition.
15
most direct way the parent firm can exert control over the ECO is by retaining majority
ownership. We also define the reduction in parent ownership as the difference of parent
ownership before and after the IPO; a smaller value of this variable indicates a higher level of
parental control over the post-IPO carved-out subsidiary. To capture the non-linear relation
between the parent ownership and our dependent variables, we consider two indicator variables
reflecting whether the parent retains above 50% and above 80% ownership.
The ownership allows the parent firm to appoint its personnel as directors and top-
executives of the carve-out firm. Directors in the carve-out can be one of three types: insider,
outsider, or parent representative. Parent representative directors are current or past employees of
the parent firm. Following Boone (2003), we define the top-management team of a carve-out
being affiliated with the parent firm if the chairman, CEO, or president of a carve-out is either a
current or past employee of the parent firm. We also measure the parent influence over the audit
committee of the carve-out by identifying whether any of the parent’s past or current employees
serve on that committee.
We define a product-market relation between the parent firm and the ECO when they
have buyer-supplier, technology sharing and research and development, marketing and
distribution, or specialized service agreements (Boone, 2003). Similarly, we define a financial
relationship when the parent and the ECO are involved in a long-term financial agreement
through letters of credit, bank guarantees, or term loans (Boone, 2003). We also consider
industry relatedness of the parent and subsidiary to capture the possibility of parental
involvement in the subsidiary if they both are in the same industry.
3.3.3. Factors related to anti-takeover provisions and industry structure of a carve-out
16
We use three types of anti-takeover provisions. These are whether a carve-out has a
staggered board, two classes of shares, and whether its state of incorporation is Delaware. We
restrict our analysis to only three anti-takeover defenses due to unavailability of (a) IPO
prospectuses for the ECOs prior to the year 1996 and (b) takeover defenses on standard
databases such as the Investor Responsibility Research Center (IRRC) for an ECO firm because
of its small size. Regarding the industry structure of a carve-out, we assign a dummy variable
that takes on a value of one if the firm operates in the hi-tech sector (SIC code of 28, 357, 36, 38,
or 737).14
3.3.4. Other control variables
Governance related: We measure ownership of the CEO, insiders (executives and
directors), and blockholders. Because ownership data are not reported when the insider/CEO
owns less than 1% and the blockholder owns less than 5% of the outstanding shares, we use both
continuous and indicator variables for insider/CEO and blockholder ownership. Regarding the
directors other than the parent directors, insider directors are the employees of the carve-out but
have no relationship with the parent firm. Outside directors are not the employees of the carve-
out or of the parent firm. We measure board size as the number of directors immediately after the
IPO. Board size is considered large when the number of directors is above the median board size.
We capture the CEO power by measuring whether she is also a chairperson of the board.
Size and performance related: We control for the relative size (ratio of the carve-out size
to the parent firm size), IPO offer size, and carve-out stock market performance in our analysis.
14 We follow the definition of a hi-tech industry in Benou et al. (2008), who in turn rely on the SDC. An example of a hi-tech carve-out is Networth Inc (SIC: 3577) which went public on 11/25/1992 and is in the business of computer peripheral equipments. Its parent, Tandem computers (SIC: 7377), also operates in a hi-tech industry.
17
3.3.5. Factors related to a merger transaction
For analysis on the level of acquisition premium, we also control for variables that are
related to a merger transaction. These are whether a lawsuit is filed during the merger process,
the ratio of bidder size to target size, the carve-out size prior to its merger, whether more than
one bidder attempts to acquire the carve-out, and whether the transaction is financed through
only cash. All these factors are likely to impact the acquisition premium.
3.4. Descriptive statistics
In Panel A of Table 1, we report the incidence of carve-outs based on offer year and post-
IPO parent firm’s ownership. We classify carve-outs into three categories based on the CRSP
delisting codes as of December 31, 2007: survived, acquired, and failed carve-outs. Survived
carve-outs with a delisting code of 100 represent 18% of the sample and are still actively traded
in the market. Acquired carve-outs with a delisting code between 200 and 290 represent 62% of
the sample and are acquired by either the parent firm (22%) or a third-party (40%), and trading
activities ceased after the acquisition date. Failed carve-outs represent the remaining 20% of the
sample (46 carve-outs); of which 44 carve-outs are delisted (delisting code between 500 and
591), one is liquidated (delisting code between 400 and 490) and one is exchanged for another
class of common stock (delisting code of 331).
[Insert Table 1 about here]
In terms of the year-wise distribution of the sample, the majority of ECOs are in the years
1996, 1991, and 1986, with 22, 21, and 20 carve-outs, respectively. The subsample of acquired
18
ECOs display that 17, 15, and 14 transactions are in the years 1986, 1996, and 1987,
respectively. In the period from 2001 to 2004, there are only seven carve-outs in our sample.15
We also examine the incidence of carve-outs for the parent ownership after the IPO. We
divide the sample into three categories: those with post-IPO parent ownership less than 50%,
between 50% and 80%, and more than 80%. The largest number of deals occurred in the
ownership category between 50% and 80% (about 37%), followed by the greater than 80%
category (about 34%), and the less than 50% category (about 29%). The parent firms retained
majority (above 50%) ownership in 77% of acquired carve-outs, whereas, in survived carve-outs
that statistic is only 49%. This difference of parent ownership in survived and acquired carve-
outs suggests a possible relation between parent ownership and carve-out acquisition. Similar to
the findings of Klein et al. (1991), 92% of the re-acquired carve-outs in our sample have parent
ownership above 50%, which suggests that the probability of re-acquisition of carve-out
increases with the post-IPO parent ownership.
In Panel B of Table 1, we show the incidence of carve-outs and parent firms based on
industry using two-digit SIC codes. Although there are 199 parent firms which conducted a total
of 222 carve-outs, for simplicity we consider a combination of one parent firm and one carve-
out. The majority of the ECOs operate in the manufacturing industry (41%) and service industry
(27%). Also, these industries significantly represent the acquired carve-outs sample with 41%
and 31% of the sample, respectively. Based on our sample, 72% of the carve-outs operating in
the service industry and 62% operating in the manufacturing industry are eventually acquired.
Among the parent firms, 49% and 18% of sample firms operate in the manufacturing and service
sectors, respectively. 15 During this period, we exclude 13 observations of carve-out/spinoff combination in which the parents have already indicated the intent to divest their remaining portion.
19
In Panel A of Table 2, we report summary statistics of variables pertaining to post-IPO
parental influence on the carve-out and our chosen controls for the total sample. The parent
ownership prior to the carve-out has a mean of around 95% and median of 100%, whereas parent
ownership subsequent to the carve-out has a mean of 62% and median of 68%. The high post-
IPO parent ownership in a carve-out suggests that the parent firm has an interest in controlling
the subsidiary, which might not be possible through other forms of restructuring such as spinoffs
and asset sales.16 The parent representative directors constitute, on average, 42% of the carve-out
board, which indicates the possibility of the parent firm’s role in the operating and strategic
decisions of a carve-out. Blockholder ownership has a mean of around 7%. Similarly, insider and
CEO ownership in a post-IPO carve-out on average are around 4% and 2%, respectively. The
number of directors serving on the carve-out has a median of seven. The carve-out offer size has
a mean of $174.5 million, a median of $48.5 million, and minimum and maximum values of $2.5
million and $8.7 billion, respectively. The median size of a carve-out is 22% that of the parent
firm. For our sample firms, the average first year excess return over the value-weighted CRSP
index return has a mean of -3.5%, which shows that in the short-run the ECOs tend to
underperform.
[Insert Table 2 about here]
Panel B of Table 2, we report summary statistics of dummy variables that proxy for the
parent’s motive and its influence, anti-takeover provisions, industry structure and other control
variables. In around 40% of our sample firms, the reason for conducting a carve-out is for
financing related or for investment related activities. We also note that in around 11% of our
16 We also notice that in 13 out of 222 carve-outs the parent retained no ownership after the IPO of the subsidiary. In four of these carve-outs, the parent and subsidiary are tied through product-market agreements, and in none of these 13 carve-outs, the parent’s motive for undertaking a carve-out is to unlock the subsidiary’s value.
20
sample firms the parent conducts a carve-out to unlock the subsidiary’s value. In 157 out of 222
equity carve-outs, parent ownership is above 50%; the board-chairperson and CEO are
associated with the parent firm in 75% and 51% of carve-outs, respectively. These numbers
suggest the parent firm's involvement in the operating and strategic decisions of the publicly-
traded subsidiary. Regarding the business relationships, 59% of the carve-outs in our sample are
linked to their parent firms through product-market agreements and 75% are linked through
financial agreements. These statistics on business relationships suggest an alternative
mechanism, other than ownership, by which the parent firm can control the subsidiary (Atanasov
et al. 2010). In 33% of our sample firms, the ECO and parent have the same two-digit SIC code.
In our sample around 41% (18%) of ECOs use a staggered board (dual class shares). We
also observe that 69 carve-outs operate in the hi-tech industry, representing 31% of our sample.
Although the parent firms generally retain significant ownership in the ECO, we also observe a
notable presence of blockholder, insider (executives plus directors), and CEO ownership in 37%,
54%, and 27% of our sample firms, respectively. Finally, in 91 out of 220 carve-outs, the CEO is
also the chairperson of the board. Out of 222 carve-outs, we could not obtain data on audit
committee, business relationship, chairperson’s affiliation with parent, and CEO duality for 22,
one, four, and two carve-outs, respectively.17
[Insert Table 3 about here]
In Table 3, we report statistics similar to those reported in Table 2 for the sample of
acquired carve-outs. As shown in Panel A of Table 3, the mean and median time-to-acquisition
are 69 and 54 months, respectively. The minimum and maximum time-to-acquisition is eight and
217 months, respectively. Out of 137 acquired carve-outs, 48 are re-acquired by the parent firm, 17 In empirical analyses, we conservatively assign values of zero for these missing data; results remain the same without such adjustment.
21
and 89 are acquired by a third-party. The average and median time-to-acquisition in the case of
parent re-acquisitions are 59 and 48 months, respectively, whereas those statistics are 74 and 58
months, respectively for third-party acquisitions. These differences suggest that the re-
acquisitions tend to occur sooner than the third-party acquisitions. The average and median
acquisition premium, based on the price of the ECO on the 42nd trading day prior to the merger
announcement date, are 46% and 37%, respectively. However, when we compute the premium
using the price of the target on the sixth trading day prior to the announcement those statistics are
34% and 25%, respectively; this lower level of premium suggests a possible information leakage
prior to the merger (Schwert, 1996). The median post-IPO parent ownership in acquired carve-
outs is 72%.
As shown in Panel B of Table 3, around 77% of acquired carve-outs have majority parent
ownership. We also observe that around 56% of the acquired carve-outs have parent ownership
above 50% prior to their acquisition. In our sample of acquired carve-outs, 31% have the parent
and carve-out in the same industry and 16% have dual-class shares. Finally, 58% of carve-out
mergers in our sample are financed through only cash, and in around 11% of mergers a lawsuit is
filed either by a competing bidder or by the minority shareholders.
4. Results
4.1. Likelihood of acquisition: Probability of acquisition
In Table 4, we report the results of the logit analysis in which the dependent variable
Acquired takes on a value of one if the carve-out is acquired and zero if the carve-out is traded in
the market (‘survived’), within five years of its IPO offer date.18 For this analysis, following
18 Because our cut-off date is 12/31/2007, we could not follow one carve-out (IPO offer date 11/20/2003) for the full
22
Field and Karpoff (2002), we ignore the carve-outs which are delisted or have gone bankrupt
(‘failed’) within five years of their IPOs (24 observations). Since we are restricting this sample to
carve-outs that are acquired within five years of IPOs, our overall sample is of 198 carve-outs, of
which 77 are acquired.
Our primary specification (Model 1) is:
𝐴𝑐𝑞𝑢𝑖𝑟𝑒𝑑𝑖 =𝑒𝑦𝑖
1 + 𝑒𝑦𝑖
(1)
Where, 𝑦𝑖 = A0 + A1 × 𝑈𝑛𝑙𝑜𝑐𝑘𝑖𝑛𝑔𝑖 + A2 × ∆𝑃𝑎𝑟𝑒𝑛𝑡 𝑂𝑤𝑛𝑖 + A3 × (𝐻𝑖 − 𝑇𝑒𝑐ℎ)𝑖
[Insert Table 4 about here]
As reported in Model 1, the coefficient of 1.089 on the dummy variable
Unlocking indicates that when the reason for undertaking a carve-out is to unlock the value, the
odds of that carve-out to get acquired increase by a factor of 2.97 over the instance when the
reason is other than to unlock the value. In terms of the probability, if the reason for undertaking
a carve-out is to unlock the value, then the probability of acquisition for that carve-out changes
from 0.5 to 0.75; this change is significant at the 5% level (z-value: 2.28).19,20 The coefficient of
-1.583 on ∆Parent Own suggests that an additional one-percentage decline in the post-IPO parent
ownership in a carve-out causes a reduction of 0.791% in the probability of acquisition of this
carve-out.21 The coefficient of 0.676 on Hi-Tech shows that if the carve-out operates in the hi-
five years. 19 More precisely, the increase in odds is equal to 𝑒1.089 = 2.97. Assuming that if there are reasons other than to unlock the value, then the probability of acquisition p1 = 0.5, and the odds = 1. When the reason is to unlock the value, the new odds = 2.97, which will make new p1 = 0.748. 20 In all our multivariate analyses, t and z values are based on heteroskedasticity-robust standard errors clustered at the parent firm level. 21 More precisely, assuming that before the IPO, the parent owns 100% of the subsidiary. In the first case, the parent retains 81% (i.e. it sells 19% of its ownership in IPO) of the subsidiary, and in the second case, the parent retains 80%. Thus, ∆Parent Own in the first (second) case is 19% (20%), and the change in ∆Parent Own is equal to 0.01, and the new odds = 𝑒−1.583 × 0.01 = 0.9843. Therefore, the new probability of acquisition is 0.4960, which was previously 0.5.
23
tech industry, then there is approximately a 66%(34%) chance that this carve-out will be
acquired(survived). This result supports findings of Kohers and Kohers (2000) who conjecture
that the likelihood of acquisition will be higher in the hi-tech industry due to above-average
returns in that industry.
In Models 2 to 5, we change our primary specification to incorporate other factors of
interest and controlling variables. As mentioned in Section 2.2, the parent is likely to retain
majority ownership in the carved-out subsidiary if it has business relations with the subsidiary. In
that case, the effect of post-IPO parent ownership may confound the effect of ongoing business
connections on the carve-out’s acquisition. Therefore, to separate these two effects, we exclude
∆Parent Own and include variables related to the business relationships in Model 2. The
coefficient of 0.615 on dummy variable Product Market indicates that the odds of acquisition
increase by a factor of 1.85 when the parent and subsidiary are connected through a product-
market relationship, and this change is significant at the 10% level (z-value: 1.79).
In Models 4 and 5, we use a dummy variable Parent Own ≥ 50% instead of a continuous
variable ∆Parent Own. As shown in Model 4, the coefficient of 0.869 on Parent Own ≥ 50%
suggests that the odds of ECO acquisition increase by a factor of 2.38 when the parent retains
majority ownership in the post-IPO carve-out, and this difference is significant at the 10% level.
In Models 2 and 5, we include variables Financial and Same Industry. For brevity, we do not
show their coefficients, due to their statistical insignificance.
As shown in Model 4, the coefficient of 0.915 on Dual Class indicates that the odds of
acquisition increase by a factor of 2.50 when the carve-out has dual class shares compared to the
case when it has shares with only one class. This change is significant at the 10% level. In
addition, in unreported regressions, when we add the variable Dual Class in our Models 1 to 3,
24
we find its insignificant impact on the likelihood of acquisition in Models 1 and 3, and in Model
2, its impact is significant at the 10% level. This counterintuitive finding to our hypothesis H3, at
first, suggests that the anti-takeover provisions actually increase the likelihood of acquisition in
the case of carve-outs. One plausible explanation for this finding is: in examining the SEC
filings, we find that in the case of ECOs with dual class shares, the parent firm generally retains
full ownership of the superior voting shares while it retains minimal or no ownership of the
inferior voting shares. In this manner, the parent voting ownership increases significantly
whereas its cash flow ownership is negligible. We define the ownership based on the voting
rights. Therefore, this effect of dual class shares is possibly the effect of parent ownership in the
post-IPO carve-out.22 If we examine the effect of another form of anti-takeover provision
(Staggered) in Models 3 to 5, it is negative albeit statistically insignificant. Therefore, we do find
some support of our hypothesis H3.
In an unreported analysis, we also test the difference between the estimated coefficients
of various categories of parent motives. For example, in Model 2, the test of difference of
estimated coefficients for Unlocking and Financing has a 𝜒2 value of 6.02 with a p-value of
0.01. Similarly, the estimated coefficient for Unlocking is significantly higher than that of the
Restructuring, with a 𝜒2 value of 6.74; whereas there is no significant difference in the estimated
coefficients of Financing and Restructuring (𝜒2 = 1.82). These results suggest that the
probability of acquisition significantly increases when the parent’s motive is to unlock the value
of the subsidiary compared to that when the motive is either to finance or to restructure the
operations.
22 For example, in our sample of 39 ECOs with dual class shares, the average parent ownership is 82.6% and for 183 ECOs without dual class shares, that statistic is 57.7%; the difference is significant at the 1% level.
25
Overall, the results reported in Table 4 indicate that the probability of ECO acquisition
increases when the parent’s motive for conducting a carve-out is to unlock the value, with the
increase in parent ownership in the post-IPO carve-out, and when the parent and subsidiary are
connected through a product-market agreement. These findings support our hypotheses H1 and
H2.
4.2. Robustness check
Our results of the logit analysis on the ECO acquisition can potentially produce biased
results if we ignore the fact that at the time of making the subsidiary a public company, the
parent could choose whether to conduct a carve-out or to conduct a spinoff. In addition, if the
parent decides to conduct a carve-out, then it can determine the level of ownership it needs to
retain in the carved-out subsidiary. If we ignore the former, i.e., the choice between a carve-out
and a spinoff, our results are likely to be biased due to self-selection. And if we ignore the latter,
i.e., the possibility that the parent ownership in the post-IPO carve-out is endogenously
determined, our results may be incorrect due to endogeneity. To check our results for sample
selection bias we merge our carve-out sample with a sample of spinoffs and perform a two-step
Heckman procedure. To check our results for endogeneity bias, we repeat our analysis using
exogenous instrumental variables. Our results remain the same under both sets of analyses and
there is no indication that our findings are affected by selection or endogeneity bias. Details of
these tests are in Desai et al. (2011).
4.3. Likelihood of acquisition: Time-to-acquisition
26
After an IPO, a carve-out can be actively traded, failed, or acquired in the market. The
right-censored observations in our dataset are those ECOs that are either actively traded or failed
as of the cut-off date, December 31, 2007. The usefulness of estimating the parameters using the
survival (failure) / time-to-event analysis over the logit or probit analysis is its ability to
incorporate information of right-censored observations and the time till the carve-out survives in
the market before its acquisition.23 We use a dichotomous variable describing the status of a
carve-out as either acquired or not-acquired (both failed and survived). When interpreting the
results of the survival analysis, we refer to the probability of failure for a carve-out as the
probability of its being acquired.
We use non-parametric and semi-parametric approaches of survival analysis to assess the
impact of our selected variables on the failure and hazard functions.24 The non-parametric
technique helps us analyze the differences in failure functions of groups based on a dummy
variable. The semi-parametric approach allows us to model the impact of utilize more than one
explanatory variables for analyzing their impact on the hazard rate of acquisition. Both
approaches make no assumptions regarding the distribution of time-to-acquisition.
4.3.1. Non-parametric analysis
The non-parametric analysis involves plotting Kaplan-Meier (K-M) failure function
estimates for groups based on the parent’s motive for conducting a carve-out, post-IPO parent
ownership, business relationship of parent and subsidiary, and industry structure of a carve-out; 23 For an application of survival analysis, see Cleves et al. (2004). 24 If t = 0 is the IPO date and t = T is the acquisition date which is a random variable, then the survival function S(t) of a carve-out is defined as the probability of its surviving until time t. Mathematically, S(t) = P(T ≥ t). The failure function is a complement of a survival function. It is the cumulative probability of failure (in our case, acquisition of a carve-out) at any given time t. Mathematically, F(t) = 1 – P(T ≥ t). The hazard function h(t) --- also known as the hazard, hazard rate --- is the probability of a carve-out to get acquired at this infinitesimal time-interval conditional on its surviving until the beginning of the interval, divided by the duration of this time-interval.
27
and then conducting statistical tests to determine whether the differences in the failure functions
are significant. We find that the probability of acquisition at any given time is higher when the
parent’s motive for conducting a carve-out is to unlock the value of the subsidiary than when the
parent does not report this motive, and this difference is statistically significant at the 1% level.
We also find that the probability of acquisition at any given time is higher for the carve-outs with
post-IPO parent ownership above fifty percent than that for the carve-outs with post-IPO
ownership below fifty percent, and this difference is also statistically significant at the 1% level.
Furthermore, the probability of acquisition is consistently higher for ECOs with a product-
market relationship with the parent than for ECOs without such product-market relationship with
the parent, and this difference is statistically significant at the 5% level. We find that firms
operating in a hi-tech industry have a higher estimated probability of acquisition. However, this
last result is not statistically significant, though it is close with a p-value of 10.3%. Finally, we
also observe that the probability of acquisition is lower when the parent’s motive is to restructure
the operations than that when the parent’s motive is other than to restructure the operations; the
difference of these two failure functions is significant at the 5% level. The actual failure function
plots and statistical test values are in Desai et al. (2011).
4.3.2. Semi-parametric analysis
We perform a semi-parametric technique using the Cox Proportional Hazard model. This
assumes that the baseline hazard, or the inherent risk of acquisition in the absence of all control
variables, is the same for each ECO.
[Insert Table 5 about here]
28
In Model 1 of Table 5, we use variables which have a significant effect on the K-M
failure function estimates as discussed in Section 4.3.1. Mathematically, it is
ℎ𝑖(𝑡) = ℎ0(𝑡) × 𝑒𝑥𝑝[𝐴1 × (𝑈𝑛𝑙𝑜𝑐𝑘𝑖𝑛𝑔𝑖) + 𝐴2 × (𝑅𝑒𝑠𝑡𝑟𝑢𝑐𝑡𝑢𝑟𝑖𝑛𝑔𝑖) + 𝐴3
× (𝑃𝑎𝑟𝑒𝑛𝑡 𝑂𝑤𝑛 ≥ 50%𝑖) + 𝐴4 × (𝑃𝑟𝑜𝑑𝑢𝑐𝑡 𝑀𝑎𝑟𝑘𝑒𝑡𝑖)]
(2)
where, hi(t) is the hazard of acquisition for a given carve-out i at time t and h0(t) is the
baseline hazard function. We define the log of the relative hazard (LRH) as the natural logarithm
of the ratio of hi(t) to h0(t). That is,
𝐿𝑅𝐻 = 𝐴1 × (𝑈𝑛𝑙𝑜𝑐𝑘𝑖𝑛𝑔𝑖) + 𝐴2 × (𝑅𝑒𝑠𝑡𝑟𝑢𝑐𝑡𝑢𝑟𝑖𝑛𝑔𝑖) + 𝐴3 × (𝑃𝑎𝑟𝑒𝑛𝑡 𝑂𝑤𝑛 ≥ 50%𝑖)
+ 𝐴4 × (𝑃𝑟𝑜𝑑𝑢𝑐𝑡 𝑀𝑎𝑟𝑘𝑒𝑡𝑖)
(3)
The results of Model 1 indicate that the hazard (risk) of acquisition increases when (a) the
parent’s motive is to unlock the value; (b) the post-IPO parent ownership is above 50%; and (c)
the parent and the carve-out are tied through a product-market business agreement. The hazard of
acquisition decreases when the parent’s reason for conducting a carve-out is to restructure its
own and the subsidiary’s operations. First, the coefficient of 0.708 on Unlocking indicates that
the estimated hazard ratio of the groups based on the dummy Unlocking is 2.03.25 Therefore, the
hazard of acquisition for the carve-outs which are undertaken by the parent with a motive of
unlocking the value is 2.03 times higher than that of carve-outs where the parent undertakes the
carve-out transaction for reasons other than to unlock the value, and the difference between these
two hazard rates is significant at the 1% level (t-value: 3.11). This result supports the validity of
our hypothesis H1.
Second, the coefficient of 0.441 on Parent Own ≥ 50% shows that the risk of acquisition
for a carve-out with a majority ownership by the parent is 1.55 times higher than that for a carve-
25 More precisely, it is 𝑒0.708 = 2.0299.
29
out with less than majority ownership by the parent. This difference in hazard rates is significant
at the 10% level (t-value: 1.95). We also find that the hazard of acquisition for a carve-out
having a product-market relationship with the parent firm is higher than that for a carve-out
without such a relation, albeit the difference is significant at the 10% level. These findings
support our hypothesis H2.
Finally, the coefficient of -0.675 on the dummy Restructuring indicates that the risk of
acquisition for a carve-out in which the parent’s motive is to restructure the operations is 0.51
times that of the carve-outs in which the parent’s motive is other than the restructuring. It is
likely that when the parent with a restructuring motive consummates the equity carve-out
transaction, their main purpose is to achieve the benefits of divestitures (Hulburt et al., 2002;
Vijh, 2002) and not to prepare the carve-out for acquisition.
In Model 2, we exclude variables related to the parent ownership and include variables
measuring the ongoing financial relationship between the parent and the carved-out subsidiary,
industry relatedness, and size related controls in our Model 1. In Model 3, we modify Model 1 by
using a continuous variable reflecting the change in parent ownership before and after the IPO of
the carve-out (∆Parent Own). The coefficient of -0.853 suggests that when the parent sells an
additional percentage point of shares of subsidiaries in the IPO (i.e., the parent reduces its
ownership in the subsidiary by an additional percentage point), the hazard of the carve-out
acquisition decreases by 0.85%.26 This finding supports our hypothesis H2.
26 More precisely, refer to footnote 21, let the change in ∆Parent Own is equal to 0.01. Based on our Model 3,
𝜕(𝐿𝑅𝐻)𝜕(∆𝑃𝑎𝑟𝑒𝑛𝑡 𝑂𝑤𝑛)
= −0.853. Since the baseline hazard h0(t) remains constant, after some minor algebra we find that ℎ2(𝑡)ℎ1(𝑡)
= 𝑒𝑥𝑝(0.01 × −0.853) = 0.9915, where h2(t) and h1(t) are the hazard rates for the second and the first cases, respectively.
30
In Models 4 to 8, we add our proxies for the anti-takeover provisions, the industry
structure of the carve-outs, and other controlling factors. As shown in Model 7, at first look it
seems that the post-IPO blockholder ownership increases the hazard of acquisition. However,
when we exclude the parent ownership, the blockholder ownership loses its significance. For this
reason, we show it for only one of our specifications. As shown in Models 6 and 8, the carve-
outs with a higher percentage of inside directors tend to survive longer. Intuitively, inside
directors are those who never worked for the parent firms before. While going over the proxy
statements of these firms, we observe that these inside directors are the entrepreneurs who have
worked in the carve-out firm from its inception. At some point in the life of the carve-out, the
parent firm took over the carve-out and made it a wholly-owned subsidiary. If the carve-out
board is dominated with such founding executives as directors, it is likely that the carve-out will
survive longer in the market since the inside directors’ prime objective is likely to grow the
carve-out and not to prepare it for an acquisition. Finally, although we do not find any
statistically significant impact of our chosen anti-takeover provisions on the hazard of ECO
acquisition, the signs of their coefficients are worth mentioning. As shown in Models 5 and 8,
the coefficient of Dual Class is positive, which suggests that the presence of this anti-takeover
provision in a carve-out increases the hazard of its acquisition. As explained earlier, this positive
sign may be due to the significant voting ownership of the parent firm in a carve-out with dual
class shares. The coefficient of Staggered is negative but statistically insignificant, which to
some extent supports our hypothesis H3.
For all our specifications, we perform a global test to check the proportionality
assumption as suggested in Cleves et al. (2004). An unreported 𝜒2 statistic suggests that in all
31
our models we fail to reject the null hypothesis that the log of the proportional hazard is constant
over time, suggesting that our models are well-specified.
Overall, the results of the Cox proportional hazard analysis suggest that the time-to-
acquisition has a positive relation with the parent motive to unlock the value, majority ownership
by the parent in the post-IPO carve-out, and the ongoing product-market association between the
parent and the ECO. These results support our hypotheses H1 and H2. Also, the time-to-
acquisition has an inverse relationship with the parent motive to restructure the operations.
4.4. Analysis on parent-reacquisition versus third-party acquisition
4.4.1. Multinomial analysis on post-IPO carve-out status
To assess whether our chosen factors have a different impact on the probability of re-
acquisition, third-party acquisition, or failure of a carve-out compared to the survived one, we
perform the multinomial logit analysis and report the findings in Table 6. The base category for
this analysis is those carve-outs which survived within the five years of their IPOs. For brevity,
we report results of only three specifications: Models 1, 2, and 3 of Table 6 are the same as
Models 1, 2, and 5 of Table 4, respectively. Models 2 and 3 of Table 6 include variables Log
(Offer Size) and Log (Size Ratio), and Model 3 includes Parent Directors, Parent on Audit,
Parent CEO, Blockholder Own ≥ 5%, Insider Own ≥ 1%, Inside Directors, and Log (Board
Size). We do not report their coefficients due to their statistical insignificance.
[Insert Table 6 about here]
As shown in Model 1, compared to the likelihood of an ECO’s survival in the market, the
likelihood of its re-acquisition increases when the parent’s motive is to unlock the value of the
subsidiary and when the parent sells fewer shares of the ECO during the IPO. The coefficients of
32
1.420 on Unlocking suggests that when the reason for undertaking a carve-out is to unlock the
value of the subsidiary, the odds of that carve-out to get re-acquired versus to be alive in the
market (base category) increase by 4.14; this increase is significant at the 5% level (z-value:
2.50). We also find some evidence that the parent’s motive to unlock subsidiary value increases
the probability of third-party acquisitions versus the base category as shown in Models 2 and 3.
These findings support our conjecture based on the insight of Perotti and Rossetto (2007). An
equity carve-out helps the parent ascertain its synergy with the subsidiary. Depending on positive
or negative value of the synergy, the parent takes the decision to re-acquire or to sell-off the
remaining portion to a third-party. Therefore, the probability of re-acquisition as well as that of
third-party acquisition increases when the parent’s motive is to unlock the value of the
subsidiary.
Regarding the impact of post-IPO parental control on the status of the carve-out, we find
evidence that post-IPO parent ownership and ongoing business connection between the parent
and the subsidiary have a positive impact on the probability of re-acquisition. As shown in
Model 3, the statistical significance of the coefficient on Parent Own ≥ 50% indicates that the
probability of the parent re-acquiring the ECO versus the ECO surviving independently in the
market significantly increases when the parent retains majority ownership in the post-IPO carve-
out; the coefficient on Parent Own ≥ 50% is insignificant when we compare the third-party
acquisition versus the base (survived) category or the failed ECO category versus the base
category. This result supports the findings of Klein et al. (1991).27 Finally, as shown in Model 2,
the coefficient of 1.368 on the dummy variable Product Market suggests that the odds of a parent
re-acquiring the carved-out subsidiary over the carve-out maintaining status as an independent 27 In their sample of 52 equity carve-outs, Klein et al. (1991) find that 25 firms have the parent retained ownership above 80%. Of these 25 carve-outs, 17 were subsequently re-acquired by the parent firm.
33
identity in the market increase by 3.93, when the parent and the carved-out subsidiary have an
ongoing product-market relationship and this increase is statistically significant at the 5% level.
Overall, our results of the multinomial logit analysis show that the probability of re-
acquisition over the ECO remaining alive in the market increases when the parent’s motive is to
unlock the value, when the parent retains majority ownership in the post-IPO carve-out, and
when the parent and carved-out subsidiary have an ongoing product-market relationship.
4.4.2. Time-to-acquisition for re-acquisition and third-party acquisition
We also perform the hazard analysis on the subsamples of re-acquisitions and third-party
acquisitions and report the results in Table 7. The specifications for this analysis are the same as
those for Models 1 to 4 of Table 5.
[Insert Table 7 about here]
As shown in Table 7, the hazard of re-acquisition and third-party acquisition increase
when the parent’s motive is to unlock the value of the subsidiary. These findings further support
our conjecture based on Perotti and Rossetto’s (2007) model. When the parent undertakes a
carve-out to unlock the value of a subsidiary, the acquisition of the subsidiary is imminent, either
by the parent or by a third-party. We also find statistically significant positive impacts of parent
ownership and its product-market relationship with the subsidiary on the hazard of a carve-out in
the case of re-acquisitions. We, however, do not find a statistically significant impact of these
two variables in the case of third-party acquisitions.
The differences in coefficients’ signs on Financing for re-acquisitions and for third-party
acquisitions are noteworthy. We find that when the parent consummates a carve-out transaction
for financing related purposes, the hazard of re-acquisition is lower than that when the parent
34
undertakes a carve-out for purposes other than financing and this difference is statistically
significant; however, the hazard of a third-party acquisition is actually higher, albeit the
difference is statistically insignificant. A possible explanation for this is that when the parent
undertakes a carve-out to finance the operations, it views the subsidiary mainly for a means of
financing rather than for the synergistic gains. Therefore, the parent is less likely to be interested
in re-acquiring the subsidiary and more likely to be interested in selling the remaining portion of
the ECO to a third-party in the future. Overall, to a large extent, the results of the hazard analysis
on the subsamples of re-acquisitions and third-party acquisitions support our earlier results of
multinomial analysis on the post-IPO carve-out status.
4.5. Acquisition premium
As shown earlier in Table 3, the mean and median time-to-acquisition of acquired carve-
outs is approximately five years from their IPO dates. If our objective is to determine ex-post the
impact of our chosen variables at the time of the IPO on the level of the acquisition premium,
then we need to consider the carve-outs that are acquired closer to their IPO dates. Therefore, for
the purpose of analysis in this subsection, we focus only on those carve-outs that are acquired
within five years of their IPO dates. In addition, for brevity, we report results using Acquisition
Premium_42 as a measure of the level of premium.28
4.5.1. Univariate analysis
In Table 8, we report the results of a univariate analysis comparing the mean and median
acquisition premium for the groups based on selected dummy variables for the sample of carve-
28 We find qualitatively similar results when we use Acquisition Premium_Returns and Acquisition Premium_06.
35
outs acquired within five years of an IPO (N=77).29 The mean and median acquisition premium
for the carve-outs with dual class voting shares (N=16) are 13.6% and 7% respectively, whereas
the same statistics are 55.3% and 49.1% for carve-outs with one class of voting shares (N=61).
The differences are statistically significant at the 1% level with t and z values of 2.65 and 3.18,
respectively. These results, at a first glance, suggest that the anti-takeover provisions in a carve-
out seem to reduce its acquisition premium. However, as mentioned earlier, the effect of dual
class shares might be actually the effect of parent ownership since the parent can use dual class
of shares to retain a large percentage of voting rights in a carve-out.
[Insert Table 8 about here]
We find that the parent ownership in a carve-out prior to the merger is likely to impact
the level of acquisition premium. For example, the mean and median acquisition premium for the
group of carve-outs in which the parent ownership prior to the acquisition is above 50% (N=48)
are 34% and 29.4%, respectively. The same statistics for the other group of carve-outs with
parent ownership below 50% prior to the merger (N=27) are 68.6% and 44.1%, respectively. The
differences of mean and median acquisition premium for these two groups are statistically
significant at the 5% level. The mean and median acquisition premium for the group of carve-
outs which are acquired by a third-party (N=45) are 58.4% and 44.1%, respectively.
Interestingly, the mean and median acquisition premium for carve-outs which are re-acquired by
the parent firms (N=32) are 30% and 26.6%, respectively. The differences of acquisition
premium between third-party acquisition and the parent re-acquisition are statistically
significant. These results, at first glance, indicate the possibility of self-dealing by the parent.
Considering the small sample size and the previous finding that the acquisition premium is lower 29 The results of univariate analysis for the total sample of acquired carve-outs (N=137) are similar to those reported here for the sample of acquired carve-outs within five years of IPO; they are available in Desai et al. (2011).
36
when the parent owns majority ownership in a carve-out prior to its merger, we need to test this
claim in a multivariate setting before forming a conclusion.
4.5.2. Multivariate analysis
In this subsection, we report the results of an ordinary least squares (OLS) analysis
assessing the impact of our chosen independent variables on the level of acquisition premium on
a subsample of carve-outs which are acquired within five years of their IPOs. Our primary
specification (Model 1) is
𝐴𝑐𝑞𝑢𝑖𝑠𝑖𝑡𝑖𝑜𝑛 𝑃𝑟𝑒𝑚𝑖𝑢𝑚_42𝑖
= B0 + B1 × 𝑈𝑛𝑙𝑜𝑐𝑘𝑖𝑛𝑔𝑖 + B2 × 𝑅𝑒𝑎𝑐𝑞𝑢𝑖𝑠𝑖𝑡𝑖𝑜𝑛𝑖+B3
× 𝑃𝑟𝑒 − 𝐴𝑐𝑞 𝑃𝑎𝑟𝑒𝑛𝑡 𝑂𝑤𝑛 ≥ 50%𝑖 + 𝜀𝑖
(4)
[Insert Table 9 about here]
As shown in Model 1 of Table 9, the coefficient of 0.256 on Unlocking indicates that the
level of acquisition premium when the parent’s motive is to unlock the value of a subsidiary is
25.6% higher than the premium paid when the parent’s motive is other than to unlock the value
of a subsidiary; the difference is significant at the 10% level (t-value: 1.93). The coefficient of -
0.278 on Pre-Acq Parent Own ≥ 50% suggests that carve-outs with majority parent ownership
prior to the merger earn a lower acquisition premium to the magnitude of 27.8% than those
carve-outs in which the parent firms do not have majority ownership prior to the merger. This
difference is statistically significant at the 10% level (t-value: 1.70). The coefficient of -0.191 on
Reacquisition indicates that the level of acquisition premium when the parent re-acquires the
carved-out subsidiary is 19.1% lower than that when a third-party acquires the carve-out;
37
however the difference is statistically insignificant. In Model 2, we include variables pertaining
to financing and restructuring motive of the parent in conducting a carve-out, ongoing business
relationship, and industry relatedness. We find results similar to those of Model 1.
In Models 3 to 6, we add various controls to assess the robustness of our primary
specification. In Model 4, we include the ratio of target and bidder size as one of the controls and
find it has a negative relation with the level of acquisition premium. Since there are several non-
public acquirers in our sample, our sample size in Model 4 is only 52. In addition, we initially
find the impact of our proxy for the carve-out’s market performance (Performance) to be
significant on the level of acquisition premium. However, after performing a test identifying
influential observations, we find that two observations are dominant in increasing the t-value.
When we exclude those two observations, we find the impact of Performance to be insignificant.
Therefore, in all our analyses we Winsorize the values of Performance at the one percentile
upper level. We do not find consistency in the coefficient sign for our proxy for anti-takeover
provision – Staggered. Also, it is statistically insignificant, which suggests that in our sample, we
do not find an impact of staggered board on the level of acquisition premium. In addition, as
shown in Model 6, the effect of having dual class shares on the level of acquisition premium is
statistically insignificant.
Overall, the results of OLS on the acquisition premium suggest that the acquisition
premium is related to whether the parent has above majority ownership prior to the merger, and
whether the parent consummates a carve-out transaction to unlock the value. In all the
regressions, we find that in the case of a re-acquisition the estimated acquisition premium is
lower than that in the case of a third-party acquisition, but the difference between the two is not
38
statistically significant. We are therefore unable to claim that we have evidence of minority
shareholders’ wealth expropriation.
In Table 10, we report the results of OLS analyses where we assess the impact of ECO
characteristics on acquisition premium for subsamples of parent re-acquired carve-outs and third-
party acquired carve-outs. We use the same specifications as those of Table 9, except the
variable Restructuring is excluded due to limited sample size. For brevity, we only report results
of Models 1 to 3 of Table 9 in Table 10.
[Insert Table 10 about here]
As shown in Models 1 and 4 of Table 10, the impact of Unlocking on the level of
acquisition premium is the same in both subsamples, except that in the case of re-acquisition the
impact is statistically significant at the 10% level. This finding suggests that it is likely that the
parent is willing to pay a higher premium if its synergy with the carved-out subsidiary is
positive. Similarly, when the parent sells off its remaining portion in a carve-out to a third-party,
it negotiates a higher premium because the third-party may have positive synergy with the ECO.
The coefficients on Pre-Acq Parent Own ≥ 50% of Models 1 and 4 are worth mentioning. In the
case of re-acquisitions, whether the parent owns above majority or below majority ownership in
the ECO before the acquisition, the difference in the level of acquisition premium is
approximately 6%, and this difference is not statistically significant. However, in the case of
third-party acquisitions, when the parent owns above majority ownership in the carve-out the
level of acquisition premium is approximately 33% lower than that of the case when the parent
has less than majority ownership in the ECO prior to merger. This difference is statistically
significant at the 10% level. This result seems to contradict the hypothesis that parent firms
expropriate wealth from minority shareholders of carve-outs. We also find that the re-
39
acquisitions funded through cash transactions have a higher level of premium than those funded
through transactions other than cash.
5. Conclusion
Mergers, acquisitions, and divestitures have been a research topic within the corporate
restructuring literature for many decades. Equity carve-outs are a unique form of restructuring
due to their transient nature. After a few years of their existence, carve-outs usually are either
dissolved back into the parent firm or acquired by a third-party. The difficulty of collecting data
and the difficulty of distinguishing between the multitude of reasons corporations conduct carve-
outs have been an impediment to understanding carve-outs. In this study we endeavor to advance
the knowledge of ECOs by manually collecting a large set of ECO data and performing various
sets of empirical analyses on the likelihood of acquisition and the level of acquisition premium.
We find that certain variables are reliable for predicting the likelihood of ECO’s
acquisition in the market. Carve-outs are acquired more rapidly when the parent’s motivation for
conducting a carve-out transaction is to unlock the value of the subsidiary, when the parent
retains a majority ownership, and when the parent establishes a long term business relationship
with the subsidiary. Additionally, we find that there are also reliable predictors of the acquisition
premium paid for carve-outs. Acquisition premiums are lower when the parent firms retain
majority ownership interests. Overall, our research helps extend knowledge on the acquisition of
equity carve-outs.
40
References Allen, J.W., McConnell, J.J., 1998. Equity carve-outs and managerial discretion. The Journal of
Finance 53, 163-186.
Ambrose, B.W., Megginson, W.L., 1992. The role of asset structure, ownership structure, and takeover defenses in determining acquisition likelihood. Journal of Financial and Quantitative Analysis 27, 575-589.
Atanasov, V., Boone, A., Haushalter, D., 2010. Is there shareholder expropriation in the United States? An analysis of publicly traded subsidiaries. Journal of Financial and Quantitative Analysis 45, 1-26.
Benou, G., Madura, J., Ngo, T., 2008. Wealth creation from high-tech divestitures. The Quarterly Review of Economics and Finance 48, 505-519.
Boone, A., 2003. The interaction of ownership, governance, and product markets: Evidence from equity carve-outs. Working paper, University of Kansas.
Chemmanur, T.J., Jordan, B.D., Liu, M.H., Wu, Q., 2010. Antitakeover provisions in corporate spin-offs. Journal of Banking and Finance 34, 813-824.
Chemmanur, T.J., Liu, M.H., 2011. Institutional trading, information production, and the choice between spin-offs, carve-outs, and tracking stock issues. Journal of Corporate Finance 17, 62-82.
Cleves, M.A., Gould, W.W., Gutierrez, R.G., 2004. An Introduction to Survival Analysis Using Stata. A Stata Press Publication, College Station, TX.
Desai, C.A., Klock, M., Mansi, S., 2011. On the Acquisition of Equity Carve-Outs, Available at http://ssrn.com/abstract=1829217.
Eckbo, B.E., Thorburn, K.S., 2008. Corporate restructuring: Breakups and LBOs. In: Eckbo, B.E. (Ed.), Handbook of Empirical Corporate Finance, Vol. 2. North-Holland: Amsterdam.
Field, L.C., Karpoff, J.M., 2002. Takeover defenses of IPO firms. The Journal of Finance 57, 1857-1889.
Gompers, P., Ishii, J., Metrick, A., 2003. Corporate governance and equity prices. The Quarterly Journal of Economics 118, 107-155.
Grossman, S.J., Hart, O.D., 1980. Takeover bids, the free-rider problem, and the theory of the corporation. The Bell Journal of Economics 11, 42-64.
Grossman, S.J., Hart, O.D., 1986. The costs and benefits of ownership: A theory of vertical and lateral integration. The Journal of Political Economy 94, 691-719.
Hart, O., Moore, J., 1990. Property rights and the nature of the firm. The Journal of Political Economy 98, 1119-1158.
Hogan, K.M., Olson, G.T., 2004. The pricing of equity carve-outs during the 1990s. The Journal of Financial Research 27, 521-537.
Hulburt, H.M., 2003. Equity carve-outs and changes in corporate control. Journal of Applied Business Research 19, 29-43.
41
Hulburt, H.M., Miles, J.A., Woolridge, J.R., 2002. Value creation from equity carve-outs. Financial Management 31, 83-100.
Kahle, K.M., Walkling, R.A., 1996. The impact of industry classifications on financial research. Journal of Financial and Quantitative Analysis 31, 309-335.
Klein, A., Rosenfeld, J., Beranek, W., 1991. The two stages of an equity carve-out and the price response of parent and subsidiary stock. Managerial and Decision Economics 12, 449-460.
Kohers, N., Kohers, T., 2000. The value creation potential of high-tech mergers. Financial Analysts Journal 56, 40-50.
Megginson, W.L., 1990. Restricted voting stock, acquisition premiums, and the market value of corporate control. Financial Review 25, 175-198.
Michaely, R., Shaw, W.H., 1995. The choice of going public: Spin-offs vs. carve-outs. Financial Management 24, 5-21.
Moeller, T., 2005. Let's make a deal! How shareholder control impacts merger payoffs. Journal of Financial Economics 76, 167-190.
Nanda, V., Narayanan, M.P., 1999. Disentangling value: Financing needs, firm scope, and divestitures. Journal of Financial Intermediation 8, 174-204.
Otsubo, M., 2009. Gains from equity carve-outs and subsequent events. Journal of Business Research 62, 1207-1213.
Perotti, E., Rossetto, S., 2007. Unlocking value: Equity carve outs as strategic real options. Journal of Corporate Finance 13, 771-792.
Schipper, K., Smith, A., 1986. A comparison of equity carve-outs and seasoned equity offerings: share price effects and corporate restructuring. Journal of Financial Economics 15, 153-186.
Schwert, G.W., 1996. Markup pricing in mergers and acquisitions. Journal of Financial Economics 41, 153-192.
Slovin, M.B., Sushka, M.E., 1998. The economics of parent-subsidiary mergers: An empirical analysis. Journal of Financial Economics 49, 255-279.
Thompson, T.H., Apilado, V., 2006. Investment banker reputation and two-stage combination carve-outs and spin-offs. Journal of Banking and Finance 30, 85-110.
Vijh, A.M., 2002. The positive announcement-period returns of equity carveouts: Asymmetric information or divestiture gains? Journal of Business 75, 153-190.
Wruck, E.G., Wruck, K.H., 2002. Restructuring top management: evidence from corporate spinoffs. Journal of Labor Economics 20, S176-S218.
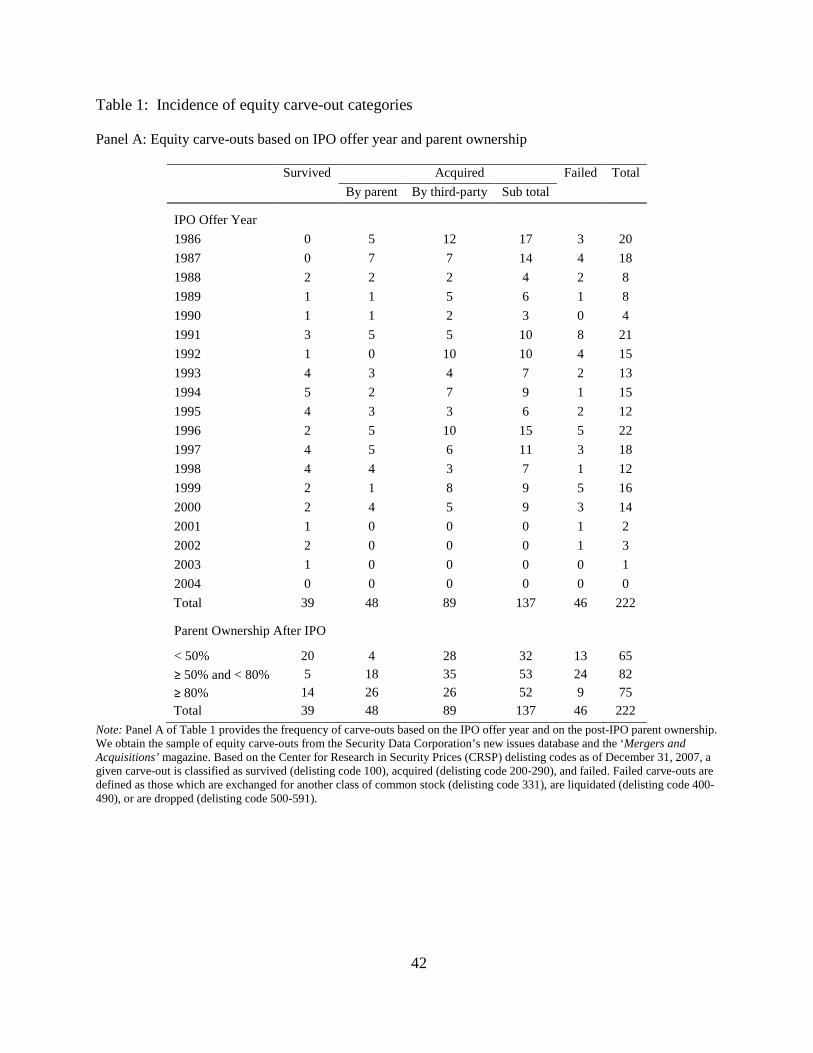
42
Table 1: Incidence of equity carve-out categories Panel A: Equity carve-outs based on IPO offer year and parent ownership
Survived Acquired Failed Total By parent By third-party Sub total IPO Offer Year
1986 0 5 12 17 3 20 1987 0 7 7 14 4 18 1988 2 2 2 4 2 8 1989 1 1 5 6 1 8 1990 1 1 2 3 0 4 1991 3 5 5 10 8 21 1992 1 0 10 10 4 15 1993 4 3 4 7 2 13 1994 5 2 7 9 1 15 1995 4 3 3 6 2 12 1996 2 5 10 15 5 22 1997 4 5 6 11 3 18 1998 4 4 3 7 1 12 1999 2 1 8 9 5 16 2000 2 4 5 9 3 14 2001 1 0 0 0 1 2 2002 2 0 0 0 1 3 2003 1 0 0 0 0 1 2004 0 0 0 0 0 0 Total 39 48 89 137 46 222
Parent Ownership After IPO
< 50% 20 4 28 32 13 65 ≥ 50% and < 80% 5 18 35 53 24 82 ≥ 80% 14 26 26 52 9 75 Total 39 48 89 137 46 222
Note: Panel A of Table 1 provides the frequency of carve-outs based on the IPO offer year and on the post-IPO parent ownership. We obtain the sample of equity carve-outs from the Security Data Corporation’s new issues database and the ‘Mergers and Acquisitions’ magazine. Based on the Center for Research in Security Prices (CRSP) delisting codes as of December 31, 2007, a given carve-out is classified as survived (delisting code 100), acquired (delisting code 200-290), and failed. Failed carve-outs are defined as those which are exchanged for another class of common stock (delisting code 331), are liquidated (delisting code 400-490), or are dropped (delisting code 500-591).
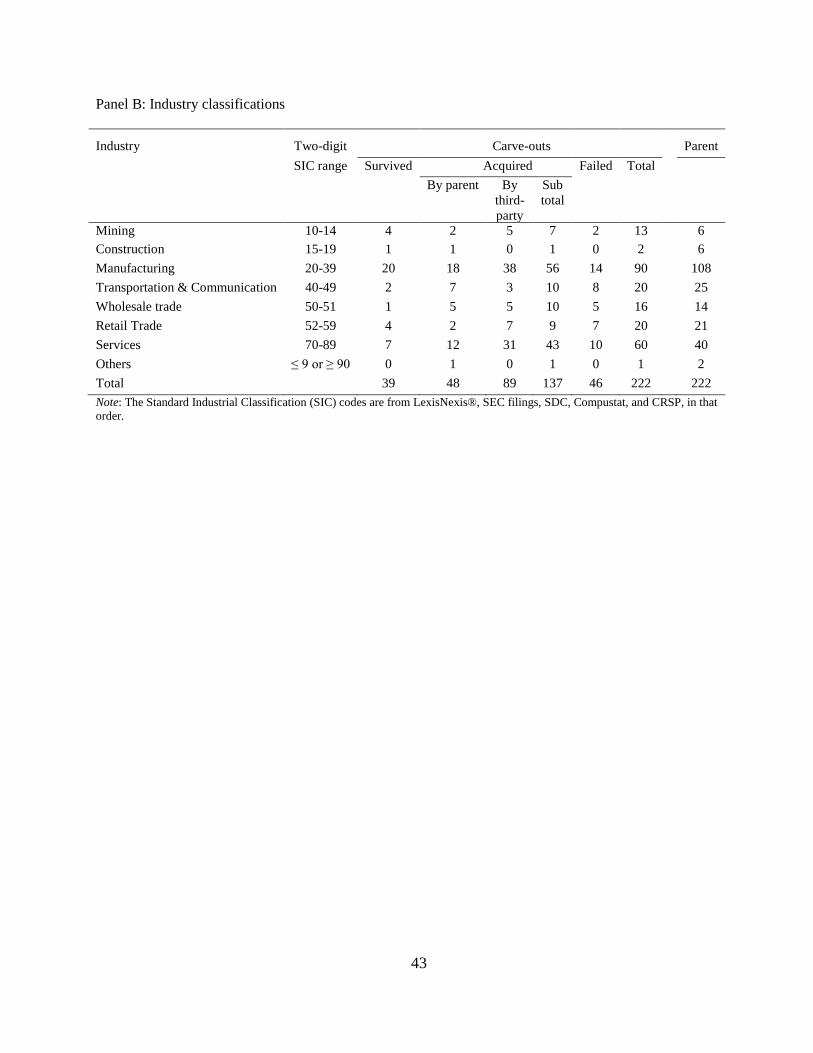
43
Panel B: Industry classifications
Industry Two-digit Carve-outs Parent
SIC range Survived Acquired Failed Total By parent By
third- party
Sub total
Mining 10-14 4 2 5 7 2 13 6 Construction 15-19 1 1 0 1 0 2 6 Manufacturing 20-39 20 18 38 56 14 90 108 Transportation & Communication 40-49 2 7 3 10 8 20 25 Wholesale trade 50-51 1 5 5 10 5 16 14 Retail Trade 52-59 4 2 7 9 7 20 21 Services 70-89 7 12 31 43 10 60 40 Others ≤ 9 or ≥ 90 0 1 0 1 0 1 2 Total 39 48 89 137 46 222 222 Note: The Standard Industrial Classification (SIC) codes are from LexisNexis®, SEC filings, SDC, Compustat, and CRSP, in that order.
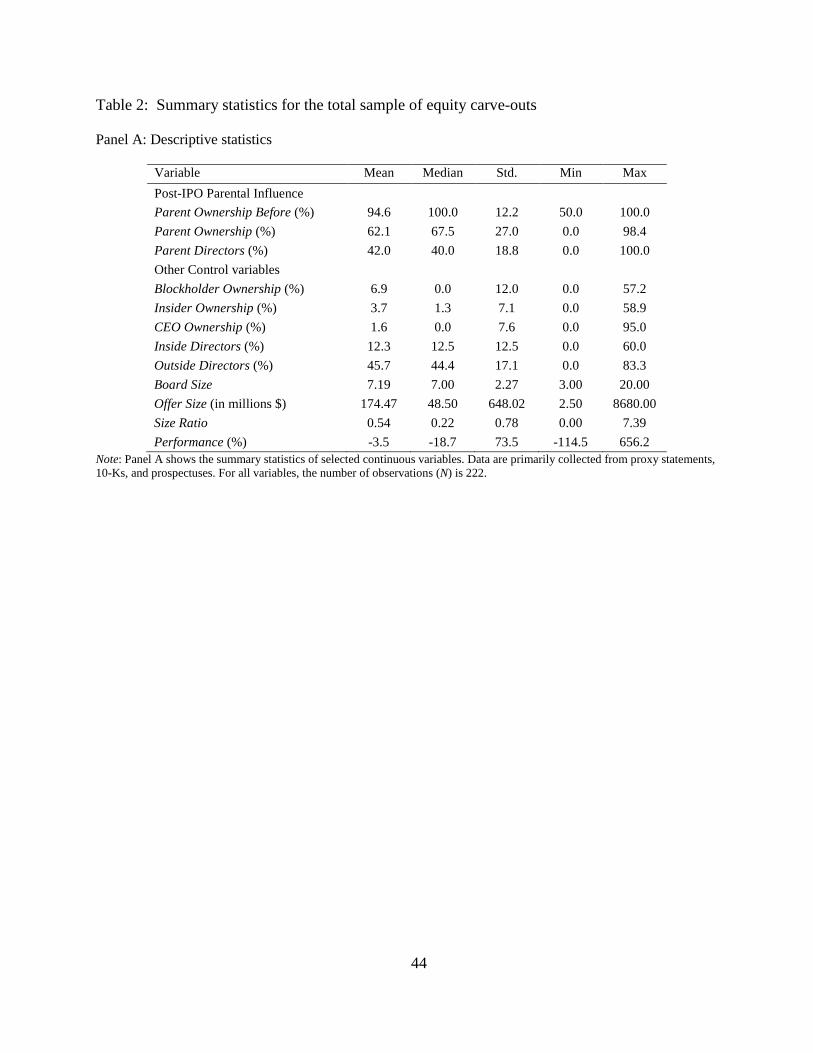
44
Table 2: Summary statistics for the total sample of equity carve-outs
Panel A: Descriptive statistics
Variable Mean Median Std.
Min Max Post-IPO Parental Influence Parent Ownership Before (%) 94.6 100.0 12.2 50.0 100.0 Parent Ownership (%) 62.1 67.5 27.0 0.0 98.4 Parent Directors (%) 42.0 40.0 18.8 0.0 100.0 Other Control variables Blockholder Ownership (%) 6.9 0.0 12.0 0.0 57.2 Insider Ownership (%) 3.7 1.3 7.1 0.0 58.9 CEO Ownership (%) 1.6 0.0 7.6 0.0 95.0 Inside Directors (%) 12.3 12.5 12.5 0.0 60.0 Outside Directors (%) 45.7 44.4 17.1 0.0 83.3 Board Size 7.19 7.00 2.27 3.00 20.00 Offer Size (in millions $) 174.47 48.50 648.02 2.50 8680.00 Size Ratio 0.54 0.22 0.78 0.00 7.39 Performance (%) -3.5 -18.7 73.5 -114.5 656.2
Note: Panel A shows the summary statistics of selected continuous variables. Data are primarily collected from proxy statements, 10-Ks, and prospectuses. For all variables, the number of observations (N) is 222.
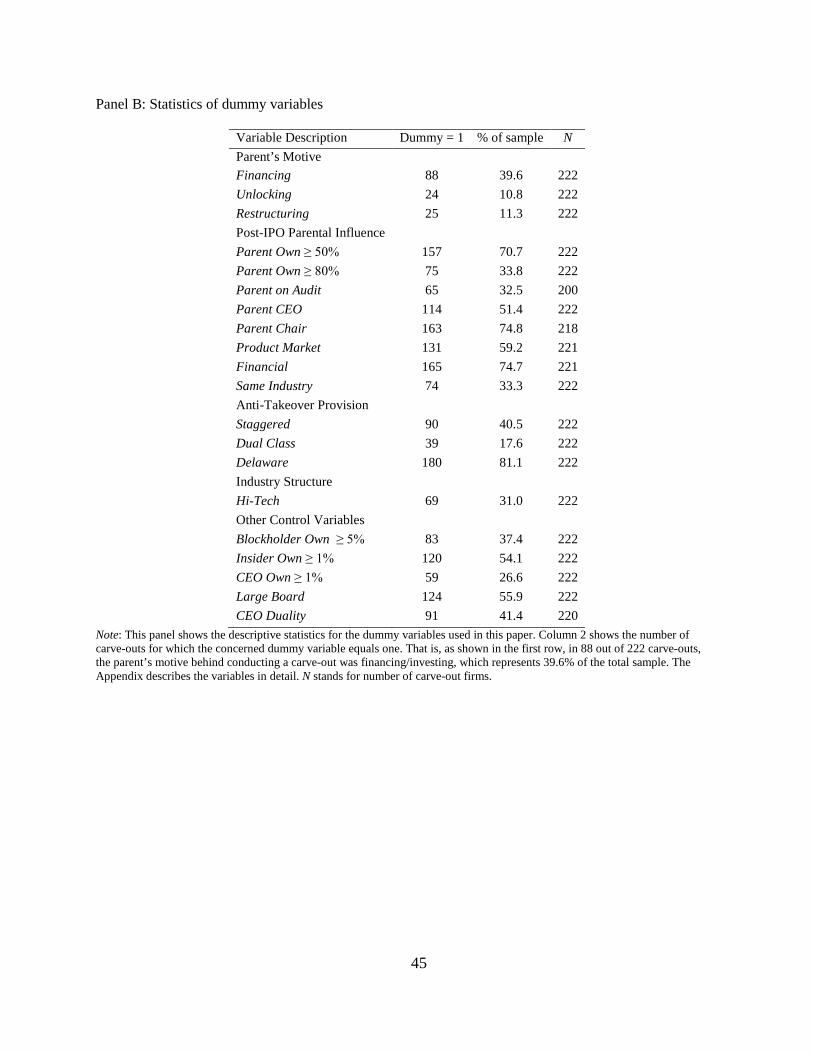
45
Panel B: Statistics of dummy variables
Variable Description Dummy = 1 % of sample N Parent’s Motive Financing 88 39.6 222 Unlocking 24 10.8 222 Restructuring 25 11.3 222 Post-IPO Parental Influence Parent Own ≥ 50% 157 70.7 222 Parent Own ≥ 80% 75 33.8 222 Parent on Audit 65 32.5 200 Parent CEO 114 51.4 222 Parent Chair 163 74.8 218 Product Market 131 59.2 221 Financial 165 74.7 221 Same Industry 74 33.3 222 Anti-Takeover Provision Staggered 90 40.5 222 Dual Class 39 17.6 222 Delaware 180 81.1 222 Industry Structure Hi-Tech 69 31.0 222 Other Control Variables Blockholder Own ≥ 5% 83 37.4 222 Insider Own ≥ 1% 120 54.1 222 CEO Own ≥ 1% 59 26.6 222 Large Board 124 55.9 222 CEO Duality 91 41.4 220
Note: This panel shows the descriptive statistics for the dummy variables used in this paper. Column 2 shows the number of carve-outs for which the concerned dummy variable equals one. That is, as shown in the first row, in 88 out of 222 carve-outs, the parent’s motive behind conducting a carve-out was financing/investing, which represents 39.6% of the total sample. The Appendix describes the variables in detail. N stands for number of carve-out firms.
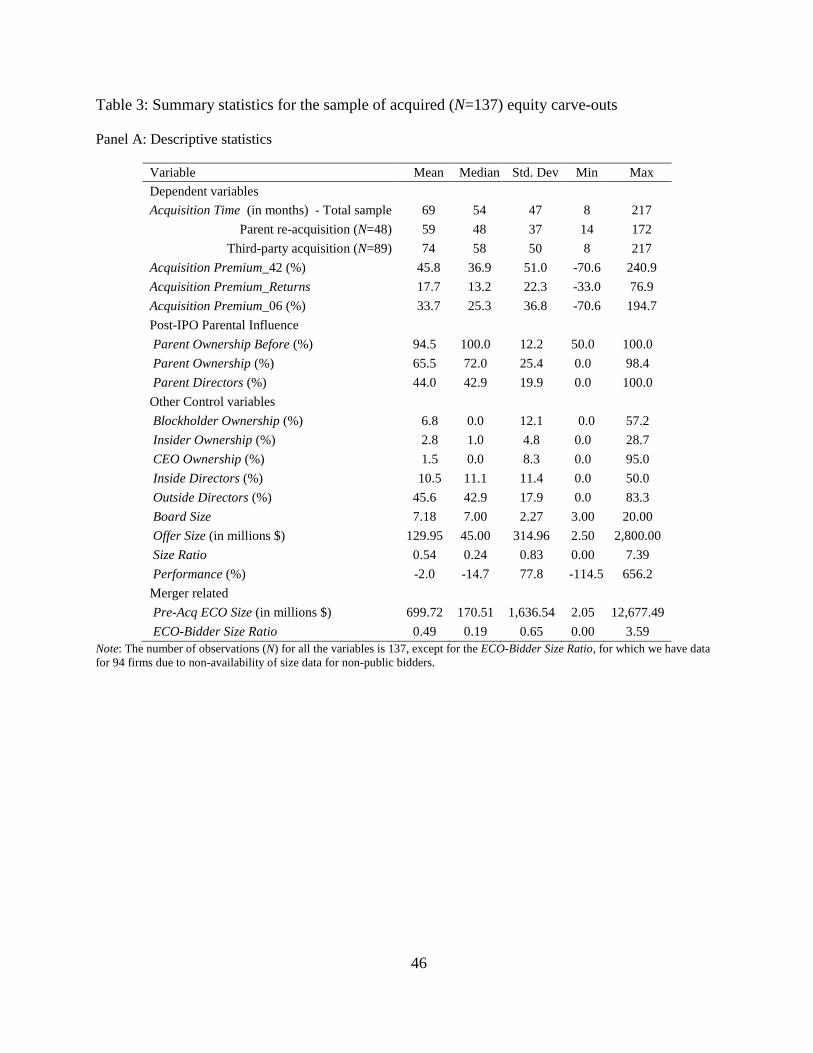
46
Table 3: Summary statistics for the sample of acquired (N=137) equity carve-outs Panel A: Descriptive statistics
Variable Mean Median Std. Dev Min Max Dependent variables Acquisition Time (in months) - Total sample 69 54 47 8 217
Parent re-acquisition (N=48) 59 48 37 14 172 Third-party acquisition (N=89) 74 58 50 8 217
Acquisition Premium_42 (%) 45.8 36.9 51.0 -70.6 240.9 Acquisition Premium_Returns 17.7 13.2 22.3 -33.0 76.9 Acquisition Premium_06 (%) 33.7 25.3 36.8 -70.6 194.7 Post-IPO Parental Influence Parent Ownership Before (%) 94.5 100.0 12.2 50.0 100.0 Parent Ownership (%) 65.5 72.0 25.4 0.0 98.4 Parent Directors (%) 44.0 42.9 19.9 0.0 100.0 Other Control variables Blockholder Ownership (%) 6.8 0.0 12.1 0.0 57.2 Insider Ownership (%) 2.8 1.0 4.8 0.0 28.7 CEO Ownership (%) 1.5 0.0 8.3 0.0 95.0 Inside Directors (%) 10.5 11.1 11.4 0.0 50.0 Outside Directors (%) 45.6 42.9 17.9 0.0 83.3 Board Size 7.18 7.00 2.27 3.00 20.00 Offer Size (in millions $) 129.95 45.00 314.96 2.50 2,800.00 Size Ratio 0.54 0.24 0.83 0.00 7.39 Performance (%) -2.0 -14.7 77.8 -114.5 656.2 Merger related Pre-Acq ECO Size (in millions $) 699.72 170.51 1,636.54 2.05 12,677.49 ECO-Bidder Size Ratio 0.49 0.19 0.65 0.00 3.59
Note: The number of observations (N) for all the variables is 137, except for the ECO-Bidder Size Ratio, for which we have data for 94 firms due to non-availability of size data for non-public bidders.
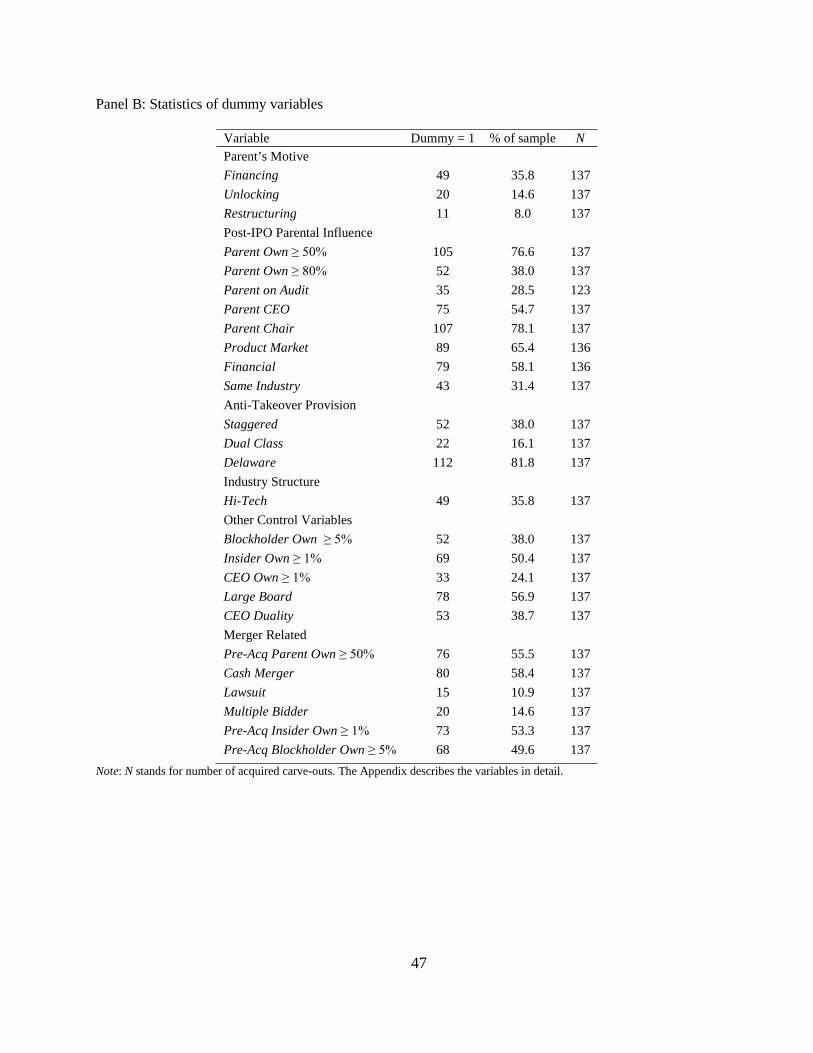
47
Panel B: Statistics of dummy variables
Variable Dummy = 1 % of sample N Parent’s Motive Financing 49 35.8 137 Unlocking 20 14.6 137 Restructuring 11 8.0 137 Post-IPO Parental Influence Parent Own ≥ 50% 105 76.6 137 Parent Own ≥ 80% 52 38.0 137 Parent on Audit 35 28.5 123 Parent CEO 75 54.7 137 Parent Chair 107 78.1 137 Product Market 89 65.4 136 Financial 79 58.1 136 Same Industry 43 31.4 137 Anti-Takeover Provision Staggered 52 38.0 137 Dual Class 22 16.1 137 Delaware 112 81.8 137 Industry Structure Hi-Tech 49 35.8 137 Other Control Variables Blockholder Own ≥ 5% 52 38.0 137 Insider Own ≥ 1% 69 50.4 137 CEO Own ≥ 1% 33 24.1 137 Large Board 78 56.9 137 CEO Duality 53 38.7 137 Merger Related Pre-Acq Parent Own ≥ 50% 76 55.5 137 Cash Merger 80 58.4 137 Lawsuit 15 10.9 137 Multiple Bidder 20 14.6 137 Pre-Acq Insider Own ≥ 1% 73 53.3 137 Pre-Acq Blockholder Own ≥ 5% 68 49.6 137
Note: N stands for number of acquired carve-outs. The Appendix describes the variables in detail.
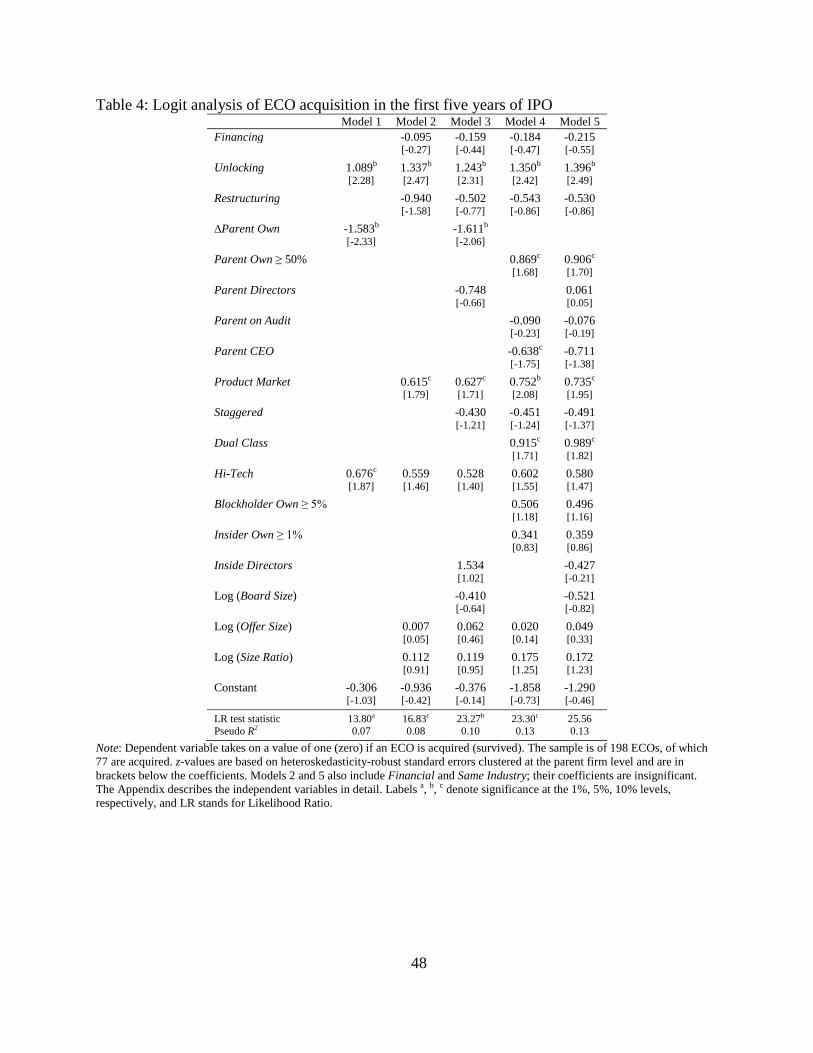
48
Table 4: Logit analysis of ECO acquisition in the first five years of IPO Model 1 Model 2 Model 3 Model 4 Model 5 Financing
-0.095 -0.159 -0.184 -0.215
[-0.27] [-0.44] [-0.47] [-0.55]
Unlocking 1.089b 1.337b 1.243b 1.350b 1.396b [2.28] [2.47] [2.31] [2.42] [2.49]
Restructuring
-0.940 -0.502 -0.543 -0.530 [-1.58] [-0.77] [-0.86] [-0.86]
∆Parent Own -1.583b
-1.611b [-2.33] [-2.06]
Parent Own ≥ 50%
0.869c 0.906c [1.68] [1.70]
Parent Directors
-0.748
0.061 [-0.66] [0.05]
Parent on Audit
-0.090 -0.076 [-0.23] [-0.19]
Parent CEO
-0.638c -0.711 [-1.75] [-1.38]
Product Market
0.615c 0.627c 0.752b 0.735c [1.79] [1.71] [2.08] [1.95]
Staggered
-0.430 -0.451 -0.491 [-1.21] [-1.24] [-1.37]
Dual Class
0.915c 0.989c [1.71] [1.82]
Hi-Tech 0.676c 0.559 0.528 0.602 0.580 [1.87] [1.46] [1.40] [1.55] [1.47]
Blockholder Own ≥ 5%
0.506 0.496 [1.18] [1.16]
Insider Own ≥ 1%
0.341 0.359 [0.83] [0.86]
Inside Directors
1.534
-0.427 [1.02] [-0.21]
Log (Board Size)
-0.410
-0.521 [-0.64] [-0.82]
Log (Offer Size)
0.007 0.062 0.020 0.049 [0.05] [0.46] [0.14] [0.33]
Log (Size Ratio)
0.112 0.119 0.175 0.172 [0.91] [0.95] [1.25] [1.23]
Constant -0.306 -0.936 -0.376 -1.858 -1.290 [-1.03] [-0.42] [-0.14] [-0.73] [-0.46]
LR test statistic 13.80a 16.83c 23.27b 23.30c 25.56 Pseudo R2 0.07 0.08 0.10 0.13 0.13
Note: Dependent variable takes on a value of one (zero) if an ECO is acquired (survived). The sample is of 198 ECOs, of which 77 are acquired. z-values are based on heteroskedasticity-robust standard errors clustered at the parent firm level and are in brackets below the coefficients. Models 2 and 5 also include Financial and Same Industry; their coefficients are insignificant. The Appendix describes the independent variables in detail. Labels a, b, c denote significance at the 1%, 5%, 10% levels, respectively, and LR stands for Likelihood Ratio.
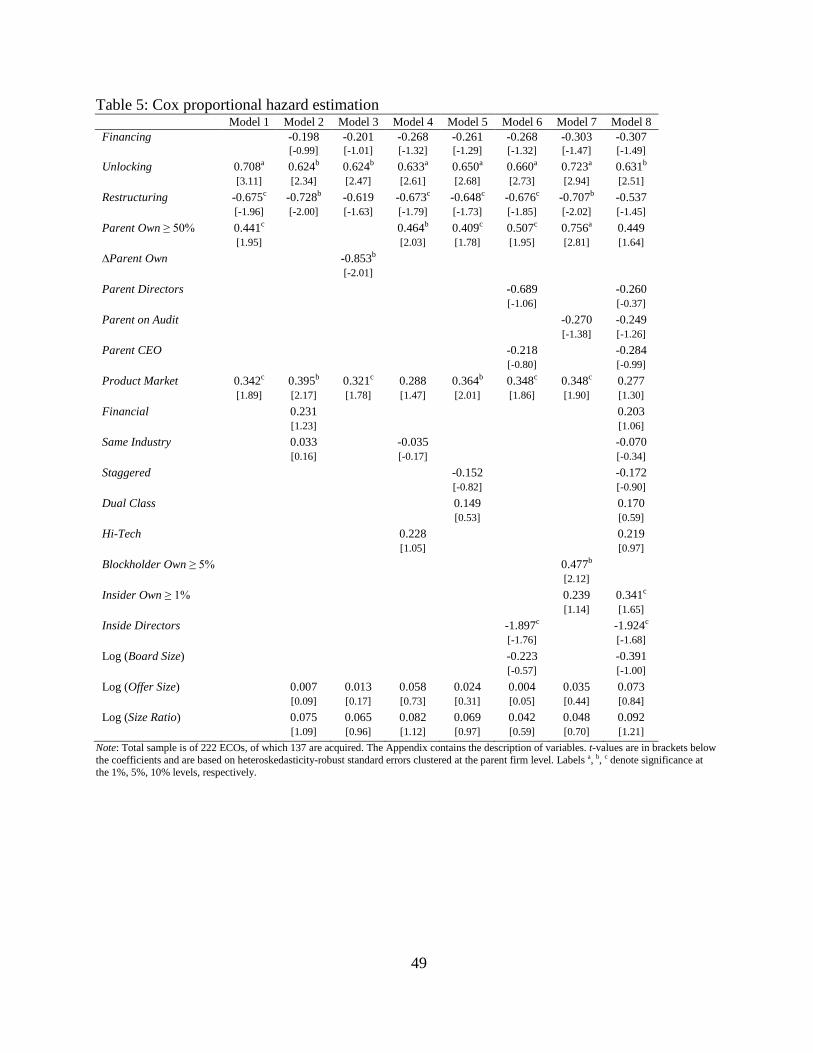
49
Table 5: Cox proportional hazard estimation Model 1 Model 2 Model 3 Model 4 Model 5 Model 6 Model 7 Model 8
Financing -0.198 -0.201 -0.268 -0.261 -0.268 -0.303 -0.307 [-0.99] [-1.01] [-1.32] [-1.29] [-1.32] [-1.47] [-1.49] Unlocking 0.708a 0.624b 0.624b 0.633a 0.650a 0.660a 0.723a 0.631b [3.11] [2.34] [2.47] [2.61] [2.68] [2.73] [2.94] [2.51] Restructuring -0.675c -0.728b -0.619 -0.673c -0.648c -0.676c -0.707b -0.537 [-1.96] [-2.00] [-1.63] [-1.79] [-1.73] [-1.85] [-2.02] [-1.45] Parent Own ≥ 50% 0.441c 0.464b 0.409c 0.507c 0.756a 0.449 [1.95] [2.03] [1.78] [1.95] [2.81] [1.64] ∆Parent Own -0.853b [-2.01] Parent Directors -0.689 -0.260 [-1.06] [-0.37] Parent on Audit -0.270 -0.249 [-1.38] [-1.26] Parent CEO -0.218 -0.284 [-0.80] [-0.99] Product Market 0.342c 0.395b 0.321c 0.288 0.364b 0.348c 0.348c 0.277 [1.89] [2.17] [1.78] [1.47] [2.01] [1.86] [1.90] [1.30] Financial 0.231 0.203 [1.23] [1.06] Same Industry 0.033 -0.035 -0.070 [0.16] [-0.17] [-0.34] Staggered -0.152 -0.172 [-0.82] [-0.90] Dual Class 0.149 0.170 [0.53] [0.59] Hi-Tech 0.228 0.219 [1.05] [0.97] Blockholder Own ≥ 5% 0.477b [2.12] Insider Own ≥ 1% 0.239 0.341c [1.14] [1.65] Inside Directors -1.897c -1.924c [-1.76] [-1.68] Log (Board Size) -0.223 -0.391 [-0.57] [-1.00] Log (Offer Size) 0.007 0.013 0.058 0.024 0.004 0.035 0.073 [0.09] [0.17] [0.73] [0.31] [0.05] [0.44] [0.84] Log (Size Ratio) 0.075 0.065 0.082 0.069 0.042 0.048 0.092 [1.09] [0.96] [1.12] [0.97] [0.59] [0.70] [1.21]
Note: Total sample is of 222 ECOs, of which 137 are acquired. The Appendix contains the description of variables. t-values are in brackets below the coefficients and are based on heteroskedasticity-robust standard errors clustered at the parent firm level. Labels a, b, c denote significance at the 1%, 5%, 10% levels, respectively.
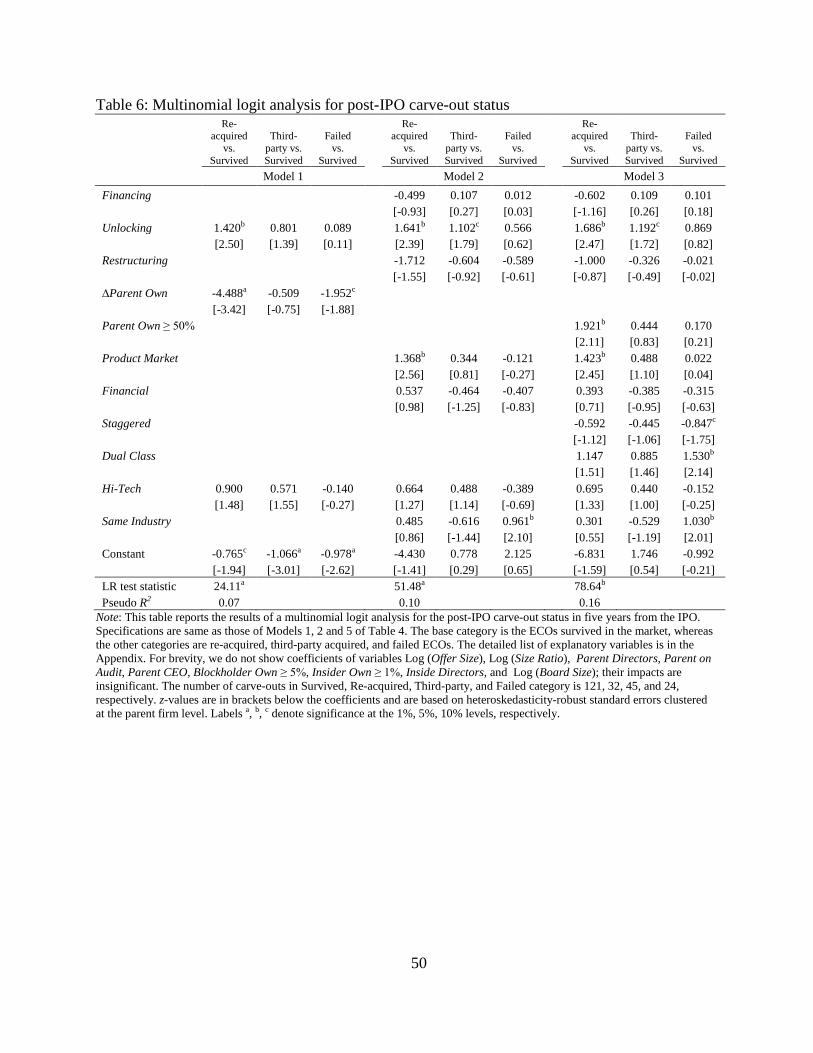
50
Table 6: Multinomial logit analysis for post-IPO carve-out status
Re-acquired
vs. Survived
Third-party vs. Survived
Failed vs.
Survived
Re-acquired
vs. Survived
Third-party vs. Survived
Failed vs.
Survived
Re-acquired
vs. Survived
Third-party vs. Survived
Failed vs.
Survived
Model 1 Model 2 Model 3 Financing
-0.499 0.107 0.012
-0.602 0.109 0.101
[-0.93] [0.27] [0.03]
[-1.16] [0.26] [0.18]
Unlocking 1.420b 0.801 0.089
1.641b 1.102c 0.566
1.686b 1.192c 0.869
[2.50] [1.39] [0.11]
[2.39] [1.79] [0.62]
[2.47] [1.72] [0.82]
Restructuring
-1.712 -0.604 -0.589
-1.000 -0.326 -0.021
[-1.55] [-0.92] [-0.61]
[-0.87] [-0.49] [-0.02]
∆Parent Own -4.488a -0.509 -1.952c
[-3.42] [-0.75] [-1.88]
Parent Own ≥ 50%
1.921b 0.444 0.170
[2.11] [0.83] [0.21]
Product Market
1.368b 0.344 -0.121
1.423b 0.488 0.022
[2.56] [0.81] [-0.27]
[2.45] [1.10] [0.04]
Financial
0.537 -0.464 -0.407
0.393 -0.385 -0.315
[0.98] [-1.25] [-0.83]
[0.71] [-0.95] [-0.63]
Staggered
-0.592 -0.445 -0.847c
[-1.12] [-1.06] [-1.75]
Dual Class
1.147 0.885 1.530b
[1.51] [1.46] [2.14]
Hi-Tech 0.900 0.571 -0.140
0.664 0.488 -0.389
0.695 0.440 -0.152
[1.48] [1.55] [-0.27]
[1.27] [1.14] [-0.69]
[1.33] [1.00] [-0.25]
Same Industry
0.485 -0.616 0.961b
0.301 -0.529 1.030b
[0.86] [-1.44] [2.10]
[0.55] [-1.19] [2.01]
Constant -0.765c -1.066a -0.978a
-4.430 0.778 2.125
-6.831 1.746 -0.992 [-1.94] [-3.01] [-2.62] [-1.41] [0.29] [0.65] [-1.59] [0.54] [-0.21] LR test statistic 24.11a 51.48a 78.64b Pseudo R2 0.07 0.10 0.16
Note: This table reports the results of a multinomial logit analysis for the post-IPO carve-out status in five years from the IPO. Specifications are same as those of Models 1, 2 and 5 of Table 4. The base category is the ECOs survived in the market, whereas the other categories are re-acquired, third-party acquired, and failed ECOs. The detailed list of explanatory variables is in the Appendix. For brevity, we do not show coefficients of variables Log (Offer Size), Log (Size Ratio), Parent Directors, Parent on Audit, Parent CEO, Blockholder Own ≥ 5%, Insider Own ≥ 1%, Inside Directors, and Log (Board Size); their impacts are insignificant. The number of carve-outs in Survived, Re-acquired, Third-party, and Failed category is 121, 32, 45, and 24, respectively. z-values are in brackets below the coefficients and are based on heteroskedasticity-robust standard errors clustered at the parent firm level. Labels a, b, c denote significance at the 1%, 5%, 10% levels, respectively.
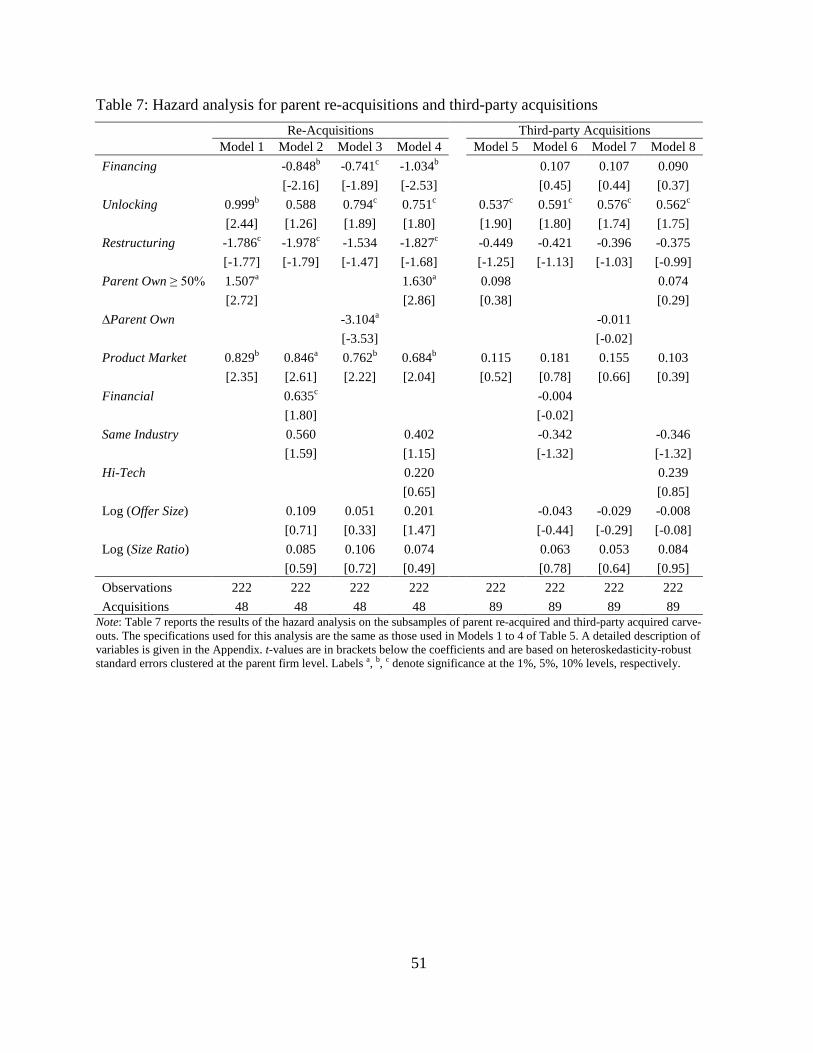
51
Table 7: Hazard analysis for parent re-acquisitions and third-party acquisitions Re-Acquisitions Third-party Acquisitions
Model 1 Model 2 Model 3 Model 4 Model 5 Model 6 Model 7 Model 8 Financing
-0.848b -0.741c -1.034b
0.107 0.107 0.090
[-2.16] [-1.89] [-2.53]
[0.45] [0.44] [0.37]
Unlocking 0.999b 0.588 0.794c 0.751c
0.537c 0.591c 0.576c 0.562c
[2.44] [1.26] [1.89] [1.80]
[1.90] [1.80] [1.74] [1.75]
Restructuring -1.786c -1.978c -1.534 -1.827c
-0.449 -0.421 -0.396 -0.375
[-1.77] [-1.79] [-1.47] [-1.68]
[-1.25] [-1.13] [-1.03] [-0.99]
Parent Own ≥ 50% 1.507a
1.630a
0.098
0.074
[2.72]
[2.86]
[0.38]
[0.29]
∆Parent Own
-3.104a
-0.011
[-3.53]
[-0.02]
Product Market 0.829b 0.846a 0.762b 0.684b
0.115 0.181 0.155 0.103
[2.35] [2.61] [2.22] [2.04]
[0.52] [0.78] [0.66] [0.39]
Financial
0.635c
-0.004
[1.80]
[-0.02]
Same Industry
0.560
0.402
-0.342
-0.346
[1.59]
[1.15]
[-1.32]
[-1.32]
Hi-Tech
0.220
0.239
[0.65]
[0.85]
Log (Offer Size)
0.109 0.051 0.201
-0.043 -0.029 -0.008
[0.71] [0.33] [1.47]
[-0.44] [-0.29] [-0.08]
Log (Size Ratio)
0.085 0.106 0.074
0.063 0.053 0.084
[0.59] [0.72] [0.49]
[0.78] [0.64] [0.95]
Observations 222 222 222 222 222 222 222 222 Acquisitions 48 48 48 48 89 89 89 89
Note: Table 7 reports the results of the hazard analysis on the subsamples of parent re-acquired and third-party acquired carve-outs. The specifications used for this analysis are the same as those used in Models 1 to 4 of Table 5. A detailed description of variables is given in the Appendix. t-values are in brackets below the coefficients and are based on heteroskedasticity-robust standard errors clustered at the parent firm level. Labels a, b, c denote significance at the 1%, 5%, 10% levels, respectively.
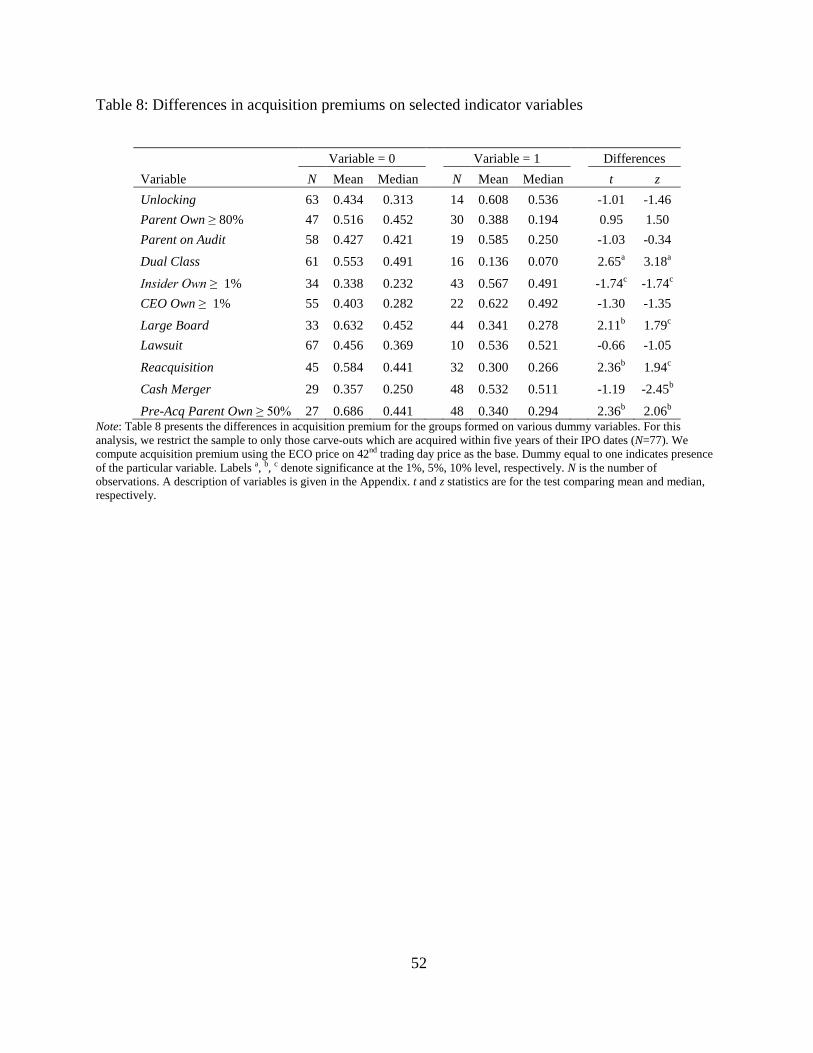
52
Table 8: Differences in acquisition premiums on selected indicator variables
Variable = 0
Variable = 1 Differences Variable N Mean Median N Mean Median t z Unlocking 63 0.434 0.313
14 0.608 0.536
-1.01 -1.46
Parent Own ≥ 80% 47 0.516 0.452
30 0.388 0.194
0.95 1.50 Parent on Audit 58 0.427 0.421
19 0.585 0.250
-1.03 -0.34
Dual Class 61 0.553 0.491
16 0.136 0.070
2.65a 3.18a
Insider Own ≥ 1% 34 0.338 0.232
43 0.567 0.491
-1.74c -1.74c CEO Own ≥ 1% 55 0.403 0.282
22 0.622 0.492
-1.30 -1.35
Large Board 33 0.632 0.452
44 0.341 0.278
2.11b 1.79c Lawsuit 67 0.456 0.369
10 0.536 0.521
-0.66 -1.05
Reacquisition 45 0.584 0.441
32 0.300 0.266
2.36b 1.94c
Cash Merger 29 0.357 0.250
48 0.532 0.511
-1.19 -2.45b
Pre-Acq Parent Own ≥ 50% 27 0.686 0.441 48 0.340 0.294 2.36b 2.06b Note: Table 8 presents the differences in acquisition premium for the groups formed on various dummy variables. For this analysis, we restrict the sample to only those carve-outs which are acquired within five years of their IPO dates (N=77). We compute acquisition premium using the ECO price on 42nd trading day price as the base. Dummy equal to one indicates presence of the particular variable. Labels a, b, c denote significance at the 1%, 5%, 10% level, respectively. N is the number of observations. A description of variables is given in the Appendix. t and z statistics are for the test comparing mean and median, respectively.
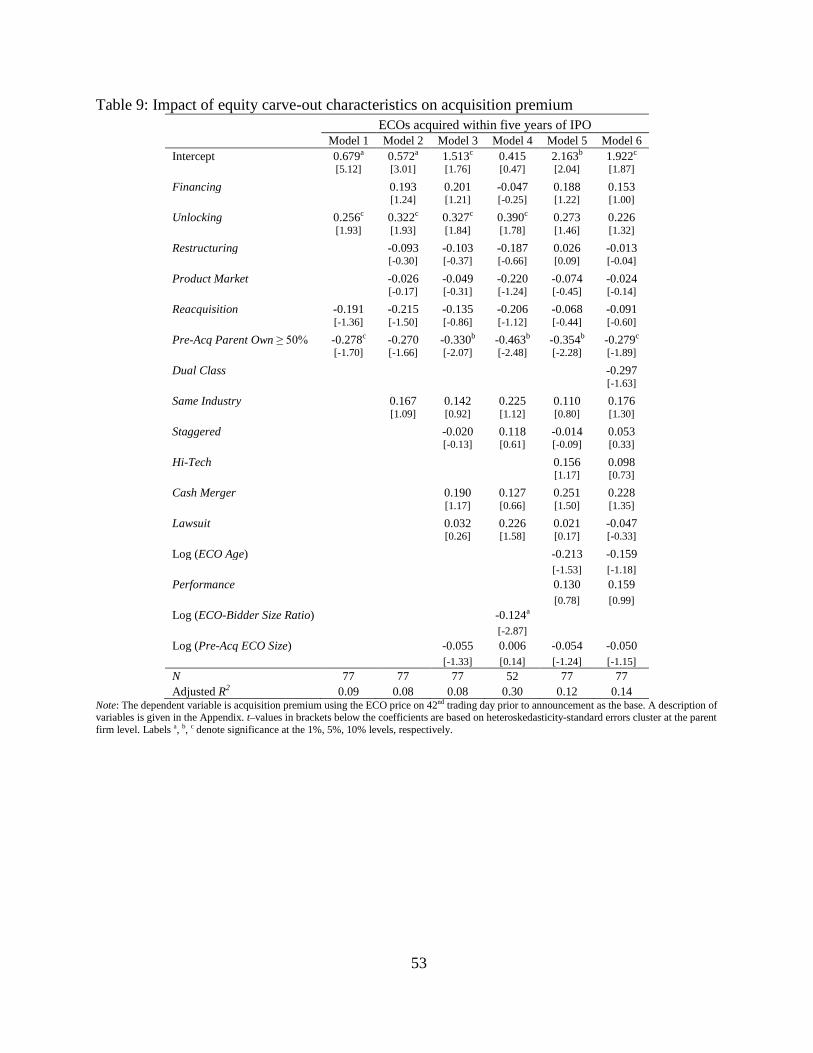
53
Table 9: Impact of equity carve-out characteristics on acquisition premium ECOs acquired within five years of IPO
Model 1 Model 2 Model 3 Model 4 Model 5 Model 6 Intercept 0.679a 0.572a 1.513c 0.415 2.163b 1.922c [5.12] [3.01] [1.76] [0.47] [2.04] [1.87]
Financing
0.193 0.201 -0.047 0.188 0.153 [1.24] [1.21] [-0.25] [1.22] [1.00]
Unlocking 0.256c 0.322c 0.327c 0.390c 0.273 0.226 [1.93] [1.93] [1.84] [1.78] [1.46] [1.32]
Restructuring
-0.093 -0.103 -0.187 0.026 -0.013 [-0.30] [-0.37] [-0.66] [0.09] [-0.04]
Product Market
-0.026 -0.049 -0.220 -0.074 -0.024 [-0.17] [-0.31] [-1.24] [-0.45] [-0.14]
Reacquisition -0.191 -0.215 -0.135 -0.206 -0.068 -0.091 [-1.36] [-1.50] [-0.86] [-1.12] [-0.44] [-0.60]
Pre-Acq Parent Own ≥ 50% -0.278c -0.270 -0.330b -0.463b -0.354b -0.279c [-1.70] [-1.66] [-2.07] [-2.48] [-2.28] [-1.89]
Dual Class
-0.297 [-1.63]
Same Industry
0.167 0.142 0.225 0.110 0.176 [1.09] [0.92] [1.12] [0.80] [1.30]
Staggered
-0.020 0.118 -0.014 0.053 [-0.13] [0.61] [-0.09] [0.33]
Hi-Tech
0.156 0.098 [1.17] [0.73]
Cash Merger
0.190 0.127 0.251 0.228 [1.17] [0.66] [1.50] [1.35]
Lawsuit
0.032 0.226 0.021 -0.047 [0.26] [1.58] [0.17] [-0.33]
Log (ECO Age)
-0.213 -0.159
[-1.53] [-1.18]
Performance
0.130 0.159
[0.78] [0.99]
Log (ECO-Bidder Size Ratio)
-0.124a
[-2.87]
Log (Pre-Acq ECO Size)
-0.055 0.006 -0.054 -0.050
[-1.33] [0.14] [-1.24] [-1.15]
N 77 77 77 52 77 77 Adjusted R2 0.09 0.08 0.08 0.30 0.12 0.14
Note: The dependent variable is acquisition premium using the ECO price on 42nd trading day prior to announcement as the base. A description of variables is given in the Appendix. t–values in brackets below the coefficients are based on heteroskedasticity-standard errors cluster at the parent firm level. Labels a, b, c denote significance at the 1%, 5%, 10% levels, respectively.
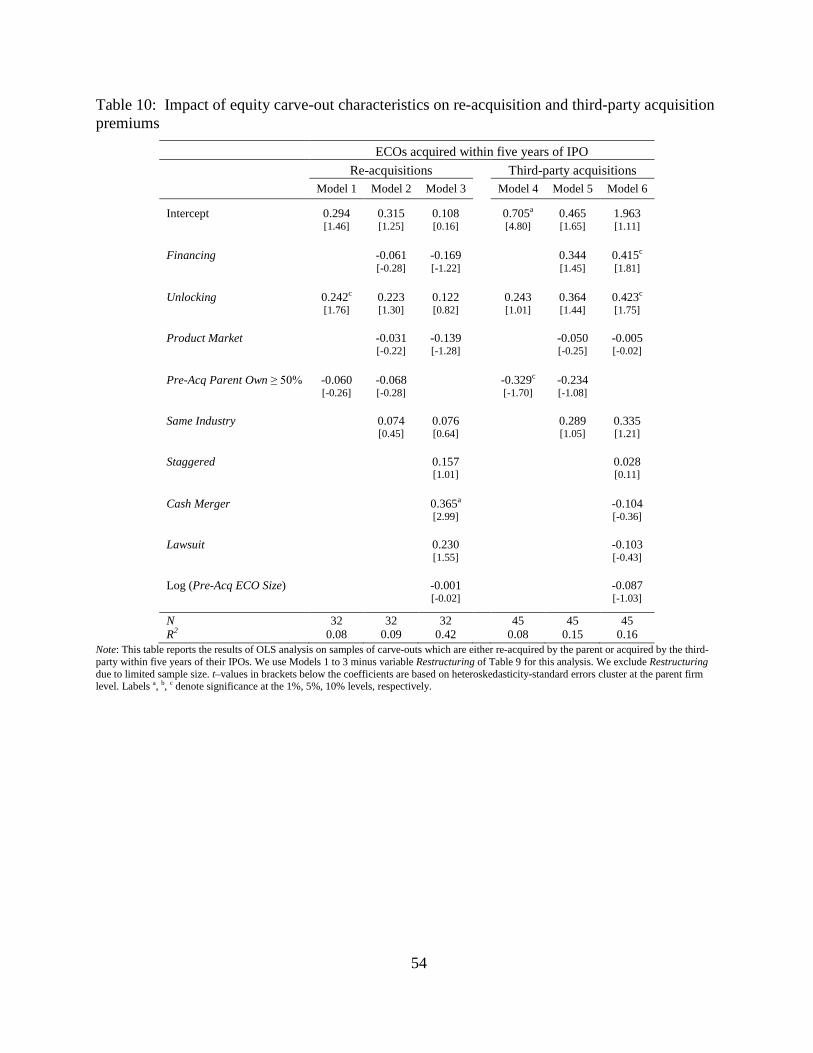
54
Table 10: Impact of equity carve-out characteristics on re-acquisition and third-party acquisition premiums
ECOs acquired within five years of IPO Re-acquisitions Third-party acquisitions Model 1 Model 2 Model 3 Model 4 Model 5 Model 6
Intercept 0.294 0.315 0.108
0.705a 0.465 1.963 [1.46] [1.25] [0.16] [4.80] [1.65] [1.11]
Financing
-0.061 -0.169
0.344 0.415c [-0.28] [-1.22] [1.45] [1.81]
Unlocking 0.242c 0.223 0.122
0.243 0.364 0.423c [1.76] [1.30] [0.82] [1.01] [1.44] [1.75]
Product Market
-0.031 -0.139
-0.050 -0.005 [-0.22] [-1.28] [-0.25] [-0.02]
Pre-Acq Parent Own ≥ 50% -0.060 -0.068
-0.329c -0.234 [-0.26] [-0.28] [-1.70] [-1.08]
Same Industry
0.074 0.076
0.289 0.335 [0.45] [0.64] [1.05] [1.21]
Staggered
0.157
0.028 [1.01] [0.11]
Cash Merger
0.365a
-0.104 [2.99] [-0.36]
Lawsuit
0.230
-0.103 [1.55] [-0.43]
Log (Pre-Acq ECO Size)
-0.001
-0.087 [-0.02] [-1.03]
N 32 32 32 45 45 45 R2 0.08 0.09 0.42 0.08 0.15 0.16
Note: This table reports the results of OLS analysis on samples of carve-outs which are either re-acquired by the parent or acquired by the third-party within five years of their IPOs. We use Models 1 to 3 minus variable Restructuring of Table 9 for this analysis. We exclude Restructuring due to limited sample size. t–values in brackets below the coefficients are based on heteroskedasticity-standard errors cluster at the parent firm level. Labels a, b, c denote significance at the 1%, 5%, 10% levels, respectively.
55
Appendix: Detailed description of explanatory variables
1. Related to the parent motive (Source: news reports from LexisNexis®)
Financing takes on a value of one if the parent motive of conducting a carve-out is for
financing/investment, and zero otherwise. Restructuring takes on a value of one if the parent
conducts a carve-out as a part of restructuring activity, and zero otherwise. Unlocking takes on a
value of one if the parent’s intention is to unlock the value of the subsidiary, and zero otherwise.
In all the three categories, we conservatively assign a value of zero if the information on the
parent motive is not available.
2. Related to the parental control on the post-IPO carve-out (Source: SEC filings)
Parent Ownership Before is the ownership of the parent in a carve-out before the IPO of
the carve-out. Parent Ownership is the ownership of the parent in a carve-out immediately after
the IPO of the carve-out. ∆Parent Own is the change in the parent ownership in the carve-out; it
is the difference of parent ownership before and after the IPO. Parent Own ≥ 50% takes on a
value of one if the parent ownership in the carve-out is above 50% immediately after the IPO,
and zero otherwise. Parent Own ≥ 80% takes on a value of one if the parent ownership in the
carve-out is above 80% immediately after the IPO, and zero otherwise. Parent Directors is the
percentage of carve-out directors who worked for the parent in the past or are currently working
for the parent. It also includes directors who are working for both parent and the carve-out.
Parent on Audit is equal to one if at least one member of the carve-out audit committee has
worked for the parent firm. Parent CEO (Parent Chair) is equal to one if the CEO (Chairperson
of the board) of the carve-out has worked for the parent, zero otherwise. Product Market takes on
a value of one if the parent and the subsidiary have a buyer-supplier agreement, technology
sharing and R&D agreement, marketing and distribution agreement, or specialized service
56
agreement. Financial is the dummy variable that equals one if the parent and subsidiary have a
long-term financial agreement. Same Industry is equal to one if the parent and subsidiary operate
in the same industry (based on two-digit SIC codes).
3. Related to anti-takeover provisions and industry structure:
Staggered, Dual Class, and Delaware take on a value of one if the carve-out has a
staggered (classified) board, dual class of shares, and if the carve-out’s incorporate state is
Delaware, respectively. We obtain data on anti-takeover provisions from SEC filings.
Hi-Tech is a dummy variable that takes on a value of one if the ECO operates in a hi-tech
industry. The SIC codes are from SEC filings, LexisNexis®, SDC, Compustat, and CRSP, in that
order.
4. Control variables: (Source: SEC filings, CRSP)
Other Governance related: Blockholder Ownership is the ownership of the blockholders
immediately after the IPO of the carve-out. The blockholders are defined as those shareholders
other than the parent firm who have 5% or above ownership in a carve-out. Blockholder Own ≥
5% takes on a value of one if the blockholders’ ownership is above 5%, and zero otherwise.
Insider Ownership and CEO Ownership are the post-IPO ownership of insiders (executives +
directors) and of the CEO in a carve-out, respectively. Dummy variables Insider Own ≥ 1% and
CEO Own ≥ 1% take on a value of one if the insiders and CEO have ownership above 1% in the
post-IPO carve-out, respectively. Inside Directors is the percentage of ‘true’ executive directors
who have exclusively worked for the carve-out firm and have never worked for the parent firm in
the past. Outside Directors is the percentage of ‘true’ outside directors who have neither worked
for the carve-out nor for the parent firm. Board Size is the number of directors serving on the
board. Large Board is the dummy variable that takes on a value of one if the board has seven or
57
more directors, and zero otherwise. CEO Duality is equal to one if the CEO of a carve-out is also
the chairperson of the board.
Size and performance related: Offer Size is the offer price multiplied by the number of
shares offered during the IPO. Size Ratio is the ratio of the market value of the carve-out to the
market value of the parent firm, where the market values for both the parent firm and carve-out
are computed on the 21st trading day from the IPO date. Performance measures the abnormal
return of a carve-out for the first-year following its IPO. It is the difference of the carve-out buy-
and-hold return to that of the return on the value-weighted CRSP index. We exclude the initial
day return of a carve-out for computing its buy-and-hold return.
5. Related to a merger transaction: (Source: SEC filings, news reports from Factiva® and
LexisNexis®, and CRSP)
Pre-Acq ECO Size is the market value of the carve-out on the 42nd trading day prior to the
merger announcement date. ECO-Bidder Size Ratio is the ratio of the market size of the carve-
out to that of the bidder firm on the 42nd trading day prior to the announcement date. Cash
Merger takes on a value of one if the merger is financed only with cash. Lawsuit takes on a value
of one if a lawsuit is filed during the merger deal either by the minority shareholder or other
bidder. Multiple Bidder is equal to one if there is more than one bidder competing to acquire the
carve-out. Dummy variables Pre-Acq Parent Own ≥ 50%, Pre-Acq Insider Own ≥ 1%, and Pre-
Acq Blockholder Own ≥ 5% take on a value of one if the parent’s, insiders’, and blockholders’
ownership prior to the merger announcement are above 50%, 1%, and 5%, respectively.
Reacquisition takes on a value of one if the parent re-acquires the carved-out subsidiary. ECO
Age is the months between the merger announcement and IPO offer dates.