Embed Size (px)
Citation preview
On the Absolute Age of the Globular Cluster M921
A. DI CECCO,2 R. BECUCCI,3 G. BONO,2,4 M. MONELLI,5 P. B. STETSON,6,7,8 S. DEGL’INNOCENTI,3,9 P. G. PRADA MORONI,3,9
M. NONINO,10 A. WEISS,11 R. BUONANNO,2,12 A. CALAMIDA,13 F. CAPUTO,4 C. E. CORSI,4 I. FERRARO,4
G. IANNICOLA,4 L. PULONE,4 M. ROMANIELLO,13AND A. R. WALKER
14
Received 2010 May 14; accepted 2010 June 26; published 2010 August 10
ABSTRACT. We present precise and deep optical photometry of the globular M92. Data were collected in three
different photometric systems: Sloan Digital Sky Survey (g0, r0, i0, and z0; MegaCam at CFHT), Johnson-Kron-
Cousins (B, V , and I; various ground-based telescopes), and Advanced Camera for Surveys (ACS) Vegamag
(F475W, F555W, and F814W; Hubble Space Telescope). Special attention was given to the photometric calibration,
and the precision of the ground-based data is generally better than 0.01 mag. We computed a new set of α-enhanced
evolutionary models accounting for the gravitational settling of heavy elements at fixed chemical composition
(½α=Fe" ¼ þ0:3, ½Fe=H" ¼ %2:32 dex, and Y ¼ 0:248). The isochrones—assuming the same true distance mod-
ulus (μ ¼ 14:74 mag), the same reddening [EðB % V Þ ¼ 0:025 ( 0:010 mag], and the same reddening law—
account for the stellar distribution along the main sequence and the red giant branch in different color-magnitude
diagrams (i0, g0 % i0; i0, and g0 % r0; i0, g0 % z0; I, and B % I; and F814W and F475W–F814W). The same outcome
applies to the comparison between the predicted zero-age horizontal-branch (ZAHB) and the HB stars. We also
found a cluster age of 11 ( 1:5 Gyr, in good agreement with previous estimates. The error budget accounts for
uncertainties in the input physics and the photometry. To test the possible occurrence of CNO-enhanced stars,
we also computed two sets of α- and CNO-enhanced (by a factor of 3) models, both at fixed total metallicity
(½M=H" ¼ %2:10 dex) and at fixed iron abundance. We found that the isochrones based on the former set give
the same cluster age (11 ( 1:5 Gyr) as the canonical α-enhanced isochrones. The isochrones based on the latter
set also give a similar cluster age (10 ( 1:5 Gyr). These findings support previous results concerning the weak
sensitivity of cluster isochrones to CNO-enhanced chemical mixtures.
Online material: color figures
1. INTRODUCTION
The Galactic globular cluster (GGC) M92 (NGC 6341) is
among the oldest and most metal-poor (½Fe=H" ¼ %2:38, Kraft
& Ivans 2003, 2004) Galactic stellar systems. It is located well
above the Galactic plane (l ¼ 68:34°, b ¼ 34:86°, Harris 1996),
is minimally affected by field star contamination, and is only
slightly reddened (EðB % V Þ ¼ 0:02, Harris 1996). However,
the cluster’s absolute age is far from being well established. Re-
cent estimates based on updated cluster isochrones indicate that
the absolute age of M92 ranges from 12:3 ( 0:9 Gyr (Salaris &
Weiss 2002) to 14:8 ( 2:5 Gyr (Carretta et al. 2000; Grundahl
et al. 2000). Avery accurate estimate of the absolute age of M92
was also provided by VandenBerg et al. (2002). They gave a
new estimate of both distance modulus (DM) and reddening
(DMV ¼ 14:60 ( 0:12, EðB % V Þ ¼ 0:023 mag) using the un-
ique field, metal-poor (½Fe=H" ≲ %2:3) subdwarf calibrator with
13 ESO, Karl-Schwarzschild-Strasse 2, 85748 Garching bei Munchen,
Germany.14 CTIO–NOAO, Casilla 603, La Serena, Chile.
1 This paper makes use of data obtained from the Isaac Newton Group
Archive, which is maintained as part of the CASU Astronomical Data Centre
at the Institute of Astronomy, Cambridge. This research used the facilities of the
Canadian Astronomy Data Centre operated by the National Research Council of
Canada with the support of the Canadian Space Agency.2 Dipartimento di Fisica, Università di Roma Tor Vergata, via della Ricerca
Scientifica 1, 00133 Rome, Italy; [email protected] Dipartimento di Fisica, Università di Pisa, Largo B. Pontecorvo 2, 56127
Pisa, Italy.4 INAF–OAR, via Frascati 33, Monte Porzio Catone, Rome, Italy.5 IAC, Calle Via Lactea, E38200 La Laguna, Tenerife, Spain.6DAO–HIA, NRC, 5071 West Saanich Road, Victoria, BC V9E 2E7, Canada.7 Visiting Astronomer, Kitt Peak National Observatory, National Optical As-
tronomy Observatory, which is operated by the Association of Universities for
Research in Astronomy (AURA) under cooperative agreement with the National
Science Foundation.8Visiting Astronomer, Canada-France-Hawaii Telescope operated by the Na-
tional Research Council of Canada, the Centre National de la Recherche Scien-
tifique de France, and the University of Hawaii.9 INFN–Pisa, via E. Fermi 2, 56127 Pisa, Italy.10 INAF–OAT, via G. B. Tiepolo 11, 40131 Trieste, Italy.11 Max-Planck-Institut für Astrophysik, Karl-Schwarzschild-Strasse 1, 85748
Garching, Germany.12ASI–Science Data Center, ASDC c/o ESRIN, via G. Galilei, 00044 Frascati,
Italy.
991
PUBLICATIONS OF THE ASTRONOMICAL SOCIETY OF THE PACIFIC, 122:991–999, 2010 September© 2010. The Astronomical Society of the Pacific. All rights reserved. Printed in U.S.A.
an accurate trigonometric parallax from Hipparcos
(σπ=π ≤ 0:1). By adopting the quoted values and a set of cluster
isochrones (½Fe=H" ¼ %2:3, ½α=Fe" ¼ 0:3 dex) including grav-
itational settling and radiative accelerations they found an ab-
solute age of 13:5 ( 1:0–1:5 Gyr. Similar cluster ages have
been found using the luminosity function of evolved stars,
and indeed Cho & Lee (2007) found an age of ∼13:5 Gyr, while
Paust et al. (2007) found an age of 14:2 ( 1:2 Gyr. Precise es-
timates of the globular cluster (GC) absolute ages rely, from an
empirical point of view, on four ingredients: distance, total met-
allicity, reddening, and photometric zero points (Renzini 1991).
Recent estimates of the cluster distance modulus based on dif-
ferent standard candles agree quite well. The true DM (μ) of
M92 is based on main sequence (MS) fitting ranges from μ ¼14:64 ( 0:07 mag (Carretta et al. 2000) to μ ¼ 14:75 (0:11 mag (Kraft & Ivans 2003). Distances based on the near-
infrared period-luminosity relation of RR Lyrae stars (Bono
et al. 2001; Cassisi et al. 2004; Catelan 2004; Del Principe et al.
2005, 2006; Sollima et al. 2006) suggest a similar mean value:
i.e., μ ¼ 14:65 ( 0:10 mag. Thus, the different distance esti-
mates agree within their current uncertainties (1σ).
The uncertainty in the reddening correction for low-reddening
GCs is typically of the order of 0.02 mag (Gratton et al. 2003;
Bono et al. 2008). Experience has shown that the typical uncer-
tainty in the zero point of photometry from a given observing run
is still of the order of 0.01–0.02 mag (e.g., Stetson et al. 2003;
Stetson et al. 2004; Stetson 2005). In the case of M92, this
uncertainty may occasionally have been still larger (0.03 mag,
Carretta et al. 2000). However, we believe that this systematic
uncertainty can be reduced by averaging the photometric results
of many observing runs, each of which has been individually
calibrated to a common photometric standard system. The uncer-
tainty affecting the total metallicity is of the order of 0.2 dex, if
we include cluster-to-cluster uncertainties in iron and α-element
abundances as well as systematic uncertainties in the overall met-
allicity scale (Carretta et al. 2009).
Dating back to the 1970s, spectroscopic measurements quite
clearly showed the occurrence of star-to-star variations of C
and N abundances in several GGCs (M5, M10, M13, M92,
ω Centauri, Osborn 1971; Cohen 1978). Subsequent investiga-
tions also found variations in Na (Cohen 1978; Peterson 1980),
in Al (Norris et al. 1981), and in O (Pilachowski et al. 1983;
Leep et al. 1986). The observational scenario was further en-
riched by the evidence that the molecular band strengths of
CN and CH appear to be anticorrelated (Smith 1987; Kraft
1994, and references therein). Both this anticorrelation and
an anticorrelation between O-Na and Mg-Al have been ob-
served in evolved (red giant branch [RGB], horizontal branch
[HB]) and in unevolved MS stars of all GCs studied in sufficient
detail (Suntzeff & Smith 1991; Cannon et al. 1998; Harbeck
et al. 2003; Gratton et al. 2001; Ramirez & Cohen 2002;
Carretta et al. 2007).
A working hypothesis to explain these observations is that a
previous generation (first generation) of asymptotic giant
branch (AGB) stars expelled processed material during thermal
pulses; thus, the subsequent stellar generation (second gen-
eration) formed with material that had already been polluted
(Ventura et al. 2001; Gratton et al. 2004, and references therein).
In this scenario, the surface abundance of the second stellar gen-
eration is characterized by a significant He enrichment and by
well-defined C-N-O-Na anticorrelations. It has been suggested
that the fraction of stars belonging to the second generation
might typically be of the order of 50% (D’Antona & Caloi
2008). Alternative hypotheses are that cluster self-pollution
is caused either by evolved RGB stars that experienced extra-
deep mixing (Denissenkov & Weiss 2004) or by fast-rotating
intermediate-mass stars (Maeder & Meynet 2006; Prantzos &
Charbonnel 2006; Decressin et al. 2007). M92 shows the typical
variations in [C/Fe] and [N/Fe] (Carbon et al. 1982; Langer et al.
1986; Bellman et al. 2001), together with the usual anticorrela-
tions (Pilachowski et al. 1983; Sneden et al. 1991; Kraft 1994).
However, up to now no evidence has been found concerning the
occurrence of multiple stellar populations (Piotto et al. 2007;
Cassisi et al. 2008). Therefore, M92 is a perfect laboratory
to constrain the impact of canonical and CNO-enhanced mix-
tures on the estimate of the cluster age.
We take advantage of deep and accurate multiband optical
images collected with both ground-based and space telescopes
to constrain the absolute age of M92.
2. DATA REDUCTION AND THEORETICAL
FRAMEWORK
To provide robust estimates of the absolute age of M92,
we secured optical images collected in three different photo-
metric systems. In particular, we adopted both ground-based
and space images. The ground-based data were collected either
with MegaCam—the mosaic camera available at the Canada-
France-Hawaii Telescope (CFHT: Sloan filters, field of view
[FOV]: 1° × 1°, spatial resolution: 0:19″ pixel%1)—or with sev-
eral small/medium telescopes (Johnson-Cousins bands). The
space data were collected with the Advanced Camera for Sur-
veys (ACS) on the Hubble Space Telescope (HST) using both
the Wide Field Channel (WFC, FOV: 202″ × 202″,
0:05″ pixel%1) and the High Resolution Channel (HRC, FOV:
0:50 × 0:50, 0:025″ pixel%1). The sky coverage of the different
data sets is plotted in Figure 1.
The CFHT data set includes 1440 CCD images collected in
the Sloan bands (g0, r0, i0, and z0)with different exposure times
(ETs). In particular, the shallow images were acquired with ETs
of 5 s (g0, r0, and i0) and 15 s (z0), while the deep images had ETs
of 250 s (g0 and r0), 300 s (i0), and 500 s (z0). The mean seeing in
the different bands ranges from ∼0:75″ (g0, r0, and i0) to ∼0:85″
(z0). These images were preprocessed using Elixir (Magnier &
Cuillandre 2004). For each chip of the mosaic camera, we per-
formed standard point-spread function (PSF) fitting photometry
992 DI CECCO ET AL.
2010 PASP, 122:991–999
with DAOPHOT IV and ALLSTAR (Stetson 1987). The indi-
vidual chips were rescaled to a common geometrical systems
defined by a 1:5° × 1:5° Sloan Digital Sky Service (SDSS) ref-
erence image using DAOMATCH/DAOMASTER. We per-
formed the final photometry by running ALLFRAME (Stetson
1994) simultaneously over the entire data set. We ended up with
a photometric catalog including ∼84; 000 stars with at least one
measurement in two different photometric bands. The absolute
calibration was performed using local secondary standards pro-
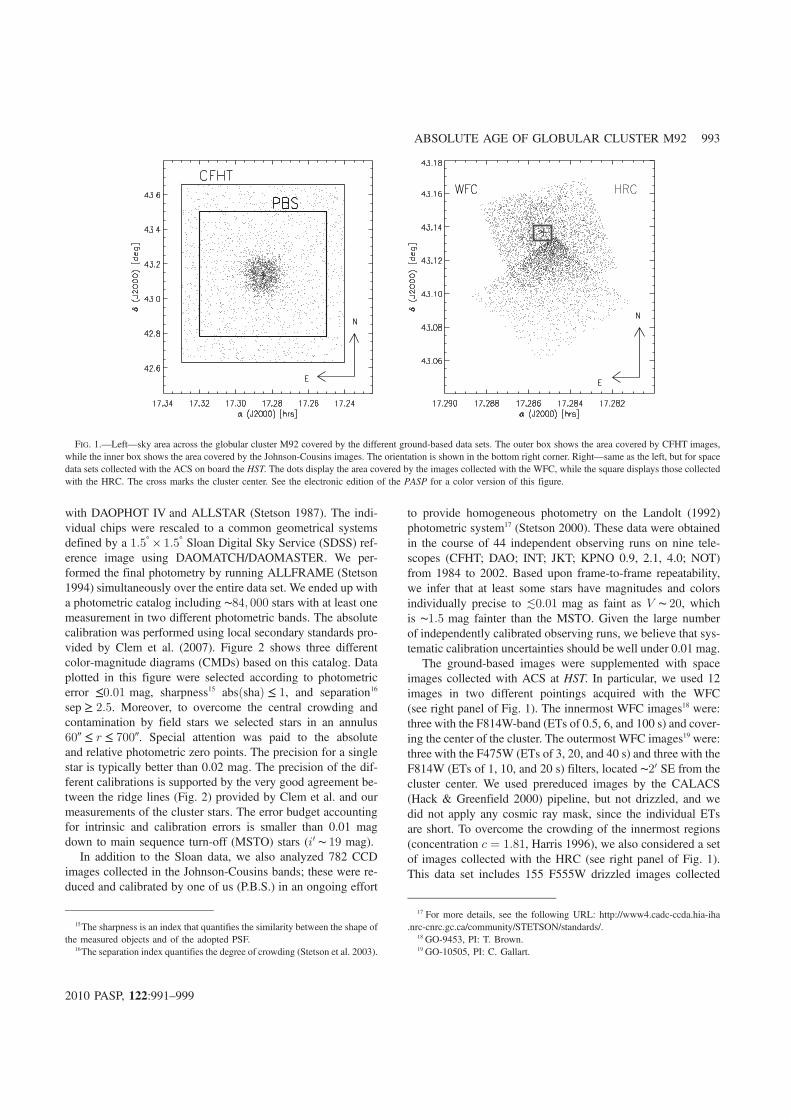
vided by Clem et al. (2007). Figure 2 shows three different
color-magnitude diagrams (CMDs) based on this catalog. Data
plotted in this figure were selected according to photometric
error ≤0:01 mag, sharpness15 absðshaÞ ≤ 1, and separation16
sep ≥ 2:5. Moreover, to overcome the central crowding and
contamination by field stars we selected stars in an annulus
60″ ≤ r ≤ 700″. Special attention was paid to the absolute
and relative photometric zero points. The precision for a single
star is typically better than 0.02 mag. The precision of the dif-
ferent calibrations is supported by the very good agreement be-
tween the ridge lines (Fig. 2) provided by Clem et al. and our
measurements of the cluster stars. The error budget accounting
for intrinsic and calibration errors is smaller than 0.01 mag
down to main sequence turn-off (MSTO) stars (i0 ∼ 19 mag).
In addition to the Sloan data, we also analyzed 782 CCD
images collected in the Johnson-Cousins bands; these were re-
duced and calibrated by one of us (P.B.S.) in an ongoing effort
to provide homogeneous photometry on the Landolt (1992)
photometric system17 (Stetson 2000). These data were obtained
in the course of 44 independent observing runs on nine tele-
scopes (CFHT; DAO; INT; JKT; KPNO 0.9, 2.1, 4.0; NOT)
from 1984 to 2002. Based upon frame-to-frame repeatability,
we infer that at least some stars have magnitudes and colors
individually precise to ≲0:01 mag as faint as V ∼ 20, which
is ∼1:5 mag fainter than the MSTO. Given the large number
of independently calibrated observing runs, we believe that sys-
tematic calibration uncertainties should be well under 0.01 mag.
The ground-based images were supplemented with space
images collected with ACS at HST. In particular, we used 12
images in two different pointings acquired with the WFC
(see right panel of Fig. 1). The innermost WFC images18 were:
three with the F814W-band (ETs of 0.5, 6, and 100 s) and cover-
ing the center of the cluster. The outermost WFC images19 were:
three with the F475W (ETs of 3, 20, and 40 s) and three with the
F814W (ETs of 1, 10, and 20 s) filters, located ∼20 SE from the
cluster center. We used prereduced images by the CALACS
(Hack & Greenfield 2000) pipeline, but not drizzled, and we
did not apply any cosmic ray mask, since the individual ETs
are short. To overcome the crowding of the innermost regions
(concentration c ¼ 1:81, Harris 1996), we also considered a set
of images collected with the HRC (see right panel of Fig. 1).
This data set includes 155 F555W drizzled images collected
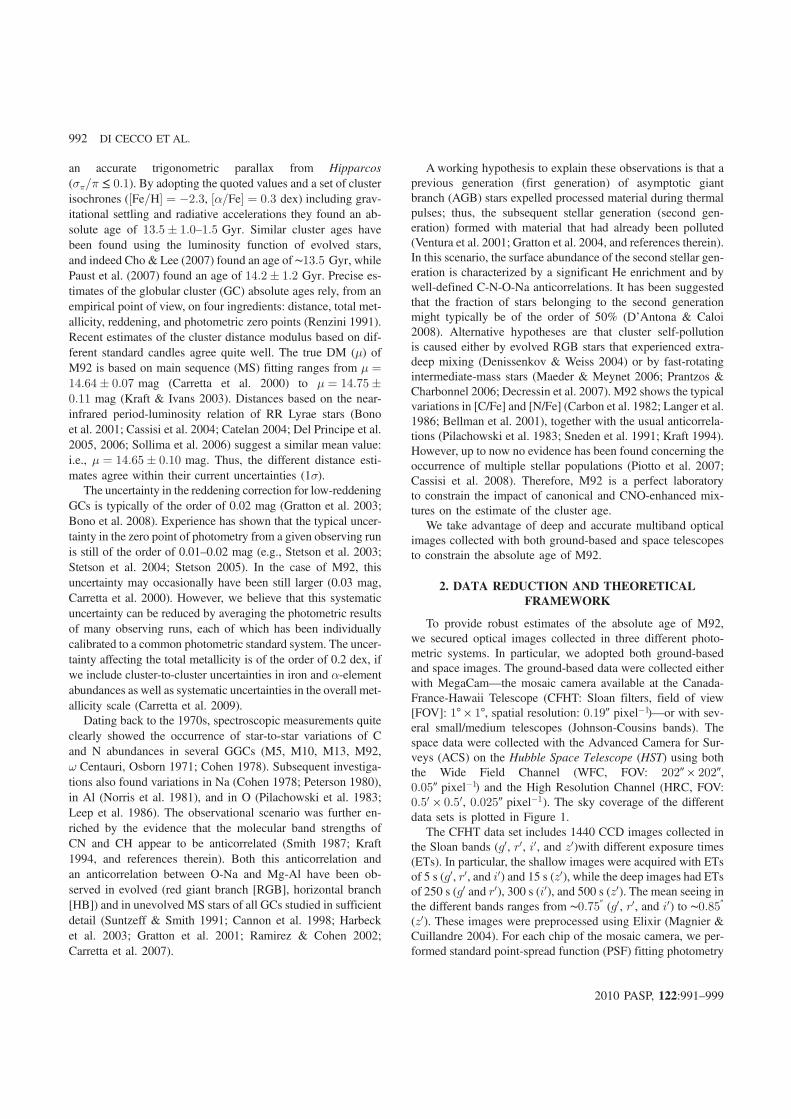
FIG. 1.—Left—sky area across the globular cluster M92 covered by the different ground-based data sets. The outer box shows the area covered by CFHT images,
while the inner box shows the area covered by the Johnson-Cousins images. The orientation is shown in the bottom right corner. Right—same as the left, but for space
data sets collected with the ACS on board the HST. The dots display the area covered by the images collected with the WFC, while the square displays those collected
with the HRC. The cross marks the cluster center. See the electronic edition of the PASP for a color version of this figure.
15The sharpness is an index that quantifies the similarity between the shape of
the measured objects and of the adopted PSF.16The separation index quantifies the degree of crowding (Stetson et al. 2003).
17 For more details, see the following URL: http://www4.cadc‑ccda.hia‑iha
.nrc‑cnrc.gc.ca/community/STETSON/standards/.18 GO-9453, PI: T. Brown.19 GO-10505, PI: C. Gallart.
ABSOLUTE AGE OF GLOBULAR CLUSTER M92 993
2010 PASP, 122:991–999
with different exposure times (74 × 10 s, 4 × 120 s, 10 × 40 s,
4 × 80 s, 34 × 100 s, 8 × 200 s, 4 × 400 s, 9 × 500 s, and 8×
1000 s)20. These images were prereduced using the HST pipe-
line. To reduce the ACS data, individual PSFs were modeled for
both chips using DAOPHOT/ALLFRAME programs, and the
individual catalogs were calibrated following the Sirianni et al.
(2005) prescriptions.
To compare the observations with the models, we computed
evolutionary tracks with an updated version of the FRANEC evo-
lutionary code (Chieffi & Straniero 1989; Degl’Innocenti et al.
2008). For these models, the OPAL 2006 equation of state
(EOS) was adopted (Iglesias & Rogers 1996), together with ra-
diative opacity tables by the Livermore group (Iglesias & Rogers
1996)21 for temperatures higher than 12,000 K; in this way, the
EOS and the opacity are fully consistent. The conductive opaci-
ties are from Shternin & Yakovlev (2006, see also Potekhin
1999), while the atmospheric opacities are from Ferguson et al.
(2005). All the opacity tables were calculated for the Asplund
et al. (2005, hereafter AG05) solar mixture. The nuclear reaction
rates are from the Nuclear Astrophysics Compilation of Reaction
Rates (Angulo et al. 1999). It is worth mentioning that the use of
the new measurement of the 14Nðp; γÞ15O capture cross section
(Formicola et al. 2004) would imply a systematic increase of
∼1 Gyr in the estimate of the GC absolute age (Imbriani et al.
2004). Our models include atomic He and metal diffusion, with
diffusion coefficients given by Thoul et al. (1994). The reader
interested in a detailed discussion of the uncertainties affecting
the diffusion coefficients is referred to Bahcall et al. (1995),
Castellani et al. (1997), and Guzik et al. (2005). To model ex-
ternal convection, we adopted, as usual, the mixing-length for-
malism (Bohm-Vitense 1958). The mixing-length parameter,
α, governing the efficiency of convection was set at α ¼ 2:0.The metallicity adopted for the models is directly related to
the observed [Fe/H] (when the AG05 solar mixture is assumed)
Z ¼ ð1 % Y P Þ
��
1 þΔY
ΔZþ
1
ðZ=XÞ⊙× 10%½Fe=H"
: (1)
and α-element abundances according to the formula originally
suggested by Salaris et al. (1993).
We adopted the value ½Fe=H" ¼ %2:32, given by spectro-
scopic measurements (½Fe=H" ¼ %2:38) by Kraft & Ivans
(2003, 2004), but rescaled to the AG05 solar iron abundance.
The adopted α-element enhancement is ½α=Fe" ¼ þ0:3, while
for the primordial helium content, we adopted the recent cosmo-
logical value Y p ¼ 0:248 (Peimbert et al. 2007; Izotov et al.
2007). Note that the change from the old Grevesse & Sauval
(1999) to the new AG05 solar mixture causes at fixed iron
and α-element abundances is a decrease from Z ¼ 0:00014toZ ¼ 0:00010. The difference is mainly caused by the decrease
in CNO solar abundances. The interested reader is referred to the
recent investigation by Caffau et al. (2010) for new and indepen-
dent measurements of solar CNO abundances. The cluster iso-
chrones were transformed into the observational plane using the
bolometric corrections (BCs) and the color-temperature relations
(CTRs) provided by Brott & Hauschild (2005), while for the
ZAHB models we used the BCs and CTRs provided by Castelli
& Kurucz (2003). In the following, the evolutionary models con-
structed assuming the preceding chemical abundances are called
“canonical models.”
To account for C-N-O-Na anticorrelations, we used the same
mixture adopted in the literature (Salaris et al. 2006; Cassisi et al.
2008; Pietrinferni et al. 2009), which is based on a mean value of
the observed anticorrelations provided by Carretta et al. (2005).
The changes in elemental abundance relative to the canonical α-
enhanced models are the following: N increased by 1.8 dex, C
decreased by 0.6 dex, Na increased by 0.8 dex, and O decreased
by 0.8 dex. These changes give an enhancement of a factor of
≈3 (þ0:5 dex) in the [C þ N þ O=Fe] abundance. We did not
include the Mg-Al anticorrelation because it minimally affects
the evolutionary properties (Salaris et al. 2006). The increase
in the total CNO abundance causes, at fixed iron abundance,
an increase in the total metallicity from Z ¼ 0:00010 to
Z ¼ 0:00023. This increase in metallicity makes the MSTO
fainter and cooler, as originally suggested by Bazzano et al.
(1982) and by VandenBerg (1985). To constrain the impact of
the different chemical mixtures, the CNO-enhanced models were
constructed at both fixed total metallicity (½M=H" ¼ %2:10) and
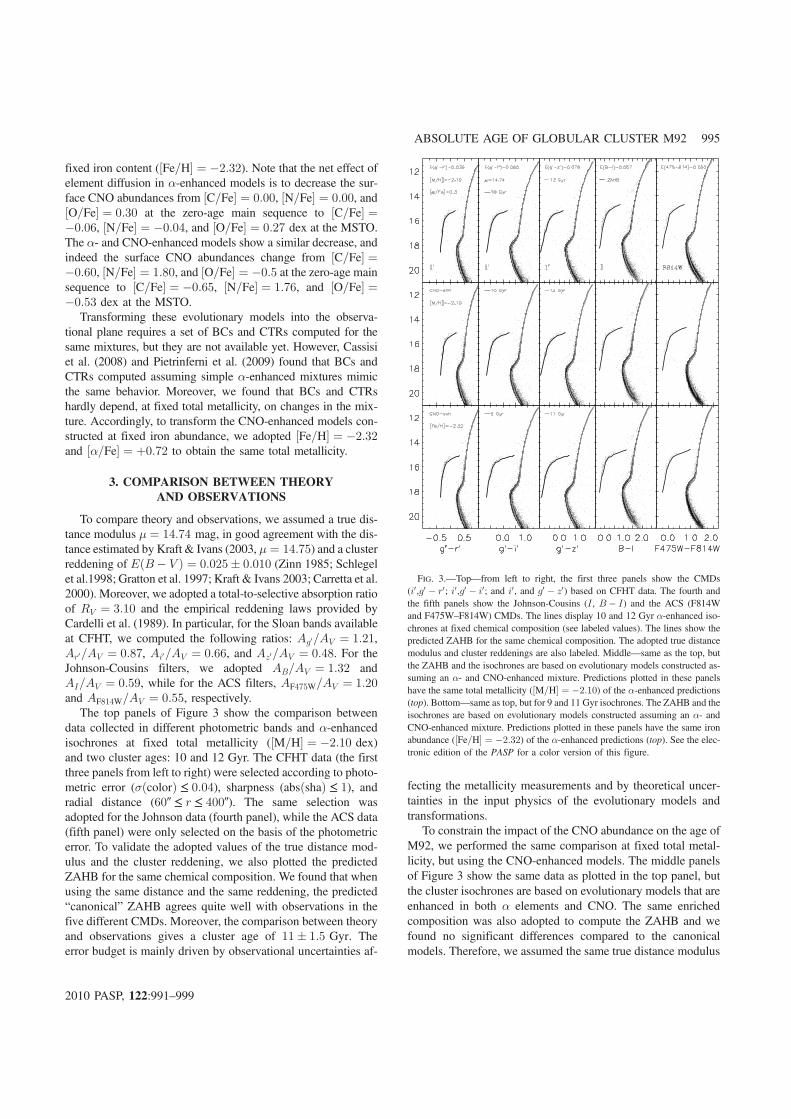
FIG. 2.—The i0, g0 % r0 (left), i0, g0 % i0 (middle), and i0, g0 % z0 (right) CMDs
based on images collected with the MegaCam at CFHT. The lines display the
ridgelines provided by Clem et al. (2007). The error bars on the left show the
mean intrinsic photometric error in magnitude and in color, while the black ar-
rows show the reddening vectors. See the electronic edition of the PASP for a
color version of this figure.
20 GO-10335, PI: H. Ford.21 http://opalopacity.llnl.gov/opal.html.
994 DI CECCO ET AL.
2010 PASP, 122:991–999
fixed iron content (½Fe=H" ¼ %2:32). Note that the net effect of
element diffusion in α-enhanced models is to decrease the sur-
face CNO abundances from ½C=Fe" ¼ 0:00, ½N=Fe" ¼ 0:00, and
½O=Fe" ¼ 0:30 at the zero-age main sequence to ½C=Fe" ¼%0:06, ½N=Fe" ¼ %0:04, and ½O=Fe" ¼ 0:27 dex at the MSTO.
The α- and CNO-enhanced models show a similar decrease, and
indeed the surface CNO abundances change from ½C=Fe" ¼%0:60, ½N=Fe" ¼ 1:80, and ½O=Fe" ¼ %0:5 at the zero-age main
sequence to ½C=Fe" ¼ %0:65, ½N=Fe" ¼ 1:76, and ½O=Fe" ¼%0:53 dex at the MSTO.
Transforming these evolutionary models into the observa-
tional plane requires a set of BCs and CTRs computed for the
same mixtures, but they are not available yet. However, Cassisi
et al. (2008) and Pietrinferni et al. (2009) found that BCs and
CTRs computed assuming simple α-enhanced mixtures mimic
the same behavior. Moreover, we found that BCs and CTRs
hardly depend, at fixed total metallicity, on changes in the mix-
ture. Accordingly, to transform the CNO-enhanced models con-
structed at fixed iron abundance, we adopted ½Fe=H" ¼ %2:32and ½α=Fe" ¼ þ0:72 to obtain the same total metallicity.
3. COMPARISON BETWEEN THEORY
AND OBSERVATIONS
To compare theory and observations, we assumed a true dis-
tance modulus μ ¼ 14:74 mag, in good agreement with the dis-
tance estimated by Kraft & Ivans (2003, μ ¼ 14:75) and a cluster
reddening of EðB % V Þ ¼ 0:025 ( 0:010 (Zinn 1985; Schlegel
et al.1998; Gratton et al. 1997; Kraft & Ivans 2003; Carretta et al.
2000). Moreover, we adopted a total-to-selective absorption ratio
of RV ¼ 3:10 and the empirical reddening laws provided by
Cardelli et al. (1989). In particular, for the Sloan bands available
at CFHT, we computed the following ratios: Ag0=AV ¼ 1:21,Ar0=AV ¼ 0:87, Ai0=AV ¼ 0:66, and Az0=AV ¼ 0:48. For the
Johnson-Cousins filters, we adopted AB=AV ¼ 1:32 and
AI=AV ¼ 0:59, while for the ACS filters, AF475W=AV ¼ 1:20and AF814W=AV ¼ 0:55, respectively.
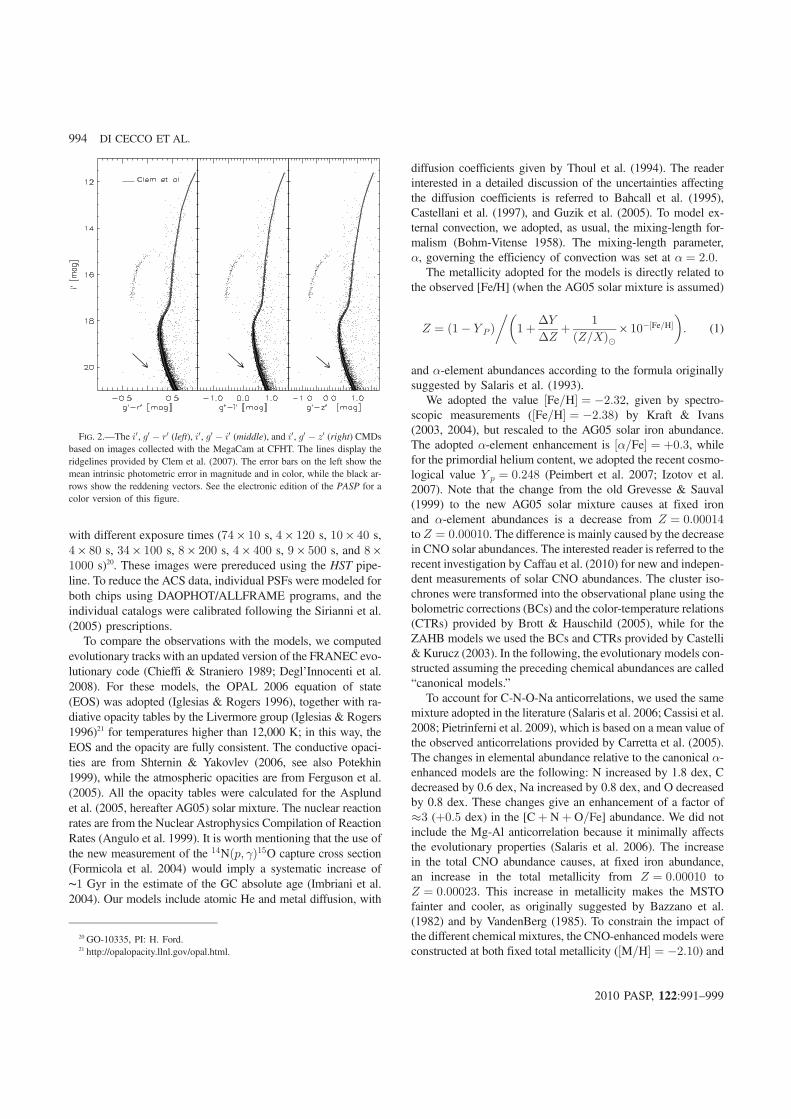
The top panels of Figure 3 show the comparison between
data collected in different photometric bands and α-enhanced
isochrones at fixed total metallicity (½M=H" ¼ %2:10 dex)
and two cluster ages: 10 and 12 Gyr. The CFHT data (the first
three panels from left to right) were selected according to photo-
metric error (σðcolorÞ ≤ 0:04), sharpness (absðshaÞ ≤ 1), and
radial distance (60″ ≤ r ≤ 400″). The same selection was
adopted for the Johnson data (fourth panel), while the ACS data
(fifth panel) were only selected on the basis of the photometric
error. To validate the adopted values of the true distance mod-
ulus and the cluster reddening, we also plotted the predicted
ZAHB for the same chemical composition. We found that when
using the same distance and the same reddening, the predicted
“canonical” ZAHB agrees quite well with observations in the
five different CMDs. Moreover, the comparison between theory
and observations gives a cluster age of 11 ( 1:5 Gyr. The
error budget is mainly driven by observational uncertainties af-
fecting the metallicity measurements and by theoretical uncer-
tainties in the input physics of the evolutionary models and
transformations.
To constrain the impact of the CNO abundance on the age of
M92, we performed the same comparison at fixed total metal-
licity, but using the CNO-enhanced models. The middle panels
of Figure 3 show the same data as plotted in the top panel, but
the cluster isochrones are based on evolutionary models that are
enhanced in both α elements and CNO. The same enriched
composition was also adopted to compute the ZAHB and we
found no significant differences compared to the canonical
models. Therefore, we assumed the same true distance modulus
FIG. 3.—Top—from left to right, the first three panels show the CMDs
(i0,g0 % r0; i0,g0 % i0; and i0, and g0 % z0) based on CFHT data. The fourth and
the fifth panels show the Johnson-Cousins (I, B % I) and the ACS (F814W
and F475W–F814W) CMDs. The lines display 10 and 12 Gyr α-enhanced iso-
chrones at fixed chemical composition (see labeled values). The lines show the
predicted ZAHB for the same chemical composition. The adopted true distance
modulus and cluster reddenings are also labeled. Middle—same as the top, but
the ZAHB and the isochrones are based on evolutionary models constructed as-
suming an α- and CNO-enhanced mixture. Predictions plotted in these panels
have the same total metallicity (½M=H" ¼ %2:10) of the α-enhanced predictions
(top). Bottom—same as top, but for 9 and 11 Gyr isochrones. The ZAHB and the
isochrones are based on evolutionary models constructed assuming an α- and
CNO-enhanced mixture. Predictions plotted in these panels have the same iron
abundance (½Fe=H" ¼ %2:32) of the α-enhanced predictions (top). See the elec-
tronic edition of the PASP for a color version of this figure.
ABSOLUTE AGE OF GLOBULAR CLUSTER M92 995
2010 PASP, 122:991–999
and cluster reddening as for the canonical predictions. The com-
parison between theory and observations indicates that α- and
CNO-enriched isochrones provide, at fixed total metallicity, the
same cluster age (11 ( 1:5 Gyr) as the canonical α-enhanced
models. Data plotted in the bottom panels show the comparison
between theory and observations for α and CNO enhancements
at fixed iron abundance (½Fe=H" ¼ %2:32). Note that the total
metallicity of the isochrones and of the ZAHB is now increased
to ½M=H" ¼ %1:75. The cluster age we found is, for the same
true distance and cluster reddening, minimally younger
(10 ( 1:5 Gyr), but still agrees quite well ((1σ) with the pre-
ceding estimates. It is worth noticing that canonical and CNO-
enhanced isochrones show very similar morphologies in optical
CMDs, as originally suggested by Salaris et al. (2006). This in-
dicates that broadband optical photometry like that investigated
here cannot be safely adopted to constrain the occurrence of
CNO-enhanced subpopulations in GCs.
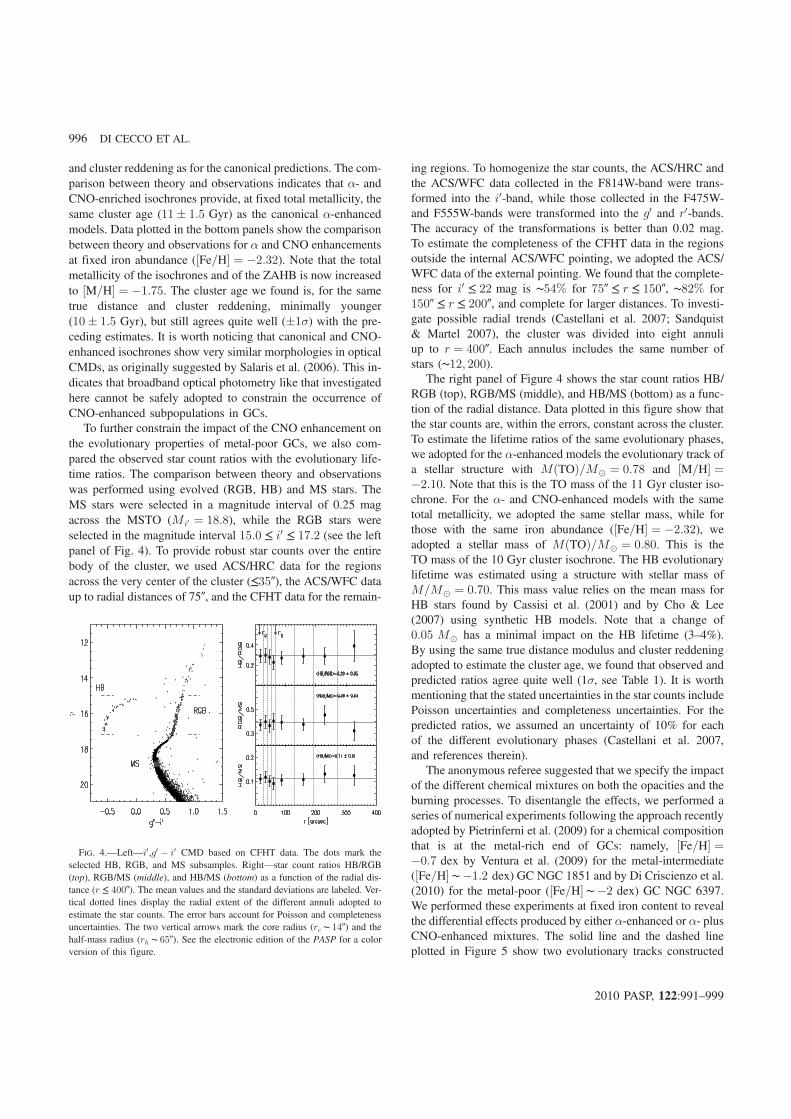
To further constrain the impact of the CNO enhancement on
the evolutionary properties of metal-poor GCs, we also com-
pared the observed star count ratios with the evolutionary life-
time ratios. The comparison between theory and observations
was performed using evolved (RGB, HB) and MS stars. The
MS stars were selected in a magnitude interval of 0.25 mag
across the MSTO (M i0 ¼ 18:8), while the RGB stars were
selected in the magnitude interval 15:0 ≤ i0 ≤ 17:2 (see the left
panel of Fig. 4). To provide robust star counts over the entire
body of the cluster, we used ACS/HRC data for the regions
across the very center of the cluster (≤35″), the ACS/WFC data
up to radial distances of 75″, and the CFHT data for the remain-
ing regions. To homogenize the star counts, the ACS/HRC and
the ACS/WFC data collected in the F814W-band were trans-
formed into the i0-band, while those collected in the F475W-
and F555W-bands were transformed into the g0 and r0-bands.
The accuracy of the transformations is better than 0.02 mag.
To estimate the completeness of the CFHT data in the regions
outside the internal ACS/WFC pointing, we adopted the ACS/
WFC data of the external pointing. We found that the complete-
ness for i0 ≤ 22 mag is ∼54% for 75″ ≤ r ≤ 150″, ∼82% for
150″ ≤ r ≤ 200″, and complete for larger distances. To investi-
gate possible radial trends (Castellani et al. 2007; Sandquist
& Martel 2007), the cluster was divided into eight annuli
up to r ¼ 400″. Each annulus includes the same number of
stars (∼12; 200).The right panel of Figure 4 shows the star count ratios HB/
RGB (top), RGB/MS (middle), and HB/MS (bottom) as a func-
tion of the radial distance. Data plotted in this figure show that
the star counts are, within the errors, constant across the cluster.
To estimate the lifetime ratios of the same evolutionary phases,
we adopted for the α-enhanced models the evolutionary track of
a stellar structure with MðTOÞ=M⊙ ¼ 0:78 and ½M=H" ¼%2:10. Note that this is the TO mass of the 11 Gyr cluster iso-
chrone. For the α- and CNO-enhanced models with the same
total metallicity, we adopted the same stellar mass, while for
those with the same iron abundance (½Fe=H" ¼ %2:32), we
adopted a stellar mass of MðTOÞ=M⊙ ¼ 0:80. This is the
TO mass of the 10 Gyr cluster isochrone. The HB evolutionary
lifetime was estimated using a structure with stellar mass of
M=M⊙ ¼ 0:70. This mass value relies on the mean mass for
HB stars found by Cassisi et al. (2001) and by Cho & Lee
(2007) using synthetic HB models. Note that a change of
0:05 M⊙ has a minimal impact on the HB lifetime (3–4%).
By using the same true distance modulus and cluster reddening
adopted to estimate the cluster age, we found that observed and
predicted ratios agree quite well (1σ, see Table 1). It is worth
mentioning that the stated uncertainties in the star counts include
Poisson uncertainties and completeness uncertainties. For the
predicted ratios, we assumed an uncertainty of 10% for each
of the different evolutionary phases (Castellani et al. 2007,
and references therein).
The anonymous referee suggested that we specify the impact
of the different chemical mixtures on both the opacities and the
burning processes. To disentangle the effects, we performed a
series of numerical experiments following the approach recently
adopted by Pietrinferni et al. (2009) for a chemical composition
that is at the metal-rich end of GCs: namely, ½Fe=H" ¼%0:7 dex by Ventura et al. (2009) for the metal-intermediate
(½Fe=H" ∼ %1:2 dex) GC NGC 1851 and by Di Criscienzo et al.
(2010) for the metal-poor (½Fe=H" ∼ %2 dex) GC NGC 6397.
We performed these experiments at fixed iron content to reveal
the differential effects produced by either α-enhanced or α- plus
CNO-enhanced mixtures. The solid line and the dashed line
plotted in Figure 5 show two evolutionary tracks constructed
FIG. 4.—Left—i0,g0 % i0 CMD based on CFHT data. The dots mark the
selected HB, RGB, and MS subsamples. Right—star count ratios HB/RGB
(top), RGB/MS (middle), and HB/MS (bottom) as a function of the radial dis-
tance (r ≤ 400″). The mean values and the standard deviations are labeled. Ver-
tical dotted lines display the radial extent of the different annuli adopted to
estimate the star counts. The error bars account for Poisson and completeness
uncertainties. The two vertical arrows mark the core radius (rc ∼ 14″) and the
half-mass radius (rh ∼ 65″). See the electronic edition of the PASP for a color
version of this figure.
996 DI CECCO ET AL.
2010 PASP, 122:991–999
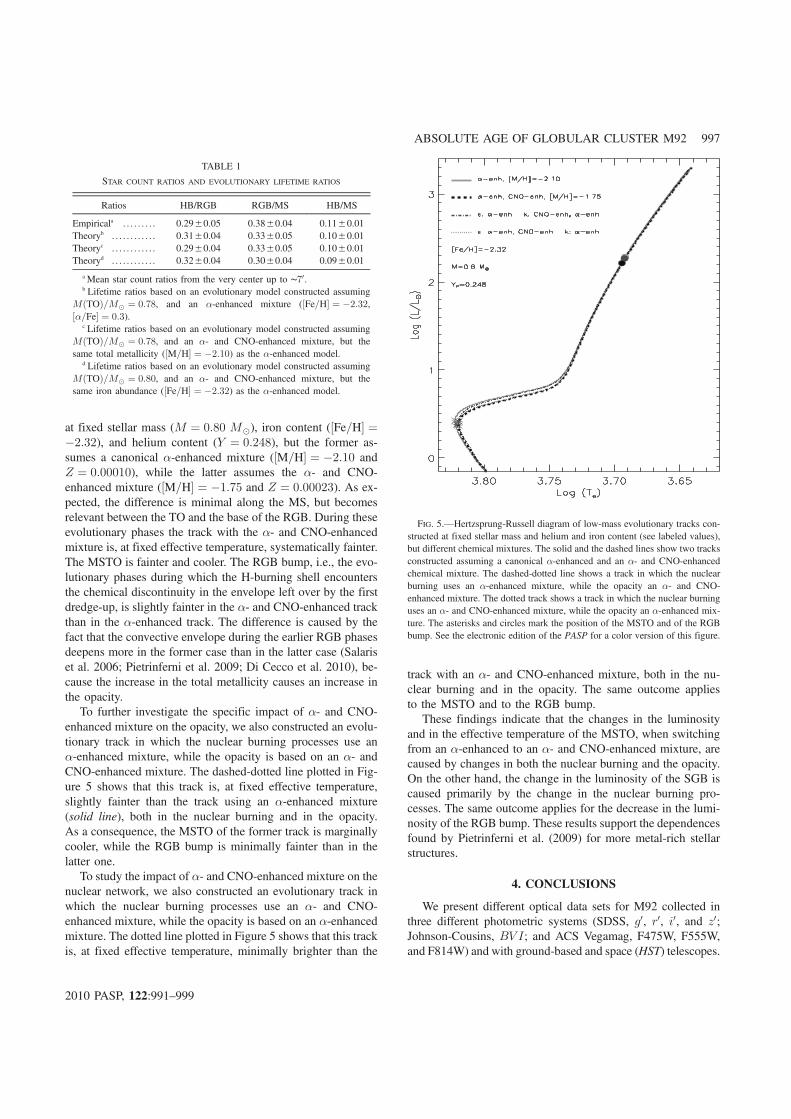
at fixed stellar mass (M ¼ 0:80 M⊙), iron content (½Fe=H" ¼%2:32), and helium content (Y ¼ 0:248), but the former as-
sumes a canonical α-enhanced mixture (½M=H" ¼ %2:10 and
Z ¼ 0:00010), while the latter assumes the α- and CNO-
enhanced mixture (½M=H" ¼ %1:75 and Z ¼ 0:00023). As ex-
pected, the difference is minimal along the MS, but becomes
relevant between the TO and the base of the RGB. During these
evolutionary phases the track with the α- and CNO-enhanced
mixture is, at fixed effective temperature, systematically fainter.
The MSTO is fainter and cooler. The RGB bump, i.e., the evo-
lutionary phases during which the H-burning shell encounters
the chemical discontinuity in the envelope left over by the first
dredge-up, is slightly fainter in the α- and CNO-enhanced track
than in the α-enhanced track. The difference is caused by the
fact that the convective envelope during the earlier RGB phases
deepens more in the former case than in the latter case (Salaris
et al. 2006; Pietrinferni et al. 2009; Di Cecco et al. 2010), be-
cause the increase in the total metallicity causes an increase in
the opacity.
To further investigate the specific impact of α- and CNO-
enhanced mixture on the opacity, we also constructed an evolu-
tionary track in which the nuclear burning processes use an
α-enhanced mixture, while the opacity is based on an α- and
CNO-enhanced mixture. The dashed-dotted line plotted in Fig-
ure 5 shows that this track is, at fixed effective temperature,
slightly fainter than the track using an α-enhanced mixture
(solid line), both in the nuclear burning and in the opacity.
As a consequence, the MSTO of the former track is marginally
cooler, while the RGB bump is minimally fainter than in the
latter one.
To study the impact of α- and CNO-enhanced mixture on the
nuclear network, we also constructed an evolutionary track in
which the nuclear burning processes use an α- and CNO-
enhanced mixture, while the opacity is based on an α-enhanced
mixture. The dotted line plotted in Figure 5 shows that this track
is, at fixed effective temperature, minimally brighter than the
track with an α- and CNO-enhanced mixture, both in the nu-
clear burning and in the opacity. The same outcome applies
to the MSTO and to the RGB bump.
These findings indicate that the changes in the luminosity
and in the effective temperature of the MSTO, when switching
from an α-enhanced to an α- and CNO-enhanced mixture, are
caused by changes in both the nuclear burning and the opacity.
On the other hand, the change in the luminosity of the SGB is
caused primarily by the change in the nuclear burning pro-
cesses. The same outcome applies for the decrease in the lumi-
nosity of the RGB bump. These results support the dependences
found by Pietrinferni et al. (2009) for more metal-rich stellar
structures.
4. CONCLUSIONS
We present different optical data sets for M92 collected in
three different photometric systems (SDSS, g0, r0, i0, and z0;
Johnson-Cousins, BV I; and ACS Vegamag, F475W, F555W,
and F814W) and with ground-based and space (HST) telescopes.
TABLE 1
STAR COUNT RATIOS AND EVOLUTIONARY LIFETIME RATIOS
Ratios HB/RGB RGB/MS HB/MS
Empiricala . . . . . . . . . 0.29±0.05 0.38±0.04 0.11±0.01
Theoryb . . . . . . . . . . . . 0.31±0.04 0.33±0.05 0.10±0.01
Theoryc . . . . . . . . . . . . 0.29±0.04 0.33±0.05 0.10±0.01
Theoryd . . . . . . . . . . . . 0.32±0.04 0.30±0.04 0.09±0.01
a Mean star count ratios from the very center up to ∼70.b Lifetime ratios based on an evolutionary model constructed assuming
MðTOÞ=M⊙ ¼ 0:78, and an α-enhanced mixture (½Fe=H" ¼ %2:32,
½α=Fe" ¼ 0:3).c Lifetime ratios based on an evolutionary model constructed assuming
MðTOÞ=M⊙ ¼ 0:78, and an α- and CNO-enhanced mixture, but the
same total metallicity (½M=H" ¼ %2:10) as the α-enhanced model.d Lifetime ratios based on an evolutionary model constructed assuming
MðTOÞ=M⊙ ¼ 0:80, and an α- and CNO-enhanced mixture, but the
same iron abundance (½Fe=H" ¼ %2:32) as the α-enhanced model.
FIG. 5.—Hertzsprung-Russell diagram of low-mass evolutionary tracks con-
structed at fixed stellar mass and helium and iron content (see labeled values),
but different chemical mixtures. The solid and the dashed lines show two tracks
constructed assuming a canonical α-enhanced and an α- and CNO-enhanced
chemical mixture. The dashed-dotted line shows a track in which the nuclear
burning uses an α-enhanced mixture, while the opacity an α- and CNO-
enhanced mixture. The dotted track shows a track in which the nuclear burning
uses an α- and CNO-enhanced mixture, while the opacity an α-enhanced mix-
ture. The asterisks and circles mark the position of the MSTO and of the RGB
bump. See the electronic edition of the PASP for a color version of this figure.
ABSOLUTE AGE OF GLOBULAR CLUSTER M92 997
2010 PASP, 122:991–999
Special attention was given to the precision of the photometric
zero points. By using the same true distance modulus and cluster
reddening, our canonical α-enhanced isochrones constructed as-
suming ½Fe=H" ¼ %2:32, ½α=Fe" ¼ 0:3, and Y ¼ 0:248 account
for the observed features in five different CMDs. We found a
cluster age of 1111 ( 1:5 Gyr, supporting previous results based
on cluster isochrones and luminosity functions. The same out-
come applies to the comparison between the HB stars and the
predicted ZAHB. We also investigated the impact of a CNO-
enriched chemical composition and we found that α- and
CNO-enhanced isochrones at fixed total metallicity ½M=H" ¼%2:10 provide, within the errors, the same cluster age. More-
over, α- and CNO-enhanced isochrones at fixed iron abundance
(½Fe=H" ¼ %2:32, ½M=H" ¼ %1:75) give a cluster age that is
minimally younger (10 ( 1:5 Gyr).
We also investigated the star count ratios for evolved (RGB,
HB) and MSTO stars. We found that they do not show any radial
trend when moving from the very center to the outermost cluster
regions. Moreover, and even more importantly, star count ratios
agree quite well (within 1σ) with the lifetime ratios of the same
evolutionary phases.
The preceding results indicate that the occurrence of CNO-
enriched subpopulations has a minimal impact on the cluster
age in the metal-poor domain. The same outcome applies to star
count ratios and evolutionary lifetimes. These findings appear
quite robust, since they rely on different photometric data sets
covering the entire body of the cluster and on the same evolu-
tionary framework.
We also note that isochrones including atomic He and metal
diffusion give cluster ages that are ≈1 Gyr younger than canon-
ical isochrones (Castellani et al. 1997). This means that current
findings support previous theoretical predictions for typical GCs
by Salaris et al. (2006) and recent age estimates for metal-poor
GCs provided by Marin-Franch et al. (2009). Finally, it is worth
emphasizing that current age estimates agree quite well with the
cluster age provided by VandenBerg et al. (2002) using an in-
dependent but similar theoretical framework. The difference is
larger than one σ only for the cluster age based on the CNO-
enhanced models computed at fixed iron content (10 ( 1:5 vs
13:5 ( 1:5 Gyr). This difference can be explained if we account
for the mild change in the shape of the SGB region of these
isochrones when compared with the canonical ones.
It is a real pleasure to thank an anonymous referee for his/her
positive comments on the results of this investigation and for
his/her suggestion. We also thank S. Cassisi and A. Pietrinferni
for several useful discussions concerning low-mass stars and
chemical mixtures. This project was partially supported by
the grant Monte dei Paschi di Siena (PI: S. Degl’Innocenti)
and PRIN-MIUR2007 (PI: G. Piotto).
REFERENCES
Angulo, C., et al. 1999, Nucl. Phys. A, 656, 3
Asplund, M., Grevesse, N., & Sauval, A. J. 2005, in ASP Conf. Ser.
336, Cosmic Abundances as Records of Stellar Evolution and
Nucleosynthesis, ed. F. N., Bash, & T. J., Barnes (San Francisco:
ASP), 25 (AG05)
Bahcall, J. N., Pinsonneault, M. H., & Wasserburg, G. J. 1995,
RevModPhys, 67, 781
Bazzano, A., Caputo, F., Sestili, M., & Castellani, V. 1982, A&A,
111, 312
Bellman, S., Briley, M. M., Smith, G. H., & Claver, C. F. 2001, PASP,
113, 326
Bohm-Vitense, E. 1958, Z. Astrophys., 46, 108
Bono, G., et al. 2008, ApJ, 686, 87
Bono, G., Caputo, F., Castellani, V., Marconi, M., & Storm, J. 2001,
MNRAS, 326, 1183
Brott, I., & Hauschildt, P. H. 2005, ESASP, 576, 565
Caffau, E., et al. 2010, A&A, 514, 92
Cannon, R. D., Croke, B. F. W., Bell, R. A., Hesser, J. E., & Stathakis,
R. A. 1998, MNRAS, 298, 601
Carbon, D. F., Romanishin, W., Langer, G. E., Butler, D., Kemper, E.,
Trefzger, C. F., Kraft, R. P., & Suntzeff, N. B. 1982, ApJS, 49,
207
Cardelli, J. A., Clayton, G. C., & Mathis, J. S. 1989, IAUS, 135,
5
Carretta, E., Bragaglia, A., Gratton, R., D’Orazi, V., & Lucatello, S.
2009, A&A, 508, 695
Carretta, E., Bragaglia, A., Gratton, R. G., Lucatello, S., & Momany, Y.
2007, A&A, 464, 927
Carretta, E., Gratton, R. G., Clementini, G., & Fusi Pecci, F. 2000, ApJ,
533, 215
Carretta, E., Gratton, R. G., Lucatello, S., Bragaglia, A., & Bonifacio,
P. 2005, A&A, 433, 597
Cassisi, S., Castellani, M., Caputo, F., & Castellani, V. 2004, A&A,
426, 641
Cassisi, S., Castellani, V., Degl’Innocenti, S., Piotto, G., & Salaris, M.
2001, A&A, 366, 578
Cassisi, S., Salaris, M., Pietrinferni, A., Piotto, G., Milone, A. P.,
Bedin, L. R., & Anderson, J. 2008, ApJ, 672, L115
Castellani, V., et al. 2007, ApJ, 663, 1021
Castellani, V., Ciacio, F., degl’Innocenti, S., & Fiorentini, G. 1997,
A&A, 322, 801
Castelli, F., & Kurucz, R. L. 2003, IAUS, 210, A20
Catelan, M. 2004, ASPC, 310, 113
Chieffi, A., & Straniero, O. 1989, ApJS, 71, 47
Cho, D. H., & Lee, S. G. 2007, AJ, 133, 2163
Clem, J. L., VandenBerg, D. A., & Stetson, P. B. 2007, AJ, 134, 1890
Cohen, J. G. 1978, ApJ, 223, 487
D’Antona, F., & Caloi, V. 2008, MNRAS, 390, 693
Decressin, T., Meynet, G., Charbonnel, C., Prantzos, N., & Ekström, S.
2007, A&A, 464, 1029
Degl’Innocenti, S., Prada Moroni, P. G., Marconi, M., & Ruoppo, A.
2008, Ap&SS, 316, 215
Del Principe, M., et al. 2006, ApJ, 652, 362
Del Principe, M., Piersimoni, A. M., Bono, G., Di Paola, A., Dolci, M.,
& Marconi, M. 2005, AJ, 129, 2714
Denissenkov, P. A., & Weiss, A. 2004, ApJ, 603, 119
998 DI CECCO ET AL.
2010 PASP, 122:991–999
Di Cecco, A., et al. 2010, ApJ, 712, 527
Di Criscienzo, M., D’Antona, F., & Ventura, P. 2010, A&A, 511, 70
Ferguson, J. W., Alexander, D. R., Allard, F., Barman, T., Bodnarik,
J. G., Hauschildt, P. H., Heffner-Wong, A., & Tamanai, A. 2005,
ApJ, 623, 585
Formicola, A., et al. 2004, Phys. Lett. B, 591, 61
Gratton, R. G., et al. 2001, A&A, 369, 87
Gratton, R. G., Bragaglia, A., Carretta, E., Clementini, G., Desidera, S.,
Grundahl, F., & Lucatello, S. 2003, A&A, 408, 529
Gratton, R. G., Fusi Pecci, F., Carretta, E., Clementini, G., Corsi, C. E.,
& Lattanzi, M. 1997, ApJ, 491, 749
Gratton, R., Sneden, C., & Carretta, E. 2004, A&S, 42, 385
Grevesse, N., & Sauval, A. J. 1999, A&A, 347, 348
Grundahl, F., VandenBerg, D. A., Bell, R. A., Andersen, M. I., &
Stetson, P. B. 2000, AJ, 120, 1884
Guzik, J. A., Watson, L. S., & Cox, A. N. 2005, ApJ, 627, 1049
Hack, W. J., & Greenfield, P. 2000, ASPC, 216, 433
Harbeck, D., Grebel, E. K., & Smith, G. H. 2003, ANS, 324, 78
Harris, W. E. 1996, AJ, 112, 1487
Iglesias, C., & Rogers, F. J. 1996, ApJ, 464, 943
Imbriani, G., et al. 2004, A&A, 420, 625
Izotov, Y. I., Thuan, T. X., & Stasińska, G. 2007, ApJ, 662, 15
Kraft, R. P. 1994, PASP, 106, 553
Kraft, R. P., & Ivans, I. I. 2003, PASP, 115, 143
———. 2004, preprint (arXiv:astro-ph/0305380v1)
Landolt, A. U. 1992, AJ, 104, 340
Langer, G. E., Kraft, R. P., Carbon, D. F., Friel, E., & Oke, J. B. 1986,
PASP, 98, 473
Leep, E. M., Wallerstein, G., & Oke, J. B. 1986, AJ, 91, 1117
Maeder, A., & Meynet, G. 2006, A&A, 448, L37
Magnier, E. A., & Cuillandre, J.-C. 2004, PASP, 116, 449
Marin-Franch, A., et al. 2009, ApJ, 694, 1498
Norris, J., Cottrell, P. L., Freeman, K. C., & Da Costa, G. S. 1981, ApJ,
244, 205
Osborn, W. 1971, Observatory, 91, 223
Paust, N. E. Q., Chaboyer, B., & Sarajedini, A. 2007, AJ, 133, 2787
Peimbert, M., Luridiana, V., Peimbert, A., & Carigi, L. 2007, in ASP
Conf. Ser. 374, From Stars to Galaxies: Building the Pieces to Build
up the Universe, ed. A. Vallenari, R. Tantalo, L. Portinari, &
A. Moretti (San Francisco: ASP) 374 81
Peterson, R. C. 1980, ApJ, 237, 87
Pietrinferni, A., Cassisi, S., Salaris, M., Percival, S., & Ferguson, J. W.
2009, ApJ, 697, 275
Pilachowski, C. A., Bothun, G. D., Olszewski, E. W., & Odell, A. 1983,
ApJ, 273, 187
Piotto, G., et al. 2007, ApJ, 661, L53
Potekhin, A. Y. 1999, A&A, 351, 787
Prantzos, N., & Charbonnel, C. 2006, A&A, 458, 135
Ramirez, S. V., & Cohen, J. G. 2002, AJ, 123, 3277
Renzini, A. 1991, Observational Test of Cosmological Inflation,
ed. T., Shanks, A. J., Banday, & R. S., Ellis (Dordrecht: Kluwer), 131
Salaris, M., Chieffi, A., & Straniero, O. 1993, ApJ, 414, 580
Salaris, M., & Weiss, A. 2002, A&A, 388, 492
Salaris, M., Weiss, A., Ferguson, J. W., & Fusilier, D. J. 2006, ApJ,
645, 1131
Sandquist, E. L., & Martel, A. R. 2007, ApJ, 654, L65
Schlegel, D. J., Finkbeiner, D. P., & Davis, M. 1998, ApJ, 500, 525
Shternin, P. S., & Yakovlev, D. G. 2006, PhRvD, 74, 3004
Sirianni, M., et al. 2005, PASP, 117, 1049
Smith, G. H. 1987, PASP, 99, 67
Sneden, C., Kraft, R. P., Prosser, C. F., & Langer, G. E. 1991, AJ,
102, 2001
Sollima, A., Cacciari, C., & Valenti, E. 2006, MNRAS, 372, 1675
Stetson, P. B. 1987, PASP, 99, 191
———. 1994, PASP, 106, 250
———. 2000, PASP, 112, 925
———. 2005, PASP, 117, 563
Stetson, P. B., Bruntt, H., & Grundahl, F. 2003, PASP, 115, 413
Stetson, P. B., McClure, R. D., & VandenBerg, D. A. 2004, PASP,
116, 1012
Suntzeff, N. B., & Smith, V. V. 1991, ApJ, 381, 160
Thoul, A., Bahcall, J., & Loeb, A. 1994, ApJ, 421, 828
VandenBerg, D. A. 1985, in Proc. ESO Workshop 21, Production and
Distribution of C, N, O Elements, ed. I. J., Danziger, F., Matteucci, &
K., Kjar (Garching: ESO), 73
VandenBerg, D. A., Richard, O., Michaud, G., & Richer, J. 2002, ApJ,
571, 487
Ventura, P., Caloi, V., D’Antona, F., Ferguson, J., Milone, A., & Piotto,
G. P. 2009, MNRAS, 399, 934
Ventura, P., D’Antona, F., Mazzitelli, I., & Gratton, R. 2001, ApJ,
550, L65
Zinn, R. 1985, ApJ, 293, 424
ABSOLUTE AGE OF GLOBULAR CLUSTER M92 999
2010 PASP, 122:991–999