Embed Size (px)
Citation preview

University of Illinois Extension • College of Agricultural, Consumer and Environmental Sciences • Department of Crop Sciences 1
2005 Annual summary of field crop insect management trials, Department of Crop Sciences, University of Illinoison Targeton Target
ACKNOWLEDGMENTSTrials conducted by the Insect Management and Insecticide Efficacy Program at the University of Illinois are the result of the collaborative efforts of many individuals. We extend our gratitude to all those who worked with and supported us in 2005.
Graduate Research Assistants
Darren Bakken
Technical Assistance and Support
Martin Bohn and Crew
Joel Cioni
Kelly Cook
Eric DeWerff
Yale Eppler
Ralph Esgar
Lowell Estes
Doug Franzen
Dan Lamoreux
Sandy Osterbur
Kris Ritter
Nick Tinsley
Corey Zelhart
Research and Education Centers
Eric Adee
Robert Dunker
Michael Kleiss
Larry Meyer
Lyle Paul
University of Illinois Extension
Mark Hoard
Robert Bellm
Dennis Epplin
Cooperators
David & Carol Cook
Ken Dalenberg
Terry Wolf
Jack Sailer
Kenny Waier
Steve Martin
Brian & Mark Meharry
Supporting Organizations
AgraQuest
Amvac Chemical Corporation
BASF
Bayer Crop Science
Cheminova
Dow AgroSciences
DuPont Crop Protection
Golden Harvest Seeds
Helena Chemical Company
Illinois Foundation Seeds
Illinois Soybean Program Operating Board (ISPOB)
Langille Consulting
Monsanto
Pioneer Hi-Bred International
Syngenta Crop Protection
Valent

University of Illinois Extension • College of Agricultural, Consumer and Environmental Sciences • Department of Crop Sciences 2
2005 Annual summary of field crop insect management trials, Department of Crop Sciences, University of Illinoison Targeton Target
TABLE OF CONTENTS
CORNSECTION 1 Evaluation of products to control corn rootworm larvae (Diabrotica spp.) in Illinois, 2005 . . . . . . . . . . . .3
SECTION 2 Comparison of YieldGard Rootworm hybrids to control corn rootworm larvae (Diabrotica spp.) in Illinois, 2005 . . . . . . . . . . . 9
SECTION 3 Evaluation of liquid Force to control corn rootworm larvae (Diabrotica spp.) in Illinois, 2005 . . . . . . . .11
SECTION 4 Evaluation of insecticidal seed treatments and granular insecticides to control corn rootworm larvae (Diabrotica spp.) in Illinois, 2005 . . . . . . . . . . . . . . . . . . . . . . . . . . . . . . . . . . . . . . . . . . . . . . . . . . . . . .13
SECTION 5 Evaluation of Herculex RW Bt and granular insecticides to control corn rootworm larvae (Diabrotica spp.) in Illinois, 2005 . . . . . . . . . . . . . . . . . . . . . . . . . . . . . . . . . . . . . . . . . . . . . . . . . . . . . . . . . . .15
SECTION 6 Evaluation of Herculex RW Bt and granular insecticides to control corn rootworm larvae (Diabrotica spp.), and their effects on emergence of corn rootworm adults in Illinois, 2005 . . . . . . . . . .16
SECTION 7 Evaluation of Herculex RW Bt and granular insecticides to control corn rootworm larvae (Diabrotica spp.) in Illinois, 2005 . . . . . . . . . . . . . . . . . . . . . . . . . . . . . . . . . . . . . . . . . . . . . . . . . . . . . . . . . . .18
SECTION 8 Evaluation of insecticides to control Japanese beetle grubs (Popilla japonica Newman) in Illinois, 2005 . . . . . . . . . . 20
SECTION 9 Evaluation of insecticides to control Japanese beetle grubs (Popilla japonica Newman) in Illinois, 2005 . . . . . . . . . . 22
SOYBEANSSECTION 10 Evaluation of foliar applied insecticides to control soybean aphids (Aphis glycines Matsumura)
in Illinois, 2005 . . . . . . . . . . 24
SECTION 11 Evaluation of insecticidal seed treatments to control soybean aphids (Aphis glycines Matsumura) in Illinois, 2005 . . . . . . . . . . 27
SECTION 12 Evaluation of insecticidal seed treatments and foliar applied insecticides to control soybean aphids (Aphis glycines Matsumura) in Illinois, 2005 . . . . . . . . . . . . . . . . . . . . . . . . . . . . . . . . . . . . . . . . . . . .29
SECTION 13 Evaluation of foliar applied insecticides to control twospotted spider mites (Tetranychus urticae) in soybean in Illinois, 2005 31
SWEET CORNSECTION 14 Evaluation of foliar applied insecticides to control corn earworm (Helicoverpa zea Boddie) in
sweet corn in Illinois, 2005 33
APPENDIXAPPENDIX I Temperature and Precipitation . . . . . . . . . . . . . . . . . . . . . . . . . . . . . . . . . . . . . . . . . . . . . . . . . . . . . . . . . . . . .35

CORN
University of Illinois Extension • College of Agricultural, Consumer and Environmental Sciences • Department of Crop Sciences 3
on Targeton Target 2005 Annual summary of field crop insect management trials, Department of Crop Sciences, University of Illinois
SECTION 1
Evaluation of products to control corn rootworm larvae (Diabrotica spp.) in Illinois, 2005Ronald E. Estes, Jared B. Schroeder, Kevin L. Steffey, and Michael E. Gray
Location
We established three trials on University of Illinois research and education centers near DeKalb, Monmouth, and Urbana.
Experimental Design and Methods
The experimental design was a randomized complete block with four replications. The plot size for each treatment was 10 feet x 45 feet. Five randomly selected root systems were extracted from the first row of each four-row plot on 13, 25, and 26 July at Urbana, Monmouth, and DeKalb, respectively. The root systems were washed and rated for rootworm larval injury. Node-injury ratings are based upon the 0–3 node-injury scale developed by Oleson et al. (2005). The center two rows of each plot were mechanically harvested at DeKalb and Monmouth on 13 October and 14 October, respectively. Due to weed control issues and high weed competition, yield data were not taken at the Urbana location. Weights and grain moisture were used to determine corn yields in bushels per acre at 15% grain moisture. Percentage consistency (percentage
of roots with a rating less than 1.0) was determined for each product at each location.
Planting and Insecticide Application
Trials were planted using a four-row, Almaco-constructed planter with John Deere 7300 row units. Precision Planting finger pick-up style metering units were used. Granular insecticides were applied through modified Noble metering units or through modified SmartBox metering units mounted to each row. Plastic insecticide tubes directed the granular treatments to either a 5-inch, slope-compensating bander or to the seed furrow. Capture 2EC, Lorsban 4E, and Lorsban 75WG were applied at a spray volume of 5 gallons per acre using a CO2 system with TeeJet 8001VS spray tips attached to stainless steel drop tubes. Regent was applied through microtubes in-furrow at a spray volume of 3 gallons per acre using a CO2 system. All insecticides were applied in front of the firming wheels on the planter. Cable-mounted tines were attached behind each of the row units to improve insecticide incorporation.
Agronomic Information
Agronomic information for all three trials is listed in Table 1.1.
Climatic Conditions
Temperature and precipitation data for all three locations are presented in Appendix I.
TABLE 1.1 • Agronomic factors for efficacy trials of products to control corn rootworm larvae, University of Illinois, 2005
DeKalb Monmouth Urbana
Planting date 27 April, 2005 28 April, 2005 3 May, 2005
Root evaluation date 26 July, 2005 25 July, 2005 13 July, 2005
Hybrid1 Asgrow RX718YGPLAsgrow RX718YG
Asgrow RX718YGPLAsgrow RX718YG
Asgrow RX718YGPLAsgrow RX718YG
Row spacing 30 inches 30 inches 30 inches
Seeding rate 33,000/acre 33,000/acre 33,000/acre
Previous crop Trap crop (late-planted corn andpumpkins)
Trap crop (late-planted corn andpumpkins)
Trap crop (late-planted corn andpumpkins)
Tillage Fall—chisel plowSpring—field cultivator
Fall—chisel plowSpring—field cultivator
Fall—moldboardplowSpring—field cultivator
1 We planted Asgrow RX 718YG Plus (corn borer and rootworm Bt) as our YGRW hybrid. All other treatments were applied to Asgrow RX 718YG Corn Borer (the non-rootworm trait isoline of Asgrow RX 718YG Plus).

CORN
University of Illinois Extension • College of Agricultural, Consumer and Environmental Sciences • Department of Crop Sciences 4
on Targeton Target 2005 Annual summary of field crop insect management trials, Department of Crop Sciences, University of Illinois
Statistical Analysis
Data were analyzed using ARM 7 (Agricultural Research Manager), revision 7.0.5. (Copyright© 1982–2003 Gylling Data Management, Inc.).
Results and Discussion
We were informed by representatives of Syngenta that they erred when ordering the Cruiser Extreme-treated seed to be used in our standard corn rootworm control products efficacy trials in 2005. Instead of sending us seed treated with 1.25 milligrams of thiamethoxam (active ingredient of Cruiser) per kernel, they sent us seed treated with 0.25 milligram of thiamethoxam per kernel. The rootworm-control rate is 1.25 milligrams of thiamethoxam per kernel. Consequently, the seed planted in our trials was not seed treated with the rootworm-control rate, so this factor should be considered when interpreting the results from our trials at DeKalb, Monmouth and Urbana.
DeKalb—Table 1.2 shows the node-injury ratings, consistency percentages, and average yield in bushels per acre for each treatment applied in our trial located near DeKalb. The mean node-injury rating in the untreated check was 2.37 (over two nodes of roots destroyed), indicating that rootworm larval feeding injury was severe. Although the mean node-injury ratings for many of the treatments were significantly lower than the mean node-injury rating for the untreated check, severe rootworm feeding injury was observed in several treatments. The mean node-injury ratings for all of the experimental “NEI” treatments and the Cruiser Extreme (0.25 mg) treatment were not significantly different from than the untreated check. In general, all registered product treatments had acceptable levels of control (less than one node destroyed) with the exception of Capture (0.37 oz), Cruiser Extreme (0.25 mg), Lorsban 75WG (1.2 oz), and Regent (0.24 oz).
The percentage consistency ranged from 0 to 100 percent, indicating a high degree of variability in product performance. The level of consistency was acceptable (80% or above) in many treatments with the exception of Aztec 4.67G (75%), Capture 2EC (30%), Cruiser Extreme 0.25 (0%), Lorsban 75WG (50%), Poncho 1250 (65%), Regent 4SC (35%), YGRW (60%), and all of the “NEI” treatments (0 – 10%).
Average yields in DeKalb ranged from 208.11 (YGRW) to 81.89 (NEI-25050-2) bushels per acre. YGRW yielded significantly better than all of the treatments except Force 3G
(190.57), Fortress 2.5G (189.06), and Nufos 15G (184.62). Yields for the Cruiser treatment and each of the NEI treatments were either not significantly different or significantly less than the untreated check (123.75). None of the granular insecticide treatments (Aztec 2.1G, Aztec 4.67G, Force 3G, Force 3G applied with a SmartBox, Fortress 2.5G, Fortress 5G applied with a SmartBox, Defcon2.1G applied in a band or in-furrow, Lorsban 15G, and Nufos 15G) significantly differed in yield from one another. Also, the addition of Poncho 250 or 1250 with an application of Aztec did not show a significant improvement in performance compared with using Aztec 2.1G alone. Although the yields in the three liquid treatments (Capture 2EC, Lorsban 4E, and Regent 4SC) did not differ significantly form the yields in the granular products, the trend was for lower yields, especially with Regent 4SC.
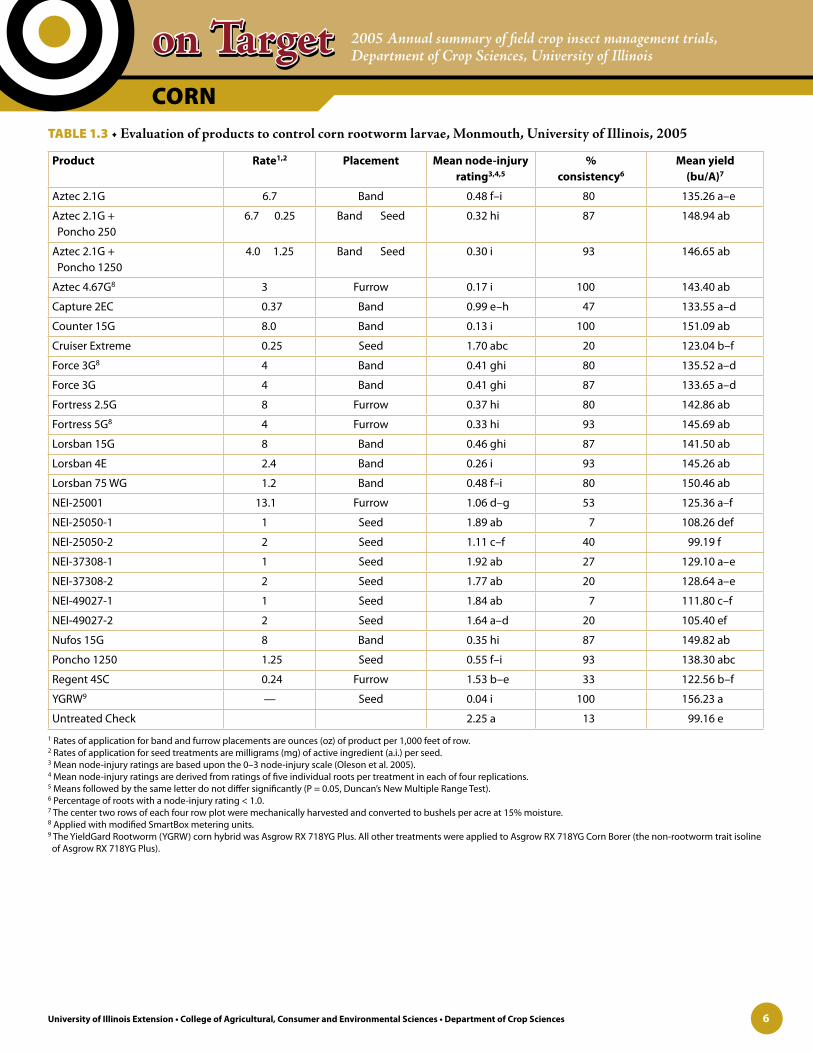
Monmouth—Table 1.3 shows the mean node-injury ratings, consistency percentages and average yield in bushels per acre for each treatment applied in our trial located near Monmouth. The mean node-injury rating in the untreated check was 2.25 (two and one-quarter nodes of roots destroyed), indicating that rootworm larval feeding injury was severe. The mean node-injury ratings for four of the six experimental “NEI” treatments and the Cruiser Extreme (0.25 mg) treatment were not significantly better than the untreated check.
The percentage consistency ranged from 7 to 100 percent, indicating a high degree of variability in product performance. The level of consistency was acceptable (80% or above) in all treatments except Capture 2EC (47%), Cruiser Extreme 0.25 (20%), Regent 4SC (33%), and all of the “NEI” treatments (7 – 53%).
Average yields (bushels per acre) at our Monmouth location ranged from 99.16 (untreated check) to 156.23 (YGRW). Cruiser Extreme (0.25 mg), NEI 25050-1, NEI 25050-2, NEI 49027-1, NEI 49027-2, and the untreated check all had significantly lower yields than the YGRW treatment.
Urbana—Table 1.4 shows the mean node-injury ratings and percentage consistency for each treatment applied in our trial near Urbana. The mean node-injury rating in the untreated check was 2.32 (over two nodes of roots destroyed), indicating that rootworm larval feeding injury was severe. Mean node-injury ratings for all treatments were significantly lower than the mean node-injury rating for the untreated check, with the exception of the Regent 4SC (0.24 oz) and Cruiser Extreme (0.25 mg) treatments. Roots from the Poncho 1250 and

CORN
University of Illinois Extension • College of Agricultural, Consumer and Environmental Sciences • Department of Crop Sciences 5
on Targeton Target 2005 Annual summary of field crop insect management trials, Department of Crop Sciences, University of Illinois
TABLE 1.2 • Evaluation of products to control corn rootworm larvae, DeKalb, University of Illinois, 2005
Product Rate1,2 Placement Mean node-injury rating3,4,5
%consistency6
Mean yield(bu/A)7
Aztec 2.1G 6.7 Band 0.29 ef 80 180.58 bcd
Aztec 2.1G + Poncho 250
6.70.25
BandSeed
0.18 f 100 174.43 bcd
Aztec 2.1G + Poncho 1250
4.01.25
BandSeed
0.28 ef 95 179.71 bcd
Aztec 4.67G8 3 Furrow 0.22 f 75 169.69 bcd
Capture 2EC 0.37 Band 1.44 b 30 175.09 bcd
Cruiser Extreme 0.25 Seed 2.74 a 0 117.95 ef
Force 3G8 4 Band 0.38 def 95 179.61 bcd
Force 3G 4 Band 0.47 def 90 190.57 ab
Fortress 2.5G 8 Furrow 0.20 f 90 189.06 abc
Fortress 5G8 4 Furrow 0.36 def 90 179.64 bcd
Defcon 2.1G 6.7 Band 0.36 def 95 175.87 bcd
Defcon 2.1G 6.7 Furrow 0.23 ef 100 177.16 bcd
Lorsban 15G 8 Band 0.29 ef 100 172.94 bcd
Lorsban 4E 2.4 Band 0.49 def 85 161.68 cd
Lorsban 75 WG 1.2 Band 1.40 bc 50 162.01 bcd
NEI-25001 13.1 Furrow 2.54 a 10 110.69 ef
NEI-25050-1 1 Seed 2.95 a 0 108.58 efg
NEI-25050-2 2 Seed 2.58 a 5 81.89 g
NEI-37308-1 1 Seed 2.61 a 5 94.85 fg
NEI-37308-2 2 Seed 2.66 a 0 102.10 efg
NEI-49027-1 1 Seed 2.93 a 0 96.48 fg
NEI-49027-2 2 Seed 2.66 a 0 100.36 efg
Nufos 15G 8 Band 0.31 def 95 184.62 a–d
Poncho 1250 1.25 Seed 0.78 cd 65 173.97 bcd
Regent 4SC 0.24 Furrow 1.64 b 35 160.27 d
YGRW9 — Seed 0.70 de 60 208.11 a
Untreated check — — 2.37 a 10 123.75 e
1 Rates of application for band and furrow placements are ounces (oz) of product per 1,000 feet of row.2 Rates of application for seed treatments are milligrams (mg) of active ingredient (a.i.) per seed.3 Mean node-injury ratings are based upon the 0–3 node-injury scale (Oleson et al. 2005).4 Mean node-injury ratings are derived from ratings of five individual roots per treatment in each of four replications.5 Means followed by the same letter do not differ significantly (P = 0.05, Duncan’s New Multiple Range Test).6 Percentage of roots with a node-injury rating < 1.0.7 The center two rows of each four row plot were mechanically harvested and converted to bushels per acre at 15% moisture.8 Applied with modified SmartBox metering units.9 The YieldGard Rootworm (YGRW) corn hybrid was Asgrow RX 718YG Plus. All other treatments were applied to Asgrow RX 718YG Corn Borer (the non-rootworm trait isoline of Asgrow RX 718YG Plus).
CORN
University of Illinois Extension • College of Agricultural, Consumer and Environmental Sciences • Department of Crop Sciences 6
on Targeton Target 2005 Annual summary of field crop insect management trials, Department of Crop Sciences, University of Illinois
TABLE 1.3 • Evaluation of products to control corn rootworm larvae, Monmouth, University of Illinois, 2005
Product Rate1,2 Placement Mean node-injury rating3,4,5
%consistency6
Mean yield(bu/A)7
Aztec 2.1G 6.7 Band 0.48 f–i 80 135.26 a–e
Aztec 2.1G + Poncho 250
6.7 0.25 Band Seed 0.32 hi 87 148.94 ab
Aztec 2.1G + Poncho 1250
4.0 1.25 Band Seed 0.30 i 93 146.65 ab
Aztec 4.67G8 3 Furrow 0.17 i 100 143.40 ab
Capture 2EC 0.37 Band 0.99 e–h 47 133.55 a–d
Counter 15G 8.0 Band 0.13 i 100 151.09 ab
Cruiser Extreme 0.25 Seed 1.70 abc 20 123.04 b–f
Force 3G8 4 Band 0.41 ghi 80 135.52 a–d
Force 3G 4 Band 0.41 ghi 87 133.65 a–d
Fortress 2.5G 8 Furrow 0.37 hi 80 142.86 ab
Fortress 5G8 4 Furrow 0.33 hi 93 145.69 ab
Lorsban 15G 8 Band 0.46 ghi 87 141.50 ab
Lorsban 4E 2.4 Band 0.26 i 93 145.26 ab
Lorsban 75 WG 1.2 Band 0.48 f–i 80 150.46 ab
NEI-25001 13.1 Furrow 1.06 d–g 53 125.36 a–f
NEI-25050-1 1 Seed 1.89 ab 7 108.26 def
NEI-25050-2 2 Seed 1.11 c–f 40 99.19 f
NEI-37308-1 1 Seed 1.92 ab 27 129.10 a–e
NEI-37308-2 2 Seed 1.77 ab 20 128.64 a–e
NEI-49027-1 1 Seed 1.84 ab 7 111.80 c–f
NEI-49027-2 2 Seed 1.64 a–d 20 105.40 ef
Nufos 15G 8 Band 0.35 hi 87 149.82 ab
Poncho 1250 1.25 Seed 0.55 f–i 93 138.30 abc
Regent 4SC 0.24 Furrow 1.53 b–e 33 122.56 b–f
YGRW9 — Seed 0.04 i 100 156.23 a
Untreated Check 2.25 a 13 99.16 e
1 Rates of application for band and furrow placements are ounces (oz) of product per 1,000 feet of row.2 Rates of application for seed treatments are milligrams (mg) of active ingredient (a.i.) per seed.3 Mean node-injury ratings are based upon the 0–3 node-injury scale (Oleson et al. 2005).4 Mean node-injury ratings are derived from ratings of five individual roots per treatment in each of four replications.5 Means followed by the same letter do not differ significantly (P = 0.05, Duncan’s New Multiple Range Test).6 Percentage of roots with a node-injury rating < 1.0.7 The center two rows of each four row plot were mechanically harvested and converted to bushels per acre at 15% moisture.8 Applied with modified SmartBox metering units.9 The YieldGard Rootworm (YGRW) corn hybrid was Asgrow RX 718YG Plus. All other treatments were applied to Asgrow RX 718YG Corn Borer (the non-rootworm trait isoline of Asgrow RX 718YG Plus).

CORN
University of Illinois Extension • College of Agricultural, Consumer and Environmental Sciences • Department of Crop Sciences 7
on Targeton Target 2005 Annual summary of field crop insect management trials, Department of Crop Sciences, University of Illinois
TABLE 1.4 • Evaluation of products to control corn rootworm larvae, Urbana, University of Illinois, 2005
Product Rate1,2 Placement Mean node-injury rating3,4,5,6
% consistency7
Aztec 2.1G 6.7 Band 0.32 efg 100
Aztec 2.1G + Poncho 250
6.70.25
BandSeed
0.27 efg 100
Aztec 2.1G + Poncho 1250
4.01.25
BandSeed
0.30 efg 100
Aztec 4.67G8 3 Furrow 0.33 efg 90
Capture 2EC 0.37 Band 1.46 b 15
Counter 15G 8.0 Band 0.45 efg 85
Cruiser Extreme 0.25 Seed 2.34 a 5
Force 3G8 4 Band 0.52 d–g 85
Force 3G 4 Band 0.48 d–g 85
Fortress 2.5G 8 Furrow 0.20 fg 100
Fortress 5G8 4 Furrow 0.14 g 100
Defcon 2.1G 6.7 Band 0.22 fg 95
Defcon 2.1G 6.7 Furrow 0.28 efg 95
Lorsban 15G 8 Band 0.66 de 80
Lorsban 4E 2.4 Band 0.91 cd 60
Lorsban 75 WG 1.2 Band 1.33 bc 35
Nufos 15G 8 Band 0.53 def 90
Poncho 1250 1.25 Seed 1.21 bc 35
Regent 4SC 0.24 Furrow 2.25 a 5
YGRW9 — Seed 0.19 fg 100
Untreated check — — 2.32 a 10
1 Rates of application for band and furrow placements are ounces (oz) of product per 1,000 feet of row.2 Rates of application for seed treatments are milligrams (mg) of active ingredient (a.i.) per seed.3 Mean node-injury ratings are based upon the 0–3 node-injury scale (Oleson et al. 2005).4 Mean node-injury ratings are derived from ratings of five individual roots per treatment in each of four replications.5 Data were transformed (√x + 0.5) for analysis. Means followed by the same letter do not differ significantly (P = 0.05, Duncan’s New Multiple Range Test).6 Statistical analyses on transformed data; actual means are shown. 7 Percentage of roots with a node-injury rating < 1.0.8 Applied with modified SmartBox metering units.9 The YieldGard Rootworm (YGRW) corn hybrid was Asgrow RX 718YG Plus. All other treatments were applied to Asgrow RX 718YG Corn Borer (the non-rootworm trait isoline of Asgrow RX 718YG Plus).
Capture 2EC (0.37 oz) treatments had significantly more injury than any of the granular insecticides.
The consistency percentages ranged from 5 to 100 percent, indicating a high degree of variability in product performance. The level of consistency was acceptable (80% or above) in all treatments except Capture 2EC (15%), Cruiser Extreme 0.25 (5%), Lorsban 75WG (35%), Poncho 1250 (35%), and Regent 4SC (5%).
Due to weed control problems and intense weed/crop competition, yield data were not collected at the Urbana location.
Overall Summary of 2005 Root Rating Results
Root injury in our untreated checks at DeKalb, Monmouth, and Urbana was severe and nearly identical, 2.37, 2.25, and 2.32, respectively. These node-injury rating averages indicate

CORN
University of Illinois Extension • College of Agricultural, Consumer and Environmental Sciences • Department of Crop Sciences 8
on Targeton Target 2005 Annual summary of field crop insect management trials, Department of Crop Sciences, University of Illinois
that 2⅓ of nodes were destroyed on plants within our check treatment at each site.
• The granular soil insecticides performed very well under intense corn rootworm larval pressure. At each location, root injury was almost always below a rating of 0.5 (one half node of roots pruned). Differences in root protection among the granular insecticides were generally insignificant.
• Node-injury averages (at each location) in the Poncho 250 and 1250 plus Aztec 2.1G treatments were not statistically different from each other or the Aztec 2.1G or Aztec 4.67G treatments.
• Node-injury averages in the Capture 2EC (DeKalb, 1.44; Monmouth, 0.99; and Urbana, 1.46) and Regent 4SC treatments (1.64, 1.53, and 2.25) were not satisfactory. Although Lorsban 4E performed better in DeKalb (0.49, ½ node destroyed) and Monmouth (0.26, ¼ node destroyed), nearly a full node (0.91) of roots with this treatment was pruned in Urbana. The Lorsban 75WG treatment had root injury that nearly equaled 1 ½ nodes of roots pruned in both DeKalb and Urbana. In Monmouth, approximately ½ node of roots was pruned in this treatment.
• The Poncho 1250 treatment provided statistically better root protection than the check in each of the experiments.
Root pruning in the Poncho 1250 treatment at DeKalb was slightly less than 1 node of roots pruned (0.78), whereas in Urbana, slightly more than 1 node of roots were pruned (1.21). In Monmouth, approximately ½ node (0.55) of roots was pruned in the Poncho 1250 treatment.
• The YieldGard Rootworm (MON 863) treatment in Monmouth (0.04) and Urbana (0.19) provided excellent root protection through 25 and 13 July, respectively. In DeKalb, more root pruning (as of 26 July), particularly on brace roots, was observed in the YieldGard Rootworm treatment with nearly ¾ of a node (0.7) destroyed.
Overall, these results are somewhat similar to what we have observed in previous years for a number of the treatments. Despite the very hot temperatures and somewhat dry soil conditions (especially at DeKalb and Monmouth through the first-half of the summer), the granular products provided very good to excellent root protection.
Reference Cited
Oleson, J. D., Y. L. Park, T. M. Nowatzki, and J. J. Tollefson. 2005. Node-injury scale to evaluate root injury by corn rootworms (Coleoptera: Chrysomelidae). Journal of Economic Entomology 98: 1–8.

CORN
University of Illinois Extension • College of Agricultural, Consumer and Environmental Sciences • Department of Crop Sciences 9
on Targeton Target 2005 Annual summary of field crop insect management trials, Department of Crop Sciences, University of Illinois
SECTION 2
Comparison of YieldGard Rootworm hybrids to control corn rootworm larvae (Diabrotica spp.) in Illinois, 2005Michael E. Gray, Ronald E. Estes, Jared B. Schroeder, and Kevin L. Steffey
Location
We established one trial at the University of Illinois Agricultural Engineering Farm near Urbana.
Experimental Design and Methods
With the cooperation of Monsanto Company, we evaluated the root protection offered by nine YieldGard Rootworm (MON 863) hybrids and a check (non-transgenic hybrid). All hybrids were selected by Monsanto Company, and we evaluated them without any knowledge of their genetic background. The experimental design was a split-plot with four replications. Planting date served as the main plots, with hybrids as the sub-plots. Treatments were planted on 29 April and 23 May. The plot sizes were 10 feet x 45 feet for each treatment. Ten randomly selected root systems were extracted from the center two rows of each four-row plot on 20 July and 9 August. The root systems were washed and rated for rootworm larval injury. Node-injury ratings are based upon the 0–3 node-injury scale developed by Oleson et al. (2005).
Planting and Insecticide Application
Trials were planted using a four-row, Almaco-constructed planter with John Deere 7300 row units. Precision Planting finger pick-up style metering units were used.
Agronomic Information
Agronomic information is listed in Table 2.1.
Climatic Conditions
Temperature and precipitation data are presented in Appendix I.
Statistical Analysis
Data were analyzed using ARM 7 (Agricultural Research Manager), revision 7.0.5. (Copyright© 1982–2003 Gylling Data Management, Inc.).
Results and Discussion
Root injury in the check treatment was significant with two nodes of roots destroyed (2.09, 20 July). As of 20 July, the root protection afforded by hybrids A (0.47), B (0.39), E (0.16), F (0.19), H (0.2), and I (0.21) was very good to excellent. YieldGard Rootworm hybrids A, B, E, F, H, and I were commercialized in 2005. By 9 August, root ratings were generally greater in these hybrids; however, we suggest the increases were not of biological significance. Hybrids E and H are the same hybrids. This information was revealed to us by Monsanto Company after we had concluded our root evaluations. Root pruning in YieldGard Rootworm hybrids C (0.98, 20 July; 1.27, 9 August) and D (0.78, 20 July; 0.98, 9 August) was excessive with nearly one node of roots destroyed in each hybrid. Monsanto Company indicated that both of these transgenic hybrids had failed their in-house screens during 2004. Neither of these hybrids were moved into the commercialization phase. Monsanto Company also indicated that hybrid G was commercialized in 2005. This hybrid had considerable brace root pruning: 20 July (0.75, ¾ node destroyed), 9 August (0.93, approximately 1 node destroyed). These results suggest that some variation in root protection exists among YieldGard Rootworm (MON 863) hybrids. The second planting date was so late (23 May) that rootworm damage was very minimal and meaningful comparisons among the hybrids is not possible
Reference Cited
Oleson, J. D., Y. L. Park, T. M. Nowatzki, and J. J. Tollefson. 2005. Node-injury scale to evaluate root injury by corn rootworms (Coleoptera: Chrysomelidae). Journal of Economic Entomology 98: 1–8.
TABLE 2.1 • Agronomic factors for efficacy trial of YieldGard Rootworm (YGRW) hybrids to control corn rootworm larvae, University of Illinois, 2005
Planting dates 29 April, 2005—Early planting29 May, 2005—Late planting
Root evaluation dates 20 July, 2005—1st evaluation9 August, 2005—2nd evaluation
Row spacing 30 inches
Seeding rate 33,000/acre
Previous crop Trap crop (late-planted corn and pumpkins)
Tillage Fall—moldboard plowSpring—field cultivator

CORN
University of Illinois Extension • College of Agricultural, Consumer and Environmental Sciences • Department of Crop Sciences 10
on Targeton Target 2005 Annual summary of field crop insect management trials, Department of Crop Sciences, University of Illinois
TABLE 2.2 • Evaluation of YGRW hybrids for control of corn rootworm larvae, Urbana, University of Illinois, 2005
Hybrid1 Planting time2
Mean node-injury rating3,4,5
Date of rating20 July
Date of rating9 August
Hybrid A Early 0.47 c 0.73 c
Hybrid B Early 0.39 c 0.40 d
Hybrid C Early 0.98 b 1.27 b
Hybrid D Early 0.78 b 0.98 c
Hybrid E Early 0.16 def 0.25 de
Hybrid F Early 0.19 de 0.38 d
Hybrid G Early 0.75 b 0.93 c
Hybrid H Early 0.20 d 0.19 def
Hybrid I Early 0.21 d 0.38 d
Untreated check Early 2.09 a 1.91 a
Hybrid A Late 0.01 ef 0.02 f
Hybrid B Late 0.06 def 0.04 f
Hybrid C Late 0.01 ef 0.07 ef
Hybrid D Late 0.04 def 0.14 ef
Hybrid E Late 0.03 ef 0.01 f
Hybrid F Late 0.00 f 0.01 f
Hybrid G Late 0.01 ef 0.03 f
Hybrid H Late 0.03 ef 0.00 f
Hybrid I Late 0.01 ef 0.03 f
Non-Bt check Late 0.08 def 0.30 de
1 Nine YGRW hybrids (A–I) and one non-Bt check were provided by Monsanto Company. The actual hybrids were unknown by University of Illinois personnel and are identified only by letter.
2 Planting times were 29 April and 23 May, 2005, for early and late plantings, respectively.3 Mean node-injury ratings are based upon the 0–3 node-injury scale (Oleson et al. 2005).4 Mean node-injury ratings are derived from ratings of five individual roots per treatment in each of four replications.5 Means followed by the same letter do not differ significantly (P = 0.05, Duncan’s New Multiple Range Test).

CORN
University of Illinois Extension • College of Agricultural, Consumer and Environmental Sciences • Department of Crop Sciences 11
on Targeton Target 2005 Annual summary of field crop insect management trials, Department of Crop Sciences, University of Illinois
SECTION 3
Evaluation of liquid Force to control corn rootworm larvae (Diabrotica spp.) in Illinois, 2005Ronald E. Estes, Jared B. Schroeder, Kevin L. Steffey, and Michael E. Gray
Location
We established one trial at the University of Illinois Agricultural Engineering Farm near Urbana.
Experimental Design and Methods
The experimental design was a randomized complete block with three replications. The plot size for each treatment was 10 feet x 30 feet. Five randomly selected root systems were extracted from the center two rows of each four-row plot, washed, and rated on 19 July, for rootworm larval injury. Node-injury ratings are based upon the 0–3 node-injury scale developed by Oleson et al. (2005).
Planting and Insecticide Application
The trial was planted using a four-row, Almaco-constructed planter with John Deere 7300 row units. Precision Planting finger pick-up style metering units were used. Granular insecticides were applied through modified Noble metering units mounted to each row. Plastic insecticide tubes directed the granular treatments to either a 5-inch, slope-compensating bander or to the seed furrow. Capture 2EC and Force Liquid 2.25CS were applied at a spray volume of 5 gallons per acre using a CO2 system with TeeJet 8001VS spray tips attached to stainless steel drop tubes. All insecticides were applied in front of the firming wheels. Cable-mounted tines were attached behind each of the row units to improve insecticide incorporation.
Agronomic Information
Agronomic information is listed in Table 3.1.
Climatic Conditions
Temperature and precipitation data are presented in Appendix I.
Statistical Analysis
Data were analyzed using ARM 7 (Agricultural Research Manager), revision 7.0.5. (Copyright© 1982–2003 Gylling Data Management, Inc.).
Results and Discussion
Table 3.2 shows the mean node-injury ratings for each treatment applied in our trial near Urbana. The mean node-injury rating in the untreated check was 2.49 (almost two and one-half nodes destroyed), indicating that rootworm larval feeding injury was severe. All of the insecticide treatments had mean node-injury ratings that were significantly lower than the mean node-injury rating for the untreated check. All treatments provided acceptable control, with a mean node-injury rating lower than 1.0 (one node of roots destroyed). The rate and/or placement of Force Liquid 2.25CS did not significantly affect its performance. All granular products provided significantly better root protection than the Capture 2EC treatment applied in a band.
Reference Cited
Oleson, J. D., Y. L. Park, T. M. Nowatzki, and J. J. Tollefson. 2005. Node-injury scale to evaluate root injury by corn rootworms (Coleoptera: Chrysomelidae). Journal of Economic Entomology 98: 1–8.
TABLE 3.1 • Agronomic factors for efficacy trial of liquid Force to control corn rootworm larvae, Urbana, University of Illinois, 2005
Planting date 5 May, 2005
Root evaluation date 19 July, 2005
Row spacing 30 inches
Seeding rate 33,000/acre
Previous crop Trap crop (late-planted corn andpumpkins)
Tillage Fall—moldboard plowSpring—Field cultivator

CORN
University of Illinois Extension • College of Agricultural, Consumer and Environmental Sciences • Department of Crop Sciences 12
on Targeton Target 2005 Annual summary of field crop insect management trials, Department of Crop Sciences, University of Illinois
TABLE 3.2 • Evaluation of liquid Force for control of corn rootworm larvae, Urbana, University of Illinois, 2005
Product Rate1,2 Placement Mean node-injury rating3,4,5
Aztec 2.1G 6.7 Band 0.38 cd
Aztec 2.1G 6.7 Furrow 0.17 d
Capture 2EC 23.0 Band 0.82 b
Capture 2EC 23.0 Furrow 0.43 cd
Force 3G 4.0 Band 0.39 cd
Force 3G 4.0 Furrow 0.41 cd
Force liquid 2.25CS 5.6 Band 0.38 cd
Force liquid 2.25CS 5.6 Furrow 0.58 bc
Force liquid 2.25CS 7.4 Band 0.52 bcd
Force liquid 2.25CS 7.4 Furrow 0.37 cd
Force liquid 2.25CS 9.3 Band 0.45 bcd
Force liquid 2.25CS 9.3 Furrow 0.48 bcd
Lorsban 15G 8.0 Band 0.27 cd
Lorsban 15G 8.0 Furrow 0.29 cd
Untreated check — — 2.49 a
1 Rates of application for granular insecticides are ounces (oz) of product per 1,000 feet of row.2 Rates of application for liquid insecticides are fluid ounces (fl oz) of product per acre.3 Mean node-injury ratings are based upon the 0–3 node-injury scale (Oleson et al. 2005).4 Mean node-injury ratings are derived from ratings of six individual roots per treatment in each of three replications.5 Means followed by the same letter do not differ significantly (P = 0.05, Duncan’s New Multiple Range Test).

CORN
University of Illinois Extension • College of Agricultural, Consumer and Environmental Sciences • Department of Crop Sciences 13
on Targeton Target 2005 Annual summary of field crop insect management trials, Department of Crop Sciences, University of Illinois
SECTION 4
Evaluation of insecticidal seed treatments and granular insecticides to control corn rootworm larvae (Diabrotica spp.) in Illinois, 2005Ronald E. Estes, Jared B. Schroeder, Kevin L. Steffey, and Michael E. Gray
Location
We established one trial at the University of Illinois Agricultural Engineering Farm near Urbana.
Experimental Design and Methods
The experimental design was a randomized complete block with four replications. The plot size for each treatment was 10 feet x 30 feet. Five randomly selected root systems were extracted from the first row of each four-row plot, washed, and rated on 19 July, for rootworm larval injury. Node-injury ratings are based upon the 0–3 node-injury scale developed by Oleson et al. (2005).
Planting and Insecticide Application
The trial was planted using a four-row, Almaco-constructed planter with John Deere 7300 row units. Precision Planting finger pick-up style metering units were used. Granular insecticides were applied through modified Noble metering units mounted to each row. Plastic insecticide tubes directed the granular treatments to a 5-inch, slope-compensating bander. All insecticides were applied in front of the firming wheels. Cable-mounted tines were attached behind each of the row units to improve insecticide incorporation.
Agronomic Information
Agronomic information is listed in Table 4.1.
Climatic Conditions
Temperature and precipitation data are presented in Appendix I.
Statistical Analysis
Data were analyzed using ARM 7 (Agricultural Research Manager), revision 7.0.5. (Copyright© 1982–2003 Gylling Data Management, Inc.).
Results and Discussion
Mean node-injury ratings for each treatment are presented in Table 4.2. Mean node-injury ratings in the untreated check (with and without a fungicidal seed treatment) had significant injury with ratings of 2.70 and 2.87 (nearly three nodes of roots destroyed). The mean node-injury ratings for all other treatments were significantly lower than the untreated checks. The Force 3G (band) treatment had significantly lower mean node-injury ratings than all other treatments. None of the insecticidal seed treatments provided adequate root protection against corn rootworm larvae.
Reference Cited
Oleson, J. D., Y. L. Park, T. M. Nowatzki, and J. J. Tollefson. 2005. Node-injury scale to evaluate root injury by corn rootworms (Coleoptera: Chrysomelidae). Journal of Economic Entomology 98: 1–8.
TABLE 4.1 • Agronomic factors for efficacy trial of insecticidal seed treatments and granular insecticides to control corn rootworm larvae, Urbana, University of Illinois, 2005
Planting date 3 May, 2005
Root evaluation date 19 July, 2005
Row spacing 30 inches
Seeding rate 33,000/acre
Previous crop Trap crop (late-planted corn andpumpkins)
Tillage Fall—moldboard plowSpring—field cultivator

CORN
University of Illinois Extension • College of Agricultural, Consumer and Environmental Sciences • Department of Crop Sciences 14
on Targeton Target 2005 Annual summary of field crop insect management trials, Department of Crop Sciences, University of Illinois
TABLE 4.2 • Evaluation of insecticidal seed treatments and granular insecticides to control corn rootworm larvae, Urbana, University of Illinois, 2005
Product Rate Rate unit Placement Meannode-injury rating1,2,3
Untreated check — — — 2.70 a
Maxim 4 FS +
Apron XL 3 LS +
Dynasty 0.83 FS
2.5 g ai/100 kg Seed 2.87 a
2.0 g ai/100 kg Seed
1.0 g ai/100 kg Seed
Cruiser +
Cruiser 5 FS
0.138 g ai/100 kg Seed 1.96 bc
1.125 g ai/100 kg Seed
Poncho 1250 +
Maxim 4 FS +
Apron XL 3 LS +
Trilex
1.25 mg ai/seed Seed 1.77 bcd
2.5 g ai/100 kg Seed
2.0 g ai/100 kg Seed
5.0 mg ai/seed Seed
Force 3G +
Maxim 4 FS +
Apron XL 3 LS +
Dynasty .83 FS
1.12 g ai/100 m row Band 0.35 e
2.5 g ai/100 kg Seed
2.0 g ai/100 kg Seed
1.0 g ai/100 kg Seed
Force ST +
Maxim 4 FS +
Apron XL 3 LS +
Dynasty .83 FS
1.0 mg ai/seed Seed 1.89 bcd
2.5 g ai/100 kg Seed
2.0 g ai/100 kg Seed
1.0 g ai/100 kg Seed
A13219 +
Maxim 4 FS +
Apron XL 3 LS +
Dynasty .83 FS
1.0 mg ai/seed Seed 2.15 b
2.5 g ai/100 kg Seed
2.0 g ai/100 kg Seed
1.0 g ai/100 kg Seed
Cruiser 5 FS +
Force ST +
Maxim 4 FS +
Apron XL 3 LS +
Dynasty .83 FS
1.0 mg ai/seed Seed 1.40 d
1.0 mg ai/seed Seed
2.5 g ai/100 kg Seed
2.0 g ai/100 kg Seed
1.0 g ai/100 kg Seed
Cruiser 5 FS +
A13219 +
Maxim 4 FS +
Apron XL 3 LS +
Dynasty .83 FS
1.0 mg ai/seed Seed 1.61 cd
1.0 mg ai/seed Seed
2.5 g ai/100 kg Seed
2.0 g ai/100 kg Seed
1.0 g ai/100 kg Seed
1 Mean node-injury ratings are based upon the 0–3 node-injury scale (Oleson et al. 2005).2 Mean node-injury ratings are derived from ratings of six individual roots per treatment in each of four replications.3 Means followed by the same letter do not differ significantly (P = 0.05, Duncan’s New Multiple Range Test).

CORN
University of Illinois Extension • College of Agricultural, Consumer and Environmental Sciences • Department of Crop Sciences 15
on Targeton Target 2005 Annual summary of field crop insect management trials, Department of Crop Sciences, University of Illinois
SECTION 5
Evaluation of Herculex RW Bt and granular insecticides to control corn rootworm larvae (Diabrotica spp.) in Illinois, 2005Ronald E. Estes, Jared B. Schroeder, Kevin L. Steffey, and Michael E. Gray
Location
We established one trial at the University of Illinois Agricultural Engineering Farm near Urbana.
Experimental Design and Methods
The experimental design was a randomized complete block with four replications. The plot size for each treatment was 10 feet x 30 feet. Five randomly selected root systems were extracted from the center two rows of each four-row plot, washed, and rated on 21 July, for rootworm larval injury. Node-injury ratings are based upon the 0–3 node-injury scale developed by Oleson et al. (2005).
Planting and Insecticide Application
The trial was planted using a four-row, Almaco-constructed planter with precision cone units. Granular insecticides were applied through modified Noble metering units mounted to each row. Plastic insecticide tubes directed the granular treatments to a 5-inch, slope-compensating bander. All insecticides were applied in front of the firming wheels. Cable-mounted tines were attached behind each of the row units to improve insecticide incorporation.
Agronomic Information
Agronomic information is listed in Table 5.1.
Climatic Conditions
Temperature and precipitation data are presented in Appendix I.
Statistical Analysis
Data were analyzed using ARM 7 (Agricultural Research Manager), revision 7.0.5. (Copyright© 1982–2003 Gylling Data Management, Inc.).
Results and Discussion
Mean node-injury ratings are presented in Table 5.2. Due to a later than desired planting date, the level of corn rootworm pressure in this trial was low. The severity of corn rootworm injury in the untreated check was low to moderate, with an average node-injury rating of 0.53 ( just over one-half node pruned). Mean node-injury ratings for the Lorsban 15G (0.07) and Herculex RW Bt (0.00) treatments were significantly lower than the mean node-injury rating for the untreated check.
Reference Cited
Oleson, J. D., Y. L. Park, T. M. Nowatzki, and J. J. Tollefson. 2005. Node-injury scale to evaluate root injury by corn rootworms (Coleoptera: Chrysomelidae). Journal of Economic Entomology 98: 1–8.
TABLE 5.1 • Agronomic factors for efficacy trial of Herculex RW Bt and granular insecticides to control corn rootworm larvae, Urbana, University of Illinois, 2005
Planting date 3 June, 2005
Root evaluation date 21 July, 2005
Row spacing 30 inches
Seeding rate 33,000/acre
Previous crop Trap crop (late-planted corn and pumpkins)
Tillage Fall—moldboard plowSpring—field cultivator
TABLE 5.2 • Evaluation of Herculex RW and Lorsban 15G to control corn rootworm larvae, Urbana, University of Illinois, 2005
Product Rate1 Placement Mean node-injury rating 2,3,4
Herculex RW — Seed 0.00 b
Lorsban 15G 8.0 Band 0.07 b
Untreated check — — 0.53 a
1 Rates of application for granular insecticides are ounces (oz) of product per 1,000 feet of row.
2 Mean node-injury ratings are based upon the 0–3 node-injury scale (Oleson et al. 2005).
3 Mean node-injury ratings are derived from ratings of five individual roots per treatment in each of four replications.
4 Means followed by the same letter do not differ significantly (P = 0.05, Duncan’s New Multiple Range Test).

CORN
University of Illinois Extension • College of Agricultural, Consumer and Environmental Sciences • Department of Crop Sciences 16
on Targeton Target 2005 Annual summary of field crop insect management trials, Department of Crop Sciences, University of Illinois
SECTION 6
Evaluation of Herculex RW Bt and granular insecticides to control corn rootworm larvae (Diabrotica spp.), and their effects on emergence of corn rootworm adults in Illinois, 2005Ronald E. Estes, Jared B. Schroeder, Kevin L. Steffey, and Michael E. Gray
Location
We established one trial at the University of Illinois Agricultural Engineering farm near Urbana.
Experimental Design and Methods
The experimental design was a randomized complete block with four replications. The plot size for each treatment was 10 feet x 30 feet. Emergence of corn rootworm adults from the soil was monitored by using three modified emergence cages per plot originally designed by Hein et al. (1985). The modified emergence cages used in this study had a hole cut into a lid that allowed for the continued growth of the corn plant throughout the growing season. In addition, a glass collection jar was attached above a separate hole on the cage, allowing easy retrieval of emerged adults without lifting the cages from the soil. Once all the plants in the trial were tall enough (8 July), and once adequate time had been allowed for larval development, cages were placed over each of three random plants, and monitored every Monday, Wednesday, and Friday until emergence ended (12 August). The sex of each emerged adult beetle was determined (Krysan 1986) and recorded. Five randomly selected root systems were extracted from the center two rows of each four-row plot, washed, and rated on July 21 for corn rootworm larval injury. Node-injury ratings are based upon the 0–3 node-injury scale developed by Oleson et al. (2005).
Planting and Insecticide Application
The trial was planted using a four-row, Almaco-constructed planter with precision cone units. Granular insecticides were applied through modified Noble metering units mounted to each row. Plastic insecticide tubes directed the granular treatments to a 5-inch, slope-compensating bander. All insecticides were applied in front of the firming wheels. Cable-
mounted tines were attached behind each of the row units to improve insecticide incorporation.
Agronomic Information
Agronomic information is listed in Table 6.1.
Climatic Conditions
Temperature and precipitation data are presented in Appendix I.
Statistical Analysis
Data were analyzed using ARM 7 (Agricultural Research Manager), revision 7.0.5. (Copyright© 1982–2003 Gylling Data Management, Inc.) and SAS 9.1 (SAS Institute 2004).
Results and Discussion
Mean node-injury ratings are presented in Table 6.2. Due to a later than desired planting date, the level of corn rootworm pressure in this trial was low. The amount of corn rootworm injury in the untreated check was low to moderate, with average node-injury ratings of 0.70 and 0.85 (less than one node pruned). Mean node-injury ratings for the Herculex RW Bt (DAS 0.01 and PHI 0.00) and Force 3G (DAS 0.04 and PHI 0.01) treatments, were significantly less than the mean node-injury ratings for the untreated checks.
Total adult corn rootworm emergence is presented in Table 6.3 and Figure 6.1. Emergence data were pooled across genetic backgrounds (PHI + DAS) for analysis. The later than desired planting date did not allow for the initial development of corn rootworm larvae and as a result, this trial characterizes the tail of the rootworm egg hatch. Overall, significantly more
TABLE 6.1 • Agronomic factors for efficacy trial of Herculex RW Bt and granular insecticides to control corn rootworm larvae, and their effect on emergence of corn rootworm adults, Urbana, University of Illinois, 2005
Planting date 3 June, 2005
Root evaluation date 21 July, 2005
Row spacing 30 inches
Seeding rate 33,000/acre
Previous crop Trap crop (late-planted corn andPumpkins)
Tillage Fall—moldboard plowSpring—field cultivator

CORN
University of Illinois Extension • College of Agricultural, Consumer and Environmental Sciences • Department of Crop Sciences 17
on Targeton Target 2005 Annual summary of field crop insect management trials, Department of Crop Sciences, University of Illinois
FIGURE 6.1 • Total number of corn rootworm adults that emerged from the plots planted to Herculex RW Bt or treated with granular insecticides, Urbana, University of Illinois, 2005.
beetles emerged from the untreated checks than from the Herculex RW Bt and Force 3G treatments. More than 3x as many beetles emerged from the untreated checks and 2x as many beetles emerged from the Force 3G treatments than from Herculex RW Bt treatments. Peak emergence occurred on 18 July, 2005 for the untreated check, 22 July, 2005 for Force 3G treatments, and it was delayed one week (25 July) in the Herculex RW Bt treatments compared to the untreated check.
References Cited
Hein, G. L., M. K. Bergman, R. G. Bruss, and J. J. Tollefson. 1985. Absolute sampling technique for corn rootworm (Coleoptera: Chrysomelidae) adult emergence that adjusts to fit common-row spacing. Journal of Economic Entomology 78: 1503–1506.
Krysan, J. L. 1986. Introduction: Biology, distribution, and identification of pest Diabrotica, pp. 1–23. In J. L. Krysan and T. A. Miller (eds.), Methods for the Study of Pest Diabrotica. Springer-Verlag, New York.
Oleson, J. D., Y. L. Park, T. M. Nowatzki, and J. J. Tollefson. 2005. Node-injury scale to evaluate root injury by corn rootworms (Coleoptera: Chrysomelidae). Journal of Economic Entomology 98: 1–8.
TABLE 6.2 • Evaluation of Herculex RW Bt and granular insecticides to control corn rootworm larvae, Urbana, University of Illinois, 2005
Product Rate1 Placement Meannode-injury
rating2,3,4
Herculex RW (PHI5) Seed 0.00 b
Herculex RW (DAS6) Seed 0.01 b
Force 3G (PHI7) 4.0 Band 0.01 b
Force 3G (DAS8) 4.0 Band 0.04 b
Untreated Check (PHI7) — — 0.70 a
Untreated Check (DAS8) — — 0.85 a
1 Rates of application for granular insecticides are ounces (oz) of product per 1,000 feet of row.
2 Mean node-injury ratings are based upon the 0–3 node-injury scale (Oleson et al. 2005).
3 Mean node-injury ratings are derived from ratings of five individual roots per treatment in each of four replications.
4 Means followed by the same letter do not differ significantly (P = 0.05, Duncan’s New Multiple Range Test).
5 Pioneer Hi-Bred International Herculex RW hybrid.6 Dow AgroSciences Herculex RW hybrid.7 Pioneer Hi-Bred International non-Herculex RW isoline.8 Dow AgroSciences non-Herculex RW isoline.
TABLE 6.3 • Evaluation of Herculex RW Bt and granular insecticides on adult corn rootworm emergence per cage per sampling period, Urbana, University of Illinois, 2005
Product Rate1 Placement Mean no. western corn rootworm adults per cage
per sampling period2
Herculex RW (PHI + DAS)3
Seed 0.25 b
Force 3G (PHI + DAS)4
4.0 Band 0.53 b
Untreated Check (PHI + DAS)4
— — 0.83 a
1 Rates of application for granular insecticides are ounces (oz) of product per 1,000 feet of row.
2 Means followed by the same letter do not differ significantly (P = 0.05, Tukey’s)3 Pooled average of Pioneer Hi-Bred International Herculex RW hybrid and Dow AgroSciences Herculex RW hybrid.
4 Pooled average of Pioneer Hi-Bred International non-Herculex RW isoline and Dow
70
HXRW (PHI + DAS)Force 3G (PHI + DAS)Untreated (PHI + DAS)
Tota
l Em
erge
nce
ofCo
rn R
ootw
orm
Adu
lts
60
50
40
30
20
10
0
7/11/057/13/057/15/057/17/057/19/057/21/057/23/057/25/057/27/057/29/057/31/058/2/058/4/058/6/058/8/05
8/10/058/12/05

CORN
University of Illinois Extension • College of Agricultural, Consumer and Environmental Sciences • Department of Crop Sciences 18
on Targeton Target 2005 Annual summary of field crop insect management trials, Department of Crop Sciences, University of Illinois
SECTION 7
Evaluation of Herculex RW Bt and granular insecticides to control corn rootworm larvae (Diabrotica spp.) in Illinois, 2005Ronald E. Estes, Jared B. Schroeder, Kevin L. Steffey, and Michael E. Gray
Location
We established two trials at two locations in Illinois – 1. University of Illinois Agricultural Engineering Farm near Urbana; 2. Pioneer Hi-Bred International Research Farm near Emington, IL.
Experimental Design and Methods
The experimental design was a randomized complete block with four replications. The plot size for each treatment at Urbana and Emington were 10 feet x 17.5 feet. Five randomly selected root systems were extracted from each four-row plot on 19 July and 21 July in Emington and Urbana, respectively. The root systems were washed and rated for rootworm larval injury. Node-injury ratings are based upon the 0–3 node injury scale developed by Oleson et al. (2005).
Planting and Insecticide Application
The trial at the Emington location was conducted in collaboration with personnel from Pioneer Hi-Bred International, Inc. and all planting and plot maintenance was performed by Pioneer personnel. The trial was planted using a four-row, Almaco-constructed planter with precision cone units. Granular insecticides were applied through modified Noble metering units mounted to each row. Plastic insecticide tubes directed the granular treatments to a 5-inch, slope-compensating bander. All insecticides were applied in front of the firming wheels.
At the Urbana location, the trial was planted using a four-row, Almaco-constructed planter with precision cone units. Granular insecticides were applied through modified Noble metering units mounted to each row. Plastic insecticide tubes directed the granular treatments to a 5-inch, slope-
compensating bander. All insecticides were applied in front of the firming wheels. Cable-mounted tines were attached behind each of the row units to improve insecticide incorporation.
Agronomic Information
Agronomic information is listed in Table 7.1.
Climatic Conditions
Temperature and precipitation data are presented in Appendix I.
Statistical Analysis
Data were analyzed using ARM 7 (Agricultural Research Manager), revision 7.0.5. (Copyright© 1982–2003 Gylling Data Management, Inc.).
Results and Discussion
Mean node-injury ratings for Emington and Urbana are presented in Tables 7.2 and 7.3, respectively. At the Emington location, the amount of root injury in the untreated check was low (0.12) and was not significantly different from the other treatments (Table 7.2). At Urbana, corn rootworm larval pressure was high. The untreated check had an average node-injury rating of 2.08. Both the Herculex RW Bt and Aztec 2.1G treatments had significantly lower node-injury ratings of 0.07 and 0.23, respectively.
TABLE 7.1 • Agronomic factors for efficacy trials of Herculex RW and granular insecticides to control corn rootworm larvae, University of Illinois, 2005
Emington Urbana
Planting date 4 May, 2005 18 May, 2005
Root evaluation date
19 July, 2005 21 July, 2005
Row spacing 30 inches 30 inches
Seeding rate 37,000/acre1 33,000/acre
Previous crop Corn Trap crop (late-planted corn and pumpkins)
Tillage Fall—chisel plowSpring—field cultivator
Fall—moldboard plowSpring—field cultivator
1 The trial at Emington was planted at a rate of 37,000 plants per acre, but later thinned to a final stand of 32,700 to ensure uniform plant spacing.

CORN
University of Illinois Extension • College of Agricultural, Consumer and Environmental Sciences • Department of Crop Sciences 19
on Targeton Target 2005 Annual summary of field crop insect management trials, Department of Crop Sciences, University of Illinois
Reference Cited
Oleson, J. D., Y. L. Park, T. M. Nowatzki, and J. J. Tollefson. 2005. Node-injury scale to evaluate root injury by corn rootworms (Coleoptera: Chrysomelidae). Journal of Economic Entomology 98: 1–8.
TABLE 7.2 • Evaluation of Herculex RW and Aztec 2.1G to control corn rootworm larvae, Emington, University of Illinois, 2005
Product Rate1,2 PlacementMean node-injury
rating3,4,5
Herculex RW + Poncho 250
—0.25
Seed 0.01 a
Seed
Aztec 2.1G6 6.7 Band 0.07 a
Untreated check6 — — 0.12 a
1 Rate of application for band placement is ounces (oz) of product per 1,000 feet of row.
2 Rate of application for seed treatment is milligrams (mg) of active ingredient (a.i.) per seed.
3 Mean node-injury ratings are based upon the 0–3 node-injury scale (Oleson et al. 2005).
4 Mean node-injury ratings are derived from ratings of five individual roots per treatment in each of four replications.
5 Means followed by the same letter do not differ significantly (P = 0.05, Duncan’s New Multiple Range Test).
6 Non-Herculex RW isoline.
TABLE 7.3 • Evaluation of Herculex RW and Aztec 2.1G to control corn rootworm larvae, Urbana, University of Illinois, 2005
Product Rate1,2 PlacementMean node-injury
rating3,4,5
Herculex RW + Poncho 250
—0.25
Seed 0.07 b
Seed
Aztec 2.1G6 6.70 Band 0.23 b
Untreated check6 — — 2.08 a
1 Rate of application for band placement is ounces (oz) of product per 1,000 feet of row.
2 Rate of application for seed treatment is milligrams (mg) of active ingredient (a.i.) per seed.
3 Mean node-injury ratings are based upon the 0–3 node-injury scale (Oleson et al. 2005).
4 Mean node-injury ratings are derived from ratings of five individual roots per treatment in each of four replications.
5 Means followed by the same letter do not differ significantly (P = 0.05, Duncan’s New Multiple Range Test).
6 Non-Herculex RW isoline.

CORN
University of Illinois Extension • College of Agricultural, Consumer and Environmental Sciences • Department of Crop Sciences 20
on Targeton Target 2005 Annual summary of field crop insect management trials, Department of Crop Sciences, University of Illinois
SECTION 8
Evaluation of insecticides to control Japanese beetle grubs (Popilla japonica Newman) in Illinois, 2005Ronald E. Estes, Jared B. Schroeder, Kevin L. Steffey, and Michael E. Gray
Location
We established one trial at the Ken Dalenberg Farm near Mahomet (Champaign County), IL.
Experimental Design and Methods
The experimental design was a randomized complete block with three replications. The plot size for each treatment was 5 feet x 30 feet. Samples were taken to determine the number of grubs per meter of row; no grubs were found. Stand counts were taken from 17.5 feet of row (1/1,000 acre) and converted to number of plants per acre. For each treatment, 17.5 feet of row (1/1,000 of an acre) was hand harvested, shelled, weighed, and converted to bushels per acre at 15% moisture.
Planting and Insecticide Application
Trials were planted using a four-row, Almaco-constructed planter with John Deere 7300 row units. Precision Planting finger pick-up style metering units were used. Granular insecticides were applied through modified Noble metering units mounted to each row. Plastic insecticide tubes directed the granular treatments to either a 5-inch, slope-compensating bander or to the seed furrow. All insecticides were applied
in front of the firming wheels. Cable-mounted tines were attached behind each of the row units to improve insecticide incorporation.
Agronomic Information
Agronomic information is listed in Table 8.1.
Climatic Conditions
Precipitation data are presented in Appendix I.
Statistical Analysis
Data were analyzed using ARM 7 (Agricultural Research Manager), revision 7.0.5. (Copyright© 1982–2003 Gylling Data Management, Inc.).
Results and Discussion
Mean stand counts and yields are presented in Table 8.2. Due to the low level or non-existence of Japanese beetle grubs, there were no significant differences in stand count or yield among any of the treatments.
TABLE 8.1 • Agronomic factors for efficacy trial of products to control Japanese beetle grubs, Mahomet (Champaign County), University of Illinois, 2005
Planting date 18 April, 2005
Row spacing 30 inches
Seeding rate 33,000/acre

CORN
University of Illinois Extension • College of Agricultural, Consumer and Environmental Sciences • Department of Crop Sciences 21
on Targeton Target 2005 Annual summary of field crop insect management trials, Department of Crop Sciences, University of Illinois
TABLE 8.2 • Evaluation of products to control Japanese beetle grubs, Mahomet (Champaign County), University of Illinois, 2005
Product Rate Rate unit Placement Mean stand count1,2
Mean yield(bu/A)2,3
Maxim XL 2.7 FS +
Apron XL 3 LS +
Dynasty .83 FS
3.5 g ai/100 kg Seed 30,000 a 177.00 a
1.0 g ai/100 kg Seed
1.0 g ai/100 kg Seed
Cruiser Extreme +
Cruiser 5 FS
0.138 mg ai/seed Seed 29,670 a 160.03 a
0.125 mg ai/seed Seed
Cruiser Extreme +
Cruiser 5 FS
0.138 mg ai/seed Seed 27,330 a 170.46 a
1.125 mg ai/seed Seed
Cruiser 5 FS +
Maxim XL 2.7 FS +
Apron XL 3 LS +
Dynasty .83 FS
0.25 mg ai/seed Seed 28,000 a 182.35 a
3.5 g ai/100 kg Seed
1.0 g ai/100 kg Seed
1.0 g ai/100 kg Seed
Cruiser 5 FS +
Maxim XL 2.7 FS +
Apron XL 3 LS +
Dynasty .83 FS
1.25 mg ai/seed Seed 29,000 a 181.12 a
3.5 g ai/100 kg Seed
1.0 g ai/100 kg Seed
1.0 g ai/100 kg Seed
Poncho 1250 +
Maxim XL 2.7 FS +
Trilex
0.25 mg ai/seed Seed 29,000 a 165.46 a
3.5 g ai/100 kg Seed
5.0 g ai/100 kg Seed
Captan 4L +
Allegiance FL +
Concur
55.0 g ai/100 kg Seed 27,670 a 158.18 a
2.0 g ai/100 kg Seed
58.5 g ai/100 kg Seed
Cruiser Extreme +
Cruiser 5 FS +
Force 3G
0.138 mg ai/seed Seed 25,670 a 169.68 a
0.125 mg ai/seed Seed
0.56 g ai/100 m row Furrow
Cruiser Extreme +
Cruiser 5 FS +
Force 3G
0.138 mg ai/seed Seed 25,670 a 215.02 a
0.125 mg ai/seed Seed
0.84 g ai/100 m row Furrow
Cruiser Extreme +
Cruiser 5 FS +
Force 3G
0.138 mg ai/seed Seed 30,000 a 189.49 a
0.125 mg ai/seed Seed
1.12 g ai/100 m row Band
1 Stand counts based upon number of plants per 17.5 feet of row (1/1,000 acre).2 Means followed by the same letter do not differ significantly (P = 0.05, Duncan’s New Multiple Range Test).3 Yield sample from 17.5 feet of row (1/1000 acre) and converted to bushels per acre at 15% moisture.

CORN
University of Illinois Extension • College of Agricultural, Consumer and Environmental Sciences • Department of Crop Sciences 22
on Targeton Target 2005 Annual summary of field crop insect management trials, Department of Crop Sciences, University of Illinois
SECTION 9
Evaluation of insecticides to control Japanese beetle grubs (Popilla japonica Newman) in Illinois, 2005Ronald E. Estes, Jared B. Schroeder, Kevin L. Steffey, and Michael E. Gray
Location
We established one trial at the Ken Dalenberg Farm near Mahomet (Champaign County), IL.
Experimental Design and Methods
The experimental design was a randomized complete block with three replications. The plot size for each treatment was 5 feet x 30 feet. Samples were taken to determine the number of grubs per meter of row; no grubs were found. Stand counts were taken from 17.5 feet of row (1/1,000 acre) and converted to number of plants per acre. For each treatment 17.5 feet of row (1/1,000 of an acre) was hand harvested, shelled, weighed, and converted to bushels per acre at 15% moisture.
Planting and Insecticide Application
Trials were planted using a four-row, Almaco-constructed planter with John Deere 7300 row units. Precision Planting finger pick-up style metering units were used. Granular insecticides were applied through modified Noble metering units mounted to each row. Plastic insecticide tubes directed the granular treatments to either a 5-inch, slope-compensating bander or into the seed furrow. Regent 4SC was applied through microtubes in-furrow at a spray volume of 3 gallons
per acre using a CO2 system. All insecticides were applied in front of the firming wheels. Cable-mounted tines were attached behind each of the row units to improve insecticide incorporation.
Agronomic Information
Agronomic information is listed in Table 9.1.
Climatic Conditions
Precipitation data are presented in Appendix I.
Statistical Analysis
Data were analyzed using ARM 7 (Agricultural Research Manager), revision 7.0.5. (Copyright© 1982–2003 Gylling Data Management, Inc.).
Results and Discussion
Mean stand counts and yields are presented in Table 9.2. Due to the low level or non-existence of Japanese beetle grubs, there were no significant differences in stand count or yield among any of the treatments.
TABLE 9.1 • Agronomic factors for the efficacy trial of products to control Japanese beetle grubs, Mahomet (Champaign County), University of Illinois, 2005
Planting date 18 April, 2005
Row spacing 30 inches
Seeding rate 33,000/acre

CORN
University of Illinois Extension • College of Agricultural, Consumer and Environmental Sciences • Department of Crop Sciences 23
on Targeton Target 2005 Annual summary of field crop insect management trials, Department of Crop Sciences, University of Illinois
TABLE 9.2 • Evaluation of products to control Japanese beetle grubs, Mahomet (Champaign County), University of Illinois, 2005
Product Rate1,2 Placement Mean stand count3,4
Mean yield (bu/A)4,5
Poncho 250 0.25 Seed 25,667 a 192.20 a
Poncho 1250 1.25 Seed 29,000 a 189.63 a
Cruiser 5FS 0.25 Seed 28,000 a 203.79 a
Cruiser 5FS 1.25 Seed 27,333 a 195.95 a
Aztec 4.67G6 3.00 Band 25,667 a 196.17 a
Force 3G 4.00 Band 27,333 a 187.45 a
Fortress 5G6 3.00 Furrow 29,000 a 193.82 a
Regent 4SC 0.24 Furrow 25,667 a 206.75 a
Untreated check — — 24,333 a 196.38 a
Untreated check — — 27,333 a 197.69 a
1 Rates of application for furrow placements are ounces (oz) of product per 1,000 feet of row.2 Rates of application for seed treatments are milligrams (mg) of active ingredient (a.i.) per seed.3 Stand counts based upon number of plants per 17.5 feet of row (1/1,000 acre).4 Means followed by the same letter do not differ significantly (P = 0.05, Duncan’s New Multiple Range Test).5 Yield sample from 17.5 feet of row (1/1000 acre) and converted to bushels per acre at 15% moisture.6 Applied with modified SmartBox metering units

SOYBEANS
University of Illinois Extension • College of Agricultural, Consumer and Environmental Sciences • Department of Crop Sciences 24
on Targeton Target 2005 Annual summary of field crop insect management trials, Department of Crop Sciences, University of Illinois
SECTION 10
Evaluation of foliar applied insecticides to control soybean aphids (Aphis glycines Matsumura) in Illinois, 2005Ronald E. Estes, Jared B. Schroeder, Kevin L. Steffey, and Michael E. Gray
Location
We established one trial at the Ruth and Alvin Popkin Farm near Morrison (Whiteside County), IL.
Experimental Design and Methods
The experimental design was a randomized complete block with three replications. The plot size for each treatment was 10 feet x 30 feet. Densities of soybean aphids were determined by counting the total number of aphids on nine leaflets (three each from the upper, middle, and lower sections of the plant) from each of five plants per plot. Aphid density counts were taken on 4 August (7 days after treatment) and 11 August (14 days after treatment). Two rows from each plot were mechanically harvested on 10 October, and the yields were adjusted to bushels per acre at 13% moisture.
Planting and Insecticide Application
Trials were planted using a four-row, Almaco-constructed planter with John Deere 7300 row units. John Deere precision soybean meters were used. Insecticides were applied to the soybean foliage on 28 July with a CO2 backpack sprayer and a four-row hand boom. TeeJet 8002VS spray tips were calibrated to deliver a volume of 20 gallons per acre.
Agronomic Information
Agronomic information is listed in Table 10.1.
Climatic Conditions
Temperature and precipitation data are presented in Appendix I.
Statistical Analysis
Data were analyzed using ARM 7 (Agricultural Research Manager), revision 7.0.5. (Copyright© 1982–2003 Gylling Data Management, Inc.).
Results and Discussion
Densities of soybean aphids 7 and 14 days after treatment (DAT) are given in Table 10.2. Densities varied across the trial. Densities 7 DAT (4 August) ranged from 117.07 (Decis 1.5EC) to 0.00 (Asana 0.66 EC + Lorsban 4E, Baythroid 2EC, Lorsban 4E, Lorsban 75 WG, Nufos 4E [2 pt./acre and 1 pt./acre], and Nufos 4E + Dimethoate 4EC) aphids per nine leaflets, whereas densities of aphids in the untreated checks averaged 23.47, 8.00, and 52.93 aphids per nine leaflets. On 14 DAT (11 August), aphid densities crashed and ranged from 6.13 (Dimethoate 4EC) to 0.00 (Asana 0.66EC + Lorsban 4E, Baythroid 2EC + Lorsban 4EC, Lorsban 75WG, and Proaxis 0.5CS) aphids per nine leaflets. We also observed a crash in the aphid populations in the untreated checks (4.60, 5.13, and 1.13 aphids per nine leaflets). There were no aphids in three treatments at either 7 DAT or 14 DAT (Asana 0.66EC + Lorsban 4E, Baythroid 2EC + Lorsban 4EC, and Lorsban 75WG).
Yields from each of the treatments are indicated in Table 10.2. Yields ranged from 38.43 (Orthene 12.0 oz per acre) to 66.20 (Dimethoate 1pt. per acre) bushels per acre. In general, there were few significant differences in yields among treatments. However, the yield from the plots treated with Dimethoate 4EC at 1 pt per acre (66.20 bushels per acre) was significantly greater than the yields from several other treatments. The yield from the plots treated with Orthene 97SG at 12 oz per acre (38.43 bushels per acre) was significantly less than the yields from all but four other treatments. All but three of the treatments (Baythroid 2EC [0.044 lb ai/a], Baythroid 2EC + Lorsban 4EC, and Orthene 97SG [12 oz/a]) had yields greater than 50 bushels per acre.
TABLE 10.1 • Agronomic information for efficacy trial of foliar applied insecticides to control soybean aphids, Morrison (Whiteside County), University of Illinois, 2005
Planting date 17 May, 2005
Row spacing 30 inches
Seeding rate 130,000/acre
Previous crop Corn
Tillage Spring—disked twice

SOYBEANS
University of Illinois Extension • College of Agricultural, Consumer and Environmental Sciences • Department of Crop Sciences 25
on Targeton Target 2005 Annual summary of field crop insect management trials, Department of Crop Sciences, University of Illinois
TABLE 10.2 • Evaluation of foliar applied insecticides to control soybean aphids, Morrison (Whiteside County), University of Illinois, 2005
Product Rate Rate unit Mean no. aphids per three trifoliates (9 leaflets)1,2
Mean yield (bu/A)1,5
7 DAT3 14 DAT4
Asana 0.66EC 6.4 fl oz/a 1.00 h 0.07 f 56.56 a–f
Asana 0.66EC + Lannate 2.4SL
6.48
fl oz/afl oz/a
9.47 e–h 0.27 ef 56.74 a–e
Asana 0.66EC + Lorsban 4E
6.48
fl oz/afl oz/a
0.00 h 0.00 f 57.39 a–e
Ballad + Biotune6
10.15
qt/a% v/v
61.40 bc 2.93 b–f 56.71 a–e
Ballad + Biotune6
10.3
qt/a% v/v
23.67 d–h 0.47 def 56.61 a–e
Baythroid 2EC 0.044 lb ai/a 16.93 e–h 0.47 def 46.37 d–g
Baythroid 2EC + Lorsban 4EC
0.0310.25
lb ai/alb ai/a
0.00 h 0.00 f 45.63 efg
Centric 40WG 1.5 oz/a 19.00 e–h 0.40 def 50.19 b–g
Centric 40WG 2 oz/a 1.93 gh 0.40 def 55.29 a–f
Decis 1.5EC 0.022 lb ai/a 117.20 a 2.00 b–f 50.20 b–g
Dimethoate 4EC 0.5 pt/a 7.20 fgh 2.40 a–f 57.52 a–e
Dimethoate 4EC 1 pt/a 8.40 e–h 6.13 a 66.20 a
Lannate 2.4SL 8 fl oz/a 15.60 e–h 1.27 b–f 55.98 a–f
Lannate 2.4SL 16 fl oz/a 2.60 gh 4.27 ab 52.22 b–f
Leverage 2.7SE 0.079 lb ai/a 2.20 gh 0.40 ef 60.18 abc
Lorsban 4E 1 pt/a 0.00 h 0.07 f 62.60 ab
Lorsban 75WG 0.67 lb ai/a 0.00 h 0.00 f 52.98 b–f
Nufos 4E 2 pt/a 0.00 h 0.13 f 58.89 a–d
Nufos 4E 1 pt/a 0.00 h 0.40 def 55.81 a–f
Nufos 4E + Dimethoate 4EC
0.50.5
pt/apt/a
0.00 h 0.47 def 61.07 ab
Orthene 97SG + N.I.S.7
100.125
oz/a% v/v
12.60 e–h 0.73 c–f 57.66 a–e
Orthene 97SG + N.I.S.7
120.125
oz/a% v/v
2.53 gh 0.67 def 38.43 g
Proaxis 0.5CS 1.92 fl oz/a 0.13 h 0.00 f 58.71 a–d
Trimax 4SC 0.047 lb ai/a 3.80 gh 4.73 a–d 50.58 b–g
Venom 75SG 60 g ai/a 42.80 b–e 3.00 a–e 53.18 b–f

SOYBEANS
University of Illinois Extension • College of Agricultural, Consumer and Environmental Sciences • Department of Crop Sciences 26
on Targeton Target 2005 Annual summary of field crop insect management trials, Department of Crop Sciences, University of Illinois
Product Rate Rate unit Mean no. aphids per three trifoliates (9 leaflets)1,2
Mean yield (bu/A)1,5
7 DAT3 14 DAT4
Warrior 1CS 2 fl oz/a 0.27 h 0.07 f 58.02 a–e
Warrior 1CS 2.56 fl oz/a 1.00 gh 0.40 def 55.70 a–f
Warrior 1CS 3.2 fl oz/a 0.40 h 0.50 def 54.34 a–f
Untreated check — — 23.47 b–f 4.60 ab 52.34 b–f
Untreated check — — 8.00 e–h 1.13 b–f 55.35 a–f
Untreated check — — 52.93 bc 5.13 abc 57.61 a–e
1 Means followed by the same letter do not differ significantly (P = 0.10, Duncan’s New Multiple Range Test).2 Data were transformed (√x + 0.5) for analysis. The actual means are shown.3 Counts of soybean aphids on 4 August, 2005, seven days after treatment (DAT).4 Counts of soybean aphids on 11 August, 2005, 14 days after treatment (DAT).5 Yield sample from 25 feet of the center two rows of each plot and converted to bushels per acre at 13% moisture.6 Biotune is a surfactant.7 N.I.S. = Non-ionic surfactant.

SOYBEANS
University of Illinois Extension • College of Agricultural, Consumer and Environmental Sciences • Department of Crop Sciences 27
on Targeton Target 2005 Annual summary of field crop insect management trials, Department of Crop Sciences, University of Illinois
SECTION 11
Evaluation of insecticidal seed treatments to control soybean aphids (Aphis glycines Matsumura) in Illinois, 2005Ronald E. Estes, Jared B. Schroeder, Kevin L. Steffey, and Michael E. Gray
Location
We established one trial at the Ruth and Alvin Popkin Farm near Morrison (Whiteside County), IL.
Experimental Design and Methods
The experimental design was a randomized complete block with three replications. The plot size for each treatment was 20 feet x 30 feet. Samples varied by sampling date. On 5 July, aphids were counted on 10 whole plants from each plot. On 21 July, aphids were counted on nine leaflets (three each from the upper, middle, and lower sections of the plant) from each of five plants per plot. Two rows from each plot were mechanically harvested on 10 October and the yields were adjusted to bushels per acre at 13% moisture.
Planting and Insecticide Application
Trials were planted using a four-row, Almaco-constructed planter, with John Deere 7300 row units. John Deere precision soybean meters were used.
Agronomic Information
Agronomic information is listed in Table 11.1.
Climatic Conditions
Temperature and precipitation data are presented in Appendix I.
Statistical Analysis
Data were analyzed using SAS 9.1 (SAS Institute 2004).
Results and Discussion
On 5 July, all but one of the seed treatments (Apron Maxx RFC) had significantly fewer aphids than the untreated check. Cruiser 5 FS (0.076 mg ai/seed) + Apron Maxx RFC, Maxx pak, and Maxx Pak + Cruiser 5 FS each had significantly fewer aphids than the untreated check or Apron Maxx RFC on 21 July. The numbers of aphids in all other treatments were not significantly different from the numbers of aphids in the untreated check. Despite differences in numbers of aphids, there were no significant differences in yield among any of the treatments.
TABLE 11.1 • Agronomic factors for efficacy trial of insecticidal seed treatments to control soybean aphids, Morrison (Whiteside County), University of Illinois, 2005
Planting date 17 May, 2005
Row spacing 30 inches
Seeding rate 130,000/acre
Previous crop Corn
Tillage Spring—disked twice

SOYBEANS
University of Illinois Extension • College of Agricultural, Consumer and Environmental Sciences • Department of Crop Sciences 28
on Targeton Target 2005 Annual summary of field crop insect management trials, Department of Crop Sciences, University of Illinois
TABLE 11.2 • Evaluation of insecticidal seed treatments to control soybean aphids, Morrison (Whiteside County), University of Illinois, 2005
Product Rate Rate unit Mean no. aphids Mean yield (bu/A)2,5
5 July1,2,3 21 July1,2,4
Apron Maxx RFC 0.1 oz ai/cwt 26.43 a 103.05 a 55.43 a
Cruiser 5 FS + Apron Maxx RFC
0.80.1
oz ai/cwtoz ai/cwt
2.70 b 46.75 ab 56.56 a
Cruiser 5 FS + Apron Maxx RFC
0.0760.1
mg ai/seedoz ai/cwt
3.13 b 38.10 b 62.07 a
Maxx Pak 0.9 oz ai/cwt 4.13 b 26.08 b 56.40 a
Maxx Pak + Cruiser 5 FS
0.90.8
oz ai/cwtoz ai/cwt
1.81 b 29.48 b 57.91 a
Soygard 35WP + Gaucho 600
0.1121.04
oz ai/cwtoz ai/cwt
4.20 b 71.40 ab 56.94 a
Untreated check — — 25.45 a 104.95 a 57.36 a
1 Data were transformed (log(x + 10)) for analysis. Actual means are shown.2 Means followed by the same letter do not differ significantly (P = 0.10, Tukey’s).3 Means presented are based upon 10 whole pant samples per plot. 4 Five samples of three trifoliates each were taken per plot. Means presented are based upon the number of aphids per three trifoliates (nine leaflets).
5 The center two rows of each four row plot were mechanically harvested and converted to bushels per acre at 13% moisture.

SOYBEANS
University of Illinois Extension • College of Agricultural, Consumer and Environmental Sciences • Department of Crop Sciences 29
on Targeton Target 2005 Annual summary of field crop insect management trials, Department of Crop Sciences, University of Illinois
SECTION 12
Evaluation of insecticidal seed treatments and foliar applied insecticides to control soybean aphids (Aphis glycines Matsumura) in Illinois, 2005Ronald E. Estes, Jared B. Schroeder, Kevin L. Steffey, and Michael E. Gray
Location
We established one trial at the Ruth and Alvin Popkin Farm near Morrison (Whiteside County), IL.
Experimental Design and Methods
The experimental design was a randomized complete block with four replications. The plot size for each treatment was 10 feet x 30 feet. Soybean aphids were counted on 10 whole plants per plot on 5 July. On 21 July, 4 August (7 days after being treated), and 11 August (14 days after being treated), aphids were counted on nine leaflets (three each from the upper, middle, and lower sections of the plant) from each of five plants per plot. Two rows from each plot were mechanically harvested on 10 October, and the yields were adjusted to bushels per acre at 13% moisture.
Planting and Insecticide Application
Trials were planted using a four-row, Almaco-constructed planter, with John Deere 7300 row units. John Deere precision soybean meters were used. Insecticides were applied to the soybean foliage on 28 July, with a CO2 backpack sprayer and a four-row hand boom. TeeJet 8002VS spray tips were calibrated to deliver a volume of 20 gallons per acre.
Agronomic Information
Agronomic information is listed in Table 12.1.
Climatic Conditions
Temperature and precipitation data are presented in Appendix I.
Statistical Analysis
Data were analyzed using ARM 7 (Agricultural Research Manager), revision 7.0.5. (Copyright© 1982–2003 Gylling Data Management, Inc.).
Results and Discussion
Densities of soybean aphids on 5 July, 21 July, 4 August, and 11 August are presented in Table 12.2. When initial aphid counts were taken on 5 July and 21 July, both plots with seed treatments only (Cruiser 5FS and Gaucho) had smaller numbers of aphids than in the untreated check. The application of Warrior on 28 July reduced aphid numbers significantly in the designated plots by 4 August (7 DAT). Aphid densities in plots treated with Cruiser + Warrior (1.15 aphids per nine leaflets), Gaucho + Warrior (1.25 aphids), and Warrior (10.8 aphids) were significantly less than aphid densities in the untreated check (38.8 aphids). Aphid densities in the plots treated with Warrior were less than aphid densities in all other plots. Additionally, aphid densities in the Gaucho and Cruiser treatments were significantly less (21.15 and 13.40 aphids, respectively) than aphid densities in the untreated check on August 4. On 11 August (14 DAT), aphid densities in all treatments declined from the previous sampling date. However, aphid densities in almost all plots treated with insecticides were significantly less than aphid densities in the untreated check.
Yields from each of the treatments are indicated in Table12.3. There were no significant differences in yields among any of the treatments.
TABLE 12.1 • Agronomic factors for efficacy trial of insecticidal seed treatments and foliar applied insecticides to control soybean aphids, Morrison (Whiteside County), University of Illinois, 2005
Planting date 17 May, 2005
Row spacing 30 inches
Seeding rate 130,000/acre
Previous crop Corn
Tillage Spring—disked twice

SOYBEANS
University of Illinois Extension • College of Agricultural, Consumer and Environmental Sciences • Department of Crop Sciences 30
on Targeton Target 2005 Annual summary of field crop insect management trials, Department of Crop Sciences, University of Illinois
TABLE 12.2 • Evaluation of insecticidal seed treatments and foliar applied insecticides to control soybean aphids—densities of aphids, Morrison (Whiteside County), University of Illinois, 2005
Product Rate Rate unit Timing Mean no. aphids1,2
5 July3 21 July4 4 Aug4 11 Aug4
Cruiser 5FS 2.0 fl oz/cwt At planting 3.50 b 20.35 c 21.15 b 1.25 b
Cruiser FS + Warrior 1EC
2.02.56
fl oz/cwtfl oz/a
At planting28 July
1.80 b 31.55 bc 1.15 c 0.00 b
Gaucho 2.0 fl oz/cwt At planting 5.78 b 17.95 c 13.40 b 2.50 ab
Gaucho + Warrior 1EC
2.02.56
fl oz/cwtfl oz/a
At planting28 July
3.05 b 50.15 bc 1.25 c 0.30 b
Warrior 1EC 2.56 fl oz/a 28 July 9.93 a 152.30 a 10.80 c 1.76 b
Untreated check — — — 8.93 a 124.20 ab 38.80 a 7.59 a
1 Data were transformed (log(x + 1)) for analysis. Actual means are shown. 2 Means followed by the same letter do not differ significantly (P = 0.10, Duncan’s New Multiple Range Test).3 Means presented are based upon 10 whole plant samples per plot.4 Five samples of three trifoliates each were taken per plot. Means presented are based upon the number of aphids per three trifoliates (nine leaflets).
TABLE 12.3 • Evaluation of insecticidal seed treatments and foliar applied insecticides to control soybean aphids—yields, Morrison (Whiteside County), University of Illinois, 2005
Product Rate Rate unit Timing Mean yield (bu/A)1,2
Cruiser 5FS 2.0 fl oz/cwt At planting 59.25 a
Cruiser FS + Warrior 1EC
2.0 fl oz/cwt At planting 60.60 a
2.56 fl oz/A 28 July
Gaucho 2.0 fl oz/cwt At planting 60.61 a
Gaucho + Warrior 1EC
2.0 fl oz/cwt At planting 60.22 a
2.56 fl oz/A 28 July
Warrior 1EC 2.56 fl oz/A 28 July 54.96 a
Untreated check — — — 57.11 a
1 The center two rows of each four row plot were mechanically harvested and converted to bushels per acre at 13% moisture.2 Means followed by the same letter do not differ significantly (P = 0.10, Duncan’s New Multiple Range Test).

SOYBEANS
University of Illinois Extension • College of Agricultural, Consumer and Environmental Sciences • Department of Crop Sciences 31
on Targeton Target 2005 Annual summary of field crop insect management trials, Department of Crop Sciences, University of Illinois
SECTION 13
Evaluation of foliar applied insecticides to control twospotted spider mites (Tetranychus urticae) in soybean in Illinois, 2005Kevin L. Steffey, Michael E. Gray, Ronald E. Estes, Jared B. Schroeder, Darren M. Bakken, and Dan Schaefer
LocationWe established one trial at the Brian and Mark Meharry Farm near Tolono (Champaign County), IL.
Experimental Design and MethodsThe experimental design was a randomized complete block with four replications. The plot size for each treatment was 20 feet x 30 feet. Densities of spider mites were estimated on five leaflets from a diagonal transect of each plot in each replication on six dates—30 June, 7 July, 14 July, 21 July, 28 July, and 4 August. Plant heights also were estimated on the same dates when spider mite densities were estimated. Along a diagonal transect in each plot, the heights of 10 randomly selected plants were measured with yardsticks from the ground to the topmost leaves, which were pulled upright for the measurement. Yields of all plots were estimated by harvesting a 15 ft × 30 ft strip on 10 October, 2005, with a model 1620 Case International combine. The weight per plot was adjusted to bushels per acre at 13% moisture.
Planting and Insecticide ApplicationThis trial was conducted with the collaboration of the producer, who planted the soybeans in the field in which the experiment was established. Miticides were applied to the soybean foliage on 24 June and 8 July with a CO2 backpack sprayer and a four-row hand boom. TeeJet 8002VS spray tips were calibrated to deliver a volume of 20 gallons per acre.
Agronomic InformationAgronomic information is listed in Table 13.1.
Climatic ConditionsTemperature and precipitation data are presented in Appendix I.
Statistical AnalysisData were analyzed using SAS 9.1 (SAS Institute 2004).
Results and Discussion
The mean numbers of twospotted spider mites per five soybean leaflets in each treatment on each of six sampling dates are shown in Figure 13.1. The densities of spider mites in the two untreated check plots were averaged for display in Figure 13.1. The density of spider mites in the untreated check plots peaked on 14 July at 1,122 mites per five leaflets, after which the density of mites per five leaflets began to decline. Early applications (24 June) of both Lorsban and Dimethoate prevented rapid increases in densities of spider mites until 14 July. Mite densities in the plots not treated until 8 July increased at approximately the same rate as the increasing densities in the untreated check from 30 June to 7 July. The densities in the late-treated plots declined markedly from 7 July to 14 July after the miticides were applied on 8 July. However, the densities of mites in the late-treated plots resurged by 21 July.
In the plots treated twice, the numbers of mites per five leaflets on 14 July were roughly equivalent to the numbers of mites
FIGURE 13.1 • Mean numbers of twospotted spider mites per 5 leaflets on six sampling dates, Tolono (Champaign County), IL, 2005.
Lorsb
an ea
rly
1400
1200
1000
800
600
400
200
0
Lorsb
an la
te
Lorsb
an 2x
Dim
etho
ate e
arly
Dim
etho
ate e
arly
Dim
etho
ate 2
x
Untre
ated
30 Jun7 Jul14 Jul21 Jul28 Jul4 Aug
TABLE 13.1 • Agronomic factors for efficacy trial of foliar applied insecticides to control twospotted spider mites, Tolono (Champaign County), University of Illinois, 2005
Planting date 5 May, 2005
Row spacing 15 inches
Previous crop Corn
Tillage No tillage; soybean planted into corn stubble

SOYBEANS
University of Illinois Extension • College of Agricultural, Consumer and Environmental Sciences • Department of Crop Sciences 32
on Targeton Target 2005 Annual summary of field crop insect management trials, Department of Crop Sciences, University of Illinois
Lorsb
an ea
rly
0
10
20
30
40
50
60
70
80
90
100
Lorsb
an la
te
Lorsb
an 2x
Dim
etho
ate e
arly
Dim
etho
ate e
arly
Dim
etho
ate 2
x
Untre
ated
30 Jun7 Jul14 Jul21 Jul28 Jul4 Aug
in the plots treated early. However, the densities of mites in the plots treated twice with either Lorsban or Dimethoate increased after the second treatment and reached relatively large numbers by 21 July—971 mites per five leaflets in the Lorsban-treated plots, and 782 mites per five leaflets in the Dimethoate-treated plots.
Densities of spider mites began to decline in almost all plots by 28 July. The twospotted spider mite population in the entire plot area “crashed” by 4 August.
The mean heights of soybean plants in each treatment on each of six sampling dates are shown in Figure 13.2. The plant heights in the two untreated check plots were averaged for display in Figure 13.2. The mean heights on 30 June reveal the initial differences in heights resulting from the patchiness of the spider mite infestation in the field. However, plant heights in the miticide-treated plots began to equalize in plots treated early (24 June) and twice (24 June and 8 July). Plant heights remained somewhat shorter in the plots treated late (8 July) than in the plots treated early and twice throughout most of the sampling period. The mean plant height in the untreated check plots was shorter than the mean plant heights in the miticide-treated plots on 28 July and 4 August.
The LSD (α = 0.05) of 7.72 bushels per acre for yield indicated that there were some significant differences among treatments (Table 13.2). The mean yields in the two untreated checks were significantly less than the mean yields in the plots
FIGURE 13.2 • Mean heights (cm) of soybean plants infested with twospotted spider mites on six sampling dates, Tolono (Champaign County), IL, 2005.
treated both early and late with Dimethoate. The mean yields in the Lorsban-treated and Dimethoate-treated plots were not significantly different. The mean yields in the plots treated early, late, and twice with each miticide were not significantly different.
TABLE 13.2 • Evaluation foliar applied insecticides to control twospotted spider mites—densities of twospotted spider mites, plant heights, and yields, Tolono (Champaign County), University of Illinois, 2005
Treatment1 Date of miticide application Mean no. spider mites per 5 leaflets
Mean plant height (cm)
Mean yield (bu/A)2
Dimethoate applied early June 24 — 358.33 70.39 61.20
Dimethoate applied late — July 8 394.21 65.59 62.10
Dimethoate applied twice June 24 July 8 347.21 70.92 59.70
Untreated — — 506.17 63.69 53.24
Lorsban applied early June 24 — 291.33 69.95 55.97
Lorsban applied late — July 8 334.13 63.13 58.40
Lorsban applied twice June 24 July 8 345.67 71.41 58.04
Untreated — — 505.83 59.53 52.75
LSD, α = 0.05 ns 1.38 7.72
1 Dimethoate and Lorsban each were applied at a rate of 1 pt/ac.2 The center 12 rows of each plot were mechanically harvested and converted to bushels per acre at 13% moisture.Mean no. mites/5 leaflets

SWEET CORN
University of Illinois Extension • College of Agricultural, Consumer and Environmental Sciences • Department of Crop Sciences 33
on Targeton Target 2005 Annual summary of field crop insect management trials, Department of Crop Sciences, University of Illinois
SECTION 14
Evaluation of foliar applied insecticides to control corn earworm (Helicoverpa zea Boddie) in sweet corn in Illinois, 2005Ronald E. Estes, Jared B. Schroeder, and Richard A. Weinzierl
Location
We established one trial at the University of Illinois Agricultural Engineering Farm near Urbana.
Experimental Design and Methods
The experimental design was a randomized complete block with four replications. The plot size for each treatment was 10 feet x 30 feet. Twenty-five randomly selected ears were extracted from the center two rows of each four-row plot on 10 August and assessed for corn earworm larvae injury on the side and/or tip of each ear. The number and size (small, medium, and large) of corn earworm larvae were also recorded for each ear.
Planting and Insecticide Application
The trial was planted using a four-row, Almaco-constructed planter with John Deere 7300 row units. Precision Planting finger pick-up style metering units were used. Foliar insecticides were applied at silking (R1 growth stage; 25 July) and then every three days until silking was complete (28 July, 1 August, 4 August, and 7 August) with a CO2 backpack sprayer and a four-row hand boom. TeeJet 8002VS spray tips were calibrated to deliver a volume of 20 gallons per acre.
Agronomic Information
Agronomic information is listed in Table 14.1.
Climatic Conditions
Temperature and precipitation data are presented in Appendix I.
Statistical Analysis
Data were analyzed using ARM 7 (Agricultural Research Manager), revision 7.0.5. (Copyright© 1982–2003 Gylling Data Management, Inc.).
TABLE 14.1 • Agronomic factors for efficacy trial of foliar applied insecticides to control corn earworm in sweet corn, Urbana, University of Illinois, 2005
Planting date 8 June, 2005
Ear assessment date 10 August, 2005
Row spacing 30 inches
Seeding rate 33,000/acre
Previous crop Soybean
Tillage Fall—chisel plowSpring—Field cultivator
Results and Discussion
Table 14.2 shows the mean number of corn earworm larvae per 25 ears, percent reduction of corn earworms, percent reduction in tip damage, percent reduction in side damage, and the percentage of ears sampled with no damage. Mean numbers of corn earworm larvae per 25 ears in the Warrior (8.25) and Baythroid (9.25) treatments (both pyrethroids) were significantly higher in comparison with the untreated check (4.00). All other treatments were not significantly higher than the untreated check. Sevin and Entrust provided 69 and 56 percent reductions in corn earworm numbers, respectively, and tip damage was lowest in these treatments as well. Tip damage in the Warrior, Baythroid, Lannate, and Mustang Max treatments exceeded that in the untreated check. Relatively low numbers of corn earworm larvae and low levels of damage in the untreated check may have resulted in part from silk-clipping by western corn rootworm beetles and the loss of earworm eggs from those ear tips. Western corn rootworm beetle densities at this site were extremely high. In addition, it is possible that spray intervals used in this trial allowed some corn earworm larvae to enter ears at periods when little or no insecticide residue was present on new silks. The percentage of ears without damage in the Entrust, Intrepid, Lannate, Rimon, and Sevin treatments did not significantly differ from the untreated check. However, what is alarming about the data collected from this trial is that the percentage of ears with no damage was significantly lower in the Baythroid (42%), Mustang Max (50%), and Warrior (48%) treatments (all pyrethroids) than the untreated check (70%). Similar observations of reduced effectiveness of pyrethroid insecticides against the corn earworm have been reported from Indiana, Wisconsin, and Minnesota. Unpublished data from bioassays for corn earworm populations collected from Illinois and other Midwest states indicate an increasing level of

SWEET CORN
University of Illinois Extension • College of Agricultural, Consumer and Environmental Sciences • Department of Crop Sciences 34
on Targeton Target 2005 Annual summary of field crop insect management trials, Department of Crop Sciences, University of Illinois
pyrethroid resistance, presumably selected by widespread use of pyrethroids in southern cotton production systems. Corn earworm infestations that develop in the Midwest result from migration of adults into the region form the south on weather systems each spring or summer. It is likely that future transport
of pyrethroid-resistant populations into the Midwest will result in a need for alternative insecticides to control this pest in sweet corn and other susceptible crops, including seed corn, tomatoes, snap beans, and peppers.
TABLE 14.2 • Evaluation of foliar applied insecticides for control of corn earworm in sweet corn, Urbana, University of Illinois, 2005
Product Rate Rate Unit Mean no. of CEW per 25
ears1
% Reduction in no. of CEW per
100 ears
% Reduction in tip damage
% Reduction in side damage
% Ears without
damage1
Baythroid 2E 2.4 fl oz/a 9.25 a 0 0 0 42 d
Entrust 80WP 2 oz wt/a 1.75 b 56 35 75 83 a
Intrepid 2F 6 fl oz/a 3.75 b 6 4 63 75 ab
Lannate 90SP 0.4 lb/a 3.50 b 13 0 0 62 bc
Mustang Max 0.8EC 4 fl oz/a 3.25 b 19 0 88 50 cd
Rimon 0.83EC 9 fl oz/a 3.00 b 25 27 25 79 a
Sevin XLR 4F 2 qt/a 1.25 b 69 54 88 86 a
Warrior 1CS 3 fl oz/a 8.25 a 0 0 0 48 cd
Untreated check — — 4.00 b — — — 70 ab
1 Means followed by the same letter do not differ significantly (P = 0.05, Duncan’s New Multiple Range Test).

University of Illinois Extension • College of Agricultural, Consumer and Environmental Sciences • Department of Crop Sciences 35
2005 Annual summary of field crop insect management trials, Department of Crop Sciences, University of Illinoison Targeton Target
APPENDIX I • Temperature and Precipitation
2005 Daily Weather Data for DeKalb, Illinois (Midwest Climate Center)
Date Precipitation Mean (inches) Temperature (°F)
April 1 0.00 48
April 2 0.20 46
April 3 0.00 45
April 4 0.00 51
April 5 0.00 55
April 6 0.00 64
April 7 0.12 61
April 8 0.00 49
April 9 0.00 54
April 10 0.00 57
April 11 0.00 67
April 12 0.04 62
April 13 0.70 41
April 14 0.00 47
April 15 0.00 51
April 16 0.00 54
April 17 0.03 59
April 18 T 63
April 19 0.00 67
April 20 0.00 67
April 21 0.00 57
April 22 0.33 51
April 23 0.22 40
April 24 0.00 37
April 25 0.00 43
April 26 0.03 51
April 27 0.05 46
April 28 0.00 46
April 29 0.00 49
April 30 0.00 48
M=MissingT=Trace
2005 Daily Weather Data for DeKalb, Illinois (Midwest Climate Center)
Date Precipitation Mean (inches) Temperature (°F)
May 1 T 45
May 2 0.00 41
May 3 T 35
May 4 0.00 42
May 5 0.00 50
May 6 0.00 57
May 7 T 63
May 8 0.00 62
May 9 0.04 70
May 10 0.11 67
May 11 1.25 67
May 12 0.15 51
May 13 0.20 47
May 14 0.00 57
May 15 0.00 52
May 16 T 47
May 17 0.00 51
May 18 0.00 62
May 19 0.82 66
May 20 0.10 64
May 21 0.00 59
May 22 T 61
May 23 0.00 68
May 24 0.00 60
May 25 0.00 60
May 26 T 61
May 27 0.00 63
May 28 0.08 60
May 29 T 57
May 30 0.00 59
May 31 0.00 62
M=MissingT=Trace

University of Illinois Extension • College of Agricultural, Consumer and Environmental Sciences • Department of Crop Sciences 36
2005 Annual summary of field crop insect management trials, Department of Crop Sciences, University of Illinoison Targeton Target
2005 Daily Weather Data for DeKalb, Illinois (Midwest Climate Center)
Date Precipitation Mean (inches) Temperature (°F)
June 1 0.00 66
June 2 0.00 71
June 3 0.00 71
June 4 0.00 67
June 5 0.47 75
June 6 0.00 74
June 7 0.00 77
June 8 0.00 81
June 9 0.23 77
June 10 0.03 78
June 11 0.00 77
June 12 0.00 78
June 13 0.00 74
June 14 0.00 78
June 15 0.00 70
June 16 0.00 64
June 17 0.00 65
June 18 0.00 62
June 19 0.00 65
June 20 0.00 70
June 21 0.00 75
June 22 0.00 77
June 23 0.00 75
June 24 0.00 80
June 25 0.00 83
June 26 0.00 81
June 27 0.00 84
June 28 0.10 83
June 29 0.00 82
June 30 0.30 81
1.13
2005 Daily Weather Data for DeKalb, Illinois (Midwest Climate Center)
Date Precipitation Mean (inches) Temperature (°F)
July 1 0.00 75
July 2 0.00 63
July 3 0.00 67
July 4 0.13 74
July 5 0.88 69
July 6 T 72
July 7 0.00 71
July 8 0.00 71
July 9 0.00 74
July 10 0.00 77
July 11 0.00 80
July 12 0.03 80
July 13 T 73
July 14 0.00 77
July 15 0.00 77
July 16 0.00 76
July 17 0.00 82
July 18 0.01 84
July 19 0.00 76
July 20 0.00 78
July 21 1.00 79
July 22 0.08 76
July 23 0.00 78
July 24 0.04 75
July 25 0.00 87
July 26 0.19 80
July 27 0.47 69
July 28 0.00 65
July 29 0.00 69
July 30 0.00 73
July 31 0.00 75
1.79
M=MissingT=Trace

University of Illinois Extension • College of Agricultural, Consumer and Environmental Sciences • Department of Crop Sciences 37
2005 Annual summary of field crop insect management trials, Department of Crop Sciences, University of Illinoison Targeton Target
2005 Daily Weather Data for DeKalb, Illinois (Midwest Climate Center)
Date Precipitation Mean (inches) Temperature (°F)
August 1 0.00 75
August 2 0.00 78
August 3 0.00 81
August 4 0.01 82
August 5 0.00 77
August 6 0.00 72
August 7 0.00 75
August 8 0.00 77
August 9 0.00 79
August 10 0.12 82
August 11 0.05 78
August 12 1.35 72
August 13 0.00 75
August 14 0.00 69
August 15 0.00 68
August 16 0.00 71
August 17 0.00 73
August 18 0.00 74
August 19 0.96 75
August 20 1.66 78
August 21 0.00 73
August 22 0.00 70
August 23 0.00 64
August 24 0.00 65
August 25 0.00 68
August 26 0.00 71
August 27 0.00 75
August 28 0.00 73
August 29 0.00 73
August 30 0.00 74
August 31 0.00 69
4.14
2005 Daily Weather Data for DeKalb, Illinois (Midwest Climate Center)
Date Precipitation Mean (inches) Temperature (°F)
September 1 0.00 69
September 2 0.00 69
September 3 0.00 68
September 4 0.00 68
September 5 0.00 71
September 6 0.00 75
September 7 0.00 75
September 8 0.00 77
September 9 0.00 72
September 10 0.00 76
September 11 0.00 80
September 12 0.00 80
September 13 0.00 79
September 14 0.29 78
September 15 0.00 65
September 16 0.49 61
September 17 0.00 62
September 18 0.00 65
September 19 0.06 71
September 20 0.06 71
September 21 0.00 71
September 22 0.02 74
September 23 0.00 72
September 24 0.00 62
September 25 0.45 66
September 26 0.05 70
September 27 0.00 58
September 28 0.00 63
September 29 0.08 55
September 30 0.00 50
1.5

University of Illinois Extension • College of Agricultural, Consumer and Environmental Sciences • Department of Crop Sciences 38
2005 Annual summary of field crop insect management trials, Department of Crop Sciences, University of Illinoison Targeton Target
2005 Daily Weather Data for DeKalb, Illinois (Midwest Climate Center)
Date Precipitation Mean (inches) Temperature (°F)
October 1 0.00 56
October 2 M M
October 3 0.18 M
October 4 0.00 77
October 5 0.00 77
October 6 0.00 65
October 7 0.00 48
October 8 0.00 44
October 9 0.00 46
October 10 0.00 53
October 11 0.00 55
October 12 0.00 59
October 13 0.00 60
October 14 0.00 58
October 15 0.00 62
October 16 0.00 55
October 17 0.00 53
October 18 0.05 60
October 19 0.00 61
October 20 0.00 53
October 21 0.00 48
October 22 0.00 52
October 23 0.00 45
October 24 0.30 38
October 25 0.00 43
October 26 0.00 44
October 27 0.00 31
October 28 0.00 32
October 29 0.00 44
October 30 0.00 48
October 31 0.00 51
.53
M=MissingT=Trace

University of Illinois Extension • College of Agricultural, Consumer and Environmental Sciences • Department of Crop Sciences 39
2005 Annual summary of field crop insect management trials, Department of Crop Sciences, University of Illinoison Targeton Target
2005 Daily Weather Data for Emington, Illinois (Midwest Climate Center)*Weather data from Dwight weather station
Date Precipitation Mean (inches) Temperature (°F)
April 1 0.00 47
April 2 0.20 48
April 3 0.00 51
April 4 0.00 61
April 5 0.00 60
April 6 0.00 63
April 7 0.03 50
April 8 0.00 56
April 9 0.00 59
April 10 0.00 68
April 11 0.00 69
April 12 0.18 53
April 13 0.39 51
April 14 0.00 52
April 15 0.00 56
April 16 0.00 59
April 17 0.00 64
April 18 T 66
April 19 0.00 65
April 20 0.00 64
April 21 0.55 54
April 22 0.25 55
April 23 0.10 39
April 24 0.00 44
April 25 0.00 50
April 26 0.08 50
April 27 0.03 47
April 28 0.00 50
April 29 0.00 50
April 30 0.01 49
1.82
M=MissingT=Trace
2005 Daily Weather Data for Emington, Illinois (Midwest Climate Center)*Weather data from Dwight weather station
Date Precipitation Mean (inches) Temperature (°F)
May 1 0.00 46
May 2 0.00 42
May 3 0.00 37
May 4 0.00 40
May 5 0.00 47
May 6 0.00 55
May 7 0.00 64
May 8 0.00 66
May 9 0.15 70
May 10 0.00 68
May 11 T 72
May 12 T 60
May 13 T 53
May 14 T 67
May 15 0.00 55
May 16 0.00 46
May 17 0.00 55
May 18 0.00 63
May 19 0.45 68
May 20 0.10 66
May 21 0.00 63
May 22 T 57
May 23 0.00 62
May 24 0.00 62
May 25 0.00 63
May 26 0.00 63
May 27 0.00 65
May 28 0.00 61
May 29 0.00 56
May 30 0.04 62
May 31 0.00 61
.74
M=MissingT=Trace

University of Illinois Extension • College of Agricultural, Consumer and Environmental Sciences • Department of Crop Sciences 40
2005 Annual summary of field crop insect management trials, Department of Crop Sciences, University of Illinoison Targeton Target
2005 Daily Weather Data for Emington, Illinois (Midwest Climate Center)*Weather data from Dwight weather station
Date Precipitation Mean (inches) Temperature (°F)
June 1 0.00 66
June 2 0.00 71
June 3 0.00 68
June 4 0.08 66
June 5 0.00 77
June 6 0.03 78
June 7 0.03 79
June 8 0.00 79
June 9 0.00 78
June 10 0.58 79
June 11 0.00 77
June 12 0.02 72
June 13 0.03 77
June 14 0.00 70
June 15 0.20 66
June 16 T 64
June 17 0.00 60
June 18 0.00 61
June 19 0.00 67
June 20 0.00 66
June 21 0.00 72
June 22 0.00 74
June 23 0.00 73
June 24 0.00 83
June 25 0.00 82
June 26 0.00 83
June 27 0.00 81
June 28 0.00 83
June 29 0.00 79
June 30 0.00 80
.97
M=MissingT=Trace
2005 Daily Weather Data for Emington, Illinois (Midwest Climate Center)*Weather data from Dwight weather station
Date Precipitation Mean (inches) Temperature (°F)
July 1 0.00 76
July 2 0.00 64
July 3 0.00 65
July 4 0.00 74
July 5 0.20 74
July 6 0.00 71
July 7 0.00 72
July 8 0.00 70
July 9 0.00 71
July 10 0.00 73
July 11 0.00 75
July 12 0.22 76
July 13 0.10 75
July 14 0.00 76
July 15 0.00 78
July 16 0.00 77
July 17 0.00 80
July 18 0.00 83
July 19 0.00 75
July 20 0.00 76
July 21 1.95 79
July 22 0.00 78
July 23 0.00 75
July 24 0.00 76
July 25 0.00 86
July 26 0.07 83
July 27 1.62 74
July 28 0.00 64
July 29 0.00 67
July 30 0.00 71
July 31 0.00 72
4.16

University of Illinois Extension • College of Agricultural, Consumer and Environmental Sciences • Department of Crop Sciences 41
2005 Annual summary of field crop insect management trials, Department of Crop Sciences, University of Illinoison Targeton Target
2005 Daily Weather Data for Emington, Illinois (Midwest Climate Center)*Weather data from Dwight weather station
Date Precipitation Mean (inches) Temperature (°F)
August 1 0.00 72
August 2 0.00 74
August 3 0.00 78
August 4 T 79
August 5 0.00 77
August 6 0.00 69
August 7 0.00 70
August 8 0.00 73
August 9 0.00 75
August 10 0.00 79
August 11 T 78
August 12 0.50 72
August 13 0.35 76
August 14 0.80 70
August 15 0.07 65
August 16 0.00 68
August 17 0.00 69
August 18 T 72
August 19 1.08 76
August 20 0.05 78
August 21 0.00 73
August 22 0.00 69
August 23 0.00 64
August 24 0.00 61
August 25 0.00 64
August 26 0.05 69
August 27 0.00 75
August 28 0.00 71
August 29 0.00 74
August 30 0.00 71
August 31 0.00 70
2.9
M=MissingT=Trace
2005 Daily Weather Data for Emington, Illinois (Midwest Climate Center)*Weather data from Dwight weather station
Date Precipitation Mean (inches) Temperature (°F)
September 1 0.00 69
September 2 0.00 70
September 3 0.00 67
September 4 0.00 66
September 5 0.00 66
September 6 0.00 71
September 7 0.00 70
September 8 0.00 75
September 9 0.00 72
September 10 0.00 75
September 11 0.00 78
September 12 M M
September 13 0.00 76
September 14 M M
September 15 0.00 64
September 16 0.45 61
September 17 0.00 57
September 18 0.00 62
September 19 0.20 69
September 20 0.10 73
September 21 0.00 69
September 22 0.00 73
September 23 0.25 77
September 24 M M
September 25 M M
September 26 0.25 67
September 27 0.00 59
September 28 0.00 61
September 29 0.50 58
September 30 0.00 50
1.75
M=MissingT=Trace

University of Illinois Extension • College of Agricultural, Consumer and Environmental Sciences • Department of Crop Sciences 42
2005 Annual summary of field crop insect management trials, Department of Crop Sciences, University of Illinoison Targeton Target
2005 Daily Weather Data for Emington, Illinois (Midwest Climate Center)*Weather data from Dwight weather station
Date Precipitation Mean (inches) Temperature (°F)
October 1 0.00 54
October 2 0.00 65
October 3 0.00 71
October 4 0.00 76
October 5 0.00 76
October 6 0.00 67
October 7 0.00 49
October 8 0.00 45
October 9 0.00 45
October 10 0.00 51
October 11 0.00 54
October 12 0.00 57
October 13 0.00 58
October 14 0.00 59
October 15 0.00 61
October 16 0.00 52
October 17 0.00 51
October 18 0.00 61
October 19 0.00 61
October 20 0.00 53
October 21 0.25 48
October 22 0.00 50
October 23 0.00 44
October 24 T 39
October 25 0.00 44
October 26 0.00 45
October 27 0.00 44
October 28 0.00 45
October 29 0.00 41
October 30 0.00 43
October 31 0.00 47
0.25
M=MissingT=Trace

University of Illinois Extension • College of Agricultural, Consumer and Environmental Sciences • Department of Crop Sciences 43
2005 Annual summary of field crop insect management trials, Department of Crop Sciences, University of Illinoison Targeton Target
2005 Daily Weather Data for Mahomet, Illinois (Midwest Climate Center)
Date Precipitation (inches)
April 1 0.00
April 2 0.23
April 3 0.00
April 4 0.00
April 5 0.00
April 6 0.00
April 7 0.03
April 8 0.00
April 9 0.00
April 10 0.00
April 11 0.00
April 12 0.58
April 13 0.31
April 14 0.00
April 15 0.00
April 16 0.00
April 17 0.00
April 18 0.00
April 19 0.00
April 20 0.00
April 21 1.62
April 22 0.32
April 23 0.20
April 24 0.00
April 25 0.00
April 26 0.17
April 27 T
April 28 0.00
April 29 0.00
April 30 0.00
0.0
M=MissingT=Trace
2005 Daily Weather Data for Mahomet, Illinois (Midwest Climate Center)
Date Precipitation (inches)
May 1 0.00
May 2 0.00
May 3 0.00
May 4 0.00
May 5 0.00
May 6 0.00
May 7 0.00
May 8 0.00
May 9 0.00
May 10 0.50
May 11 0.00
May 12 0.15
May 13 T
May 14 0.04
May 15 0.02
May 16 0.00
May 17 0.00
May 18 0.00
May 19 0.40
May 20 0.26
May 21 0.01
May 22 0.00
May 23 0.00
May 24 0.00
May 25 0.00
May 26 0.00
May 27 0.00
May 28 0.00
May 29 0.00
May 30 0.03
May 31 0.00
0.76
M=MissingT=Trace

University of Illinois Extension • College of Agricultural, Consumer and Environmental Sciences • Department of Crop Sciences 44
2005 Annual summary of field crop insect management trials, Department of Crop Sciences, University of Illinoison Targeton Target
2005 Daily Weather Data for Mahomet, Illinois (Midwest Climate Center)
Date Precipitation (inches)
June 1 0.00
June 2 0.00
June 3 0.02
June 4 0.00
June 5 0.00
June 6 0.05
June 7 0.00
June 8 0.00
June 9 0.12
June 10 0.00
June 11 0.42
June 12 0.06
June 13 0.00
June 14 1.47
June 15 0.00
June 16 T
June 17 0.00
June 18 0.00
June 19 0.00
June 20 0.00
June 21 0.00
June 22 0.00
June 23 0.00
June 24 0.00
June 25 0.00
June 26 0.00
June 27 0.00
June 28 0.00
June 29 1.42
June 30 T
1.42
M=MissingT=Trace
2005 Daily Weather Data for Mahomet, Illinois (Midwest Climate Center)
Date Precipitation (inches)
July 1 0.00
July 2 0.00
July 3 0.00
July 4 0.00
July 5 0.62
July 6 0.00
July 7 0.00
July 8 0.03
July 9 0.00
July 10 0.00
July 11 0.00
July 12 1.35
July 13 0.49
July 14 0.07
July 15 0.02
July 16 0.20
July 17 T
July 18 0.06
July 19 1.62
July 20 0.02
July 21 0.00
July 22 0.00
July 23 0.00
July 24 0.00
July 25 0.00
July 26 0.00
July 27 0.72
July 28 0.00
July 29 0.00
July 30 0.00
July 31 0.00
5.20
M=MissingT=Trace

University of Illinois Extension • College of Agricultural, Consumer and Environmental Sciences • Department of Crop Sciences 45
2005 Annual summary of field crop insect management trials, Department of Crop Sciences, University of Illinoison Targeton Target
2005 Daily Weather Data for Mahomet, Illinois (Midwest Climate Center)
Date Precipitation (inches)
August 1 0.00
August 2 0.00
August 3 0.00
August 4 0.30
August 5 0.04
August 6 0.05
August 7 0.00
August 8 0.00
August 9 0.00
August 10 0.00
August 11 0.00
August 12 0.00
August 13 0.76
August 14 0.25
August 15 0.19
August 16 0.07
August 17 0.00
August 18 0.00
August 19 0.42
August 20 0.35
August 21 0.00
August 22 0.00
August 23 0.00
August 24 0.00
August 25 0.00
August 26 0.05
August 27 0.00
August 28 0.00
August 29 0.00
August 30 0.00
August 31 0.00
2.48
2005 Daily Weather Data for Mahomet, Illinois (Midwest Climate Center)
Date Precipitation (inches)
September 1 0.00
September 2 0.00
September 3 0.00
September 4 0.00
September 5 M
September 6 0.00
September 7 0.00
September 8 0.00
September 9 0.00
September 10 0.00
September 11 0.00
September 12 M
September 13 M
September 14 0.31
September 15 0.00
September 16 1.43
September 17 M
September 18 0.00
September 19 0.33
September 20 0.81
September 21 0.00
September 22 0.00
September 23 0.00
September 24 0.10
September 25 0.01
September 26 1.15
September 27 0.02
September 28 0.00
September 29 0.42
September 30 0.00
2.84
M=MissingT=Trace

University of Illinois Extension • College of Agricultural, Consumer and Environmental Sciences • Department of Crop Sciences 46
2005 Annual summary of field crop insect management trials, Department of Crop Sciences, University of Illinoison Targeton Target
2005 Daily Weather Data for Mahomet, Illinois (Midwest Climate Center)
Date Precipitation (inches)
October 1 0.00
October 2 0.00
October 3 0.00
October 4 0.00
October 5 0.00
October 6 0.00
October 7 0.00
October 8 0.00
October 9 0.00
October 10 0.00
October 11 0.00
October 12 0.00
October 13 M
October 14 0.00
October 15 0.00
October 16 0.00
October 17 0.00
October 18 0.00
October 19 0.00
October 20 0.08
October 21 1.00
October 22 0.00
October 23 0.00
October 24 0.00
October 25 0.02
October 26 0.00
October 27 0.00
October 28 0.00
October 29 0.00
October 30 0.00
October 31 0.02
1.12
M=MissingT=Trace

University of Illinois Extension • College of Agricultural, Consumer and Environmental Sciences • Department of Crop Sciences 47
2005 Annual summary of field crop insect management trials, Department of Crop Sciences, University of Illinoison Targeton Target
2005 Daily Weather Data for Monmouth, Illinois (Midwest Climate Center)
Date Precipitation Mean (inches) Temperature (°F)
April 1 0.00 51
April 2 0.00 46
April 3 0.00 47
April 4 0.00 58
April 5 0.00 65
April 6 0.00 67
April 7 0.13 53
April 8 0.00 49
April 9 0.00 55
April 10 0.00 63
April 11 0.00 71
April 12 1.13 61
April 13 0.21 47
April 14 0.00 48
April 15 0.00 53
April 16 0.00 58
April 17 0.00 65
April 18 0.00 66
April 19 0.00 68
April 20 0.00 69
April 21 0.03 62
April 22 0.72 54
April 23 0.43 44
April 24 0.00 41
April 25 0.00 44
April 26 0.11 50
April 27 0.03 44
April 28 0.00 49
April 29 0.00 48
April 30 0.00 45
2.79
2005 Daily Weather Data for Monmouth, Illinois (Midwest Climate Center)
Date Precipitation Mean (inches) Temperature (°F)
May 1 0.00 44
May 2 0.00 43
May 3 0.00 35
May 4 0.00 43
May 5 0.00 51
May 6 0.00 61
May 7 0.00 66
May 8 0.04 71
May 9 0.40 71
May 10 0.00 64
May 11 0.00 73
May 12 0.29 62
May 13 1.03 57
May 14 1.10 61
May 15 0.00 53
May 16 0.00 46
May 17 0.00 57
May 18 0.00 66
May 19 0.07 69
May 20 0.00 70
May 21 0.00 57
May 22 0.00 64
May 23 0.00 68
May 24 0.00 65
May 25 0.00 62
May 26 0.00 64
May 27 0.00 64
May 28 0.00 61
May 29 0.00 60
May 30 0.17 63
May 31 0.00 65
3.1

University of Illinois Extension • College of Agricultural, Consumer and Environmental Sciences • Department of Crop Sciences 48
2005 Annual summary of field crop insect management trials, Department of Crop Sciences, University of Illinoison Targeton Target
2005 Daily Weather Data for Monmouth, Illinois (Midwest Climate Center)
Date Precipitation Mean (inches) Temperature (°F)
June 1 0.00 69
June 2 0.00 71
June 3 0.00 71
June 4 0.00 73
June 5 0.63 75
June 6 0.00 73
June 7 0.00 78
June 8 0.00 79
June 9 0.77 75
June 10 0.00 76
June 11 0.10 76
June 12 0.00 76
June 13 0.53 79
June 14 0.00 73
June 15 0.02 69
June 16 0.00 65
June 17 0.00 66
June 18 0.00 65
June 19 0.00 67
June 20 0.00 69
June 21 0.00 71
June 22 0.00 78
June 23 0.02 79
June 24 0.00 80
June 25 0.00 81
June 26 0.00 81
June 27 0.00 81
June 28 0.09 79
June 29 0.00 78
June 30 0.09 82
2.15
2005 Daily Weather Data for Monmouth, Illinois (Midwest Climate Center)
Date Precipitation Mean (inches) Temperature (°F)
July 1 0.00 72
July 2 0.00 M
July 3 0.00 M
July 4 0.18 M
July 5 0.02 77
July 6 0.00 69
July 7 0.00 69
July 8 0.00 72
July 9 0.00 74
July 10 0.00 M
July 11 0.00 75
July 12 0.01 78
July 13 0.11 72
July 14 0.00 76
July 15 0.00 78
July 16 0.00 76
July 17 0.00 83
July 18 0.00 83
July 19 0.07 74
July 20 0.00 80
July 21 0.03 82
July 22 0.00 81
July 23 0.00 83
July 24 0.00 83
July 25 0.00 87
July 26 0.53 85
July 27 0.73 72
July 28 0.00 65
July 29 0.00 68
July 30 0.00 74
July 31 0.00 78
1.57

University of Illinois Extension • College of Agricultural, Consumer and Environmental Sciences • Department of Crop Sciences 49
2005 Annual summary of field crop insect management trials, Department of Crop Sciences, University of Illinoison Targeton Target
2005 Daily Weather Data for Monmouth, Illinois (Midwest Climate Center)
Date Precipitation Mean (inches) Temperature (°F)
August 1 0.00 73
August 2 0.00 78
August 3 0.00 81
August 4 0.00 85
August 5 0.02 77
August 6 0.00 68
August 7 0.00 72
August 8 0.00 68
August 9 0.00 80
August 10 0.24 82
August 11 0.45 81
August 12 0.07 79
August 13 0.68 76
August 14 0.12 68
August 15 0.01 65
August 16 0.00 68
August 17 0.00 72
August 18 0.00 77
August 19 0.77 79
August 20 0.46 80
August 21 0.00 77
August 22 0.00 72
August 23 0.00 64
August 24 0.00 64
August 25 0.38 71
August 26 0.43 68
August 27 0.00 75
August 28 0.00 73
August 29 0.00 72
August 30 0.00 72
August 31 0.00 69
3.63
2005 Daily Weather Data for Monmouth, Illinois (Midwest Climate Center)
Date Precipitation Mean (inches) Temperature (°F)
September 1 0.00 72
September 2 0.00 69
September 3 0 .00 71
September 4 0.00 74
September 5 0.00 76
September 6 0.00 75
September 7 0.00 75
September 8 0.00 75
September 9 0.58 76
September 10 0.00 78
September 11 0.00 81
September 12 0.00 76
September 13 0.00 80
September 14 0.95 74
September 15 0.06 65
September 16 0.42 65
September 17 0.00 61
September 18 0.00 67
September 19 1.60 75
September 20 0.26 69
September 21 0.00 72
September 22 0.00 76
September 23 0.00 75
September 24 1.20 64
September 25 0.05 75
September 26 0.05 70
September 27 0.00 56
September 28 0.63 66
September 29 0.57 52
September 30 0.00 52
6.37

University of Illinois Extension • College of Agricultural, Consumer and Environmental Sciences • Department of Crop Sciences 50
2005 Annual summary of field crop insect management trials, Department of Crop Sciences, University of Illinoison Targeton Target
2005 Daily Weather Data for Monmouth, Illinois (Midwest Climate Center)
Date Precipitation Mean (inches) Temperature (°F)
October 1 0.00 65
October 2 0.13 70
October 3 0.26 71
October 4 0.05 77
October 5 0.00 76
October 6 0.65 63
October 7 0.00 46
October 8 0.00 49
October 9 0.00 51
October 10 0.00 56
October 11 0.00 56
October 12 0.00 62
October 13 0.04 63
October 14 0.00 57
October 15 0.00 61
October 16 0.00 53
October 17 0.00 63
October 18 0.00 59
October 19 0.00 63
October 20 0.38 55
October 21 0.14 53
October 22 0.00 52
October 23 0.00 44
October 24 0.05 40
October 25 0.00 46
October 26 0.00 44
October 27 0.00 44
October 28 0.00 44
October 29 0.00 50
October 30 0.00 53
October 31 0.07 53
1.77

University of Illinois Extension • College of Agricultural, Consumer and Environmental Sciences • Department of Crop Sciences 51
2005 Annual summary of field crop insect management trials, Department of Crop Sciences, University of Illinoison Targeton Target
2005 Daily Weather Data for Morrison, Illinois (Midwest Climate Center)
Date Precipitation Mean (inches) Temperature (°F)
April 1 0.00 49
April 2 0.00 47
April 3 0.00 49
April 4 0.00 53
April 5 0.00 58
April 6 0.00 65
April 7 0.10 62
April 8 0.00 51
April 9 0.00 55
April 10 0.00 58
April 11 0.00 70
April 12 0.45 60
April 13 0.07 46
April 14 0.00 50
April 15 0.00 52
April 16 0.00 55
April 17 0.00 57
April 18 0.00 63
April 19 0.00 67
April 20 0.00 68
April 21 0.00 60
April 22 0.06 56
April 23 0.00 44
April 24 0.00 43
April 25 0.00 41
April 26 0.04 54
April 27 0.30 46
April 28 0.00 47
April 29 0.00 51
April 30 0.00 48
1.02
2005 Daily Weather Data for Morrison, Illinois (Midwest Climate Center)
Date Precipitation Mean (inches) Temperature (°F)
May 1 0.00 44
May 2 0.00 44
May 3 0.00 37
May 4 0.00 42
May 5 0.00 49
May 6 T 58
May 7 0.00 65
May 8 0.70 69
May 9 0.00 71
May 10 1.10 66
May 11 0.11 71
May 12 0.40 55
May 13 0.00 50
May 14 0.00 57
May 15 0.00 53
May 16 0.00 45
May 17 0.00 51
May 18 0.39 64
May 19 0.12 67
May 20 0.00 69
May 21 0.00 59
May 22 0.00 60
May 23 0.00 65
May 24 0.00 63
May 25 0.00 61
May 26 0.00 64
May 27 0.00 63
May 28 0.00 61
May 29 0.00 56
May 30 0.00 64
May 31 0.00 62
2.82
M=MissingT=Trace

University of Illinois Extension • College of Agricultural, Consumer and Environmental Sciences • Department of Crop Sciences 52
2005 Annual summary of field crop insect management trials, Department of Crop Sciences, University of Illinoison Targeton Target
2005 Daily Weather Data for Morrison, Illinois (Midwest Climate Center)
Date Precipitation Mean (inches) Temperature (°F)
June 1 0.00 69
June 2 0.00 71
June 3 0.46 70
June 4 0.00 75
June 5 0.00 75
June 6 0.00 76
June 7 0.00 77
June 8 0.22 77
June 9 0.00 76
June 10 0.00 78
June 11 0.50 77
June 12 0.00 77
June 13 0.00 76
June 14 0.00 71
June 15 0.00 70
June 16 0.00 66
June 17 0.00 65
June 18 0.00 65
June 19 0.00 67
June 20 0.00 71
June 21 0.00 76
June 22 0.00 77
June 23 0.19 81
June 24 0.00 82
June 25 0.00 82
June 26 0.00 82
June 27 0.00 80
June 28 0.00 77
June 29 0.51 80
June 30 0.00 78
1.88
2005 Daily Weather Data for Morrison, Illinois (Midwest Climate Center)
Date Precipitation Mean (inches) Temperature (°F)
July 1 0.00 66
July 2 0.00 64
July 3 0.03 69
July 4 0.08 72
July 5 0.00 71
July 6 0.00 68
July 7 0.00 74
July 8 0.00 72
July 9 0.00 76
July 10 0.00 76
July 11 0.00 75
July 12 0.00 74
July 13 0.00 78
July 14 0.00 80
July 15 0.00 79
July 16 0.00 81
July 17 0.00 83
July 18 0.00 80
July 19 0.00 75
July 20 0.03 79
July 21 0.02 83
July 22 0.00 78
July 23 0.22 77
July 24 0.00 87
July 25 0.00 85
July 26 0.55 75
July 27 0.00 67
July 28 0.00 70
July 29 0.00 72
July 30 0.00 75
July 31 0.00 79
0.93

University of Illinois Extension • College of Agricultural, Consumer and Environmental Sciences • Department of Crop Sciences 53
2005 Annual summary of field crop insect management trials, Department of Crop Sciences, University of Illinoison Targeton Target
2005 Daily Weather Data for Morrison, Illinois (Midwest Climate Center)
Date Precipitation Mean (inches) Temperature (°F)
August 1 0.00 77
August 2 0.00 78
August 3 0.00 84
August 4 0.00 83
August 5 0.00 74
August 6 0.00 72
August 7 0.00 75
August 8 0.00 77
August 9 0.00 81
August 10 0.00 82
August 11 0.68 76
August 12 1.42 75
August 13 0.00 71
August 14 0.00 69
August 15 0.00 70
August 16 0.00 71
August 17 0.00 72
August 18 0.00 74
August 19 0.00 77
August 20 0.00 76
August 21 0.00 71
August 22 0.00 66
August 23 0.00 67
August 24 0.00 65
August 25 0.00 67
August 26 0.00 68
August 27 0.00 76
August 28 0.00 70
August 29 0.00 71
August 30 0.00 70
August 31 0.00 70
2.1
2005 Daily Weather Data for Morrison, Illinois (Midwest Climate Center)
Date Precipitation Mean (inches) Temperature (°F)
September 1 0.00 71
September 2 0.00 69
September 3 0.00 68
September 4 0.00 61
September 5 0.00 74
September 6 0.00 73
September 7 0.00 77
September 8 0.00 72
September 9 0.00 75
September 10 0.00 79
September 11 0.00 77
September 12 0.00 76
September 13 1.30 77
September 14 0.00 68
September 15 0.00 59
September 16 0.00 65
September 17 0.00 64
September 18 0.50 69
September 19 0.00 75
September 20 0.00 70
September 21 0.00 71
September 22 0.00 70
September 23 0.00 64
September 24 1.10 66
September 25 0.27 71
September 26 0.00 66
September 27 0.00 62
September 28 0.00 58
September 29 0.00 52
September 30 0.00 55
3.17

University of Illinois Extension • College of Agricultural, Consumer and Environmental Sciences • Department of Crop Sciences 54
2005 Annual summary of field crop insect management trials, Department of Crop Sciences, University of Illinoison Targeton Target
2005 Daily Weather Data for Morrison, Illinois (Midwest Climate Center)
Date Precipitation Mean (inches) Temperature (°F)
October 1 0.00 60
October 2 0.43 63
October 3 0.00 75
October 4 0.00 77
October 5 0.00 76
October 6 0.00 M
October 7 0.00 47
October 8 0.00 53
October 9 0.00 53
October 10 0.00 54
October 11 0.00 55
October 12 0.00 62
October 13 0.00 60
October 14 0.00 61
October 15 0.00 57
October 16 0.05 53
October 17 0.00 56
October 18 0.00 59
October 19 0.00 52
October 20 0.00 51
October 21 0.00 53
October 22 0.00 50
October 23 0.00 51
October 24 0.00 44
October 25 0.00 47
October 26 0.00 44
October 27 0.00 42
October 28 0.00 43
October 29 0.00 46
October 30 0.00 51
October 31 0.00 49
.48
M=MissingT=Trace

University of Illinois Extension • College of Agricultural, Consumer and Environmental Sciences • Department of Crop Sciences 55
2005 Annual summary of field crop insect management trials, Department of Crop Sciences, University of Illinoison Targeton Target
2005 Daily Weather Data for Urbana, Illinois (Midwest Climate Center)
Date Precipitation Mean (inches) Temperature (°F)
April 1 0.00 47
April 2 0.20 48
April 3 0.00 51
April 4 0.00 61
April 5 0.00 60
April 6 0.00 63
April 7 T 50
April 8 0.00 56
April 9 0.00 59
April 10 0.00 68
April 11 0.00 69
April 12 0.92 53
April 13 0.23 51
April 14 0.00 52
April 15 0.00 56
April 16 0.00 59
April 17 0.00 64
April 18 0.00 66
April 19 0.00 65
April 20 0.00 64
April 21 1.98 54
April 22 0.28 55
April 23 0.08 39
April 24 T 44
April 25 0.00 50
April 26 0.23 50
April 27 T 47
April 28 0.00 50
April 29 T 50
April 30 0.06 49
3.98
M=MissingT=Trace
2005 Daily Weather Data for Urbana, Illinois (Midwest Climate Center)
Date Precipitation Mean (inches) Temperature (°F)
May 1 T 45
May 2 0.00 41
May 3 0.00 45
May 4 0.00 48
May 5 0.00 55
May 6 0.00 60
May 7 0.00 69
May 8 0.00 68
May 9 T 68
May 10 T 73
May 11 0.00 68
May 12 0.07 62
May 13 T 70
May 14 0.03 60
May 15 0.01 52
May 16 0.00 54
May 17 0.00 60
May 18 0.00 65
May 19 0.75 71
May 20 0.11 61
May 21 0.00 62
May 22 0.00 70
May 23 0.00 68
May 24 0.00 62
May 25 0.00 62
May 26 0.00 64
May 27 T 65
May 28 0.00 62
May 29 0.00 63
May 30 T 67
May 31 0.00 67
.97
M=MissingT=Trace

University of Illinois Extension • College of Agricultural, Consumer and Environmental Sciences • Department of Crop Sciences 56
2005 Annual summary of field crop insect management trials, Department of Crop Sciences, University of Illinoison Targeton Target
2005 Daily Weather Data for Urbana, Illinois (Midwest Climate Center)
Date Precipitation Mean (inches) Temperature (°F)
June 1 0.00 70
June 2 T 65
June 3 0.07 68
June 4 0.00 75
June 5 0.00 82
June 6 0.00 78
June 7 0.00 80
June 8 0.00 79
June 9 0.02 78
June 10 0.00 81
June 11 0.19 75
June 12 0.04 73
June 13 T 77
June 14 1.62 71
June 15 0.00 69
June 16 T 67
June 17 0.00 66
June 18 0.00 65
June 19 0.00 67
June 20 0.00 71
June 21 0.00 73
June 22 0.00 78
June 23 0.00 77
June 24 0.00 82
June 25 0.00 82
June 26 T 82
June 27 0.00 83
June 28 T 81
June 29 0.48 82
June 30 T 82
2.42
M=MissingT=Trace
2005 Daily Weather Data for Urbana, Illinois (Midwest Climate Center)
Date Precipitation Mean (inches) Temperature (°F)
July 1 0.00 72
July 2 0.00 67
July 3 0.00 73
July 4 0.00 77
July 5 0.21 75
July 6 0.00 74
July 7 T 76
July 8 T 76
July 9 0.00 77
July 10 0.00 76
July 11 0.00 76
July 12 0.71 74
July 13 0.38 75
July 14 0.36 79
July 15 0.10 78
July 16 T 80
July 17 0.00 81
July 18 0.40 80
July 19 0.26 76
July 20 0.00 81
July 21 0.24 81
July 22 1.07 77
July 23 0.00 79
July 24 0.00 84
July 25 0.00 85
July 26 0.00 80
July 27 0.57 69
July 28 0.00 67
July 29 0.00 70
July 30 0.00 75
July 31 0.00 75
4.3
M=MissingT=Trace

University of Illinois Extension • College of Agricultural, Consumer and Environmental Sciences • Department of Crop Sciences 57
2005 Annual summary of field crop insect management trials, Department of Crop Sciences, University of Illinoison Targeton Target
2005 Daily Weather Data for Urbana, Illinois (Midwest Climate Center)
Date Precipitation Mean (inches) Temperature (°F)
August 1 0.00 78
August 2 0.00 80
August 3 0.00 81
August 4 0.02 81
August 5 0.05 75
August 6 0.00 76
August 7 0.00 77
August 8 T 79
August 9 0.00 79
August 10 0.00 81
August 11 0.00 84
August 12 0.02 83
August 13 0.09 78
August 14 0.06 68
August 15 0.41 70
August 16 0.07 75
August 17 0.00 74
August 18 0.00 79
August 19 1.02 80
August 20 .49 79
August 21 0.00 76
August 22 T 71
August 23 0.00 68
August 24 0.00 69
August 25 0.00 72
August 26 0.03 75
August 27 T 74
August 28 0.00 75
August 29 0.00 76
August 30 0.00 72
August 31 0.00 71
2.26
M=MissingT=Trace
2005 Daily Weather Data for Urbana, Illinois (Midwest Climate Center)
Date Precipitation Mean (inches) Temperature (°F)
September 1 0.00 73
September 2 0.00 74
September 3 0.00 72
September 4 0.00 73
September 5 0.00 73
September 6 0.00 74
September 7 0.00 76
September 8 0.00 78
September 9 0.00 80
September 10 0.00 79
Septermber11 0.00 79
September 12 0.00 77
September 13 0.00 79
September14 0.33 72
September 15 T 62
September 16 1.67 60
September 17 T 66
September 18 0.00 69
September 19 0.21 78
September 20 0.48 73
September 21 0.00 71
September 22 0.00 79
September 23 0.00 66
September 24 0.86 74
September 25 T 70
September 26 1.57 68
September 27 0.00 68
September 28 0.00 65
September 29 0.54 55
September 30 0.00 56
5.66
M=MissingT=Trace

University of Illinois Extension • College of Agricultural, Consumer and Environmental Sciences • Department of Crop Sciences 58
2005 Annual summary of field crop insect management trials, Department of Crop Sciences, University of Illinoison Targeton Target
2005 Daily Weather Data for Urbana, Illinois (Midwest Climate Center)
Date Precipitation Mean (inches) Temperature (°F)
October 1 0.00 65
October 2 0.00 70
October 3 0.02 76
October 4 0.00 77
October 5 0.00 75
October 6 0.00 55
October 7 0.00 50
October 8 0.00 50
October 9 0.00 54
October 10 0.00 56
October 11 0.00 58
October 12 0.00 61
October 13 0.00 61
October 14 0.00 63
October 15 0.00 59
October 16 0.00 56
October 17 0.00 62
October 18 0.00 60
October 19 0.00 60
October 20 0.12 49
October 21 1.05 49
October 22 0.03 51
October 23 0.00 43
October 24 0.01 45
October 25 0.03 45
October 26 T 47
October 27 0.00 45
October 28 0.00 45
October 29 0.00 47
October 30 0.00 48
October 31 0.02 54
1.28
M=MissingT=Trace