Embed Size (px)
Citation preview

ON SCREENOCTOBER 2015 REPORT
Prepared by Rina Fraticelli for Women in View
October 21, 2015
2 WOMEN IN VIEW ON SCREEN - OCTOBER 2015 REPORT
METHODOLOGYWomen in View on Screen is intended as a significant snapshot of the presence of women in several key creative positions in Canadian film and television in three specific categories of production: feature-length films, live action series television, and this year for the first time, though in a limited way, web series.
This report is, therefore, far from exhaustive. Media creation encompasses multiple forms, genres, lengths; spans numerous and cut an ever-growing numbers of platforms, distribution and exhibition models. Budget levels can vary from a few thousand to several million dollars; and financing structures can range from individual crowd-funding campaigns to co-productions with multiple international investors, private and public funders, and equity stakeholders.
Media production is an intensely collaborative enterprise employing the talents of a great many individuals across a wide range of professions. Focussing on the positions of director, screenwriter and cinematographer allows us a glimpse of women’s presence in just three of these influential, content-determining positions. The introduction this year of the employment category of actors allows us to reflect upon the relationships between the gender of directors and screenwriters and those in primary onscreen roles.
We launched Women in View on Screen in 2012-13 using as our primary sources the online databases of Telefilm Canada (for film) and the Canada Media Fund (for television). While these are only two of many sources of funding and investment for Canadian media, most Canadian feature length films and television series receive some part of their financing from one of these two agencies. The fact that these are publicly-funded agencies; and that they provide comprehensive, reliable and detailed online reports of their annual investments made this a logical frame for the core of the research. In addition to online data for production funding of feature length films, we were able to draw from internal Telefilm data on development funding for feature films.
Women in View on Screen 2015 includes for the first time the addition of data provided by the Ontario Media Development Corporation, allowing us to begin an exploration of regional distinctions.
Each of these agencies provide funding and/or investment via several streams, supporting films at production and development stages; on different platforms and formats. This report offers only a glimpse of the specific streams identified in each section.
Women in View on Screen is a purely statistical study.
Our team of researchers compiles funded projects from these primary databases, then draws upon multiple sources to identify individual directors, writers and cinematographers for each project. These sources include IMDB, production websites; corporate websites; media databases, onscreen film credits etc. In addition to these sources, we routinely contact agents, guilds, unions and production companies to confirm and cross-check. With every year of this report, Women in View’s own databases and networks grow, expanding the field of investigation and identification and deepening our own pool of information.
The data are assessed on a simple numerical formula of percentages. No qualitative data is included.

WOMEN IN VIEW ON SCREEN - OCTOBER 2015 REPORT 3
For information about actors in leading roles and the top four roles, we are indebted to ACTRA National and Québec’s Union des Artistes for their support in generating an important new element in this year’s report. Working with a simple rubric of number of days employed, these two guilds were able to provide a glimpse of the distribution of the top four leading roles for 79 of the 81 live action films reported on.
For information about web series, Ms. Emilia Zboralska, PhD Candidate, Communication and Culture, Ryerson University, generously shared a small part of her ongoing research into online cultural production in Canada. This gives us a glimpse of where women are in terms of the emerging field of web series. Ms. Zboralska notes that the information included in this analysis was compiled from initial data submitted to IPF regarding key talent, and then cross-referenced through IMDB, running credits and any information made available about key talent on the series’ official websites.
Reporting on the representation of racialized minorities and First Nations in these Women in View reports has been an important part of our previous reports. For this year, however, we have suspended gathering this data until we can find better ways of identifying ethnic and cultural affinities.
ACKNOWLEDGMENTSWomen In View gratefully acknowledges and thanks the following funders for their support of the research and writing of this report: the Ontario Media Development Corporation (OMDC), Telefilm Canada, the Canada Media Fund (CMF), ACTRA National, and the Canadian Media Producers Association (CMPA)-BC Producers Branch.
Any opinions, findings, conclusions or recommendations expressed in this material are those of the author and do not necessarily reflect the views of the funders. The funders, the Government of Ontario, the Government of Canada and their agencies are in no way bound by the recommendations contained in this document.
4 WOMEN IN VIEW ON SCREEN - OCTOBER 2015 REPORT
WOMEN IN VIEW ON SCREEN 2015This is the fourth consecutive Women in View on Screen report on women in Canadian media. This year’s edition represents an important departure from previous reports. In the past, we have tracked only directors, screenwriters and cinematographers in publicly-funded feature-length films and live action television series. This year, we build on that substantial foundation by including significant additional categories: actors, web series, feature film development funding, and regional analyses.
This expanded report has been made possible by the participation, for the first time, of several key industry partners: Telefilm Canada, the Ontario Media Development Corporation, the Canada Media Fund, the Canadian Media Producers Association and ACTRA National. They have provided funding in some cases, as well as access to data that until now have been unavailable to us. These important partnerships not only support expanding the scope of Women in View on Screen into significant new areas, but also signal to the community the importance these industry leaders place on the issue of gender equity.
A GROUNDSWELL OF AWARENESSIn the four years since the launch of the first Women in View on Screen report in 2012, awareness and concern about gender inequity in our screen industries have grown considerably. Yet, as this year’s report illustrates, women continue to be vastly under-represented as directors, screenwriters and cinematographers in Canadian feature film and television.
Canada is by no means unique in this matter. For example, a recent feature article in the New York Times, prompted by a major US report1,cites the growing empirical support for “what has become a steady stream of righteous complaint” and refers to calls for “investigations into hiring practices at major Hollywood studios, networks and talent agencies.”2 Nor is this issue restricted to North America: in Great Britain and the European Union, researchers have been gathering, analyzing and disseminating data illustrating the limited roles of women in media industries and calling on their governments and the private sector to take remedial action.
In documenting the presence – and absence – of women in Canadian media, Women in View on Screen is intended as a catalyst for a national dialogue. With these reports we aim to provide a clear, consistent, year-over-year record of where and how investment is allocated, and where and how our media culture is - and is not - reflective of the capacity and vision of Canadian women as well as men. It is critical, however, that this information not be considered as an end in itself, but rather as a tool in the design of practical, measurable and sustainable strategies that ensure our media culture draws from the full extent of our talent pool.

WOMEN IN VIEW ON SCREEN - OCTOBER 2015 REPORT 5
2015 HIGHLIGHTSWomen in View on Screen 2015 examined the representation of women in the roles of director, screenwriter and cinematographer in Canadian film and television projects receiving funding from Telefilm Canada, the Ontario Media Development Corporation, and the Canada Media Fund. We also looked at a small sample of web series funded by the Independent Production Fund; and in partnership with ACTRA National and the Union des Artistes, we explored possible links between women behind the scenes as directors and screenwriters and roles on screen.
1. FILM
In the 2013-14 fiscal year, Telefilm Canada invested a total of $63,323,534 in 91 feature length films. ■ Women represented 17% of directors (17 of 103); 22% of writers (29 of 133) and 12% of
cinematographers (11 of 91) credited.
■ In overall employment, women held 57 (17%) of the 327 director, writer and cinematographer positions.
■ Women directors were far better represented in the under $1M category of investment at 21% (16 of 77); than over $1M at 4% (1 of 25).
■ There were no women directors among the six feature-length animation directors.
2. TELEVISION
The Canada Media Fund invested $97,637,939 in 29 live-action English language drama TV series in 2012-13.
■ Women numbered 14 of 84 (17%) directors, an increase from 14% in 2012-2013; however, these women directed only 11% of the episodes.
■ 17 of the 29 series - representing a public investment of $39,329,607- employed not a single woman director on any of their 151 episodes.
■ In TV as in feature films, women were significantly better represented among the writers than directors at 38% (47 of 125), although they had only 34% (117 of 340) of the writing credits.
■ Again this year, not a single one of the 293 episodes employed a female cinematographer. This pattern has been consistent over the three years we have reported.
3.WEB SERIES
In 36 series comprising 623 individual episodes funded by The Independent Production Fund between 2010 and 2014:
■ 14% of the director positions went to women (6 of 43).
■ 27% of writer positions were held by women (26 of 98).
■ 2% of the cinematography positions went to a woman (1 of 42)
■ 50% (18 of the 36) series employed no women in any of these three capacities.
4. ACTORS
In 76 live-action feature-length films: ■ When women were directing, 55% of the top four roles went to women; as compared to 41%
when men were directing.
■ When women were writing, 58% of the top four roles went to women; as compared to 40% when men were writing.

6 WOMEN IN VIEW ON SCREEN - OCTOBER 2015 REPORT
CHART 1: Production Funding
103 Total Director Credits
133 Total Writer Credits
91 Total Cinematographer Credits
0
20
40
60
80
100 Men 83% (86)
Women17% (17)
Men 78% (104)
Women22% (29)
Men 89% (80)
Women12% (11)
CHART 1A: Screenwriters at Development
Women 24% (74)
Men 76% (231)
305 Total
CHART 2: Overall Film Employment (includes director, writer and cinematographer credits)
Women 17% (57)
327 Total
Men 83% (270)
CHART 1: Production Funding ■ Of 103 director credits, 17 (17%) went to
women and 86 (83%) to men.
■ Of the 133 writer credits, 29 (22%) went to women, and 104 (78%) to men.
■ Of the 91 cinematographer credits, 11 (12%) went to women and 80 (89%) to men.
CHART 1A: Screenwriters at Development vs. Production StagesWomen screenwriters are slightly better represented in the 305 films receiving investment funding from Telefilm Canada at the development stage.
■ 24% (74 of 305) of the writers attached to these films were women.
CHART 2: Overall Employment
■ In overall employment, 327 director, writer and cinematographer credits, 57 (17%) went to women and 270 (83%) went to men.
1: FEATURE FILM FUNDINGWe examined 91 feature-length films receiving production investment from Telefilm Canada in 2013-14. These films comprise 81 live action, 7 documentaries and 3 animated features for a total investment of $63,323,534.4

WOMEN IN VIEW ON SCREEN - OCTOBER 2015 REPORT 7
CHART 3D: Women Cinematography Credits by Region
0
10
20
30
40Québec: 16% (5 of 32)
Ontario: 7% (2 of 30)
West: 13% (3 of 23)
Atlantic: 17% (1 of 6)
CHART 3: Breakdown by Region In terms of regional spread in feature films funded by Telefilm Canada, Québec-based productions accounted for 36 features and $35,842,285 in funding; Ontario: 30 features for $21,609.249; Western Canada:19 features for $4,042,000; and the Atlantic Region: 6 features for $1,830,000.
The regions differed enormously in terms of the number of films supported and investment amounts, making it difficult to draw clear conclusions. Nonetheless it is worth noting the significant differences in terms of the representation of women in each category across the regions.
Atlantic Canada, with the fewest films funded and the lowest average investment per film, led in terms of employment of women in all three categories of employment. The Québec region, with the largest number of features, 57% of the total national investment and the highest per film investment, had the next highest representation of women employed.
1: FEATURE FILM FUNDING
CHART 3A: Feature Film Funding by Region
TOTAL FUNDING:$63,323,53491 Feature Films
Québec$35,842,285
Western Canada$4,042,000
Atlantic Canada$1,830,000
Ontario$21,609,249
(36 Feature Films)
(30 Feature Films)
(19 Feature Films)
(6 Feature Films)
CHART 3B: Women Directing Credits by Region
0
10
20
30
40Québec: 19% (8 of 43)
Ontario: 12% (4 of 33)
West: 14% (3 of 21)
Atlantic: 33% (2 of 6)
CHART 3C: Women Screenwriting Credits by Region
0
10
20
30
40Québec: 26% (14 of 54)
Ontario: 15% (6 of 39)
West: 18% (5 of 28)
Atlantic: 33% (4 of 12)

8 WOMEN IN VIEW ON SCREEN - OCTOBER 2015 REPORT
CHART 4A : Provincial Investment - Directors
0
10
20
30
40Ontario: 22% (6 of 27)
National: 17% (17 of 102)
• OF 27 DIRECTORS EMPLOYED 6 (22%) WERE WOMEN; COMPARED WITH 17% NATIONALLY• OF 33 SCREENWRITERS, 10 (30%) WERE WOMEN; COMPARED WITH 22% NATIONALLY• OF 25 CINEMATOGRAPHERS, 1 (4%) WAS A WOMAN; COMPARED WITH 11% NATIONALLY
CHART 4B : Provincial Investment - Screenwriters
0
10
20
30
40Ontario: 30% (10 of 33)
National: 22% (28 of 131)
• OF 27 DIRECTORS EMPLOYED 6 (22%) WERE WOMEN; COMPARED WITH 17% NATIONALLY• OF 33 SCREENWRITERS, 10 (30%) WERE WOMEN; COMPARED WITH 22% NATIONALLY• OF 25 CINEMATOGRAPHERS, 1 (4%) WAS A WOMAN; COMPARED WITH 11% NATIONALLY
CHART 4C : Provincial Investment - Cinematographers
0
10
20
30
40Ontario: 4% (1 of 25)
National: 11% (11 of 93)
• OF 27 DIRECTORS EMPLOYED 6 (22%) WERE WOMEN; COMPARED WITH 17% NATIONALLY• OF 33 SCREENWRITERS, 10 (30%) WERE WOMEN; COMPARED WITH 22% NATIONALLY• OF 25 CINEMATOGRAPHERS, 1 (4%) WAS A WOMAN; COMPARED WITH 11% NATIONALLY
CHART 4: Provincial InvestmentPulling back from the national picture, we were able to look at 27 feature length films funded by the Ontario Media Development Corporation and Telefilm Canada;5 we found that in this grouping
■ Of 27 directors employed 6 (22%) were women; compared with 17% nationally
■ Of 33 screenwriters,10 (30%) were women; compared with 22% nationally
■ Of 25 cinematographers, 1 (4%) was a woman; compared with 11% nationally
1: FEATURE FILM FUNDING
WOMEN IN VIEW ON SCREEN - OCTOBER 2015 REPORT 9
CHART 5A : Women's Credits in Live Action Feature Films
90 Total Directing Credits
119 Total Writing Credits
84 Total Cinematography Credits
0
10
20
30
40
50
Directors17% (15)
Writers21% (25)
Cinematographers13% (11)
CHART 5B : Women's Credits in Documentaries
7 Total Directing Credits
8 Total Writing Credits
7 Total Cinematography Credits
0
10
20
30
40
50
Directors29% (2)
Writers38% (3)
Cinematographer0% (0)
CHART 5C : Women's Credits in Animation
6 Total Directing Credits
6 Total Writer Credits
0
10
20
30
40
50
Directors0% (0)
Writers17% (1)
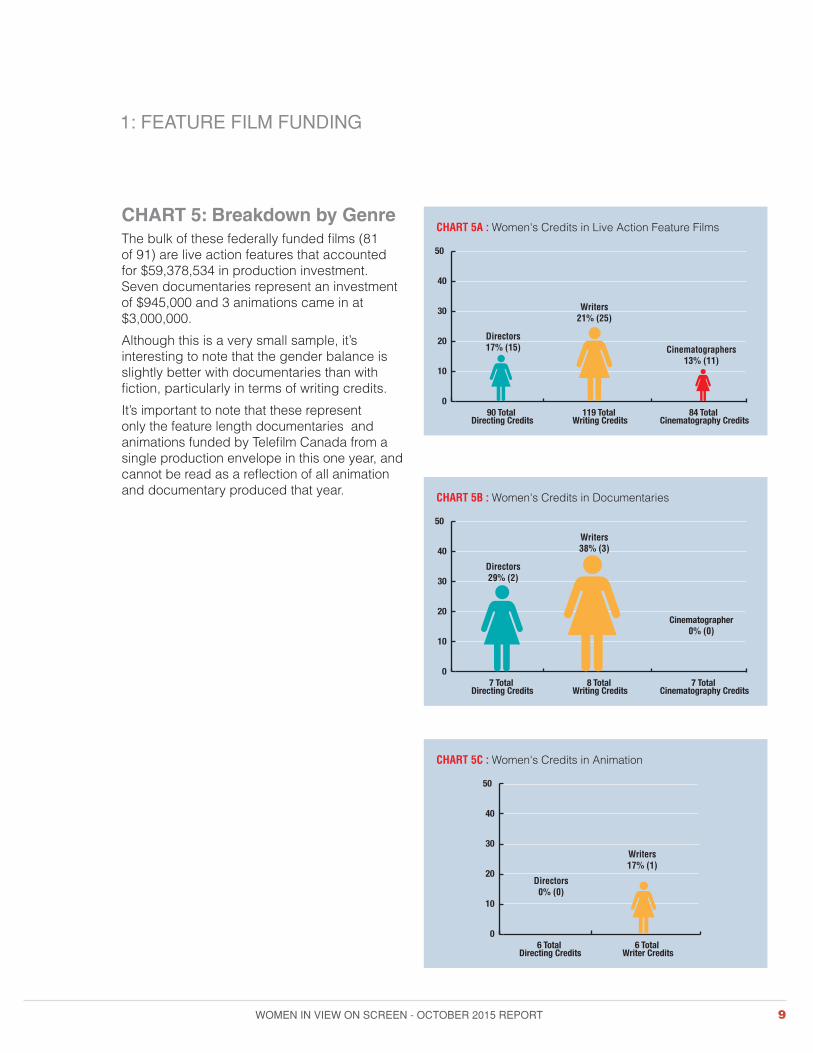
CHART 5: Breakdown by GenreThe bulk of these federally funded films (81 of 91) are live action features that accounted for $59,378,534 in production investment. Seven documentaries represent an investment of $945,000 and 3 animations came in at $3,000,000.
Although this is a very small sample, it’s interesting to note that the gender balance is slightly better with documentaries than with fiction, particularly in terms of writing credits.
It’s important to note that these represent only the feature length documentaries and animations funded by Telefilm Canada from a single production envelope in this one year, and cannot be read as a reflection of all animation and documentary produced that year.
1: FEATURE FILM FUNDING

10 WOMEN IN VIEW ON SCREEN - OCTOBER 2015 REPORT
CHART 6A: Under $1M in Investment
77 Total Director Jobs
0
20
40
60
80
100Men
79% (61)
Women21% (16)
101 Total Screenwriting Jobs
Men 78% (79)
Women22% (22)
CHART 6B: $1M + in Investment
26 Total Director Jobs
0
20
40
60
80
100Men
96% (25)
Women4% (1)
32 Total Screenwriting Jobs
Men 78% (25)
Women22% (7)
CHART 6: Breakdown by Level of InvestmentWhen we broke down the features according to levels of investment received, we found that the disparity between men and women directors was far more pronounced at the higher levels of investment. Women were more equitably represented in films whose level of investment - and by implication, overall budget size - was lower. This is a consistent pattern demonstrated in previous Women in View reports as well as numerous other studies in several jurisdictions: that is, women tend to be represented in indirect proportion to the level of budget.6
Under $1M in Investment Seventy features in this category accounted for a total investment of $21,287,316.
■ Of the 77 directing jobs, 21% (16) went to women; 79% (61) to men
■ Of the101 screenwriting jobs, 22% (22) went to women; and 78% (79) to men.
$1M+ in Investment Twenty-one films received investment of $1M or more for a total investment of $42,036,218.
■ Of the 26 directing jobs, 4% (1) went to a woman, while 96% (25) went to men.
■ Of 32 writing jobs on these 21 films, 22% (7) went to women; 78% (25) were held by men.
1: FEATURE FILM FUNDING

WOMEN IN VIEW ON SCREEN - OCTOBER 2015 REPORT 11
CHART 7: Impact of Director and Writer Gender on Actor RolesAn important extension of the work in this 2015 report concerns the relationship between the gender of the directors and writers, and roles for performers in the films they create. With the support of researchers at ACTRA National and the Union des Artistes, we examined the distribution of roles among the top four actors in 79 live action feature films (57 English; 22 French).7
We found that both men and women content-creators tended to favour characters who are like them. Since women screenwriters are significantly outnumbered by their male counterparts, however, this means that the overall preponderance of male leading roles significantly skews the on-screen demographic in terms of gender.
DIRECTOR - ACTOR
■ When men were directing, women held the leading role in 36% of the films.
■ When women were directing, women were in the leading role in 50% of the films.
■ When men were directing, 41% of the top four roles went to women.
■ When women were directing, 55% of the top four roles went to women
WRITER - ACTOR
■ In films written by men, women were in the leading role 37% of the time.
■ Women were in the leading role 54% of the time in films written by women
■ With men as screenwriters, women comprised 40% of the top four roles.
■ When women were writing, women held 58% of the top four roles.
■ When a male-female team was writing (5 films), women comprised 55% of the top four roles; and 40% of the leads
1: FEATURE FILM FUNDING
CHART 7A: Director - Actor Ratio
Male Director0
20
40
60
80
100
36%
Female Director
50%
LEADING ROLES
Male Director
41%
Female Director
55%
TOP 4 ROLES
CHART 7B: Writer - Actor Ratio
Male Writer0
20
40
60
80
100
37%
Female Writer
54%
LEADING ROLES
Male Writer
40%
Female Writer
58%
TOP 4 ROLES
CHART 7C: Team Writers - Actor Ratio
Leading Roles0
20
40
60
80
100
Women40%
MALE - FEMALE WRITING TEAMS
Women55%
Top 4 Roles
12 WOMEN IN VIEW ON SCREEN - OCTOBER 2015 REPORT
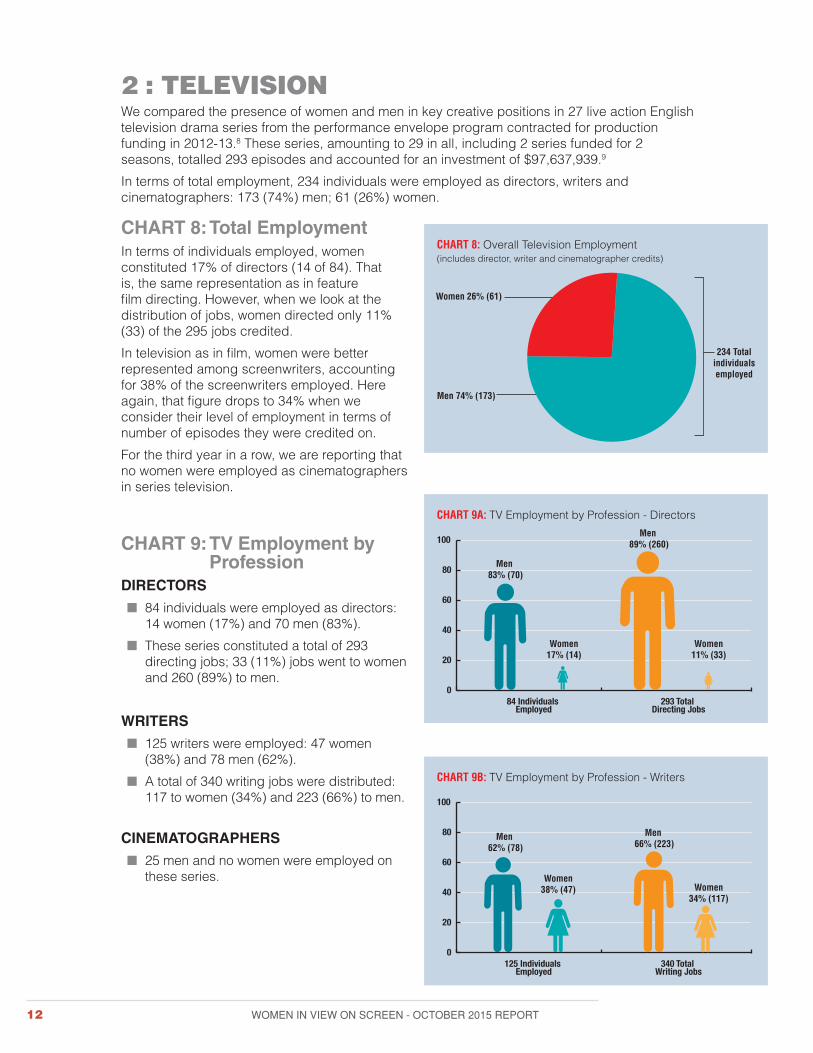
2 : TELEVISIONWe compared the presence of women and men in key creative positions in 27 live action English television drama series from the performance envelope program contracted for production funding in 2012-13.8 These series, amounting to 29 in all, including 2 series funded for 2 seasons, totalled 293 episodes and accounted for an investment of $97,637,939.9
In terms of total employment, 234 individuals were employed as directors, writers and cinematographers: 173 (74%) men; 61 (26%) women.
CHART 8: Total Employment In terms of individuals employed, women constituted 17% of directors (14 of 84). That is, the same representation as in feature film directing. However, when we look at the distribution of jobs, women directed only 11% (33) of the 295 jobs credited.
In television as in film, women were better represented among screenwriters, accounting for 38% of the screenwriters employed. Here again, that figure drops to 34% when we consider their level of employment in terms of number of episodes they were credited on.
For the third year in a row, we are reporting that no women were employed as cinematographers in series television.
CHART 9: TV Employment by Profession
DIRECTORS
■ 84 individuals were employed as directors: 14 women (17%) and 70 men (83%).
■ These series constituted a total of 293 directing jobs; 33 (11%) jobs went to women and 260 (89%) to men.
WRITERS
■ 125 writers were employed: 47 women (38%) and 78 men (62%).
■ A total of 340 writing jobs were distributed: 117 to women (34%) and 223 (66%) to men.
CINEMATOGRAPHERS
■ 25 men and no women were employed on these series.
CHART 8: Overall Television Employment (includes director, writer and cinematographer credits)
Women 26% (61)
234 Totalindividualsemployed
Men 74% (173)
CHART 9A: TV Employment by Profession - Directors
84 Individuals Employed
0
20
40
60
80
100
Men 83% (70)
Women17% (14)
293 Total Directing Jobs
Men 89% (260)
Women11% (33)
CHART 9B: TV Employment by Profession - Writers
125 Individuals Employed
0
20
40
60
80
100
Men 62% (78)
Women38% (47)
340 Total Writing Jobs
Men 66% (223)
Women34% (117)
WOMEN IN VIEW ON SCREEN - OCTOBER 2015 REPORT 13
2: TELEVISION
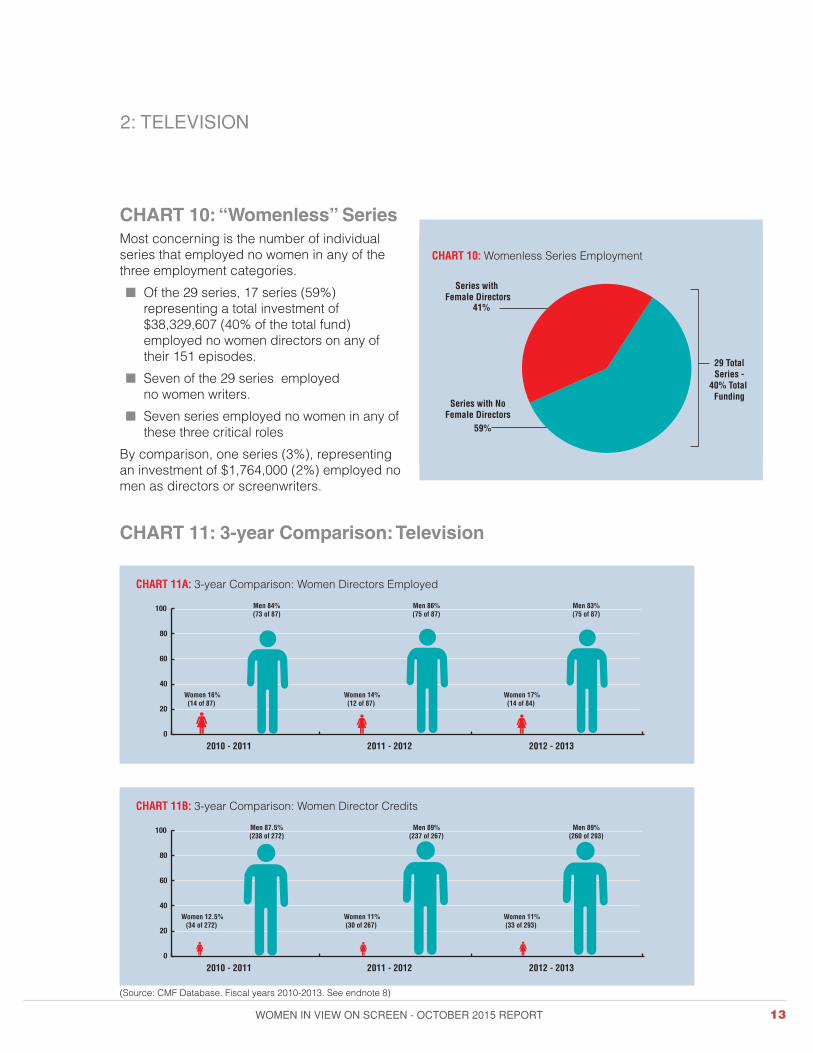
CHART 10: Womenless Series Employment
41%
29 TotalSeries -
40% Total Funding
59%
Series with NoFemale Directors
Series with Female Directors
CHART 10: “Womenless” SeriesMost concerning is the number of individual series that employed no women in any of the three employment categories.
■ Of the 29 series, 17 series (59%) representing a total investment of $38,329,607 (40% of the total fund) employed no women directors on any of their 151 episodes.
■ Seven of the 29 series employed no women writers.
■ Seven series employed no women in any of these three critical roles
By comparison, one series (3%), representing an investment of $1,764,000 (2%) employed no men as directors or screenwriters.
CHART 11A: 3-year Comparison: Women Directors Employed
2010 - 2011 2011 - 2012 2012 - 20130
20
40
60
80
100
Women 16% (14 of 87)
Men 84% (73 of 87)
Women 14% (12 of 87)
Men 86% (75 of 87)
Women 17% (14 of 84)
Men 83% (75 of 87)
CHART 11B: 3-year Comparison: Women Director Credits
2010 - 2011 2011 - 2012 2012 - 20130
20
40
60
80
100
Women 12.5% (34 of 272)
Men 87.5% (238 of 272)
Women 11% (30 of 267)
Men 89% (237 of 267)
Women 11% (33 of 293)
Men 89% (260 of 293)
CHART 11: 3-year Comparison: Television
(Source: CMF Database. Fiscal years 2010-2013. See endnote 8)

14 WOMEN IN VIEW ON SCREEN - OCTOBER 2015 REPORT
2: TELEVISION
CHART 11D: 3-year Comparison: Women Writer Credits
2010 - 2011 2011 - 2012 2012 - 20130
20
40
60
80
100
Women 30% (115 of 380)
Men 70% (265 of 380)
Women 30% (104 of 345)
Men 70% (241 of 345)
Women 34% (117 of 340)
Men 66% (223 of 340)
CHART 11C: 3-year Comparison: Women Writers Employed
2010 - 2011 2011 - 2012 2012 - 20130
20
40
60
80
100
Women 36% (48 of 133)
Men 64% (85 of 133)
Women 34% (49 of 144)
Men 66% (95 of 144)
Women 38% (47 of 125)
Men 62% (78 of 125)
CHART 11E: 3-year Comparison: Women Cinematographers
2010 - 2011 2011 - 2012 2012 - 20130
20
40
60
80
100
Women 0% (0 of 24)
Men 100% (24 of 24)
Women 0% (0 of 26)
Men 100% (26 of 26)
Women 0% (0 of 25)
Men 100% (25 of 25)
CHART 11: 3-year Comparison: Television
(Source: CMF Database. Fiscal years 2010-2013. See endnote 8)

WOMEN IN VIEW ON SCREEN - OCTOBER 2015 REPORT 15
3 : WEB SERIESOur media industries are in a period of significant and rapid transition as they adapt to the changing technological and financial climates. Traditional production and viewing habits are continuously making room for new forms of media creation and dissemination. While the volume of web series is still low, and the financing and revenue streams for them remain extremely limited and precarious, they nonetheless constitute an important new form for media creation and dissemination. The lower budgets and financial risk arguably allow for greater freedom with fewer stakeholders holding the purse strings. As one web series writer put it, web series allow media storytellers far more direct access to the audience than traditional or “legacy” media.
As part of her wider and ongoing research project “Telling Our Stories on the Web: Canadian English-Language Webseries and the Production of Culture Online,” Ryerson University PhD candidate Emilia Zboralska has been investigating English language web series funded through the Independent Production Fund (IPF) between 2010 and 2015. Together we took a small sample of the data she collected: 36 web series funded by the IPF between 2010 and 2014 for which director, writer and cinematographer data were available. These 36 series comprised 623 individual episodes.
We found that in spite of significant differences of scale, structure, and budget between legacy and web series, similar employment patterns prevail.
CHART 12A: Web Series Employment - Directors
Women 14% (6)
43 Totalindividuals
engaged
Men 86% (37)
CHART 12B: Web Series Employment - Writers
Women 27% (26)
98 Totalindividualsengaged
Men 73% (72)
CHART 12C: Web Series Employment - Cinematographers
Women 2% (1)
42 Totalindividualsengaged
Men 98% (41)
CHART 12: Web Series Employment
Total Series: 36; Total Episodes: 623
■ Of 43 directors engaged in these series, 37 (86%) were men and 6 (14%) were women.
■ Of 98 writer credits, 72 (73%) went to men and 26 (27%) went to women.
■ Of 42 cinematography positions, 41 (98%) went to men and 1 (2%) went to a woman.
Here, too, we noticed a remarkable number - 18 of 36 series (50%) - that employed not a single woman as writer, director or cinematographer.

16 WOMEN IN VIEW ON SCREEN - OCTOBER 2015 REPORT
CONCLUSIONCanadian media is big business. According to The Canadian Media Production Association, “[A]fter experiencing a drop of 2.1% in 2012/13 — from a ten-year peak the prior year — the total volume of film and television production in Canada increased by 2.1% to $5.86 billion in 2013/14.”12
Yet the stakes go beyond employment equity. As Hussain Amarshi of Mongrel Media put it so eloquently in a recent newspaper interview, “We as a nation, as a people, have stories to tell. And we need to create the conditions under which we can do that.”13 Directors and screenwriters are our media storytellers; and, to a great extent, who tells the story is the story. As a country, we know this; it’s embedded in our cultural DNA. It’s the reason we empower our cultural agencies to invest public funds to ensure that Canada’s stories get told, and heard, alongside the wealth of international stories that enrich us.
The statistics presented here speak for themselves; and the links and patterns among them speak the loudest. Women are not only an unacceptably small minority of those employed in these positions, but they are least present where the financial power is the greatest.
These data raise three key questions: Why do these trends persist to the extent that they do? Where in all these statistics do we find the most significant lessons? And what are the most effective measures we might take to improve the situation?
“Why” is simultaneously the simplest and most complex of the questions. Complex because it can be approached from an almost endless number of perspectives and lenses; simple because the answers all boil down to two words: history and habit. Yet habit and history provide only a degree of insight into the entrenched nature of this pattern, not a rationale for it.
“Where” is also a matter of opinion and perspective. From the vantage point of Women in View, and as these director-writer-actor numbers tell us, who writes and directs also determines who acts, who is seen, and whose stories are told.
As for “What,” the answer is embedded in the other two questions. These statistics tell us that a small minority of our media storytellers are women, a picture that has changed very little in recent decades. If we are going to realize meaningful change, we will have to go beyond what we have done in the past, and what we continue to do routinely and habitually. As the saying goes, “If you want to get something different, you need to do something different.”
WOMEN IN VIEW ON SCREEN - OCTOBER 2015 REPORT 17
CONTRIBUTORSWomen in View on Screen is written by Rina Fraticelli, founder and Executive Director of Women in View. She brings to this position a varied background as an award-winning independent filmmaker and policy analyst as well as executive producer of two National Film Board of Canada studios.
This study was undertaken by Women in View with the invaluable support of Dr. Kay Armatage, Professor Emerita, Cinema Studies Institute and Women and Gender Studies Institute, University of Toronto, and Dr. Charles H. Davis, Professor at Ryerson University in the RTA School of Media (Faculty of Communication and Design) and the Entrepreneurship and Strategy Department in the Ted Rogers School of Management.
Emilia Zboralska, PhD Candidate, Communication and Culture, Ryerson University, provided data and analysis on web series, part of her research project “Telling Our Stories on the Web: Canadian English-Language Webseries and the Production of Culture Online,” conducted with support from the Social Sciences and Humanities Research Council of Canada (SSHRC).
Additional research was provided by Victoria Hetherington, M.A. Candidate in the Communications and Culture Program at Ryerson University and Katie McMillan, Independent Media Researcher, Consultant Women in View.
This report was designed by Jennie Grimard in conjunction with Joss Maclennan’s master layout template.
SPECIAL THANKS
■ Ferne Downey and Jacob Leibovitch of ACTRA National
■ Denyse Marleau and Ariane Baillie-Gendron of Union des Artistes
WOMEN IN VIEW is a national non-profit organization dedicated to revitalizing the Canadian media industry by strengthening gender and cultural diversity both on screen and behind the scenes. We do this through a range of initiatives that seek to generate awareness, promote talent and spark dialogue across the full spectrum of production, policy and artistic arenas.
Women in View, 401 Richmond Street West, S-21, Toronto, Ontario, M5V 3A8www.womeninview.ca [email protected] +1-416-304-9398

18 WOMEN IN VIEW ON SCREEN - OCTOBER 2015 REPORT
ENDNOTES1 Dr. Stacey Smith, Marc Choueiti, Dr. Kathryn Pieper, “Inequality in 700 Popular Films,” Annenberg School for
Communications and Journalism, <http://annenberg.usc.edu/pages/~/media/MDSCI/Inequality%20in%20700%20Popular%20Films%2081415.ashx>.
2 Manohla Dargas, “Report Finds Wide Diversity Gap Among 2014’s Top-Grossing Films,” The New York Times, August 5, 2015.
3 Boxed In Annual Report (US television), San Diego State University, <http://womenintvfilm.sdsu.edu/files/2014-15_Boxed_In_Report.pdf>; Bunche Center Annual Hollywood Diversity Report (US film), UCLA, <http://www.bunchecenter.ucla.edu/wp-content/uploads/2015/02/2015-Hollywood-Diversity-Report-2-25-15.pdf>; Celluloid Ceiling Annual Report (US film), San Diego State University, <http://womenintvfilm.sdsu.edu/research.html>; “Female Directors in European Films,” European Audiovisual Observatory survey <http://www.obs.coe.int/en/shop/market-and-finance/-/asset_publisher/F1Nx/content/female-directors-in-european-films?> Media Business Insight Limited Knowledge Bulletin (a UK film & television industry directory <http://www.theknowledgeonline.com/guides/post/2015/07/13/what-percentage-of-uk-film-crew-members-are-female>); Media, Diversity, & Social Change (MDSC) Annual Diversity Study (US film), University of Southern California <http://annenberg.usc.edu/pages/~/media/MDSCI/Inequality%20in%20700%20Popular%20Films%2081415.ashx>; “No Country for Young Women,” NamSor Applied Onomastics GendRE API analysis of the entire database of film directors from the IMDb (Internet Movie Database), <http://nocountryforyoungwomen.com/2014/05/gendre-imdb-an-open-data-analysis-of-the-film-industry-gender-gap/>; Stephen Follows, British Film Institute, weekly surveys of the British film industry;
4 Telefilm Canada Investment Report April 1 2013 - March 31 2014 http://www.telefilm.ca/en/telefilm/investment-reports 88, 1987, A Worthy Companion, After the Ball, Ally Was Screaming, Algonquin, Aloft (aka Cry / Fly), Autrui, Avant les Rues, Backcountry, Bang Bang Baby, Ballerina, Big Muddy, Big News from Grand Rock, The Birdwatcher , Black Code, Black Fly Summer, Cinemanovels, The Calling, Chorus (aka Forget Me Not), A Christmas Horror Story, Corbo, Crawlspace, Cruel & Unusual, Cubicle Warriors, The Dark Stranger, Les Démons , The Devil’s Horn, The Dick Knost Show, Down In The Valley, Down River, Dr. Cabbie, Eadweard, The Editor, The Elephant Song , Endorphine, Entre la paix et la guerre, La Face cachée de l’impôt , Fall, La Gang des Hors-la-loi, The Girl King, La Guerre des Tuques 3D , Guidance, Gurov and Anna, Heartbeat, Hellions, Henri Henri (aka Le Relampeur), Hit By Lightning, How To Be Deadly, I Put A Hit On You, Je Suis a Toi, Katia (Diary of an Old Man), Le vrai du faux (aka Furie), Les Maîtres du Suspense, Lièvres, Life, Le Loups, Love project (aka Exit), Lure, Man Vs., Maps to the Stars, Midnight Sun, Mommy, Un Monde truque , Mountain Men, N.O.I.R., No Men Beyond This Point, One Sweet Film, La Passion d’Augustine , Patch Town, La Petite Reine , Pretend We’re Kissing, Qu’est-ce qu’on fait ici?, Reasonable Doubt, Regression, Relative Happiness, Remember, Rest Home, The Scarehouse , Seances, The Secret Trial 5, Standstill, Swearnet, Teen Lust, Turbo Kid, Two 4 One, Un film de chasse de filles, Wet Bum, What an Idiot, What We Have, Zoom
5 88, After the Ball, Animal Crackerz, Big News from Grand Rock,The Calling, Coconut Hero, The Dark Stranger, The Devil’s Horn, Dr. Cabbie, Esc, Fall, The Girl King, Helions, Hip Hop Evolution, How to Change the World, Limousine, Man VS, Map to the Stars, Midnight Sun, Milk, October Gale, One Sweet Film, The Second Time Around, Songbird SOS, Wet Bum, What We All Long For, Zoom.

WOMEN IN VIEW ON SCREEN - OCTOBER 2015 REPORT 19
6 C.f. Stacy L. Smith, PhD., Katherine Pieper, PhD., Marc Choueiti, & Ariana Case, “Gender & Short Films: Emerging Female Filmmakers and the Barriers Surrounding their Careers,” <http://annenberg.usc.edu/pages/~/media/MDSCI/MDSC%20LUNAFEST%20Report%2010515.ashx>; Stacy L. Smith, PhD., Katherine Pieper, PhD., Marc Choueiti, & Ariana Case, “Exploring the Careers of Female Directors: Phase III,” Media, Diversity, & Social Change Initiative, Annenberg School for Communication & Journalism, University of Southern California, < http://www.sundance.org/pdf/artist-programs/wfi/phase-iii-research---female-filmmakers-initiative.pdf>.
7 The criterion for determining “top role” and “top four roles,” made in collaboration with ACTRA National and Union des Artistes, was the total number of days worked.
8 The 2012-13 fiscal year data follows on CMF English-language series data reported in previous Women in View on Screen Reports (ie 2010-11 in WIVOS 2013; 2011-12 in WIVOS 2015). Projects were filtered by year 2012-13, language (English), program (Performance envelopes), genre (drama), activity (production), platform (television), status (contracted). To focus on “TV live action series”, within the projects listed, we took out TV movies, animation, and variety shows. Final result is live action English television drama series from the performance envelope program contracted for production funding in 2012-13.
9 27 different series, 2 of which were reported as funded for 2 seasons in the 2012-2013 fiscal year: <http://www.cmf-fmc.ca/funded-projects/funded-projects-database/1/?program=Performance+Envelopes&activity=Production&genre=Drama&status=Contracted&platform=Television&fiscalYear=2012-2013&language=English&displayCommitment=0>.
10 19-2, Blackstone, Forgive Me, Heartland (2 Seasons), The La Complex, Layla and Jen, The Listener, Mr. D, Package Deal, Port Hope, Satisfaction, Saving Hope (2 seasons), Seed, Sensitive Skin, Spun Out, Vikings.
11 The Independent Production Fund (http://ipf.ca).12 http://cmpa.ca/sites/default/files/documents/industry information/ profile/ CMPA_ 2014_eng.pdf.13 Simon Houpt, “The Shaky Future of Canadian Cinema,” The Globe and Mail, Sept 5, 2015. Full quote:
“At the core of this we have to remember: Why are we actually putting taxpayers’ money into these films, or making actually any cultural things? It’s because it’s part of our identity, it is an outlet for our own creative endeavours. It cannot be just about creating jobs or creating some kind of industry. It has to be driven by the original impetus: That we as a nation, as a people, have stories to tell, both to ourselves and to the world. And we need to create the conditions under which we can do that.”
Building a more vibrant, innovative and equitable media landscape
Women in View is a national not-for-profit organization dedicated to strengthening gender and cultural diversity in Canadian media both on screen and behind the scenes. We do this through a range of initiatives that seek to generate awareness, promote talent and spark dialogue across the full spectrum of production, policy and artistic arenas.
MISSION The mission of Women in View is the achievement of greater diversity and balance in Canadian media from the standpoint of employment equity, creative authority and gender representation.
GOALS ■ To raise awareness of the extent and implications of gender imbalance in media industries.
■ To increase the presence of women employed in media, particularly in positions of creative authority.
OBJECTIVE 1: INFORMATION-GATHERING ■ Map the status of women, particularly in positions of leadership and creative authority, both
behind the scenes and on screen.
■ Generate constructive cross sector dialogue to identify the factors inhibiting the full participation of women in media industries, and their remedies.
OBJECTIVE 2: BUILDING AWARENESS ■ Promote awareness of the facts and the cultural, social, economic and political costs of
gender inequity in the Canadian media sector industries, both within these industries and in the wider society.
OBJECTIVE 3: EFFECTING SYSTEMIC CHANGE ■ Develop a range of practical, effective and sustainable strategies to counter systemic
obstacles to women’s full participation in media industries, each tailored to specific facets of the industry, policy and educational sphere.
■ Build multi-sector partnerships and collaborations in the service of these goals.
Women in View, 401 Richmond Street West, S-21, Toronto, Ontario, M5V 3A8www.womeninview.ca [email protected] +1-416-304-9398