Embed Size (px)
Citation preview

ON OUR WAY TO GROWTH
Phoenix Solar May 2017
1

Phoenix Business Model
2
The Phoenix Solar Group is a „global one-stop-shop“ for the engineering, procurement and construction (EPC) of commercial rooftop and ground-mounted solar photovoltaic power plants. In other words: Phoenix Solar designs, procures the components and manages the construction of these power plants in various countries around the globe. We have a track record of some 800 MWp of quality, high-yield systems, delivered on-time and on-budget to drive customer satisfaction.

3
Solar: A Global Growth Story
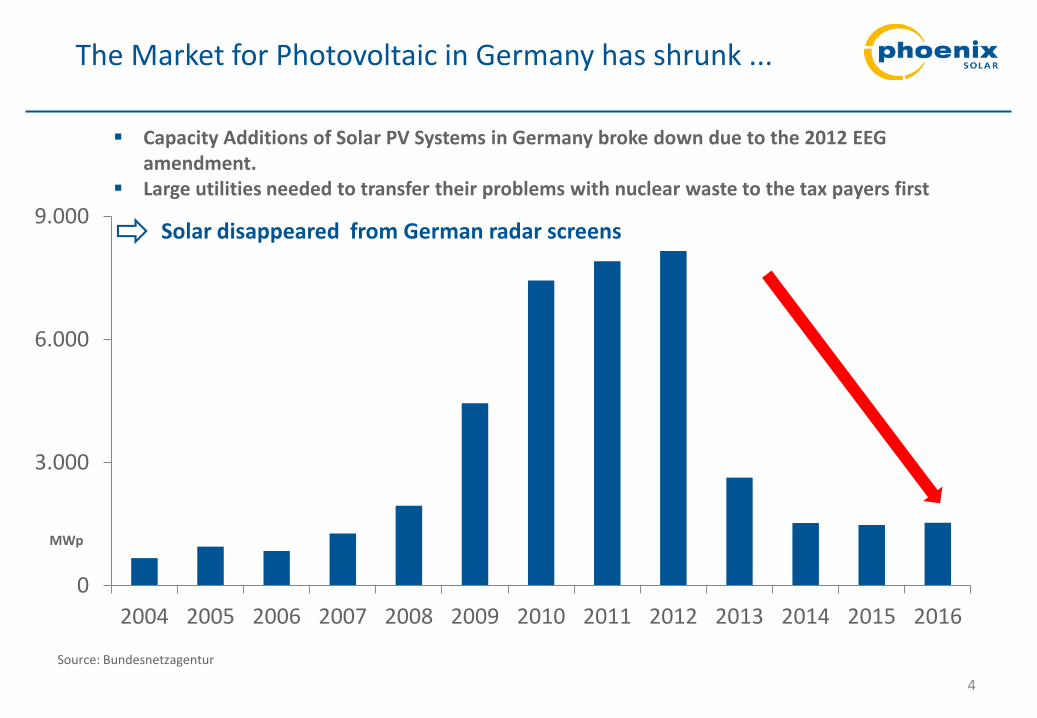
The Market for Photovoltaic in Germany has shrunk ...
0
3.000
6.000
9.000
2004 2005 2006 2007 2008 2009 2010 2011 2012 2013 2014 2015 2016
MWp
4
Source: Bundesnetzagentur
Capacity Additions of Solar PV Systems in Germany broke down due to the 2012 EEG amendment.
Large utilities needed to transfer their problems with nuclear waste to the tax payers first Solar disappeared from German radar screens
5
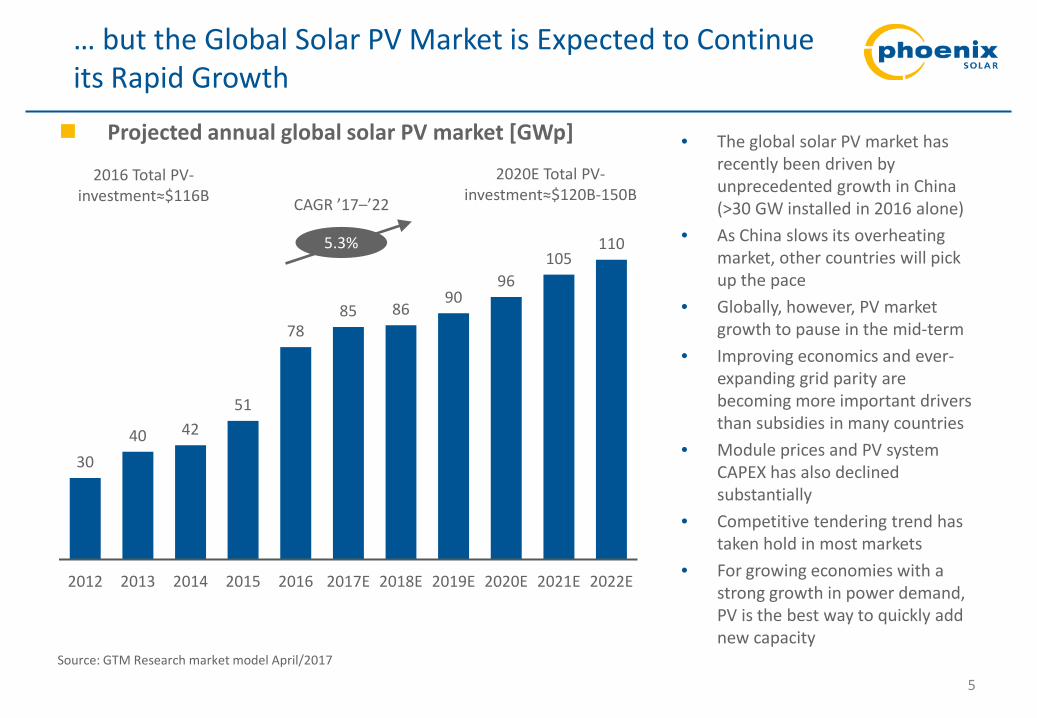
Projected annual global solar PV market [GWp]
30 40 42
51
78 85 86
90 96
105 110
2012 2013 2014 2015 2016 2017E 2018E 2019E 2020E 2021E 2022E
Source: GTM Research market model April/2017
2016 Total PV-investment≈$116B
5.3%
CAGR ’17–’22
• The global solar PV market has recently been driven by unprecedented growth in China (>30 GW installed in 2016 alone)
• As China slows its overheating market, other countries will pick up the pace
• Globally, however, PV market growth to pause in the mid-term
• Improving economics and ever-expanding grid parity are becoming more important drivers than subsidies in many countries
• Module prices and PV system CAPEX has also declined substantially
• Competitive tendering trend has taken hold in most markets
• For growing economies with a strong growth in power demand, PV is the best way to quickly add new capacity
2020E Total PV-investment≈$120B-150B
… but the Global Solar PV Market is Expected to Continue its Rapid Growth

The Solar PV Market: Cost Base Down 82% from 2009 through 2016
6
LCoE = Levelized Cost of Energy (Total Generating Cost, Unsubsidized) Solar is competitive now, has overtaken cost of wind
Utility Scale
C&I Rooftop
Source: Lazard, Levelized Cost of Energy Analysis, 12/2016

49 46
79
32
77
48
60
97
61 56
117
62
110
78
143 136
0
20
40
60
80
100
120
140
160
Solar PV - CSi Solar PV - thin film Geothermal Wind Biomass Nat. Gas - Combined Cycle
Coal Nuclear
low high
Lazard LCoE Study – 10th Iteration, Dec. 2016 Levelized Cost of Energy: all-in production cost/ in $US per MWh
7
$US / MWh
Source: Lazard, Levelized Cost of Energy Analysis, 12/2016

PV Market Segmentation – Focus of Phoenix Solar Group
8
Utility scale Utility-scale solar power plants for large-scale power generation 60–70% of global market
Commercial & industrial (C&I) Systems to generate electricity for commercial and industrial power consumers 15–25% of global market
Residential Installations on residential buildings for self-consumption or to benefit from feed-in-tariffs/net metering 10–20% of global market
Phoenix Solar’s focus segments
Phoenix Solar focuses on the utility-scale and C&I segments exclusively as a pure B2B company Although residential PV (as a B2C business) has a substantial market share in several established PV markets, most new
capacity in growing markets is planned to be utility-scale, with C&I also taking a significant share
Source: Apricum PV market model Q4/2015
Phoenix Solar focuses on the Utility-Scale and C&I Segments, i.e. 80–90% of the PV Market
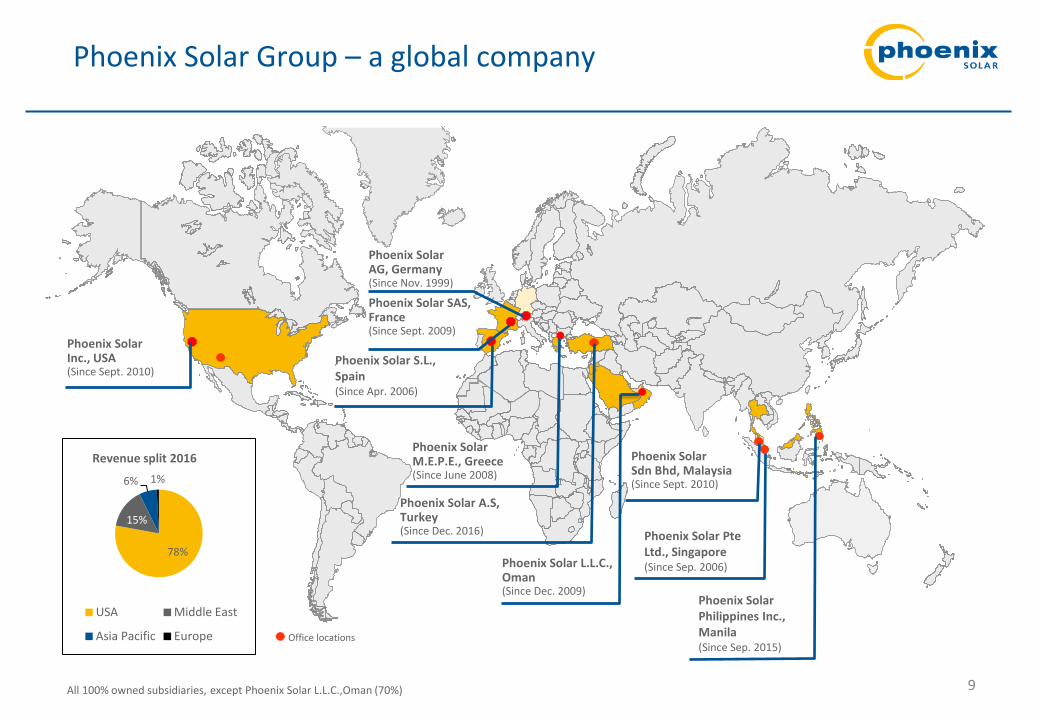
Phoenix Solar Group – a global company
9
All 100% owned subsidiaries, except Phoenix Solar L.L.C.,Oman (70%)
Phoenix Solar M.E.P.E., Greece (Since June 2008)
Phoenix Solar AG, Germany (Since Nov. 1999)
Phoenix Solar S.L., Spain (Since Apr. 2006)
Phoenix Solar SAS, France (Since Sept. 2009)
Phoenix Solar L.L.C., Oman (Since Dec. 2009)
Phoenix Solar Inc., USA (Since Sept. 2010)
Phoenix Solar Sdn Bhd, Malaysia (Since Sept. 2010)
Phoenix Solar Philippines Inc., Manila (Since Sep. 2015)
Phoenix Solar Pte Ltd., Singapore (Since Sep. 2006)
Office locations
78%
15%
6% 1%
Revenue split 2016
USA Middle East
Asia Pacific Europe
Phoenix Solar A.S, Turkey (Since Dec. 2016)
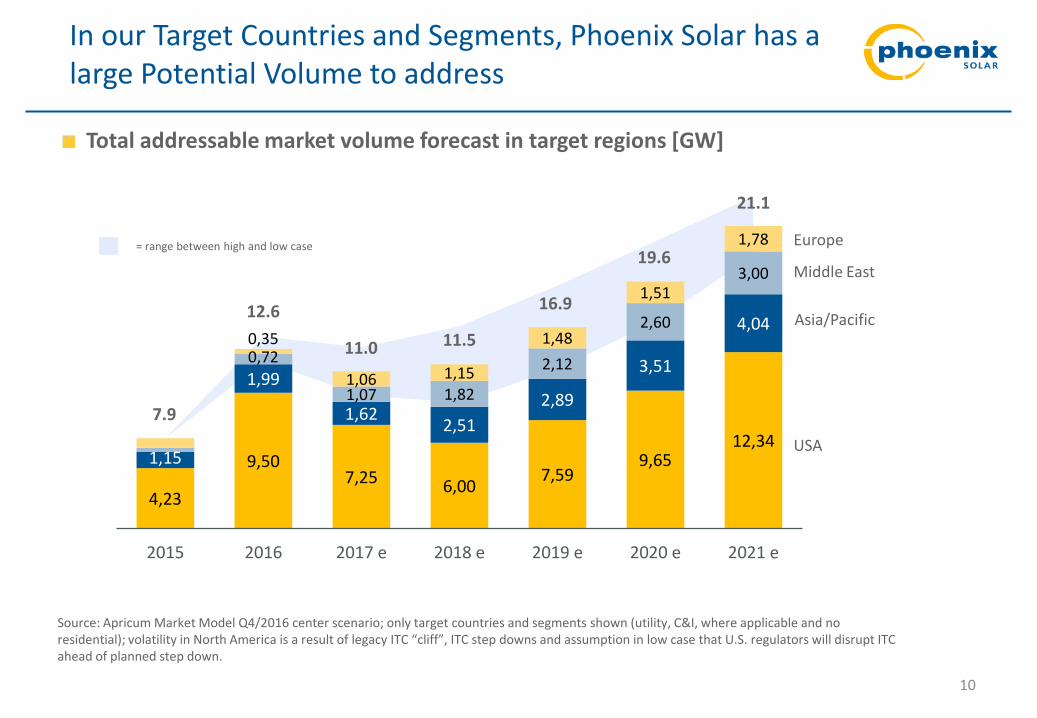
In our Target Countries and Segments, Phoenix Solar has a large Potential Volume to address
10
Total addressable market volume forecast in target regions [GW]
4,23
9,50 7,25 6,00 7,59
9,65 12,34
1,15
1,99
1,62 2,51 2,89
3,51
4,04
0,72
1,07 1,82
2,12
2,60
3,00
0,35
1,06 1,15
1,48
1,51
1,78
2015 2016 2017 e 2018 e 2019 e 2020 e 2021 e
= range between high and low case
7.9
12.6
11.0
16.9
19.6
USA
Asia/Pacific
Middle East
Europe
Source: Apricum Market Model Q4/2016 center scenario; only target countries and segments shown (utility, C&I, where applicable and no residential); volatility in North America is a result of legacy ITC “cliff”, ITC step downs and assumption in low case that U.S. regulators will disrupt ITC ahead of planned step down.
21.1
11.5

11
Strong Brand Name and Specialist in PV Solutions
Phoenix Solar has broad experience in the solar industry and an excellent track record with some 800 MWp of PV systems completed around the globe
Phoenix Solar delivers High-Quality PV Systems on time, on budget with high customer benefit Phoenix Solar understands the entire PV value chain and supports their customers already during project development phase One major asset of Phoenix Solar is their deep knowledge of the legal requirements for project development especially in the US
and their ability of providing complex project financing and even negotiate PPAs. Especially their excellent network among project developers gives them a strong position in the highly competitive US market.
Over 20 years experience and exclusive focus on the Solar Power EPC business Phoenix Solar Group has a strong reputation as a German based engineering company Phoenix Solar is highly process oriented in their customer approach The Phoenix brand name is well know as high quality provider for PV solutions and know for its integrity
German Engineering Brand
A specialist in large-scale PV solutions
Agile and lean organization
Strong focus on global position
Management and execution teams at Phoenix Solar are made up of deeply-experienced PV and energy industry professionals With this experienced base, Phoenix Solar has developed a lean organization, reducing overhead and maximizing efficiency Phoenix Solar’s lean structure gives it the flexibility and adaptability required in the ever-changing solar market environment
Today, Phoenix Solar is solidly positioned to profit from growth in the global solar market, with focus on expanding its market reach in three attractive target regions: the USA, Middle East and Asia Pacific. All target geographies are expected to show sustainable growth rates well above the average worldwide PV market
Phoenix Solar is used to enter new markets in the fast changing environment of solar industry. Phoenix valuates carefully upcoming markets about new opportunities for profitable growth and is able to start business in these markets fast

Proposal Project Finance
Design & Engineering
Construction Commissioning
Due Diligence Discovery Operation &
Maintenance
Phoenix Solar’s Full Service: EPC and Beyond
Phoenix Solar maintains an extensive network among the construction and permanent
financing community and provides financial advisory if
needed.
Steady cash flows are critical for our clients success. We manage
our O&M subcontractors and ensure performance ratios are met
and exceeded.
LCOE analysis and plant design optimization is key to our
services. We understand ROIs and know that slight efficiency
increases can change project financing economics significantly.
We are helping our clients to
select the optimal sites in
regards to project
execution and production.
Once a site is selected, a complete and thorough due diligence is carried out.
Attention to details already in this early phase of development can impact project costs
later on. This includes proper geotechnical studies, permitting due diligence, PPA
negotiations, interconnection studies etc.
Our proposals are transparent and customized. We point out what is
included and what is not, so there are
no surprises.
Utility-like safety standards are our number one priority. Executing on-
time, on-budget and with an excellent attention to detail on
high quality German Engineering
12
All projects permanently cash positive due to milestone payments from customer
13
Some Reference Projects
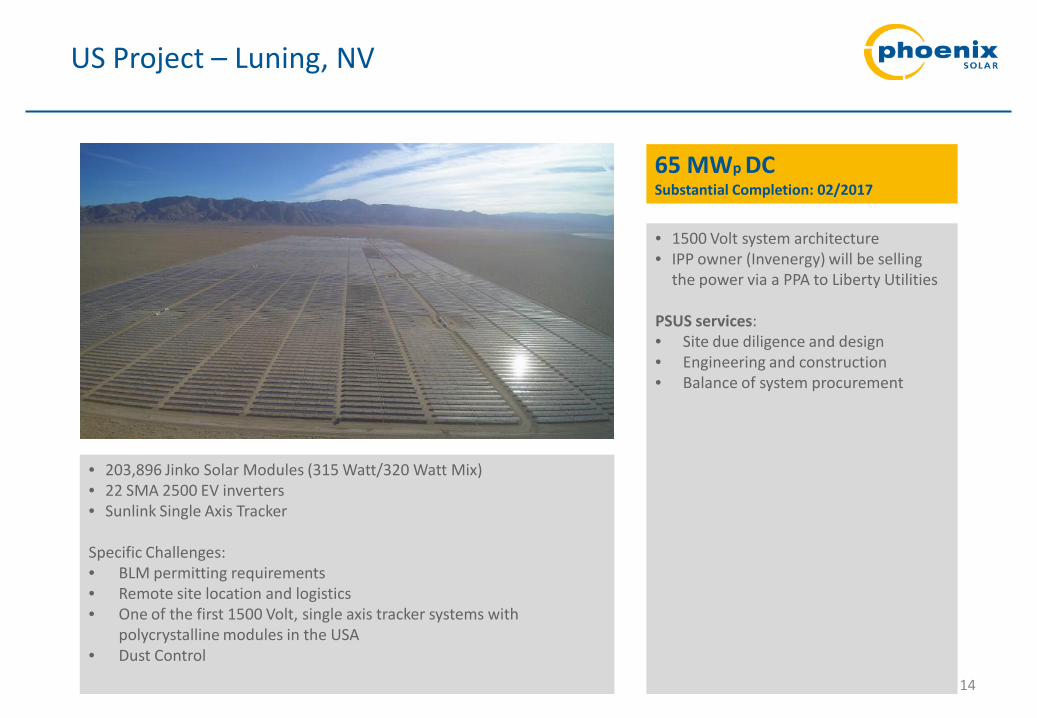
65 MWp DC Substantial Completion: 02/2017
US Project – Luning, NV
• 1500 Volt system architecture • IPP owner (Invenergy) will be selling
the power via a PPA to Liberty Utilities
PSUS services: • Site due diligence and design • Engineering and construction • Balance of system procurement
14
• 203,896 Jinko Solar Modules (315 Watt/320 Watt Mix) • 22 SMA 2500 EV inverters • Sunlink Single Axis Tracker Specific Challenges: • BLM permitting requirements • Remote site location and logistics • One of the first 1500 Volt, single axis tracker systems with
polycrystalline modules in the USA • Dust Control
15
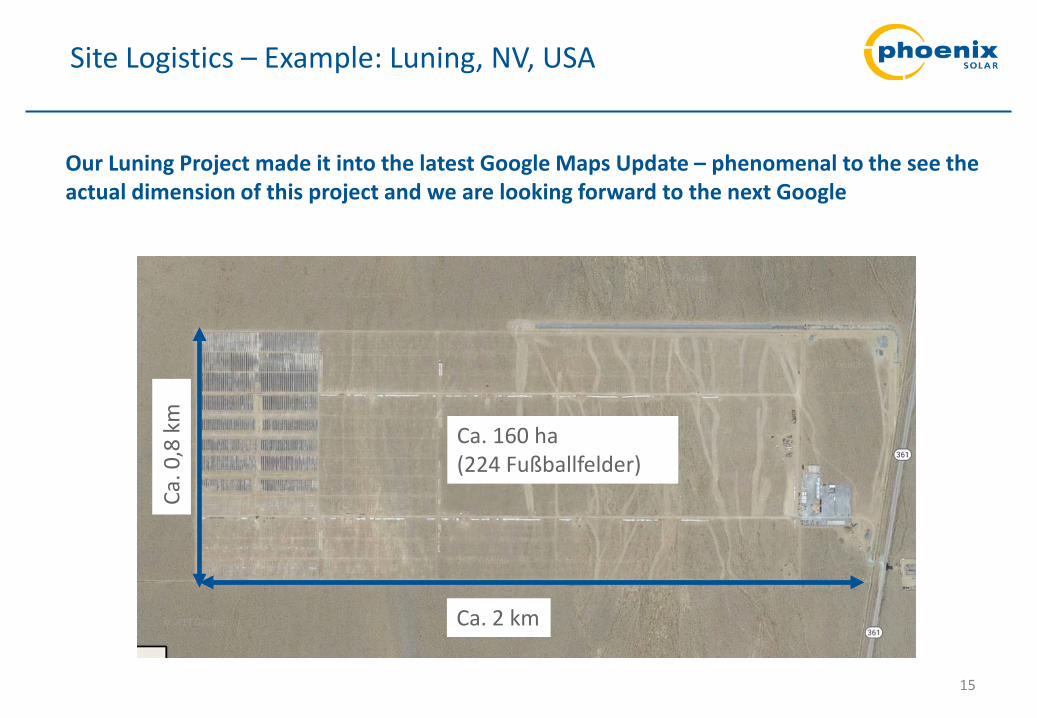
Site Logistics – Example: Luning, NV, USA
Our Luning Project made it into the latest Google Maps Update – phenomenal to the see the actual dimension of this project and we are looking forward to the next Google
Ca. 2 km
Ca. 0
,8 k
m
Ca. 160 ha (224 Fußballfelder)

Middle East Project – Elaziğ, Turkey
16
Project: First Licensed Utility-Scale PV Power Plant in Turkey
Elaziğ, Turkey Customer: Akfen Renewable Energy System size: 9.1 MWp

Asia/Pacific Project – Singapore
17
Project: Car Park and Rooftop for Rolls Royce
Singapore Customer: Rolls Royce System size: 3 MWp

Our Clients, Site Hosts, and Partner Companies
18
Off Takers & Site Hosts System Owners Financiers/Bonding Interconnection Hosts

19
Building the Future – Status and Investment Case

Continuous growth in Phoenix Solar’s pipeline
20
107
63 34
53 61 72 84 88
44
20
178 95 65
74
1 1
70
91
108
114
110
139 245 260
221
173
320
262 236
286
330 349
Jun 15 Sep 15 Dec 15 Mar 16 Jun 16 Sep 16 Dec 16 Mar 17
M3 On short list M4 Contract M5 Construction
MWp per milestone – weighted At the end of March highest amount of MWp under construction in the history of Phoenix Solar
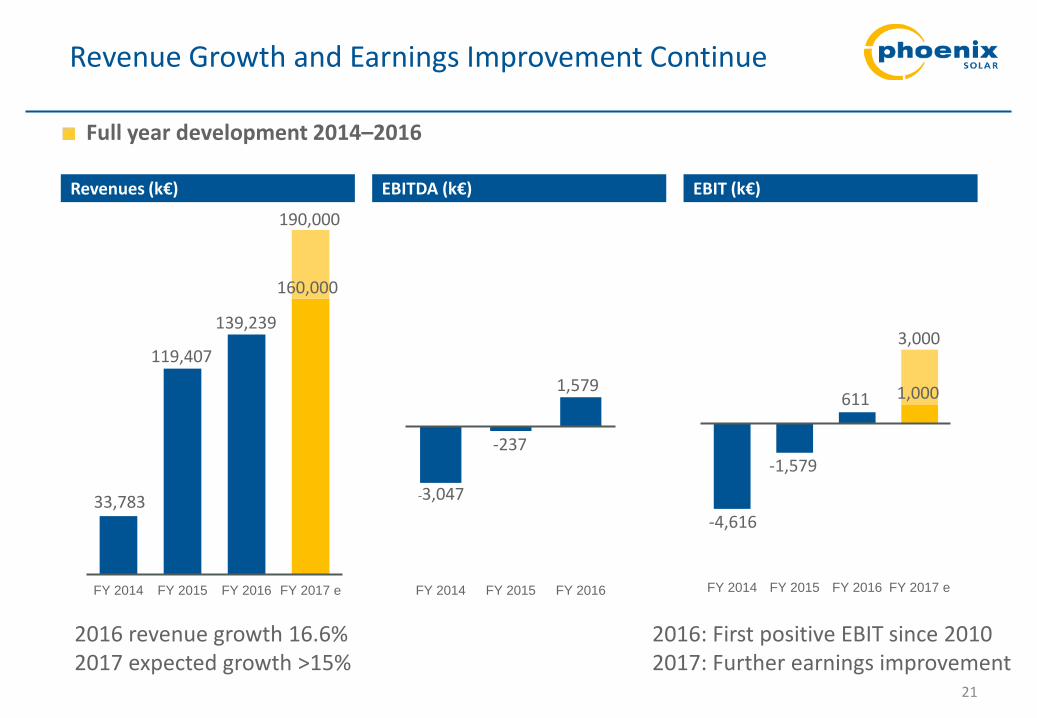
Revenue Growth and Earnings Improvement Continue
Revenues (k€)
FY 2014 FY 2015 FY 2016 FY 2017 e
33,783
119,407
EBIT (k€)
21
EBITDA (k€)
FY 2014 FY 2015 FY 2016 FY 2017 e
-4,616
-1,579
FY 2014 FY 2015 FY 2016
-3,047
-237
Full year development 2014–2016
139,239
1,579 611
2016: First positive EBIT since 2010 2017: Further earnings improvement
2016 revenue growth 16.6% 2017 expected growth >15%
160,000
190,000
1,000
3,000
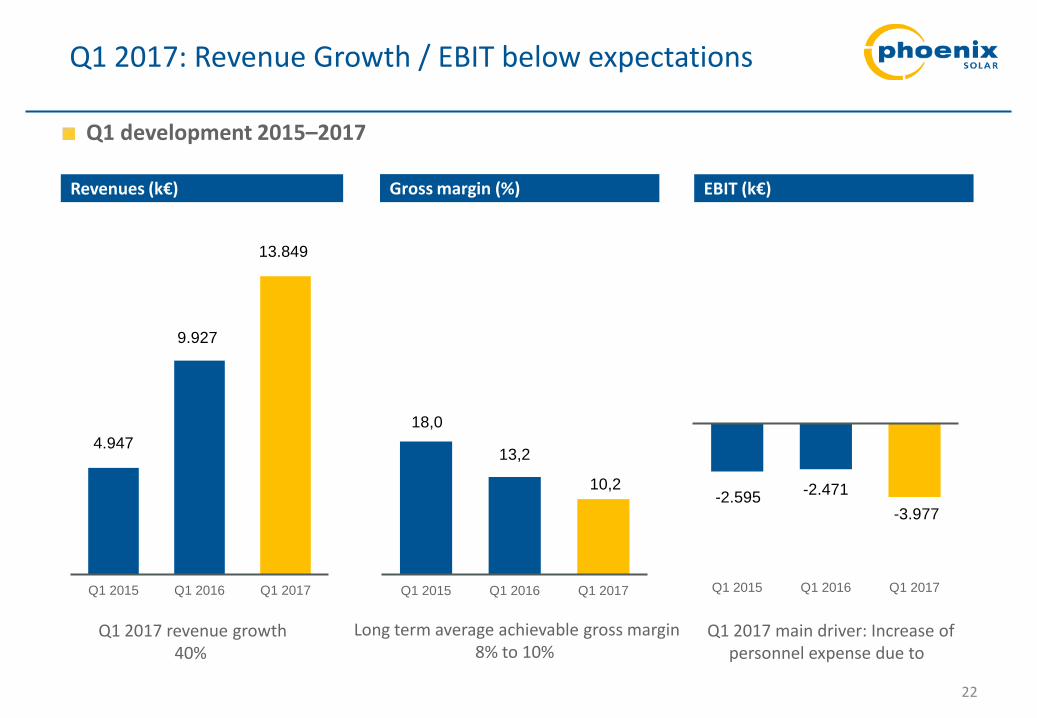
Q1 2017: Revenue Growth / EBIT below expectations
Revenues (k€)
4.947
9.927
13.849
Q1 2015 Q1 2016 Q1 2017
EBIT (k€)
22
-2.595 -2.471 -3.977
Q1 2015 Q1 2016 Q1 2017
Q1 development 2015–2017
18,0
13,2
10,2
Q1 2015 Q1 2016 Q1 2017
Gross margin (%)
Long term average achievable gross margin 8% to 10%
Q1 2017 revenue growth 40%
Q1 2017 main driver: Increase of personnel expense due to
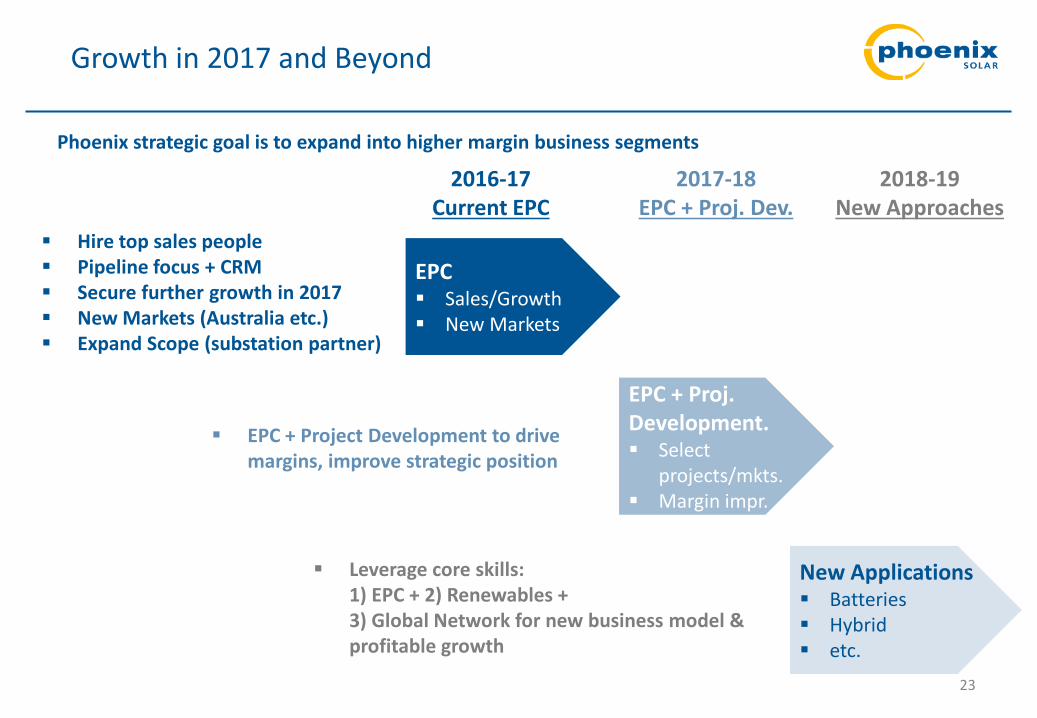
Growth in 2017 and Beyond
23
Phoenix strategic goal is to expand into higher margin business segments
Hire top sales people Pipeline focus + CRM Secure further growth in 2017 New Markets (Australia etc.) Expand Scope (substation partner)
EPC Sales/Growth New Markets
2016-17 Current EPC
2017-18 EPC + Proj. Dev.
EPC + Proj. Development. Select
projects/mkts. Margin impr.
2018-19 New Approaches
New Applications Batteries Hybrid etc.
Leverage core skills: 1) EPC + 2) Renewables + 3) Global Network for new business model & profitable growth
EPC + Project Development to drive margins, improve strategic position

Phoenix Solar’s strategy summary
24
Strengthen footprint in three core regional clusters - US, ME, AP – by professionalizing & expanding sales activities, drive project acquisition and pipeline expansion to generate profitable growth and share gains in established markets Expand global reach by
entering into new markets within the three target regions after careful cost/benefit analysis (e.g. Australia, Morocco)
Base EPC business + expansion along value chain
Improve overall competitiveness
Three core geographies + selective expansion
Continue to strengthen core EPC business: estimating & bidding, on-time/on-budget project execution, upgrading global sales team & tools
Enter project development in selected markets, leverage broad expertise from EPC business – requires some investment
Enable Phoenix to hold minority stakes in projects in emerging markets
Increase attractiveness, competitiveness to clients and partners with a strong balance sheet
Build global supply chain capabilities to achieve 8-10% annual system cost savings & sign agreements with preferred Tier 1 suppliers
Introduce process organization to ensure efficiency, measurability and HR/Organization Development measures for a strong global team
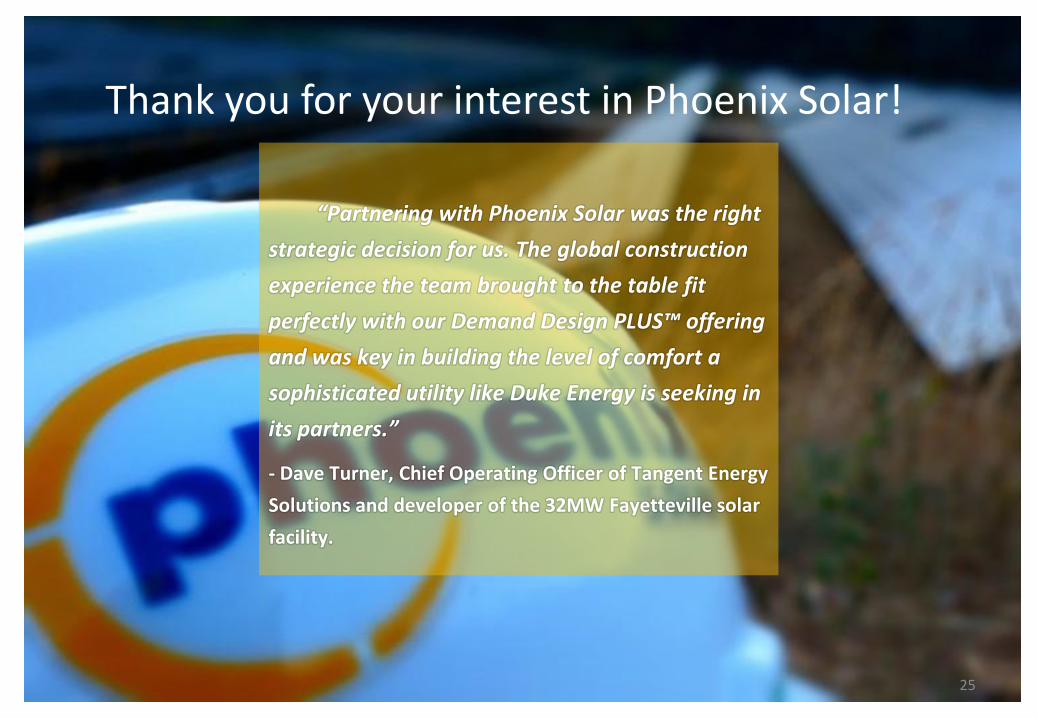
Thank you for your interest in Phoenix Solar!
25
“Partnering with Phoenix Solar was the right strategic decision for us. The global construction experience the team brought to the table fit perfectly with our Demand Design PLUS™ offering and was key in building the level of comfort a sophisticated utility like Duke Energy is seeking in its partners.”
- Dave Turner, Chief Operating Officer of Tangent Energy Solutions and developer of the 32MW Fayetteville solar facility.

Founding of the Phönix solar initiative
Sale of the first photovoltaic plant
Founding of Phönix SonnenStrom AG Listing of the Phönix SonnenStrom share on the stock exchange Completion of first 5 MW plus Ground
Mounted System Founding of subsidiaries in Spain and Singapore
Re-branding: Phoenix Solar AG Founding of subsidiaries in Greece and Italy
Founding of subsidiaries in France & JV in Oman Market entry into the USA
First multi-MW EPC contract USA
1994
1999
2005
2007
2009
2011
1998
2004
2006
2008
2010
26
Market exit Germany
Successful Completion of multiple Utility Scale Projects in the US, significant year to year growth accomplished
2012
2015
Completion of largest (at date) PV Power Plant east of the Mississippi
2013
Phoenix Solar History

Broad experience in growth - oriented
business development, general
management and leadership with
international businesses. Expert for the
technical, sales-related, commercial and
financial aspects of utility-scale and
commercial rooftop solar PV systems.
With extensive experience in financial
affairs, Manfred Hochleitner takes the
responsibility for Controlling, Treasury,
Group Accounting, Tax functions and he
plays a significant role in Group financing.
Tim P. Ryan CEO since 01/2015
Manfred Hochleitner CFO since 01/2015
27
Major Responsibilities:
Corporate Strategy
Business Development and Sales
USA, Asia Pacific, Middle East Regions
Corporate Communications
Major Responsibilities:
Finance and administration
Internal Audit, Legal and Compliance
Europe Region
Investor Relations
Phoenix Solar’s Management: Seasoned Industry and Functional Experts
Appendix

Key Figures 2014 - 2016
2014 y-on-y change 2015 y-on-y
change 2016
Shipments (MWp) 28.9 241.5% 98.7 55.7% 153.7 Revenues (€M) 33.8 253.3% 119.4 16.6% 139.2 Gross Margin (%) 17.0 -50.6% 8.4 50.0% 12.6 Personnel Expense (€M) 9.6 -20.4% 7.6 48.8% 11.3 Other Operating Expense (€M) 10.9 -27.6% 7.9 15.4% 9.1 EBIT (€M) -4.6 -65.8% -1.6 n. a. 0.6 Financial Result (€M) -5.1 -14.8% -4.4 -4.7% -4.3 Net Earnings (Shareholders / €M) -10.2 -44.6% -5.6 -4.7% -4.6 EPS (€) -1.38 -48.6% -0.71 -12.7% -0.62 Free Order Backlog (€M / as of 12/31) 36.3 309.0% 148.5 -62.4% 55.8 Total Assets (€M/ as of 12/31) 45.2 18.0% 53.4 -12.9% 46.5 Shareholders’ Equity (€M/ as of 12/31) -1.6 377.1% -7.6 60.4% -12.1 Parent Company Equity Quota (as of 12/31) 20.0% -38.5% 12.3% -30.1% 8.6% Net debt (€M/ as of 12/31) 36.6 -6.6% 34.2 -24.3% 25.9 Operating Cash Flow (€M) 8.5 -79.1% 1.8 -93.0% 0.1 Employees (Headcount) 96 -18.8% 78 55.1% 121
28

The Phoenix Solar Share: Key Data
5,4% 0,4%
94,2%
Volker Wiewer
Management & supervisory board Free float
PS4 share price development (1 yr)
Share details
Capital market data*
Shareholder structure
ISIN / WKN DE000A0BVU93 / A0BVU9 Symbol PS4 Number of shares issued and outstanding
7,372,700 no-par bearer shares
Share capital € 7,372,700 Treasury shares none Authorized share capital € 3,686,350 Market segment Deutsche Börse Prime Standard Trading XETRA, Frankfurt (Prime Standard), Munich
(M:access), Stuttgart, Berlin, Dusseldorf, Hamburg, Hanover, Tradegate Exchange
Financial year end 31 December Designated sponsor Oddo Seydler
0
100
200
300
400
500
0
2,00
4,00
6,00
May
-16
Jun-
16
Jul-1
6
Aug-
16
Sep-
16
Oct
-16
Nov
-16
Dec-
16
Jan-
17
Feb-
17
Mar
-17
Apr-
17
May
-17
Volume ('000) Share Price (€)
29
Share price (in €) 3,04 52-w-high / -low 4.20/ 2.20
30-day avg. share price absolute / volume weighted 3.003/ 3.064
90-day avg. share price absolute / volume weighted 2.961/ 2.983
180-day avg. share price absolute / volume weighted 2.826/ 2.823
30-day avg. trading volume (in shares) 13,344 90-day avg. trading volume 14,652 180-day avg. trading volume 14,053 No. of shares outstanding (in ’000) 7,372.7 Market capitalization (in €M) 22.4
* as of May. 15, 2017 Appendix

30
13,6*14,88
Share Price Development (Nov 18, 2016 – May 15, 2017)
Appendix
31
The content of this presentation is solely for information purposes and is not intended to constitute a recommendation for investment or a solicitation to subscribe or an offer to buy or sell securities of the company. Phoenix Solar AG shall undertake no liability whatsoever for any loss in connection with this presentation or the information contained therein. This also applies particularly to any eventual loss in connection with the shares of Phoenix Solar AG. This document contains forward-looking statements on future developments which are based on management’s current assessment. Words such as “anticipate”, “assume”, “believe”, “estimate”, “expect”, “intend”, “can/could”, “plan”, “project”, “forecast”, “should”, and similar terms are indicative of such forward-looking statements. Such statements are subject to certain risks and uncertainties which are mainly outside the sphere of influence of Phoenix Solar AG, but which have an impact on the business activities, the success, the business strategy and the results. These risks and factors of uncertainty include, for instance, climatic change, changes in the state subsidisation of photovoltaics, the introduction of competitor products or technologies of other companies, the development of the planned internationalisation of business activities, fierce competition as well as rapid technological change in the photovoltaic market. If one of these or other factors of uncertainty or risks should occur, or if the assumptions underlying the statements should prove incorrect, the actual results may diverge substantially from the results in these statements or implicit indications. Phoenix Solar AG does not have the intention nor will it undertake any obligation to realise forward-looking statements on an ongoing basis or at a later point in time as this is entirely dependent on circumstances prevailing on the day of their release. In some countries the dissemination of this presentation and the information contained therein may be restricted or prohibited under the law. This presentation is therefore expressly not intended for persons resident in legal systems under which such an offer or solicitation is not permissible, or for persons for whom such an offer or invitation would constitute a breach of the law.
Appendix
Disclaimer

32
Phoenix Solar AG Dr. Joachim Fleïng Hirschbergstraße 4 D-85254 Sulzemoos Germany Phone +49 8135 938-315 Fax +49 8135 938-429 www.phoenixsolar-group.com [email protected]
Appendix
Contact Details


![Honey, I Shrunk My Wasted Spend [Webinar]](https://img.pdfslide.us/doc/110x75/554cec62b4c905a5138b47d9/honey-i-shrunk-my-wasted-spend-webinar.jpg)


![NewHeadWay Academic Skills Level 1 TG [Shrunk]](https://img.pdfslide.us/doc/110x75/577cd9301a28ab9e78a2f077/newheadway-academic-skills-level-1-tg-shrunk.jpg)
![Global Pre-int TB Intro [shrunk].pdf](https://img.pdfslide.us/doc/110x75/577c776b1a28abe0548c0189/global-pre-int-tb-intro-shrunkpdf.jpg)
![Global Elementary SB Intro-Unit 4 [Shrunk]](https://img.pdfslide.us/doc/110x75/55cf9033550346703ba3d653/global-elementary-sb-intro-unit-4-shrunk.jpg)


![Objective IELTS Advanced WB With Answers [Shrunk]](https://img.pdfslide.us/doc/110x75/577ccf901a28ab9e78900c31/objective-ielts-advanced-wb-with-answers-shrunk.jpg)
![Global Beginner SB Unit 14-End [Shrunk]](https://img.pdfslide.us/doc/110x75/55cf9407550346f57b9f27d4/global-beginner-sb-unit-14-end-shrunk.jpg)