Embed Size (px)
Citation preview
RAPID COMMUNICATIONS IN MASS SPECTROMETRY
Rapid Commun. Mass Spectrom. 2009; 23: 3795–3802
) DOI: 10.1002/rcm.4321
Published online in Wiley InterScience (www.interscience.wiley.comOn-line solid-phase extraction coupled with liquid
chromatography/electrospray ionization mass
spectrometry for the determination of trace tributyltin
and triphenyltin in water samples
Qian Sun1,2,3, Zuliang Chen2,3*, Dongxing Yuan1, Mallavarapu Megharaj2,3 and
Ravendra Naidu2,3
1State Key laboratory of Marine Environmental Science, Environmental Science Research Center, Xiamen University, Xiamen, China, 3610052Centre for Environmental Risk Assessment and Remediation, University of South Australia, Mawson Lakes, SA 5095, Australia3CRC for Contamination Assessment and Remediation of Environment, Mawson Lakes Boulevard, Mawson Lakes, South Australia 5095,
Australia
Received 16 July 2009; Revised 30 September 2009; Accepted 1 October 2009
*CorrespoAssessmeMawsonE-mail: z
On-line solid-phase extraction (SPE) for pre-concentration and sample cleanup is one strategy to
reduce matrix effects and to simultaneously improve detection sensitivity in liquid chromatography/
mass spectrometry (LC/MS). This paper describes an on-line SPE-LC/MS method for the determi-
nation of tributyltin (TBT) and triphenyltin (TPhT) at trace levels in water samples. The direct
coupling of an on-line C18 pre-column to LC/MS was used to pre-concentrate TBT and TPhT at trace
levels from waters and to remove interfering matrix effects. Pre-concentration was followed by
separation of TBT and TPhT on a C18 column using a mobile phase containing 0.1% (v/v) HCOOH/
5mMHCOONH4 and methanol. While both electrospray ionization (ESI) and atmospheric pressure
chemical ionization (APCI) can be interfaced with MS for the detection of TBT and TPhT, ESI-MS
was preferred for this application. The calibration curve for the targetswas linear in the concentration
range 0.1–30mg L�1. The detection limit (signal-to-noise (S/N) ratio¼ 3) was 0.02mgL�1 when 3.0mL
of sample was enriched on the C18 pre-column. The recoveries of TBT and TPhT in spiked waters
were from 81.0 to 101.9%. The reproducibilities for the analysis of the standardmixture (10mgL�1) for
TBT and TPhT were 13.1 and 5.0%, respectively. The developed method was an easy and fast way to
analyze TBT and TPhT in water samples. Copyright # 2009 John Wiley & Sons, Ltd.
In recent years, analytical methods for the environmental
analysis of organotin (OT) species have become necessary
because of the wide use of tributyltin (TBT) and triphenyltin
(TPhT) in anti-fouling paints and pesticides.1 Since TBT and
TPhT are highly toxic and can promote harmful effects on
aquatic organisms even at trace levels,2,3 analytical methods
for TBT and TPhT with high sensitivity, high selectivity and
simple operation are required.
Gas chromatography (GC) is often used for the determi-
nation of OTs4–7 because of its high resolution and the high
detector sensitivity. However, the GC analysis of OTs
requires derivatization prior to detection due to their poor
volatility. Alkylation by means of Grignard reactions from a
pre-extraction eluate or ethylation with NaBEt4 directly from
aqueous solution are the most common derivatization
procedures, but all are tedious and time-consuming.1 As
an alternative, liquid chromatography (LC) methods provide
simple and rapid techniques for the analysis of OTs in
various matrices since the OTs do not require to be
ndence to: Z. L. Chen, Centre for Environmental Risknt and Remediation, University of South Australia,Lakes, SA 5095, [email protected]
derivatized. Hence, LC coupled with various detection
techniques, such as mass spectrometry (MS) or inductively
coupled plasma mass spectrometry (ICP-MS), can be used
for the analysis of OTs at trace levels. Since ICP-MS provides
excellent sensitivity, selectivity, wide linear dynamic range
and the ability to perform isotopic analysis,8 LC/ICP-MS
coupled with various separation modes (ion-exchange,9,10
ion-pairing,11,12 and reversed-phase chromatography13,14)
has been used for the speciation of OTs. However,
the hyphenation of LC with ICP-MS is limited because the
organic-based mobile phase in LC is often not compatible
with the plasma source. For example, a high concentration of
organic solvents in the mobile phase results in poor plasma
stability and may even cause the plasma to be extinguished.
In addition, carbon deposits may form on the sampler and
the skimmer cones within the ICP-MS interface region, which
contributes to high noise and reduced signal intensities.1
Furthermore, it is often necessary to confirm the OT species
at trace level in real samples, as ICP-MS is only an element-
specific detector and it cannot provide the inherent
information required to characterize or confirm specific
OT species. However, these issues can be solved by using
LC/MS, which provides molecular information to confirm
Copyright # 2009 John Wiley & Sons, Ltd.

3796 Q. Sun et al.
OT species in addition to a quantitative response. Thus
LC/MS is an attractive technique for the analysis of trace
components in complex matrices.15 Generally, both electro-
spray ionization (ESI) and atmospheric pressure chemical
ionization (APCI) can be interfaced successfully with MS
to detect OTs, where OT compounds follow the same
fragmentation pattern, which is characterized by the
progressive loss of the organic groups bound to the Sn.1
Determination of butyl- and phenyltin in a certified reference
sediment material using LC/APCI-MS has been reported.16
Similarly, LC/APCI-MS was used to determine TBT and
4-hydroxybutyldibutyltin (OHBuDBT) in seawater with
detection limits of 35 and 26mg L�1, respectively.17 Positive
ion LC-/ESI-MS was used to determine TBT and TPhT in
seawater, and off-line SPE was used to improve the detection
limit to the low ng L�1 level and to reduce matrix effects.18
Recently, LC/ESI tandem mass spectrometry (MS/MS) was
used for the identification and quantification of OTs by using
the high selectivity and sensitivity of the multiple reaction
monitoring (MRM) mode, achieving good accuracy and
detection limits of approximately 1 pg for TBT.19 These LC/
MS methods are useful, but LC/MS has rarely been applied
to environmental OT analysis because of its poor detection
limits and because matrix effects lead to mass signal stability.1
Several different sample preparation methods have been
reported for TBT and TPhT. Solid-phase microextraction
(SPME),20 headspace single-drop,21 liquid-phase microex-
traction,22 headspace solid-phase extraction,23,24 and liquid-
liquid extraction25 have all been successfully used for sample
preparation and analysis by GC-based methods. For LC-
based methods, accelerated solvent extraction (ASE),26,27
microwave-assisted extraction (MAE),27 and solid-phase
extraction (SPE)18,28,29 have also been successfully used for
sample preparation for TBT and TPhT. Of these techniques,
SPE has the advantage of not only achieving OT enrichment,
but also cleaning up interferences,18 thus improving detec-
tion sensitivity and reducing any matrix effects in LC/MS.30
Using an off-line SPE approach, cation-exchange SPE29
and C18 SPE18 have been applied to extract OTs from
seawater, resulting in good recoveries and high sensitivities
with low ng L�1 detection limits. However, these methods
can be time-consuming, cumbersome to perform, and only a
small part of the extract is injected.30 In contrast, on-line SPE
has higher sample throughput, allows faster analysis, and
can achieve automation of all parts of the analytical method,
including sample preparation.30 Despite these advantages, to
date only one study has reported the use of on-line SPE for
the pre-concentration of OTs, followed by HPLC with post-
column derivatization and fluorimetric detection.31
In this study, an on-line SPE method was developed for the
pre-concentration of TBT and TPhT at trace level and cleanup
of interferences, followed by LC/MS for the separation and
detection of TBT and TPhT. To achieve method optimization:
(1) the conditions for on-line SPE, such as sample pH and
injection volume, were evaluated; (2) the conditions for the
separation and detection, including the mobile phases, the
ionization mode and the operation parameters, were
investigated; and (3) the proposed method was demon-
strated for the determination of TBT and TPhT in spiked
contaminated lake waters and seawaters.
Copyright # 2009 John Wiley & Sons, Ltd.
EXPERIMENTAL
ChemicalsAll chemicals, including tributyltin chloride and triphenyltin
chloride, were analytical grade reagents (Sigma-Aldrich Pty.
Ltd, Castle Hill, NSW, Australia). The mixed standard was
prepared daily from a 2000mg mL�1 stock solution. Milli-Q
water (Milli-Q plus system, Millipore, Bedford, MA, USA),
with a specific resistance of 18.2 MV cm�1, was used to
prepare all solutions. The mobile phases used in LC/MS
were prepared by dissolution of the appropriate amounts of
acetic acid (HAc) and ammonium acetate (NH4Ac) or formic
acid (HFc) and ammonium formate (NH4Fc), and methanol
in Milli-Q water. The mobile phases were filtered through a
disposable 0.45mm cellulose acetate membrane filter (Milli-
pore) and degassed in an ultrasonic bath prior to use.
Water samples were collected in pre-cleaned 250 mL glass
bottles from Mawson Lakes (freshwater) and Glenelg beach
(seawater), South Australia, and stored at 48C immediately
after sampling. Prior to analysis, water samples were filtered
using 0.45mm pore size, mixed cellulose membranes
(Millipore) and acidified to pH 2.7 with HFc solution to
achieve compatibility with the initial mobile phase con-
ditions. Analysis was carried out within 24 h after sampling
to avoid adding chemical preservatives and to minimize
potential degradation and transformation of the analytes. All
samples were tested in triplicate.
InstrumentAn Agilent 1100 sample pre-concentration system (Agilent
Technologies, Palo Alto, CA, USA), consisting of a
quaternary pump, an on-line degasser, an autosampler
and a six-port switch valve was used. Agilent C18 cartridges
(2.1 mm� 20 mm, 3.5mm) were employed for on-line SPE. A
schematic diagram of the on-line SPE sample enrichment
system coupled to LC for the determination of the trace OTs
in water is shown in Fig. 1. A filtered sample (3.0 mL) was
injected by the G2258A dual loop autosampler at 10 mL
min�1. For loading (Fig. 1, position A), pump A (the on-line
SPE pump) delivered the eluent (0.1% HCOOH in Milli-Q
water) through the SPE cartridge for 1.5 min at a flow rate of
2.5 mL min�1 after sample injection. The flow rate was
subsequently decreased to 0.8 mL min�1 over a period of 30 s,
in preparation for the SPE cartridge being switched in-line
with the LC pump (pump B), where the flow rate was 0.8 mL
min�1. The six-port valve was then switched to the inject
position (Fig. 1, position B) at 2.0 min. While in the inject
position, pump B delivered LC buffers to elute the analytes
and transfer them to the separation column, while pump A
pumped to waste. The valve was switched back to the
loading position at 22.0 min to clean the SPE cartridge using
pump A to deliver 100% methanol for 3 min and then to
purge the cartridge with 0.1% HFc in Milli-Q water in
preparation for the next sample.
The separation of TBT and TPhT was performed on
reversed-phase columns (Zorbax, XDB-C18, 150 mm� 3.0 mm
i.d., 5mm, Agilent). The samples were injected using an 1100
autosampler with an injection volume of 20mL. The mobile
phase flow rate was 0.8 mL min�1 and the column
temperature was 308C. The mobile phases used in this study
Rapid Commun. Mass Spectrom. 2009; 23: 3795–3802
DOI: 10.1002/rcm

Figure 1. Schematic diagram for on-line SPE-HPLC/MSD:
(A) loading position and (B) injection position
Determination of trace tributyltin and triphenyltin in water 3797
were: mobile phase A, 0.1% HFc, 5 mM NH4Fc in
10:90 MeOH/H2O (v/v); mobile phase B, 0.1% HFc, 5 mM
NH4Fc in 90:10 MeOH/H2O (v/v). ESI and APCI were tested
in both positive and negative ion modes. The operating
parameters for both ESI and APCI are shown in Table 1. Data
were collected using full scans mode (m/z 100–500). The
Agilent Chemstation software package was used to control
the on-line SPE-LC/MS system and to process data.
RESULTS AND DISCUSSION
Separation of TBT and TPhTTwo different water/methanol mobile phases, one contain-
ing 0.1% (v/v) HFc, 5 mM NH4Fc, and another containing
0.1% (v/v) HAc, 5 mM NH4Ac, were compared for the
separation of TBT and TPhT by directly injecting 20mL of a
5 mg L�1 mixed standard. Initial results showed that the TBT
and TPhT could be separated well using both mobile phases
by gradient elution (Fig. 2), where water/methanol (10:90,
v/v) was changed to water/methanol (90:10, v/v) over
5 min, and these concentrations were maintained for 20 min.
The use of 0.1% (v/v) HFc, 5 mM NH4Fc, where the higher
concentration of HFc overcomes the problems of absorption
to the column, leads to better peak shape. Both TBT and TPhT
Table 1. Operating parameters for ESI and APCI
ESI APCI
Drying gas flow rate (L min�1) 12 5.0Nebulizer gas pressure (psi) 35 60Drying gas temperature (8C) 350 350Vaporizer temperature (8C) 325 325Capillary voltage (V) �4000 �4000Corona current (mA) / 15Fragmentor voltage (V) 70 90
Copyright # 2009 John Wiley & Sons, Ltd.
are present as cations in acidic solutions,32 and these cationic
species are more easily eluted from a reversed-phase column.
In addition, higher signal intensity was observed using 0.1%
(v/v) HFc, 5 mM NH4Fc, mainly because of the formation of
formic adducts, such as [Mþ2Fc]�. Hence, 0.1% (v/v) HFc,
5 mM NH4Fc was chosen as the mobile phase for the
remainder of the experiments in this study.
Optimization of API-MS parametersAPCI and ESI were compared as the ionization source in both
positive and negative ion modes. The degree of fragmenta-
tion and formation of adducts was greatly affected by the
choice of APCI or ESI interface and the polarity (Table 2). It
should be noted that the assignment of the weaker ions in all
these spectra can only be tentative because they all contain
the characteristic tin clusters, based the ten tin stable isotopes,
of which 120Sn (32.58%), 118Sn (24.22%), 116Sn (14.54%), 119Sn
(8.59%) and 117Sn (7.68%) are the most prominent. The ions
cited below are all based on the 120Sn isotope.
TBT and TPhT yield similar ESI and APCI spectra in the
negative ionization (NI) mode, characterized by strong
signals for [TBTþ2Fc]� at m/z 381.1 and [TPhTþ2Fc]� at m/z
441.0. In addition, weak signals for [TPhT]� at m/z 351.0 and
[TPhTþClþFc]� at m/z 431.0 were observed, while another
weak signal at m/z 371.0 which we tentatively assign to
[TBTþClþFc]� was observed for TBT using the APCI
interface.
In comparison, as shown in Table 2, more ions were
observed from these OTs in the positive ionization (PI) mode
than in the NI mode. For example, in both ESI and APCI, TBT
shows the most prominent ion [TBT]þ at m/z 291.1, accom-
panied by fragment ions corresponding to the loss of one or
two butene groups, [TBT–C4H8]þ at m/z 235.0 and [TBT–
2�C4H8]þ at m/z 179.0, as well as ions that we assign as the
formate, methanol and ammonia adducts, [TBTþHFcþFc]þ
atm/z 382.2, [TBTþMeOH]þ atm/z 323.1, and [TBTþNH3]þ at
m/z 308.1. In the TPhT spectrum, the most abundant ion was
[TPhT]þ at m/z 351.0. Methanol and ammonia adducts,
[TPhTþMeOH]þ at m/z 383.1 and [TPhTþNH3]þ at m/z 368.1,
were also observed. ESI also showed ions at m/z 442.1, 428.1
and 419.0, corresponding to [TPhTþHFcþFc]þ, [TPhTþMeOHþFc]þ and possibly [TPhTþNaþFc]þ, respectively. Similar
ions for TBT and TPhT were observed using LC/APCI-MS
for the analysis of organotin compounds.13
Higher signal intensities for TBT and TPhT were obtained
in the NI mode when either APCI or ESI was interfaced with
the mass spectrometer (Fig. 3). For example, with ESI the
signal intensity for TBT and TPhT in the NI mode was 12.7
and 4.2 times, respectively, more than that obtained in the PI
mode. Thus, the NI mode was chosen for the remaining
studies. ESI was also more sensitive than APCI. The signal
intensities for TBT and TPhT were 8.4 and 5.9 times higher in
ESI than in APCI.
On-line SPE-LC coupled with ESI and APCI-MS was
evaluated for the quantification of tin species by determining
standard calibrations in the ranges 0.1–30mg L�1. The slope
of the calibration curve from ESI was 14.5 and 6.5 times
greater than from APCI for TBT and TPhT, respectively. ESI-
MS in the NI mode gave the highest signal intensity and
Rapid Commun. Mass Spectrom. 2009; 23: 3795–3802
DOI: 10.1002/rcm

min2.5 5 7.5 10 12.5 15 17.5 20 22.5
0
10000
20000
30000
40000
50000
60000
70000
80000
MSD1 469, EIC=468.7:469.7 (C:\HPCHEM\1\DATA\080819SN\H3.D) APCI, Neg, Scan, Frag: 90
TPhT
min2.5 5 7.5 10 12.5 15 17.5 20 22.5
0
5000
10000
15000
20000
25000
30000
35000
40000
45000
MSD1 409, EIC=408.7:409.7 (C:\HPCHEM\1\DATA\080819SN\H3.D) APCI, Neg, Scan, Frag: 90
TBT
min2.5 5 7.5 10 12.5 15 17.5 20 22.5
0
20000
40000
60000
80000
100000
MSD1 441, EIC=440.7:441.7 (C:\HPCHEM\1\DATA\080819SN\H2.D) APCI, Neg, Scan, Frag: 90
TPhT
min2.5 5 7.5 10 12.5 15 17.5 20 22.5
0
10000
20000
30000
40000
50000
60000
MSD1 381, EIC=380.7:381.7 (C:\HPCHEM\1\DATA\080819SN\H2.D) APCI, Neg, Scan, Frag: 90
TBT
(A)
(B)
Figure 2. Separation of TBTand TPhTusing different mobile phases by LC/APCI-MS. The separation was
achieved on a XDBC18 reversed-phase columnwith a gradient from 10%B to 90%B in 5min, maintained at
90% B for 20min. The mobile phase for (A) is mobile phase A, 0.1% HAc, 5mM NH4Ac in 10:90MeOH/
H2O (v/v); mobile phase B, 0.1% HAc, 5mM NH4Ac in 90:10MeOH/H2O (v/v); The mobile phase for (B) is
mobile phase A, 0.1% HFc, 5mM NH4Fc in 10:90MeOH/H2O (v/v); mobile phase B, 0.1% HFc, 5mM
NH4Fc in 90:10MeOH/H2O (v/v). The operating parameters for APCI were capillary voltage: �4000V,
corona current: 15mA, fragmentor voltage: 90V, dryin gas flow rate: 5.0 L min�1, nebulizer pressure: 60 psi,
drying gas temperature: 3508C, and vaporizer temperature: 3258C.
3798 Q. Sun et al.
strong signals for [TBTþ2Fc]� at m/z 381.1 and [TPhTþ2Fc]�
at m/z 441.0 and was subsequently used in the following
study.
The applied cone voltage and capillary voltage are usually
the most significant parameters affecting the enhancement or
inhibition of fragmentation, so these parameters were
initially adjusted to give optimized signal intensities.13 The
Copyright # 2009 John Wiley & Sons, Ltd.
effect of applied cone voltage on the signal intensity of TBT
and TPhT was investigated in the range 50–130 V. The signals
for both TBT and TPhT reached their highest intensity at
70 V. As the applied cone voltage increased, the analytes
fragmentation increased, and characteristic fragment ions
were observed. The effect of the capillary voltage on the
signal intensity was examined in the range 2500–4500 kV.
Rapid Commun. Mass Spectrom. 2009; 23: 3795–3802
DOI: 10.1002/rcm

Table 2. Assignment� of ions detected for TBT and TPhT from ESI and APCI in negative and positive ionization modes
Positive Negative
ESI APCI ESI APCI
ion m/z % ion m/z % ion m/z % ion m/z %
TBT [TBT]þ 291.1 100 [TBT]þ 291.1 100 [TBTþ2Fc]� 381.1 100 [TBTþ2Fc]� 381.1 100[TBTþHFcþFc]þ 382.2 29 [TBTþNH3]þ 308.1 42 [TBTþClþFc]� 371.0 6[TBT-Butene]þ 235.0 18 [TBTþMeOH]þ 323.1 35[TBTþMeOH]þ 323.2 11 [TBT-Butene]þ 235.0 18
[TBT-2xButene]þ 179.0 14 [TBT–2�butene]þ 179.0 14TPhT [TPhT]þ 351.0 100 [TPhT]þ 351.0 100 [TPhTþ2Fc]� 441.0 100 [TPhTþ2Fc]� 441.0 100
[TPhTþHFcþFc]þ 442.1 59 [TPhTþMeOH]þ 383.0 88 [TPhT]� 351.0 6 [TPhTþClþFc]� 431.0 4[TPhTþMeOH]þ 383.1 41 [TPhTþNH3]þ 368.0 30 [TPhTþClþFc]� 431.0 4 [TPhT]� 351.0 3[TPhTþNH3]þ 368.1 14
[TPhTþMeOHþFc]þ 428.1 14[TPhTþNaþFc]þ 419.0 11
� Assignment of some of the weaker ions is only tentative.
Figure 3. Relative abundances of the most abundant ions of
TBTand TPhT in different ionizationmodes at a concentration
of 5.0mg L�1. The mobile phase contained 0.1% HFc, 5mM
NH4Fc in methanol and Milli-Q water solution. The operating
parameters for ESI and APCI were the same as in Table 1.
Determination of trace tributyltin and triphenyltin in water 3799
However, the signal intensity was not significantly affected
by the capillary voltage, and 4000 V was chosen as the
optimal value.
One of the major issues in ESI-MS for quantitative analysis
is matrix effects since the ESI source is highly susceptible to
other components present in the matrix, which may result in
signal suppression or enhancement, leading to erroneous
results.33,34 On-line SPE sample cleanup and chromato-
graphic separation is one of the preferred strategies to reduce
matrix effects.34 In this work, matrix effects were evaluated
because of the widely reported issues of MS signal
suppression or enhancement effects when complex matrices
are analyzed.35 The MS response obtained from standard
Table 3. Characteristics for TBT and TPhT determined using the
Analytes Calibration range (mg L�1) Regression equation
TBT 0.1–30 y¼ 92912xþ 8031.2TPhT 0.1–30 y¼ 72575xþ 55856
a Injection of a 10mg L�1 mixed standard (n¼ 4).
Copyright # 2009 John Wiley & Sons, Ltd.
solutions prepared in Milli-Q water was compared with
those measured in spiked (10mg L�1) lake surface waters,
where both standard solutions and samples were introduced
to the on-line SPE system for sample pre-concentration and
cleanup, LC separation and ESI-MS detection. The results
showed that the abundances of TBT and TPhT were
7.30� 105 and 8.95� 105, respectively, using spiked lake
water (10mg L�1), while abundances of 9.02� 105 and
9.17� 105 were obtained using Milli-Q standards. The
response from lake water for TBT and TPhT was reduced
to 80.95% and 97.70%, respectively, compared with that
using Milli-Q water. This clearly showed that signal
suppression occurred when lake waters were used as the
sample matrix. This effect was mainly attributed to the
relative high total organic carbon (TOC) in lake water
(37.77 mg L�1), since organic compounds can be transferred
to the ESI-MS system together with the analytes, and cause
matrix effects and signal suppression. However, use of on-
line SPE reduced the matrix effect and the suppressions to
below 20% and therefore on-line SPE was essential and
effective for the detection of TBT and TPhT. Further
avoidance of any matrix effects in the quantification of these
species was achieved by using standard addition calibration
in the following study.36
Optimization of the on-line SPE conditionsIn the development of any on-line SPE procedure,
parameters such as pH and injection volume can affect the
extraction efficiency and need to be optimized. In this
study, C18 pre-columns were used for the on-line enrichment
of trace levels of TBT and TPhT (3.0 mL of standard solution
containing 30mg L�1) because they are non-selective
materials.18 The results indicated that C18 pre-columns can
proposed method
s R2 Detection limits (mg L�1) RSD (%)a
0.9918 0.02 13.080.9873 0.02 5.02
Rapid Commun. Mass Spectrom. 2009; 23: 3795–3802
DOI: 10.1002/rcm
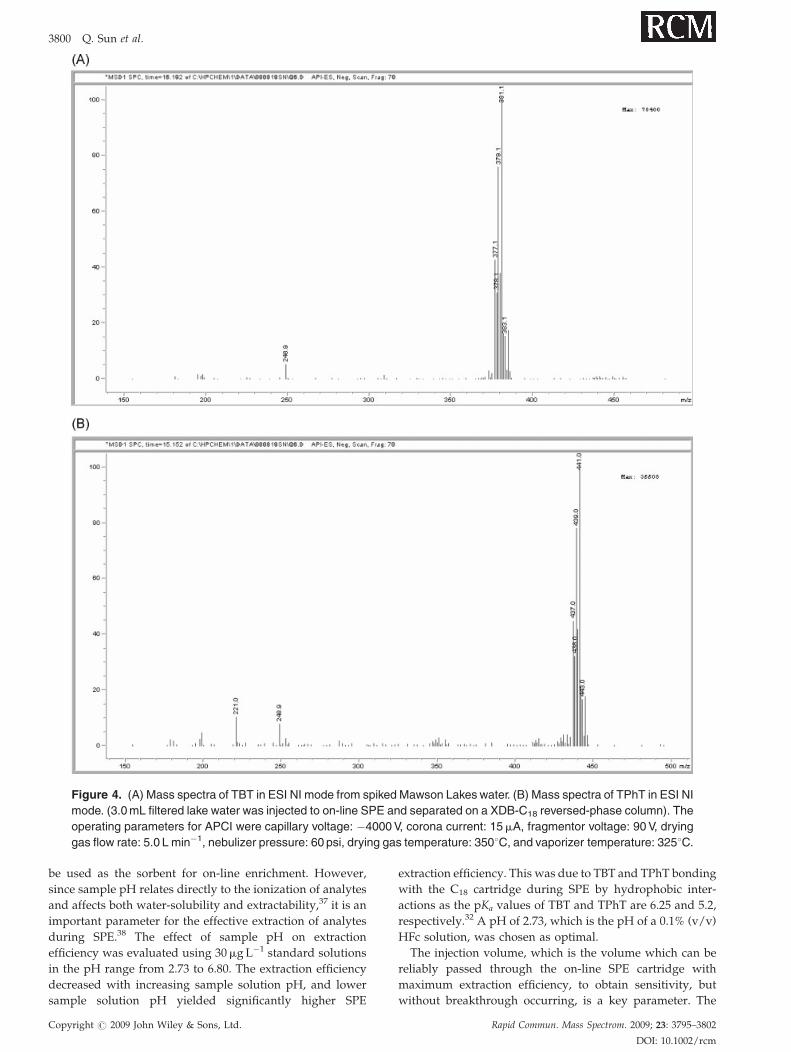
Figure 4. (A) Mass spectra of TBT in ESI NI mode from spiked Mawson Lakes water. (B) Mass spectra of TPhT in ESI NI
mode. (3.0mL filtered lake water was injected to on-line SPE and separated on a XDB-C18 reversed-phase column). The
operating parameters for APCI were capillary voltage: �4000V, corona current: 15mA, fragmentor voltage: 90V, drying
gas flow rate: 5.0 L min�1, nebulizer pressure: 60 psi, drying gas temperature: 3508C, and vaporizer temperature: 3258C.
3800 Q. Sun et al.
be used as the sorbent for on-line enrichment. However,
since sample pH relates directly to the ionization of analytes
and affects both water-solubility and extractability,37 it is an
important parameter for the effective extraction of analytes
during SPE.38 The effect of sample pH on extraction
efficiency was evaluated using 30mg L�1 standard solutions
in the pH range from 2.73 to 6.80. The extraction efficiency
decreased with increasing sample solution pH, and lower
sample solution pH yielded significantly higher SPE
Copyright # 2009 John Wiley & Sons, Ltd.
extraction efficiency. This was due to TBT and TPhT bonding
with the C18 cartridge during SPE by hydrophobic inter-
actions as the pKa values of TBT and TPhT are 6.25 and 5.2,
respectively.32 A pH of 2.73, which is the pH of a 0.1% (v/v)
HFc solution, was chosen as optimal.
The injection volume, which is the volume which can be
reliably passed through the on-line SPE cartridge with
maximum extraction efficiency, to obtain sensitivity, but
without breakthrough occurring, is a key parameter. The
Rapid Commun. Mass Spectrom. 2009; 23: 3795–3802
DOI: 10.1002/rcm

Table 4. Characteristics for TBT and TPhT determined in lake water and seawater
SamplesVolume
(mL)Initial concentration
(mg L�1)Spiked concentration
(mg L�1) nTBT recovery
(%)TPhT recovery
(%)
lake water 3000 n.d. 10 3 81.0� 6.8 97.7� 3.8seawater 3000 n.d. 10 3 91.5� 2.1 101.9� 2.0
n.d.: not detected.
Determination of trace tributyltin and triphenyltin in water 3801
effect of injection volume on sensitivity was investigated by
injecting a range of volumes (2.0–5.0 mL) of 30mg L�1
standard solutions (the highest concentration of the cali-
bration) at an injection speed of 10 mL min�1. The results
showed that the injection volume significantly affected the
sensitivity of the method. The signals for both TBT and TPhT
greatly increased as the injection volume increased from 2.0
to 3.0 mL, and slightly increased as the injection volume
increased from 3.0 mL to 4.0 mL, decreasing when 5.0 mL
was injected. As TBT and TPhT easily form cations in water,
the OTs that initially bonded to the SPE sorbent can be eluted
by later sample solution. In addition, an increased injection
volume can also increase matrix effects. The optimal injection
volume was therefore 3.0 mL.
The injection speed and the delivery speed can potentially
also affect sensitivity. The injection speed is the rate at which
the plunger ejects sample from the metering device, while the
delivery speed is the rate at which the on-line SPE pump
delivers the mobile phase. The effects of both injection speed
and on-line SPE deliver speed on sensitivity were tested by
injecting 3.0 mL of 30mg L�1 standard solutions at a range
of 1.0–10.0 mL min�1 and 0.8–2.5 mL min�1, respectively.
Neither of these parameters significantly affected the
sensitivity of the method. Thus, the default injection speed
of 10 mL min�1 and the highest on-line SPE delivery speed of
2.5 mL min�1 were chosen.
Using the optimal conditions, the targets were eluted
directly by an LC mobile phase using a 20 min gradient
elution program. At the same time, the SPE cartridge was
cleaned by methanol and conditioned for the next sample.
The proposed method can achieve pre-concentration,
separation and simultaneous detection of TBT and TPhT
in 25 min without sample pretreatment.
Analytical performance and analysis ofreal samplesThe analytical performance characteristics of the proposed
method are summarized in Table 3. For quantification,
standard addition was used by adding five known standard
solutions in the range 0.1 to 30mg L�1 to the unknown
samples. Calibration curves for quantification were obtained
by plotting peak area versus the concentration of the
corresponding target species. All calibrations were linear
over a concentration range 0.1–30mg L�1 with correlation
coefficients greater than 0.987. The detection limits of both
TBT and TPhT were 0.02mg L�1. The reproducibility (n¼ 4),
from injection of a 10mg L�1 standard solution, showed that
the relative standard deviations (RSDs) were 13.08 and 5.02
for TBT and TPhT, respectively. These results demonstrated
good accuracy and precision.
The proposed method was applied to the detection of the
TBT and TPhT in the water samples, including lake water
Copyright # 2009 John Wiley & Sons, Ltd.
(LW) and seawater (SW), which were analyzed in triplicate.
However, no TBT and TPhT were detected in these samples,
indicating there was either no TBT or TPhT in theses samples,
or that the concentrations of TBT or TPhT were below the
detection limits of the method. To validate the method, both
lake water and seawater were spiked with 10mg L�1 TBT and
TPhT, and shaken in an end-over-end shaker for 24 h. The
recoveries of TBT and TPhT for seawater were 91.5% and
101.9%, and for lake water were 81.0% and 97.7%,
respectively (Table 4). The ESI-MS spectra (Figs. 4(A)
and 4(B)) confirmed the presence of TBT and TPhT in the
samples. Characteristic clusters that included the ten tin
stable isotopes were obtained.
Compared with other reported techniques, the developed
method is simpler to perform since no sample pre-treatment
is needed, and has higher sample throughput which reduces
the required sample volume. The detection limits are in the
range of reported LODs for triorganotin analysis by LC/MS,
which were 35mg L�1 for TBT by pre-concentration from
5 mL seawater using liquid-liquid extraction,17 0.016mg L�1
and 0.008mg L�1 for TBT and TPhT, respectively, by pre-
concentration from 250 mL seawater using off-line SPE18
compared with 0.02mg L�1 for TBT and TPhT obtained using
the proposed method when a 3.0 mL sample was enriched on
a C18 pre-column.
CONCLUSIONS
In this study, on-line SPE-LC/ESI-MS provided a rapid and
sensitive method for the analysis of TBT and TPhT in water
samples. On-line SPE was successfully used for sample
cleanup and pre-concentration of TBT and TPhT at trace
levels to reduce matrix effects and improve detection
sensitivity, and ESI-MS was used for the identification of
TBT and TPhT at trace levels in complex samples. A mobile
phase containing 0.1% HFc and 5 mM NH4Fc was suitable for
both LC separation and MS ionization. ESI and APCI, in both
PI and NI modes, were compared to improve the sensitivity
and specificity, with ESI in the NI mode showing the best
response. Under optimized conditions, detection limits for
both TBT and TPhT were 0.02mg L�1. The proposed method
was demonstrated by speciation of TBT and TPhT at trace
levels in spiked freshwater and seawater samples.
AcknowledgementsQian Sun gratefully acknowledges the State Scholarship
Fund of China for sponsoring the study in Australia as a
joint PhD candidate and the Centre for Environmental Risk
Assessment and Remediation for proving access to labora-
tory facilities. We thank Dr Catherine Dandie and Dr Gary
Owens for editing the manuscript.
Rapid Commun. Mass Spectrom. 2009; 23: 3795–3802
DOI: 10.1002/rcm

3802 Q. Sun et al.
REFERENCES
1. Gonzalez-Toledo E, Compano R, Granados M, Prat MD.Trac-Trend. Anal. Chem. 2003; 22: 26.
2. Fent K. Crit. Rev. Toxicol. 1996; 26: 1.3. Antizar-Ladislao B. Environ. Int. 2008; 34: 292.4. Carlier-Pinasseau C, Astruc A, Lespes G, Astruc M.
J. Chromatogr. A 1996; 750: 317.5. De Smaele T, Moens L, Dams R, Samdra P, Van der Eycken J,
Vandyck J. J. Chromatogr. A 1998; 793: 99.6. Tao H, Rajendran RB, Quetel CR, Nakazeto T, Tominaga M,
Miyazaki A. Anal. Chem. 1999; 71: 4208.7. Uveges M, Abranko L, Fodor P. Talanta 2007; 73: 490.8. Montes-Bayon M, DeNicola K, Causo JA. J. Chromatogr. A
2003; 1000: 457.9. Yang L, Lam JWH. J. Anal. At. Spectrom. 2001; 16: 724.
10. Garcia-Alonso JI, Sanz-Medel A, Ebdon L. Anal. Chim. Acta1993; 283: 261.
11. Vela NP, Caruso JA. J. Anal. At. Spectrom. 1996; 11: 1129.12. Yang HJ, Jiang SJ, Yang YJ, Hwang C. Anal. Chim. Acta 1995;
312: 141.13. White S, Catterick T, Fairman B, Webb K. J. Chromatogr. A
1998; 794: 211.14. Chiron S, Roy S, Cottier R, Jeanot R. J. Chromatogr. A 2000;
879: 137.15. Rosen AL, Hieftje GM. Spectrochim. Acta B 2004; 59: 135.16. Rosenberg E, Kmetov V, Grasserbauer M. Fresenius J. Anal.
Chem. 2000; 366: 400.17. Bekri K, Saint-Louis R, Pelletier E.Anal. Chim. Acta 2006; 578: 203.18. Gonzalez-Toledo E, Compano R, Prat MD, Granados M.
J. Chromatogr. A 2002; 946: 1.19. Banoub JH, Miller-Banoub J, Sheppard GV, Hodder HJ.
Spectroscopy 2004; 18: 95.20. Bancon-Montigny C, Maxwell P, Yang L, Mester Z, Sturgeon
RE. Anal. Chem. 2002; 74: 5606.
Copyright # 2009 John Wiley & Sons, Ltd.
21. Colombini V, Bancon-Montigny C, Yang L, Maxwell P,Sturgeon RE, Mester Z. Talanta 2004; 63: 555.
22. Shioji H, Tsunoi S, Harino H, Tanaka M. J. Chromatogr. A2004; 1048: 81.
23. Liu JY, Jiang GB. J. Agric. Food Chem. 2002; 50: 6683.24. Vidal JL, Vega AB, Arrebola FJ, Gonzalez-Rodriguez MJ, Sanchez
MC, Frenich AG. Rapid Commun. Mass Spectrom. 2003; 17:2099.
25. Zachariadis GA, Rosenberg E. J. Chromatogr. B Analyt. Tech-nol. Biomed. Life Sci. 2009; 877: 1140.
26. Wahlen R, Catterick T. Rapid Commun. Mass Spectrom. 2004;18: 211.
27. Wahlen R, Catterick T. J. Chromatogr. B Analyt. Technol.Biomed. Life Sci. 2003; 783: 221.
28. Jones-Lepp TL, Varner KE, Heggem D. Arch. Environ. Con-tam. Toxicol. 2004; 46: 90.
29. Ide K, Kohri M, Sato K, Inoue Y, Okochi H. Bunseki Kagaku1999; 48: 245.
30. Rodriguez-Mozaz S, Lopez de Alda MJ, Barcelo D.J. Chromatogr. A 2007; 1152: 97.
31. Gonzalez-Toledo E, Ortuno A, Compano R, Granados M,Prat M. Chromatographia 2002; 55: 19.
32. Arnold CG, Weidenhaupt A, David MM, Muller SR, Hader-lein SB, Schwarzenbach RP. Environ. Sci. Technol. 1997; 31:2596.
33. Zwiener C, Frimmel FH. Anal. Bioanal. Chem. 2004; 378:862.
34. Reemtsa T. J. Chromatogr. A 2003; 1000: 477.35. Antignac JP, de Wasch K, Monteau F, de Brabander H,
Andre F, le Bizec B. Anal. Chim. Acta 2005; 529: 129.36. Reemtsa T. Trac-Trend. Anal. Chem. 2001; 20: 533.37. Monteil-Rivera F, Beaulieu C, Deshamps S, Paquet L,
Hawari J. J. Chromatogr. A 2004; 1048: 213.38. Wang S, Huang W, Fang GZ, He JX, Zhang Y. Anal. Chim.
Acta 2008; 606: 194.
Rapid Commun. Mass Spectrom. 2009; 23: 3795–3802
DOI: 10.1002/rcm


![Original Research Development of an Analytical Method for … · 2017-09-26 · compounds are of growing public concern [2, 3]. Organotin compounds such as tributyltin (TBT) and triphenyltin](https://img.pdfslide.us/doc/110x75/5ea44543272432627b4cc532/original-research-development-of-an-analytical-method-for-2017-09-26-compounds.jpg)