Embed Size (px)
Citation preview
ON-LINE MEASURE~ENT OF THE PVT PROPERTIES OF POLYMERICO~ SOLUTIONS USING A GEAR PUMP
Simon S. Park
A thesis submitted in conformity with the requirements for the Masters of Applied Science
Department of Mechanical and Industrial Engineering University of Toronto
@Copyright by S. S. Park 1999
National Library Bibliothèque nationale du Canada
Acquisitions and Acquisitions et Bibliographie Services services bibliographiques
395 Wellington Srreet 395. nie Welington OttawaON K l A W OaawaON K l A W canada canada
The author has granted a non- exclusive Licence aiiowing the National Library of Canada to reproduce, loan, dism%ute or seU copies of this thesis in microfonn, paper or electronic formats.
The author retains ownership of the copyright in this thesis. Neither the thesis nor substantial extracts fiom it may be printed or otherwise reproduced without the author's permission.
L'auteur a accordé une licence non exclusive permettant à la Bibliothèque nationale du Canada de reproduire, prêter, distribuer ou vendre des copies de cette thèse sous la forme de microfiche/film, de reproduction sur papier ou sur fonnat électronique.
L'auteur conserve la propriété du droit d'auteur qui protège cette thèse. Ni la thèse ni des extraits substantiels de celle-ci ne doivent être imprimés ou autrement reproduits sans son autorisation.
ON-LINE MEMUREMENT OF THE PVT PROPERTIES OF POLYMER~CO~ SOLUTIONS USING A GEAR PUMP
Simon S. Park Degree of Masters of Applied Science, 1999
Department of Mechanical and Industrial Engineering University of Toronto
This study presents an innovative dilatometer that can accurately measure the
pressure-volume-temperature (PVT) properties of polyrner/C02 solutions. The density
(or equivalently, the specific volume) of a polymer/C02 solution is detemined by
measuring the mass and volume flow rates of the solution. A positive-displacement gear
pump mounted on an extruder is used to measure the volume flow rate of the solution.
The positive-displacement volume of the gear pump was determined in calibration
experiments with water and oil with the aid of a syringe pump. The gear pump was
mounted on a tandem extrusion line. The temperature of melt was precisely controlled
and homogenized by using the second extruder and a heat exchanger, which included a
static mixer. The pressure was controlled by the rotational speed of the screw in the
second extruder. In order to reduce leakage across the gear pump, the difference between
the upstrearn and downstrearn pressures was minimized using a variable resistance die
attached to the downstream outlet of the gear pump. A critical set of experiments was
carried out to measure the specific volumes of various pure polymers. The measured
results were compatible with the known PVT data, confirming the validity of the system.
The experirnental data were modeled using the equation-of-state @OS) to predict the
relationships above the experimental ranges. Finaily, the system was used to rneasure the
specific volumes of various polyrner/C02 solutions. A rnetered amount of gas was
injected into the polymer melt Stream in the first extruder and the injected gas was
cornpletely dissolved in the melt in the second extruder of the tandem foam extrusion
Iine. The forrned single-phase polymer/C02 solution was forwarded to the gear pump,
and its specific volume was measured by comparing the volume and m a s flow rates.
The sweiling of the polymer melt due to the dissolved CO2 was characterized as a
function of CO2 concentration, temperature, and pressure. Efforts were made to rnodel
the experirnental results.
First I wouid like to express my sincere gratitude to rny supervisor Professor C. B.
Park for providing guidance and encouragement throughout rny research. 1 will never
forget the help he gave at my most difficult times.
My gratitude is extended to the Department of Mechanical and industriai
Engineering at the University of Toronto for providing the University of Toronto
Master's Open Fellowships, as well as, the NSERC Scholarship. These financial
assistance enabled me to finish my studies.
1 would also like to thank my colieagues in the Microcellular Plastics
Manufacturing Laboratory for their help and friendship over the past two years. They
include Dr. Yuejian Liu, Anthony Yeung, Amir Behravesh, Ghaus Rizvi, Remon Pop-
niev, Deepak Fernandes, Hani Naguib, Dmitry h d i n , Dr. Chns Song, Dr. Sang Mae Lee.
Minhee Lee, and Haiou Zhang. Especially, sincere gratitude goes to Hani and Drnitry
who shared common thoughts. We shared a great time together and 1 learned a lot about
Jewish and E,vtian cultures. 1 also would like to thank many friends, Junghyun, Jihyun,
Heedo, NamSuk, Kooyong, and church friends,
Abstract ...,.......-...-....--........-.....~............~....~~~~.~~..~-.~~-..-----...-.......................... tr
Acknowledgernents.. -.-. . . . . . . . . . . . . . . . . . . . . . . . . . . . . . . . .. . . . . . . . . . . . . . . -. . . . - . . . . . . - - -. . . -. -. . . . . . . - . . . . . . . . . . . . . . v
Table of Contents .................................................................................................... vi
List of Figures.,. .. ... ....--. . . . . . . . . . .. .. . .--. -.-. . .. -.-........-.--- .. .---.--. . . .. . ... .. .-.+ ... . . . . . . . .. . .. . .. x
List of Tables .......................................................................................................... xv
List of Syrnbols ....................................................................................................... xvii
CHAPTER 1 ~NTRODUCTION. ... .....,............ ...-..... . ... ...-..-. . .. ...... ...- .. .. .. ... ...........-...... 1
1 . 1 Prearnble ............................................. - .-.-....-.-.................. 1
1.2 Effects of Gas in a Pol ymer . . . . . . . . . . . . . . . . . . . . -. . . . . . . . . . . . . . . . . . . . -. -. . . . . . -..- 2
1.3 Thesis Objectives and Scope of Research ................................. 3
1.4 Organization of the Thesis ............................................. 4
CKAPTER 2 LITERAW SURVEY AND THEORETICAL BACKGROUND .... . .. . . . . . . . . . . . . . ..... 7
2.1 Conventional PVT Measurements of Pure Polymer ..... . . . . . . . . . . .. . ... 7
2.2 Solubility Measurements ....... . . . . .. ... . .. ............... ... ..... .. .......... . 9
2.3 Theoretical Background ....................................................... .... . 1 1
2.3.1 Therrnodynamics (PVT Relationships) ............................
............................................ 2.3.2 S tatistical Thermodynamics
........................................................... 2.4 Equation-of-State (EOS)
.............................. 2.4.1 Empirical Analysis: the Tait Equation
.......................................... 2.4.2 Theoretical Equation-of-S tate
2-4-2- 1 Cell Theory . FOV Mode1 ...............................
..... 2.4.2.2 Cell Theory - Modified Ce11 Model (MCM)
........... 2.4.2.3 Hole Theory - Simha-Sorncynsky Model
2.4.2.4 Lattice-Fluid Theory - Sanchez-Lacombe
............................................................ Model
........................................ 2-4.3 Remarks on Theoretical EOS
............................................................................... 2-5 Solubility
2.6 Physical BIowing Agents ..................... .... .............................
C H A ~ R 3 CONCEPTUAL DESIGN OF PVT M E A S ~ J G DEWCE BASED ON
........................................................................... k a o ~ ~ n c DESIGN 29
............................................................... 3.1 Overall Methodology 29
............................... 3.2 Background of Axiomatic Design Approach 30
....................................... 3 -3 Overall Design for PVT Measurement 31
3.4 Determination of the Positive-displacement Rate of the Gear
Pump ...................................................................................... 37
........................... 3.4.1 Approximate Volumetric Relationships 38
3-42 Calibration of the Gear Pump ........................................ 39
vii
...................... C m 4 PVT MEASUREMENT AND MODELING OF PURE POL-
..................... ....................................... 4.1 Experimental Setup ...
................................................................................. 4.2 Materiais
........................................... ............. 4.3 Experimental Procedures ..
4.4 Results and Discussion .............................................................
4.4.1 System Verifkation .......................................................
4.4.2 EffectsoftheGearPumpSpeeds ....................................
4.4.3 Effects of Thermodynamic Work hputted Into the
......................................................................... S ystem
............................................................................. 4.5 Conclusions
CHAPTER 5 PVT MEASURE~UT &W MODEUNG OF POL- AWD GAS SOLUTIONS 95
5.1 ExperimentalSetup ................................................................. 96
................................................................................. 5.2 Materials 97
........................................................... 5.3 Experimental Procedure 98
............................................................... 5.4 Resuit and Discussion 101
............................................................................. 5.5 Conclusions 113
............................................................. CHAETER 6 S ~ M M A R Y AND CONCLUSIONS 158
................................................................................. 6.1 Summary 158
............................................................................. 6.2 Conclusions 159
viii
Figure 2.1 Dilatometers (a) Cylinder-Piston Type Dilatometer for Molten Polyrner,
(b) Bellow Type Dilatometer with the Polyrner Sarnple hmersed in
Mercury . . . . . . . - . . . . . . . . . . . . .. . . . . . - - - -. . . . . ,, . . . . . . -. - . . - - - - - -. -. . . . - - -. . . . . . . . . . . . . . -. . -. . . . . . .- -. Figure 2.2 Solid-State Dilation Device ...................................................................
Figure 2.4 Relationships between Pressure-Temperature-Solubility ...................... ....
Figure 3.1
Figure 3.2
Figure 3.3
Figure 3.4
Figure 3.5
Figure 3.6
Figure 3.7
Figure 3.8
Figure 3.9
OveraI 1 S trategy . . . . . . . . . . . . . . . . . .... . . . -. -. - -. . . - - - . . - -. -. -. . - - - - -. -. . . . . . . . -. . . . . . . . -. . .. -. . . -.
A Schematic of the Experimental Setup for Measuring the PVT data of a
Polymer Melt . . . . . . . . . . . . . . . . ... . . . . . . . . . . . . . -.- .- -. -. - .. - -. -. --. . - - -. .... . . . . .*. --. -. -. . . .-. -. . ..--
Side View of the Gear Pump .................................................................
Calibration for Determining the Positive-displacement Volume of a Gear
Pump . . . . . . . . . . . . . . . . . . . -. -. . . . . . -. . . . . - -. . . . . - -. -. - . . . . -. - - - - - -. - . . . . -. - -. -. . . . . . . . . . . -. . . . . . . . . .-.- - Experimental Setup for Deterrnininp the Compressibility of Vegetable
Oil (a) Actual Setup with a Syringe Pump, (b) Equivalent Piston-
Cylinder System ........ ....................................... .. . .. . .. . . ..-.. .. ..-. .--..--..-.-.- Volume-Pressure Relationship of Vegetable Oil ...... - ............... ... ....-.-.-.--
Volumetric Flow Rate of Water and Oii through the Gear Pump as a
Function of the Gear Pump Speed ..........................................................
Experimental Setup for Determining Leakage Flow for Water and
Vegetable Oil Across the Gear Pump as a Function of Pressure
Difference . . . . . . . . . . . . . . . . . . . . . . - ... . . . . . . . . -. . . . . . . ,.. . . . . . . . . . . . . . . . . . . -. - -. . -. -. . . . . -. . . . ...- Leakage Flow as a Function of the Pressure Difference in the Gear Pump
Obtained frorn the Dynamic Leakage Flow Analysis ........ .. . .. . .. . .. ....... .....
Figure 4.1
Figure 4.2
Figure 4.3
Figure 4.4
Figure 4.5
Figure 4.6
Figure 4.7
Figure 4.8
Figure 4.9
Figure 4.10
Figure 4.1 1
Figure 4.12
Figure 4-13
Figure 4.14
Figure 4.15
Figure 4.16
Photograph of the Overall Setup of the System .....,,..-......................,......
Side View of the Gear Pump and Connections (a) Angled View, (b) Side
View . . . . . . , . . . . . . . . . . . - . . . . . . . . - . . . . . . . . . -. . . - -. . . . . . -. -. . -. . - . . . . . -. . . -. . . - . . . . -. - - . - . . . - -. . . . - - - . . . . . Overall View of the Controt Boxes (RPM Controllers, Temperature
Controllers, Pressure Readouts, and etc.) . . -. . .. ... . .. . . . . .- - .. - .-. . - - --. - - - - -. -. - - - - - - -
Generai Procedure to Measure the PVT data of Pure Polymer Melts .........
Correlation of PVT Data for PP in the Melt State Using (a) FOV; (b)
MCM; and (c) S-L EOS .......... ................................. ..........--......,..-.......
Cornparison of PVT Data for PP in the melt State between Sato et al.'s
Results [19] and This Shidy ............................................... - - - - - ..-. .- .----- - -
Measured PVT Data for PS (a) Specific Volume with respect to Pressure;
(b) Specific Volume with respect to Temperature ... . .. . . .... ... . .. . . . . .. . . . . -. . . . . .
Correlation of PVT Data for PS in the Melt State Using (a) FOV; (b)
MCM; and (c) S-L EOS .......................................................................
Comparison of PVT Data for PS in the Melt State between
Manufacturer's Reference Data and Experimental Data . . . . . . , . . .. . . . . . . . . . - - -.... Measured PVT Data for Linear PBS (a) Specific Volume with respect to
Pressure; (b) Specific Volume with respect to Temperature ................... ,.
Correlation of PVT Data for Linear PBS in the Melt State Using (a)
FOV; (6) MCM; and (c) S-L EOS .........................................................
Comparison Between the Experimental Data vs. Manufacturer's Data for
Linear PBS ........ ................. ---.- ...- - ...--.. - .......................................... ....-
Measured PVT Data for Branched PBS (a) Specific Volume with respect
to Pressure; (b) Specific Volume with respect to Temperature ....,....,........
Correlation of PVT Data for Branched PBS in the Melt State Using (a)
FOV; (b) MCM; and (c) S-L EOS ..........................................................
Comparison Between the Linear (Dotted Lines) and Branched PBS
(Solid Lines) ....................................................................... ...... ..--....-..
Figure 4.17 Mass Flow Rates Measured in Various Gear Pump Speeds at (a) 220°C
and 27.6 MPa; (b) 220°C and 20.7 MPa; (c) 220°C and 13.8 MPa; (d)200
OC and 27.6 MPa; (e) 200°C and 20.7 MPa; (f) 200°C and 13.8 MPa; (g)
180°C and 27.6 MPa; (h) 180°C and 20.7 MPa; (i) 180°C and 13.8 MPa
Figure 4.18 Error Analysis of PS Due to the Effects of Gear Pump RPM ..... ...............
Figure 4.19 Schematic Diagram of Thermodynamic Effects ....... ..-.-..-.--.*----. --......-....
Figure 5.1 Photograph of the Overall Setup with the Gas Injection System .. .. . .. .. . . ....
Figure 5.2 Photograph of the Gas Syringe Pump .....................----....--.....-..-......-......
Figure 5.3 General Procedure to Measure the PVT Data of Polymer/Gas Solutions ...
Figure 5.4 Effect of Pressure on the Specific Volume of a PSICO, Solution at
Various Temperatures (a) O wt% of CO2; (b) 1 wt% of CO1; (c) 2 wt% of
C02(d) 3 wt% of CO,; (e) 4 wt% of CO, .................................................
Figure 5.5 Effect of Pressure on the Specific Volume of a PSICO, Solution at
Various CO, Contents (a) 220°C; (b) 200°C; and (c) 180°C .....................
Figure 5.6 Effect of Temperature on the Specific Volume of a PS/CO, Solution at
Various Pressures (a) O wt% of CO2; (b) 1 wt% of CO,; (c) 2 wt% of CO,
Pressures (d) 3 wt% of COZ; (e) 4 wt% of CO, .. . .. . ... . . . . ... . . . . - .. . . -. . . . . . .--.....
Figure 5.7 Effect of Temperature on the Specific Volume of a PSfCO, Solution at
Various CO, Contents (a) 276 Bar; (b) 207 Bar; and (c) 138 Bar ..............
Figure 5.8 Effect of COz Content on the Specific Volume of a PS/CO, Solution at
Various Pressures (a) 220°C; (b) 200°C; and (c) 180°C ...........................
Figure 5.9 Effect of CO, Content on the Specific Volume of a PS/CO, Solution at
Various Temperatures (a) 276 Bar; (b) 207 Bar; and (c) 138 Bar .............
Figure 5. I O Effects of Pressure on the Specific Volume of a Linear PBS/CO, and a
Branched PBS/CO, Solution at Various Temperatures (a) O wt% of CO,;
(b) 1 wt% of COz; (c) 2 wt% of CO, Temperatures (d) 4 wt% of- CO,; (e)
6 wt% of CO, ................................................................................
xii
Figure 5. I 1
Figure 5.12
Figure 5.13
Figure 5.14
Figure 5.15
Figure 5.16
Figure 5.17
Figure 5.18
Figure 5.19
Effects of Pressure on the Specific Volume of a Linear PBS/CO, and a
Branched PBSKO, Solution at Various CO, Contents (a) 167OC; (b)
....................................... 157°C; and (c) 147°C ...--
Effects of Temperature on the Specific Volume of a Linear PBSKO, and
a Branched PBS/CO, Solution at Various Pressures (a) O wt% of CO,; (b)
1 w t 8 of COz; (c) 2 wt% of CO:; (d) 4 w t b of CO2; (e) 6 wt% of C O ....
Effects of Temperature on the Specific Volume of a Linear PBS/CO, and
a Branched PBSKO, Solution at Various CO, Contents (a) 276 Bar; (b)
...................................................................... 207 Bar; and (c) 138 Bar
Effects of CO, Content on the Specific Volume of a Linear PBSKO, and
a Branched PBS/CO, Solution at Various Pressures (a) 167°C; (b) 157°C;
...................................................................................... and (c) 147°C
Effects of CO, Content on the Specific Volume of a Linear PBSKO, and
a Branched PBSICO, Solution at Various Temperatures (a) 276 Bar; (b)
...................................................................... 207 Bar; and (c) 138 Bar
The Location of Experimental Data on Temperature vs. Density Graph at
Constant Gas Concentration ..................................................................
Effect of Temperature on the Binary Interaction Parameter, Delta (612), of
PS/C02 Solution at Various CO2 Contents (a) 276 bar; (b) 207 bar; and
........................................................................................... (c) 138 bar
Effect of Pressure on the Binary Interaction Parameter, Delta (S,,), of
PSKO, Solution at Various CO, Contents (a) 220°C; (b) 200°C; and (c)
180°C .................................................................................................
Effect of CO2 Content on the Binary Interaction Parameter, Delta (8J, of
PS/CO, Solution at Various Pressures (a) 220°C; (b) 200°C; and (c)
xiii
Figure 5.20 Effect of Temperature on the Binary Interaction Parameter, Delta (ôl2), of
Linear PBSICO, Solution at Various CO, Contents (a) 276 bar; (b) 207
............................................................................. bar;and(c)138bar 152
Figure 5.2 1 Effect of Pressure on the Binary Interaction Parameter, Delta (6& of
Linear PBS/C02 Solution at Various COz Contents (a) 1 67°C; ( 6 ) 157°C;
...................................................................................... and(c)147OC 153
Figure 5-22 Effect of Pressure on the Binary Interaction Parameter, Delta (6,,), of
Linear PBSKO, Solution at Various CO, Contents (a) 167°C; (b) 157°C;
and (c) 147°C ...................................................................................... 154
Figre 5.23 Effect of Temperature on the Binary Interaction Parameter, Delta (61L)7 of
Branched PBS/COZ Solution at Various CO, Contents (a) 276 bar; (b) 207
bar; and (c) 138 bar .............................................................................. 155
Figure 5.24 Effect of Pressure on the Binary Interaction Parameter, Delta (6,,), of
Branched PBS/COZ Solution at Various CO, Contents (a) 167°C: (6)
157°C; and (c) 147°C ........................................................................... 156
Figre 5.25 Effect of Pressure on the Binary Interaction Parameter, Delta (Ol2), of
Branched PBSKO, Solution at Various CO, Contents (a) 167°C; (b)
157°C; and (c) 147°C ........................................................................... 157
xiv
Table 3.1
Table 3.2
Table 4.1
Table 4.2
Table 4.3
Table 4.4
Table 4.5
Table 4.6
TabIe 4.7
Table 4.8
Table 4.9
Table 5.1
TabIe 5.2
Table 5.3
Table 5.4
Table 5.5
Table 5.6
Calibration Experimental Results with Water ..,..,..,..........-.-..-..-......-..---.
Caiibration Experimental Results with Vegetable Oil ...................------.m..-
Summary of Materiai Properties for PP. PS, Linear PBS, and Branched
PB S . . . . . . . . . . . . . . . . . . . . . . . . . . - . - - - . - - - - -. -. . -. . . -. . - - -. . - - - . . . . . . . . . -. . -. . . - -. - . - . . . - . -. . . - - - - . . . . .- The FOV Equation Constants for PS, PP. Linear PBS, and Branched PBS
The MCM Equation Constants for PS, PP, Linear PBS, and Branched
PB S . . . . . . . . . . . . . . . . . . . . . . . . . . . - -. . - - - - . - - - - - - . . . - -. - -. . . . . . . - . - -. . . . -. . . - -. . . . . . . . . . . . . . . . . . . -. . . . . - - The S-L Equation Constants for PS, PP, Linear PBS, and Branched PBS
Experimental PVT Data of Linear PP ....... .........+...-.......-..... .. .-..-....
Experimental PVT Data for PS .....-.................-...-.........-.......................
PS Manufacturer's Reference Data using the conventionai Bellow type
Dilatometer (Japan Polystyrene Lnc.) . . . . . . . . . . . . . . . . . . . . . . . . . . . . . . - . . . - . . . . . -. . -. . . -...... Experimental PVT Data for Linear PBS .................................................
Experimental PVT Data for Branched PBS .....................-.--.-------.+..........
Experimentai Data for the PSKO, Solution at Three Different Rotational
Speeds (5, 10, and 15 rprn) of the Gear Pump . . . . . . . . . . . . . . . ..... . . ... . . . . . .. ..... Experimental Data for the Linear PBS/CO, Solution nt Three Different
Rotational Speeds (5, 10, and 15 rpm) of the Gear Pump ..................... ....
Experimental Data for the Branched PBS/CO Solution at Three
Different Rotational Speeds (5, 10, and 15 rpm) of the Gear Pump .. . .. , -....
Estimated Parameters for Pure Potymers and CO, ....................................
Variables for the S-L EOS Mixing Rules ................... .. ..--..--......-...-....-
Calculated Values Using the S-L EOS Mixing Rules Based on
Experimental Data of PS .......................................................................
Table 5.7
Table 5.8
Table 5.9
Table 5-10
Table 5.1 1
Table 5.12
Table 5.13
Table 5.14
Calculated Values Using the S-L EOS Mixing Rules Based on
Experïmental Data of Linear PBS ..........................................................
Calculated Values Using the S-L EOS Mixing Rules Based on
Experirnental Data of Branched PBS .....................................................
Characteristic Parameters of MCM EOS for PSKO, Solutions as a
Function of the CO, Concentration ........................................................
Characteristic Parameters of MCM EOS for Linear PBSKO, Solutions as
a Function of the CO, Concentration ......................................................
Characteristic Parameters of MCM EOS for Branched PBSKO,
................................... Solutions as a Function of the CO, Concentration
Characteristic Parameters of S-L EOS for PSKO, Solutions as a
Function of the CO, Concentration ........................................................
Characteristic Parameters of S-L EOS for Linear PBSKO, Solutions as a
Function of the COZ Concentration .......................................................
Characteristic Pararneters of S-L EOS for Branched PBSKO, Soiutions
as a Function of the CO, Concentration .................................................
xvi
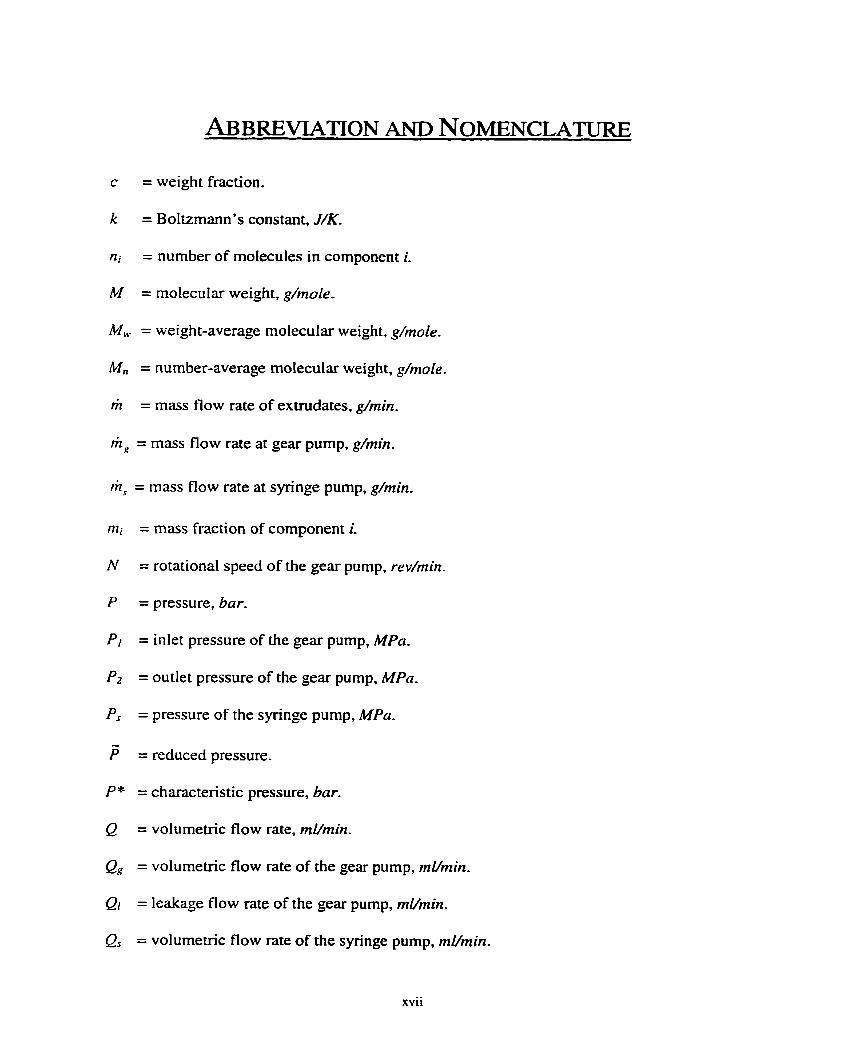
ABBREVIATION AND NOMENCLATURE
c = weight fraction.
k = Boltzmann's constant, J K
ni = number of molecules in component i.
M = molecular weight, g/male.
M,, = weight-average rnolecular weight, g h o l e .
M, = number-average rnolecular weight, g/mole.
m = mass flow rate of extrudates, g/min.
f i , = mass flow rate at gear pump, g/min.
4 = mass flow rate at syringe pump, g/min.
= mass fraction of component i.
= rotational speed of the gear pump, radmin.
= pressure, bar.
= inlet pressure of the gear pump, MPn.
= outlet pressure of the gear pump, MPa.
= pressure of the syringe pump, MPa.
= reduced pressure-
= characteristic pressure, bar.
= volumetric flow rate, rnUrnin.
= volumetric flow rate of the gear pump, r n h i n .
= ieakage flow rate of the gear pump, ml/min.
= volumetric flow rate of the syringe pump, r n h i n .
xvii
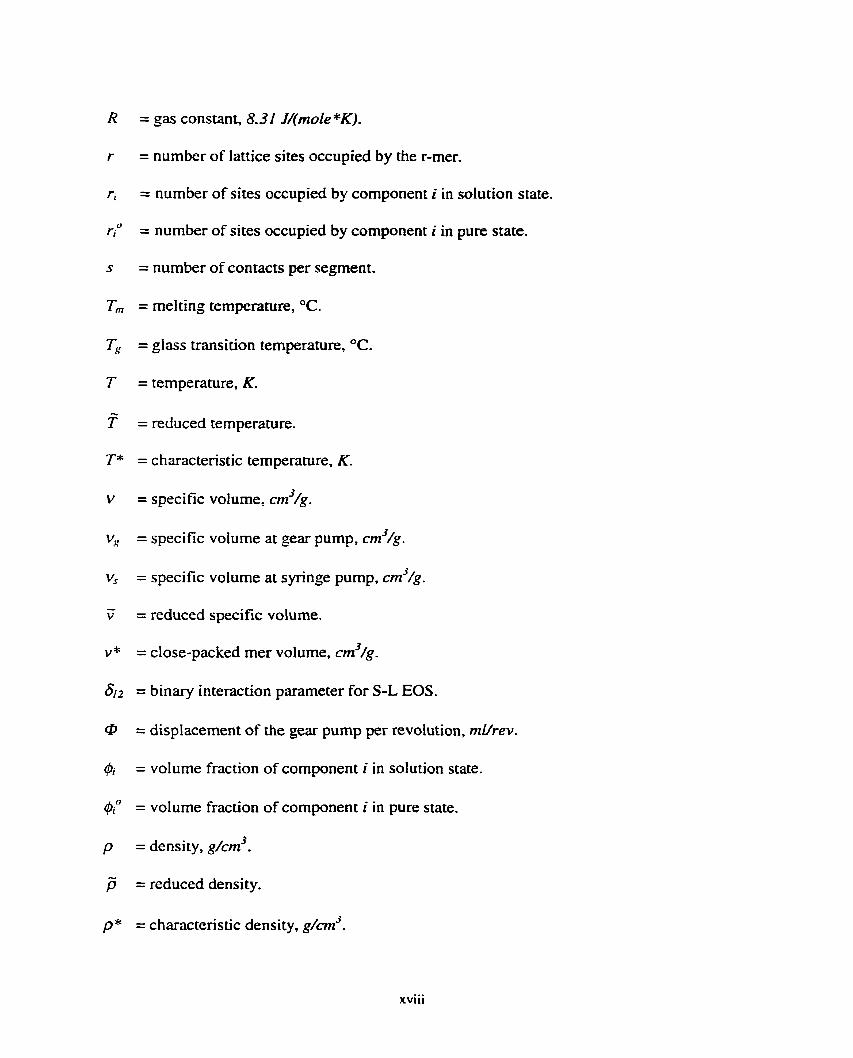
= gas constant, 8.31 J/(mole*K).
= number of lattice sites occupied by the r-mer.
= number of sites occupied by component i in solution state.
= number of sites occupied by component i in pure state.
= number of contacts per segment.
= melting temperature, OC.
= giass transition temperature, OC.
= temperature, K-
= reduced temperature.
= characteristic temperature, K.
= specific volume. cm3/,.
= specific volume at par pump, cm3/g/g.
= specific volume at syringe pump, cm.'/g.
= reduced specific volume.
= close-packed mer volume, cm3/ , .
= binary interaction parameter for S-L EOS.
= displacement of the gear pump per revolution, rnl/rev.
= volume fraction of component i in solution state.
= volume fraction of component i in pure state.
3 = density, g/cm .
= reduced density,
= characteristic density, g/cm3.
xviii
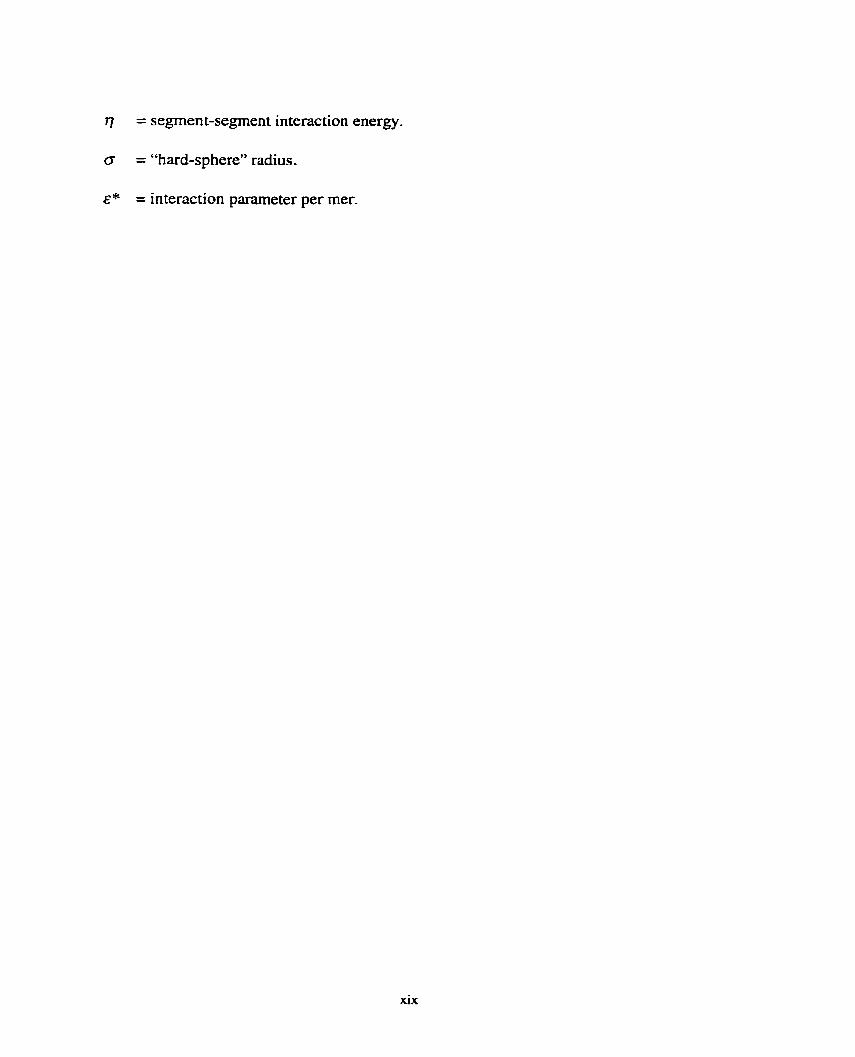
= segment-segment interaction energy.
a = "hard-sphere" radius.
ê* = interaction parameter per mer.
xix
1.1 PREAMBLE
Use of lightweight thennoplastic articles has continued to grow at a rapid pace for
the p s t two decades because of their unique properties as well as weight and cost
reductions. Since material costs account for a s much as 70% of the total cost of a plastic
product [l], using less materiai by creating bubbles (voids) in the plastic matrix to
produce thermoplastic foarns has becorne a desirable practice. Some unique properties of
thermoplastic foarns include cushioning, impact resistance, insulation, and buoyancy. In
addition, thermoplastic foams are warpage free for molded operations (e-g., injection
rnolding) due to interna1 pressure generated by blowing agents. Thus, thermoplastic
foarned articles are very attractive compared to non-foamed parts because of the reduced
weight which translates into superior cost-to-performance and good strength-to-weight
ratios [Z].
Thennoplastic foarns c m be created by introducing a gas, e-g., CO?, under high
pressure into a polymer maulx during a plastication process. Then, a thermodynamic
instability can be induced by rapidiy dropping the solubility of the gas in the polymer by
decreasing the pressure andor temperature. This thermodynamic instability results in the
generation of bubbles, which causes expansion of the thennoplastic part 131.
Successfùl production of lightweight thermoplastic foarns requires knowledge of
the thermodynarnic behaviour of gases and polymers including gas sorption, polymer
swelling, and the pressure-volume-temperature (PVT) relationship. For example,
compressed gases such as supercritical carbon dioxide can be quite soluble in a polymer
matrix at elevated pressures, and the absorption of the gas c m cause substantial swelling
in the polymer 141. However, the availability of such valuable information has been
limited to only a few specific materials in a specific range of temperature and pressure.
Especially, the PVT properties of polymer/C02 solutions have not k e n measured in a
melt condition because of the difficuities involved in the rneasurement.
1.2 EFFECTS OF GAS IN A POLYMER
Absorption of a gas into a molten polymer causes swelling, a reduction of the
viscosity, and a reduction of the meIting temperature [4,5]. Two probable mechanisms
may be responsible for these phenomena: the first mechanism is the dilution of chah
entanglement and the second mechanism is the increase in free volume.
There is a free volume between the molecules, and the free volume varies from
polymer to polymer. The free volume does not refer to microvoids nor microbubbles.
The increase in specific volume due to temperature and pressure changes is attnbuted to
increased movement of polymer rnacrornolecules that results in an increase of the free
volume. Furthemore, absorption of a gas into a polymer greatly increases the free
volume [2,6,7].
In order to understand the effects of the gas content in a polymer/gas solution, one
rnust estimate accurately the composition and density of the polymer/gas solution over a
wide range of pressure and temperature. In the processing of solutions containing a
polymer with dissolved gas under pressure, the swollen volume is an important property.
Estimation of the swollen volume can be achieved by comparing the volume of a pure
polyrner to the volume of a polymerfgas solution.
1.3 THESIS OBJECTIVES AND SCOPE OF RESEARCH
The objective of this study is to develop a novel technique to accurately measure
the pressure-volume-temperame (PVT) relationships of polymer/gas solutions. To our
knowledge, the PVT properties of polymedgas solutions in a molten state of the polyrner
have not been previously reported- The PVT relationships of viscous polyrneric materials
(with or without gas) are important in polymer processing. For example, the
compressibility and shrinkage effects of a materiai in a moiding process can be predicted
through the PVT relationship. In addition, PVT relationships are required in the
measurement of some thermodynarnic properties, such as the surface tension of melts
[8,9] and the solubility and diffusivity of gas in a rnelt [IO-121. Therefore, the
measurement of PVT relationships for polymerfgas solutions would provide valuable
information. The new approach presented in this study is a breakthrough, since no one
has successfully measured the PVT relationships of polymer/gas solutions in a molten
state of the polymer.
The apparatus employed to measure the PVT relationship in this study includes a
positive-displacement gear pump in an extrusion system. The basic rationale of the
design is to determine the specific volume (or equivalently, the density) of the
polymer/C02 solution by measuring the volume and mass flow rates separately, while
controlling the pressure and temperature independently. An experimental PVT
measurement system has been constnicted, and the functions of the designed system have
been verified through experiments [13]. As a first step, the gear pump was calibrated
using a separate setup with water and vegetable oil. An error analysis was conducted to
investigate the accuracy of the calibration of the gear pump [14]. The calibrated gear
pump was mounted on a tandem extruder and experiments were conducted. The
controllability of the pressure and temperature of the polymer melt flowing in the gear
pump was ais0 investigated- The measured PVT data of the pure polymers were modeled
and compared with vaiues published in the Iiterature to confinn the validity of the
designed system. Once the system was verified, various concentrations of carbon dioxide
were injected into polymers and their PVT properties in single-phase solutions were
rneasured.
1.4 ORGANIZATION OF THE THESIS
This thesis is organized in seven chapters. Chapter 1 presents an introduction to
the use of gas in polymer processing. The chapter briefiy describes the formation of
thermopIastic foarns and the effects of gas in a polymer matrix. The concise objectives
and overall strategies are also discussed.
Chapter 2 describes the literature survey and investigations of the theoretical
background associated with the measurement of PVT relationships. The existing
methods of measuring the PVT properties of pure polymers are discussed. The
theoretical background and thermodynarnic relationships of PVT are contemplated. In
addition, various empincal and theoretical equation-of-states (EOS) models are
examined.
Chapter 3 explores extensively the design approaches associated with this novel
technology of measunng the PVT relationships. The basic strategy for achieving the
objectives is explored and the axiomatic design method, used for analyzing the design, is
reviewed. The functional requirements (FRs) and design parameters @Ps) are presented.
and the design matrix used in the study is discussed. In addition, a method for
determination of the positive displacement volume of a gear pump is presented- This
chapter proposes the design concept CO measure PVT relationships for polymerfCOz
solutions and thoroughly elaborates the strategies to verify the design concept.
Chapter 4 describes the measurement and modeling of the properties of pure
polymers. It explains how the strategies proposed in Chapter 3 c m be used successfully
in determining the PVT relationships. The measured PVT properties were compared
with data published in the literature to validate the designed systern. The experimental
PVT properties of the pure polymers were correlated using the three different equations-
of-state (EOS).
In Chapter 5, the measurement of PVT properties for single-phase polymer/gas
solutions is described for various weight percentages of CO?. The chapter describes the
methods to inject carbon dioxide into a molten polymer matrix and to measure the PVT
relationships of polymers/gas solutions. From the experimental data, the swollen volume
due to the gas absorption is presented at various CO2 contents, temperatures, and
pressures. Based on the experiments, efforts were made to derive theoretical rnodels to
describe the PVT behaviours of polymer/C02 solutions as a function of CO2 content,
temperature, and pressure.
Chapter 6 sumrnarizes the work performed in this study to achieve the objectives
and conclusions are presented from the work. Finally, recornmendations for Future work
are presented in Chapter 7. The recommendations may guide future research to further
investigate the PVT relationships of polymedgas solutions.
LITERATURE SURVEY AND THEORETICAL BACKGROUND
2.1 CONVENTIONAL DILATOMETERS FOR PVT MEASUREMENT
Several papers [I5-201 have reported the PVT relationships of pure polymers.
However, the majority of these data is presented at low-pressure conditions, and the
accuracy of the data still needs to be verïfied. The biggest problem associated with the
measurement of PVT properties using the conventional method is polymer degradation
due to its long exposure time to high temperature. Most of these data were gathered
using some sort of dilatometer. A dilatometer is an instrument that measures the volume
of a material as a function of pressure and temperature.
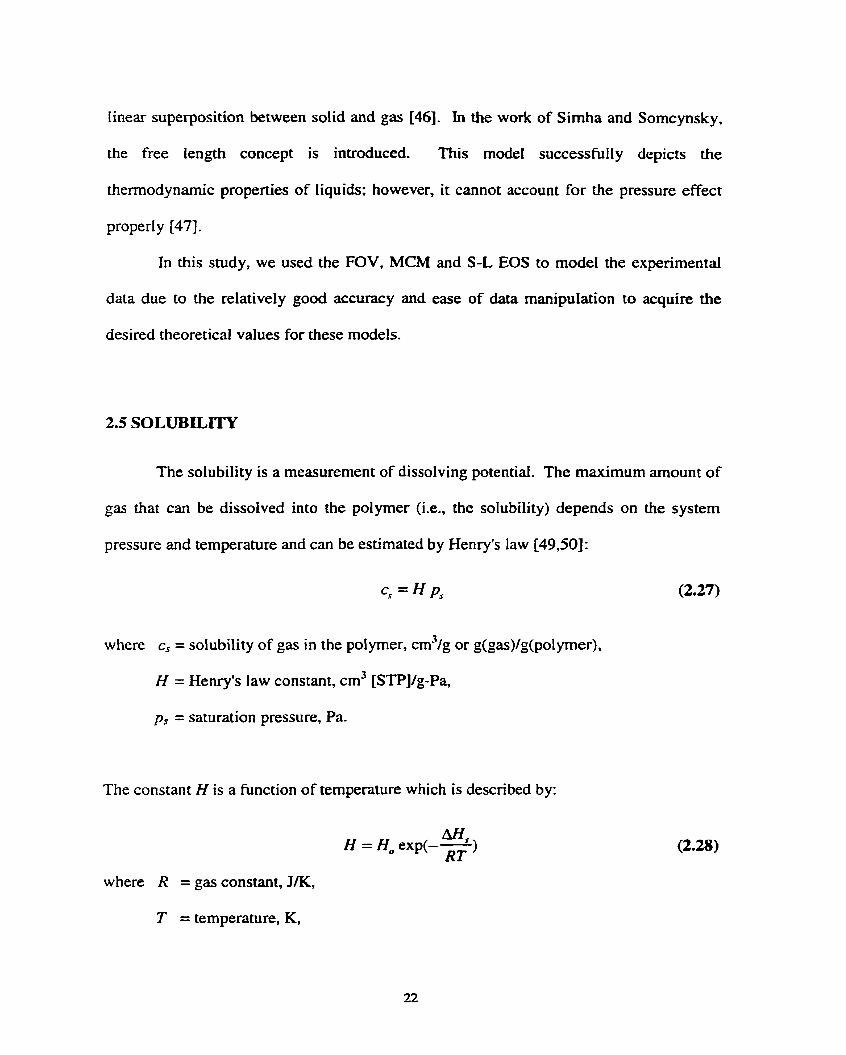
Foster et al. [15] used a cylinder-piston type rnethod in a compressibility chamber
to measure the PVT properties of plastic. Figure 2.l(a) illustrates a typical cylinder-
piston type dilatometer. The volume changes were determined by rnultiplying the cross-
sectional area of the piston by the linear displacement of the piston. The major problem
associated with this type of dilatometer is the leakage that occurs between the seal and
the piston perimeter. Another limitation of the cylinder-piston dilatometer is that only the
molten state of the polymer can be utilized for density measurements.
Zoller [16,17] and Sato et al. 1191 used a bellow-type dilatometer. The flexible
bellow apparatus confined a polymer sample and the liquid mercury in which the
polymer was immersed. The PVT properties of the polymer sample were determined by
subtracting the PVT properties for pure mercury from that for the polyrner sample and
mercury. First, the PVT properties of the polyrner sample along with the mercury were
determined by changing the temperature or pressure and measuring the volume change
that occurred when the bellows moved. Pressure was applied by hydraulic oïl, causing
the bellows to contract until the pressure of the sarnple inside the bellows balanced the
applied pressure. Then, the PVT properties of pure mercury were obtained and these data
were subtracted from the measurements made with the polyrner sample and mercury to
obtain PVT properties for the polymer sample alone [20]. Figure 2.1 (b) illustrates a
typical bellow-type dilatometer with a polymer sample imrnersed in mercury. The
advantage of this type of dilatometer is that it can operate at both solid and molten States
of the polymer [19]. Although the flexible bellows method provides accurate
measurements, obtaining PVT data using such a method is very time-consuming and
quite costly. Furthemore, material degradation associated with this type of method is
severe due to the long time required to maintain therrnodynamic equilibrium at each
temperature and pressure.
Some attempts have been made to measure the PVT relationships for multi-phase
petrolrum and gas. Rahman et al. [SI] used two chambers of piston cells along with gas
chromatograph equipment. This method was similar to the piston-cylinder method
mentioned above, but was limited to measure the multi-phases of gas and petroleum
liquids. This method still requires further verification of its accuracy.
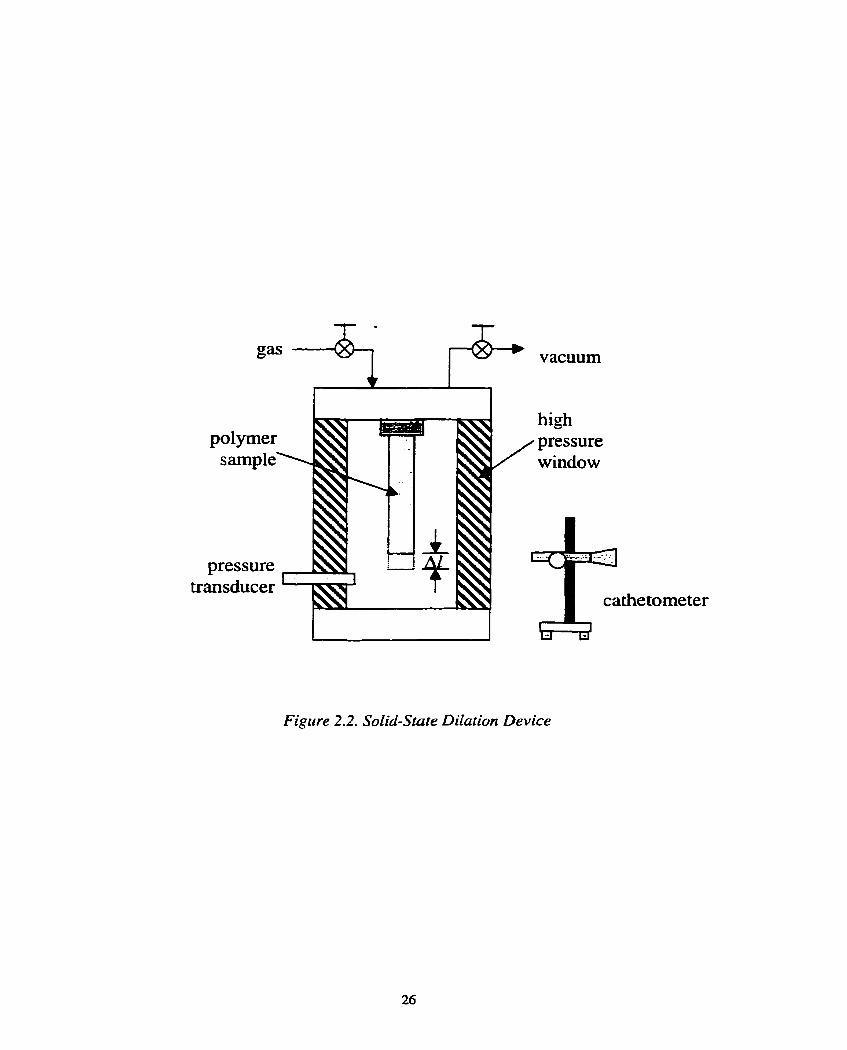
Another attempt to measure the PVT relationship of a polymer/gas solution was
made by Hirose et al. [22]. They determined gas absorption by measuring the change in
length of a thin polymer sample in its solid state. Figure 2.2 depicts a schematic of the
apparatus. They used rectangular film strips (60 mm x 3 mm x 90 pm) suspended in a
g l a s pressure cell. A cathetometer was utilized to measure the elongation of the sample
due to gas absorption. A cathetometer is a type of comparator with a tetescope equipped
with a cross wire rnounted on a vertical sliding column to measure vertical distances on
fairly near objects. The pressure range for this apparatus was up to 50 atm and
temperature was in the range of 25°C to 5S°C. The device could measure on1 y solid-state
sarnples. Problems associated with this type of dilatometer inciude distortion of the
sample (Le., warping), which may hinder accuraçy of measurements. Also, the samptes
rnay be affected by anisotropy of the molecula. chains because polymer chains may be
oriented due to the thin nature of the polymer samples that were extnided. Lastly, the
working ranges of pressure and temperature are too low to determine the PVT behaviour
of the melt state effectively. \
Even though conventional dilatometers are capable of measuring the PVT
relationship of pure polyrners or the PVT properties of polymer/gas solutions in solid
state, no method or instrument has been reported previously to rneasure the PVT
reIationships of poIymer/gas solutions in the rnolten state of the polyrner.
2.2 SOLUBILITY MEASUREMENTS
The PVT relationships are related to the solubility of the gas in the polymer.
Thus, understanding of the solubility of gas in the poiymer is imperative. From the
acquired solubility data, one may predict PVT relationships of a poiymer/gas solution
[23,24]. However, this method still requires extensive research on the mixing relationship
between a gas and a polymer. There are three widely used methods to measure the
solubility of a gas in a polymer: a pressure decaying method 125,261, a cloud po
measuring method [27], and a gravimetric method [4,28].
Sato et al. [25] measured the solubilities of nitrogen and carbon dioxide
int
in
polystyrene using a pressure decaying (barometric) method. As one would expect, the
solubilities of gases increased dong with the pressure. The solubility of carbon dioxide
decreased with increasing temperature. The principle of the pressure decaying method is
measurement of gas sorption in a polymer sampIe, which is based on the difference
between the amount of gas, initiaily contacting the polymer and the amount remaining in
the gas phase. The pressure decaying method requires rather careful calibrations and can
only be used with gases whose properties of EOS are known accurately.
In Mishima et al.'s work [27], the solubility of supercriticai carbon dioxide in
polyethylene glycol was measured based on observation of the cloud point using a laser.
A He-Ne laser passed through the ceIl and the intensity of the laser was monitored with a
photo sensor. Near the cloud point, carbon dioxide was charged carefully. The intensity
of the transmitted laser decreased sharply when the charged amount of CO2 passed
through the cloud point and the cloud point fraction was measured.
Wissinger et al. [4] investigated the CO? sorption in polycarbonate, polymethyl
methacrylate, and polystyrene using the gravimetric method. The gravimetric method
was used to find sorption from direct measurements of weight gain of a polymer sarnple
as it absorbed gas. The limitation of this method is that relatively low gas solubilities can
only be measured with a sensitive weighing device like a quartz spring. In addition, the
swelling compensation must be applied due to the increase in the specific voiume, which
results in buoyancy.
2.3 THEORETICAL BACKGOUND
2.3.1 Thermodynamics (PVT Relationships)
PVT relationships c m be used to interpret physical and chemicai phenornena such
as melting, crystallization, g l a s formation, fluid sorption, and etc. The experimental
measurements of those data should be made at a quasi-state equilibrium, Quasi-state
equilibrium refers to independence of path andor time. For example, the volume only
depends on pressure and temperature, without effects of time or path taken in the
measurement cycle. The only true equilibrium state of a polyrner is at the melt state
because the sotid state and glassy state of polymers often exhibit path dependence [29].
Thus, clhe PVT properties for polyrners should be measured in the melt state.
Furtherrnore, there are several issues which may hinder the accuracy of the "true" PVT
properties. The most important issue is inaccuracy due to material degradation at high
temperatures because it usually takes a long time for a polymer meit to reach equilibrium.
Even crystalline polymers may undergo crystallization at high temperatures and
pressures, making accurate acquisition of PVT properties very difficult. In order to fi l1
the gaps to achieve the accuracy needed, several empiricai equations-of-state (EOS), such
as the Tait equation [30], and theoreticai (statistical) EOS, such as Flory, Orwoll, and Vnj
(FOV) [31], Modified Ce11 Mode1 (MCM) [32,33], Sanchez and Lacombe (S-L)
[24,34,35], and Sirnha-Somcynsky (SS) [23] have been proposed to describe polymer
properties at different States.
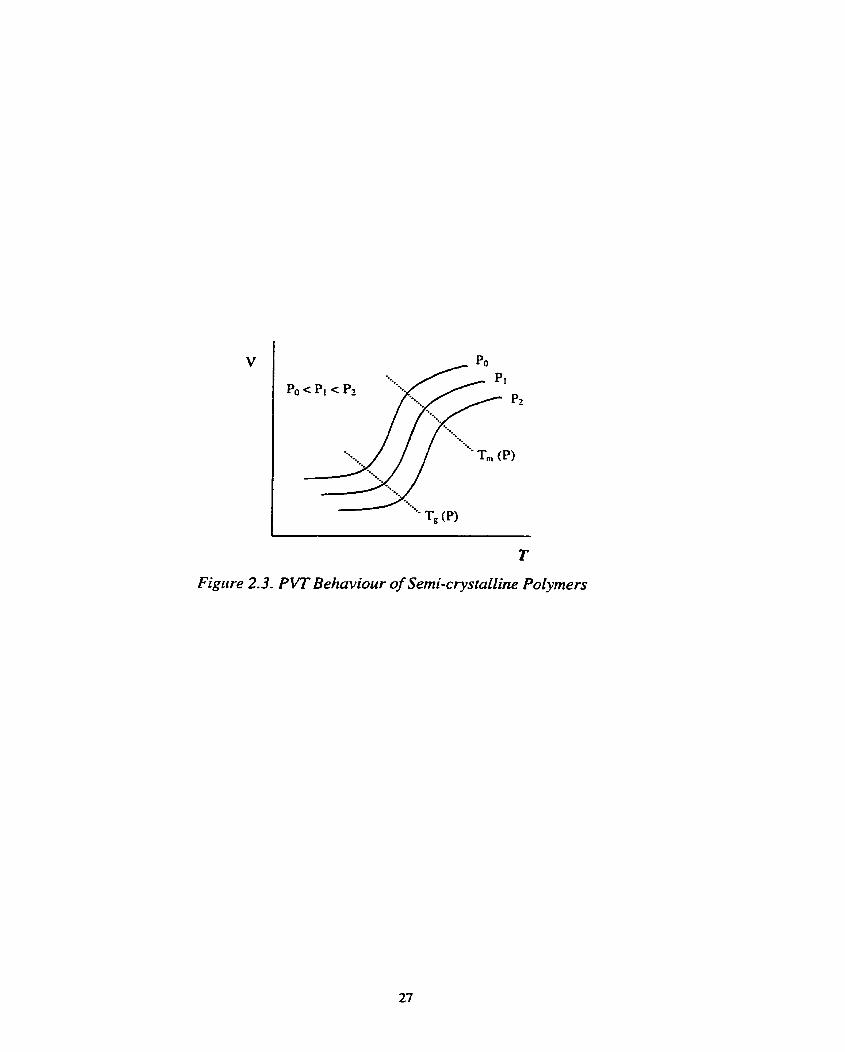
The typical PVT behaviour of semi-crystaliine polymers (e-g., PP) at quasi-
equilibrium is shown in Figure 2.3. The melting region is clearly shown in the figure by
a large change in the specific volume, where the melting point is denoted by Tm (P) and
the glass transition region is depicted by Tg (P).
The PVT relationship c m be analyzed when time-dependent effects are
negligible:
f ( P , V , T ) = O or V = f ( T , P ) (2-1)
From the above equation, the EOS can be interpreted such that if any two of the
properties are fixed, the third is determined. For example, if the temperature and the
volume are known, one can determine the pressure using an EOS model.
Equation 2.1 leads to the following equation, which can be gathered from PVT
reiationships:
dv - = p d T - KdP v
where
p is the isobaric (constant pressure) compressibility, K is the isothermal compressibility
(constant temperature), and B is the bulk modulus.
2.3.2 S tatistical Thermodynarnics [36-3 81
Statistical thennodynarnics was developed in the early 19" cenniry. rnainly by
Boltzmann in Germany [39] and Gibbs in the United States 1401. With the initial arriva1
of quantum theory, Bose (Indian physicist, 1894-1974), Einstein (German physicist.
1879- 1955), Ferrni (Italian physicist, 190 1 - 1954). and Dirac (English physicist, 1902-
1984) made modifications to Boltzmann's original ideas and succeeded in clarifying
some of the uncertainties of the Boltzmann statistics [36]. The statisticai approach has
close connection to the themodynamics and kinetics theory. For systems of particles, in
which the energy of the particles can be determined, one can derive the EOS by statisticai
means.
Detailed derivations of statistical thermodynamics are not included in this chapter.
Rather, we illustrate several EOS (e-g., FOV, MCM, S-L, and SS) that were derived
using the statistical thermodynamics approach. Rodgers et al. [18] investigated the PVT
relationships for a number of pure polymeric materials and used several EOS models to
illustrate applications of statistical thermodynamics theory.
2.4 EQUATION-OF-STA'E (EOS)
The equations-of-state are very important in describing the therrnodynamic
properties of liquids and gasniquid solutions. The EOS is correIated using the
experimentai data in a molten state, far above the glass transition temperature. For
polymer/gas solutions, the densities of both the gas and polymer are required to interpret
the effects of gas in a polymer matrix. The Free volume fractions are used to describe the
swelling phenomena. Empirical EOS, such as the Tait equation, and theoretical
(statistical) EOS, such as Flory, Onvoll, and Vrij (FOV), Modified Ce11 Mode1 (MCM),
Sanchez and Lacombe (S-L), and Simha-Sorncynsky (SS), are illustrated in this section.
2.4.1 Empirical Analysis: the Tait Equation
One of the rnost common and the earliest empirical representation of the PVT
relationships for polyrners is the Tait Equation [17,30]. The equation is an interpretation
of the isothermal compressibility model of a volume and pressure relationship. The
equation is shown below:
V(P , T ) = V ( 0 , T) { I - C h [ I + P / B ( T ) ] J
where the coefficient C is 0.0894 117, f 81 in most cases.
The compressibility increases exponentially with an increase in the temperature
and pressure. The zero-pressure isothenn V (0, T) is usually given by:
V (O, T) = V, exp (aT) (2.6)
where ai is the thermal expansion coefficient. The Tait parameter B(T) is usually given
by :
B (T) = Bo exp (-BIT)
Therefore, the Tait equation has four parameters, namely Vos a, Bo, and Bi, describing
experimental PVT properties. These variables can be evaluated from the experimental
PVT properties by the least-squares regression.
2.4.2 Theoretical EOS
Knowledge about the thermophysical properties of materials requires
experimentally measured data or predictions obtained from a suitable mathematical
modei, such as an EOS or an empirical model. Theoreticd EOS modeling represents
PVT behaviour of polymers with respect to the forces existing between polymer
molecules. The forces can be obtained from quantum mechanics. The use of statistical
mechanics enables correlation of quantum and continuum mechanics, which ailows
statistical averages to be expressed using molecular variables. The direct evaluation of
the forces is very diff~cult and several assumptions must be taken into consideration
[37,38]. The common statistical mechanics equation is:
where k is the Boltzmann's constant and Q is the canonical partition function. From the
equation above, severai models have k e n proposed and they can be classified into three
groups: ce11 theories, hole theories and lattice-fluid theories. Most of the theoretical EOS
theories represent the PVT relationship of a liquid polyrner in a dimensioniess form. The
EOS presented in the following sections are rnainly for the PVT relationships of pure
poIymers with the exception of the Sanchez-Lacombe EOS, which incorporates mixing
mles to accommodate polymer/gas solutions.
2.4.2.1 Ce11 Theory - Flory, Orwoll, and Vrij (FOV) Mode1
One of the most extensively applied ceIl theories is the Flory, Onvoll, and Vrij
(FOV) mode1 where the mer can move only within a lirnited volume of space mainly due
to the close presence of neighbounng mers. This limited volume formed by neighbouring
mers is known as a "ceil". Flory, Orwoll, and Vrij [31] derived the EOS based on the
free volume of the cell:
w here
s is the number of contacts per segment, q is the segment-segment interaction energy, k is
Boltzmann's constant, a is the "hard-sphere" radius, and v* is identified as the h&ore
ce11 volume.
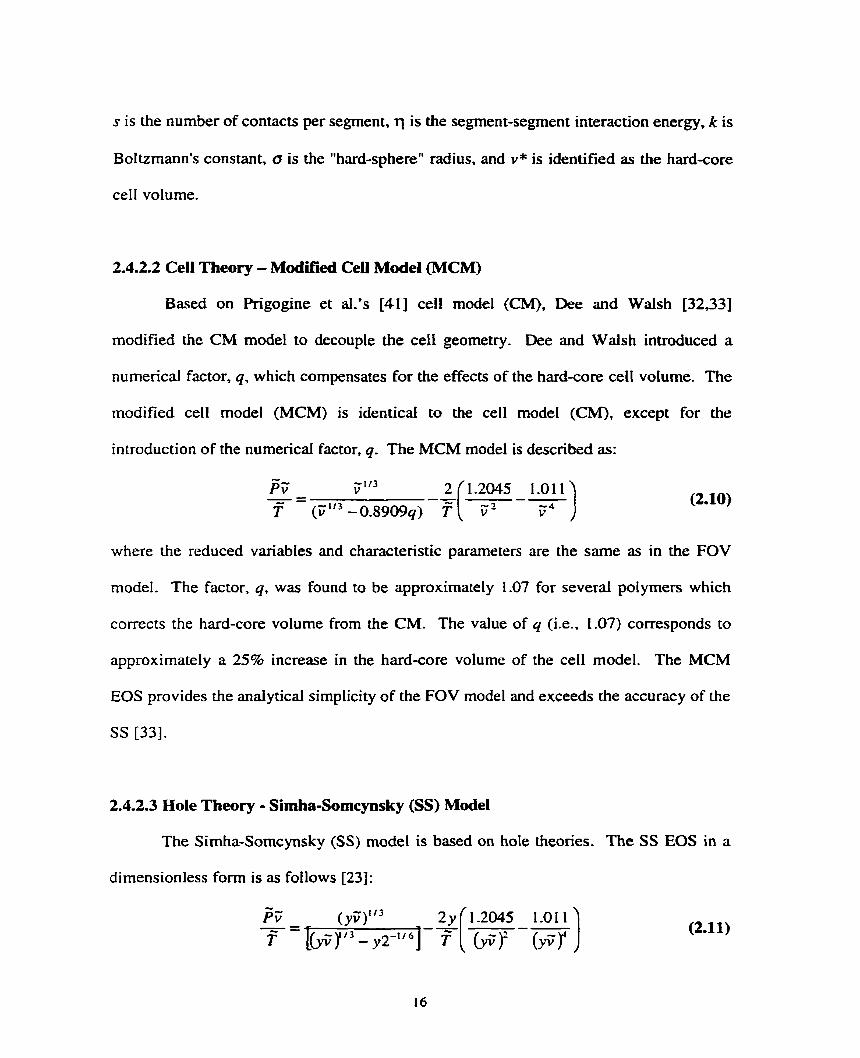
2.4.2.2 Cell Theory - Modified Cell Mode1 (MCM)
Based on Prigogine et aL's 1411 ce11 model (CM), Dee and Walsh [32,33]
modified the CM model to decouple the ce11 geometry. Dee and Walsh introduced a
numerical factor, q, which compensates for the effects of the hard-core cell volume. The
modified ce11 model (MCM) is identicai to the ce11 mode1 (CM), except for the
introduction of the numericd factor, q. The MCM model is described as:
where the reduced variables and characteristic parameters are the sarne as in the FOV
model. The factor, q, was found to be approximately 1.07 for several polymers which
corrects the hard-core volume from the CM. The value of q (Le., 1.07) corresponds to
approxirnately a 25% increase in the hard-core volume of the ce11 model. The MCM
EOS provides the anaiytical simplicity of the FOV model and exceeds the accuracy of the
ss [33].
2.4.2.3 Hole Theory - Simha-Somcynsky (SS) Model
The Simha-Somcynsky (SS) model is based on hole theories. The SS EOS in a
dirnensionless form is as follows [23]:
with
w here
P*, v* and T* are characteristic parameters. Y is the fraction of occupied sites- L'sually,
s/3c is 1. Through a non-linear lest square analysis, experimental data cm be fit to this
model. Even though the accuracy of the model is good, it is quite complicated to acquire
the characteristic variables.
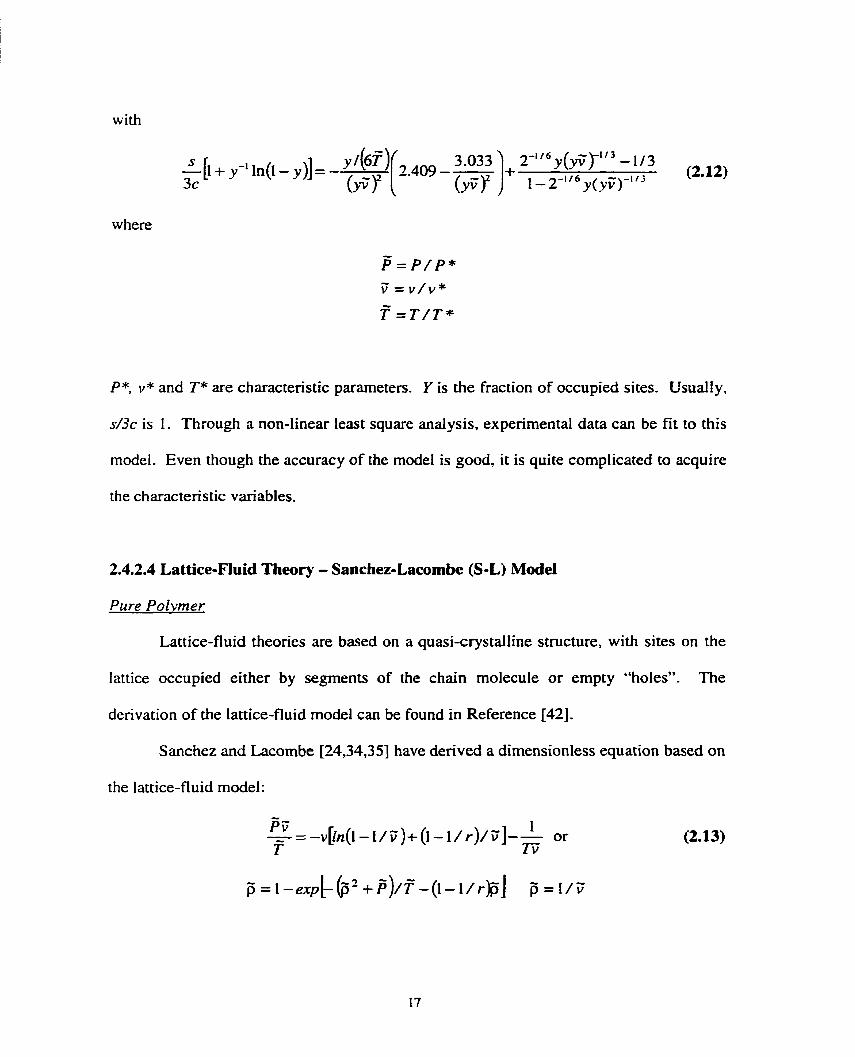
2.4.2.4 Lattice-Fiuid Theory - Sanchez-Lacornbe (S-L) Mode1
Pitre Polvmer
Lattice-fluid theories are based on a quasi-crystalline structure, with sites on the
lattice occupied either by segments of the chain molecule or empty "holes". The
derivation of the lattice-fluid model can be found in Reference 1421.
Sanchez and Lacombe [24,34,35] have derived a dimensionless equation based on
the lattice-fluid model:
-
where r is the number of Iattice sites occupied by the r-mer. For a polymenc liquid, r
becomes infinity and the equation of the state cm be simplified to
The reduced density, pressure and temperature are defined as:
where p*, P*, and T* are the €OS parameters, e* denotes the interaction per mer, v* is
the close-packed mer volume, R is the gas constant, and M is the molecular weight.
S-L EOS l7zeot-v for Polvmer/COi Solutions
Lattice models (Le., S-L EOS) have k e n used successfully to describe
polymedgas solutions [43]. The lattice and gas mode1 is based on distribution of
moIecules and holes (or vacant lattice sites) in a three-dimensional sense.
Accurate interpretation of PVT and solubility behaviour using an EOS is quite
challenging. A better understanding of the interaction between gas molecules and
polymer molecules is required in mixed solutions. The impetus to rneasure the
interrnolecular interactions has been addressed by several authors with spectroscopic
measurements [443
The EOS of a polymer/gas solution is basically the sarne as for a pure polymer.
However, reduced variables such as p . F . f . and r as well as the interaction parameter
between COz (cornponent 1) and a polymer (component 2) should be changed by mixing
d e s .
There are three combining rules associated with a solution of gas and polyrner.
The first combining rule is the conservation of the close-packed volume. If a CO-
molecule occupies r1° sites in its pure state and has a close-packed molecuIar volume of
ri4/1*. ii occupies r, sites with v* close-packed volume in the solution. Then the
relationship of these two volumes becomes:
rl "VI' = rI v* (2.15)
The second mle keeps the total number of pair interactions in the close-packed
soIution the s m e as the sum of the pair interactions of the components in their pure
close-packed States- This can be described as:
rl ONI + rz"N2 = rN (2.16)
where and l& are the number of molecules of component 1 and 2. respectively. N is
the sum of Nl and N2, and r is the total number of sites occupied by both cornponents in
the solution. From these combining rules, the following relations can be obtained:
V* = @,4/,* + hOvz* (2.17)
r = xp-1 + (2.18)
where G I O and & O are the volume fractions of component 1 and 2 in their pure state.
Likewise, xi and xz are the mole fraction of component 1 and 2, respectively.
The third combining rule defines the charactenstic pressure P* of the solution as a
pair wise additive:
P* = @;PI* + & 2 ~ 2 + 2@&Piz* (2.19)
Pi2* = ( P I *p2*ih (1-&) (2.20)
where @ denotes the volume fraction of the subscript component in the solution and is
the interaction parameter between the two components. 612 is the only interaction
parameter needed to completely characterize a binary solution. It corrects the deviation
of the characteristic pressure of the solution from the geometric mean of the characteristic
pressures of each component.
From the above three mixing rules, we can also gather the following equations:
where ml and rnz are the respective mass fractions.
In order to estimate the solubility of CO2 in a polymer, an equilibrium state of the
two phases must be assumed. It is also assumed that the polymer is not dissolved in the
gas phase. The chemical potentials of COz in the upper (gas) and the lower (polymer)
phase are the same:
where the superscnpts of "G" and " P denote the gas and polymer phase, respectively.
The difference of the chemical potentials of CO2 in the two phases is given by:
The above equation indicates that if we acquire the interaction parameter, Srr, and
the PVT propertics of the components at the solubility pressure, the equilibrium solubility
of CO2 dissolved in the polymer c m be determined. One obstacle, however, is that there
is scarce information on the PVT properties of polyrners and interaction parameters. If
the solubility data is available in a limited range, one can determine the parameter by a
non-linear regression analysis.
2.4.3 Remarks on Theoretical EOS
In the ce11 theory (i.e., FOV), the changes in the volume together with the changes
in the temperature and pressure c m be explained only by the changes in the ce11 size.
The MCM EOS introduces the correction factor for the close-packed volume to reduce
errors associated in the ce11 theory. On the other hand, in the hole theory (Le., SS), the
number of holes and the change in ce11 size explains the change in the volume which
plays a minor role. In the lattice theory (Le., S-L), the lattice size is fixed and it explains
the change of volume only by the number of vacant sites 1451.
As pointed out by Dee and Walsh [32], the lattice theory is more appropriate to
depict the thermodynamic properties of the gaseous state. So far, it has been noted that
the free volume theories, especially the hole theories, can delineate the thermodynamic
properties of a liquid well. III the hole theory, the free volume is treated by the concept of
linear superposition between solid and gas [46]. In the work of Simha and Somcynsky.
the free length concept is introduced. This mode1 successfully depicts the
thermodynarnic properties of liquids; however, it cannot account for the pressure effect
properl y [47].
In this study, we used the FOV, MCM and S-L EOS to mode1 the experimentai
data due to the relatively good accuracy and ease of data manipuIation to acquire the
desired theoretical values for these models.
2.5 SOLUBILITY
The solubility is a measurement of dissolving potential. The maximum arnount of
gas that can be dissoived into the polymer (Le., the solubility) depends on the system
pressure and temperature and can be estimated by Henry's law [49,50]:
where c, = solubility of gas in the polymer, cm31g or g(gas)lg(polymer),
H = Henry's law constant, cm3 [STPJ/g-Pa,
p, = saturation pressure, Pa.
The constant H is a function of temperature which is described by:
where R = gas constant, J/K,
T = temperature, K,
H, = solubility coefficient constant. cm3 [STPIfg-Pa,
AHs = moiar heat of sorption, J.
This law is based on the ideai state of an extremely dilute solution. Furthemore,
the law does not consider interactions between the polyrner and gas. Due to the above
limitations, Henry's law deviates frorn the actuai solubility of gas in polymers, especialty
at high pressure.
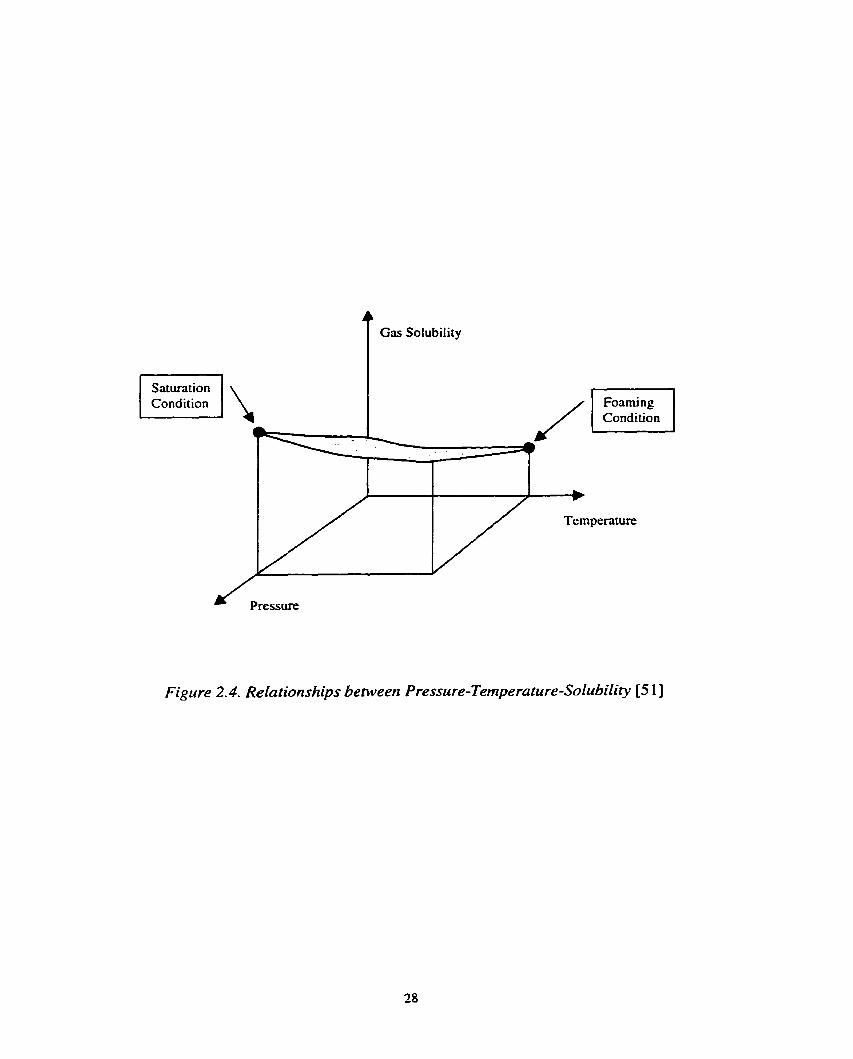
Figure 2.4 [SI] illustrates the relationship between pressure, temperature, and
solubility. The solubility increases when the pressure goes up. The temperature does not
significantly affect the solubility compared to pressure.
2.6 PHYSICAL BLOWNG AGENTS
There are two types of blowing agents: physicd and chernicai blowing agents.
Chernical blowing agents are quite expensive and quite toxic in most of the cases.
Physical blowing agents such as CFC and HCFC are harrnful to environment. lnert gases
have been considered to be an aiternative, whether used alone o r used together with
conventional agents.
Nitronen
One of the readily available gases is nitrogen. Nitrogen is inexpensive,
nonflammable, nontoxic, environmentally safe and chemically inert [5]. However,
nitrogen has a very low solubility in polymers. As a result, absorption of nitrogen into a
polyrner requires a very high pressure as well as a long processing time.
Ca rbon D ioxide
Carbon dioxide, which is environmentally benign, has the same advantages as
nitrogen, but aiso has better solubility than nitrogen. Furthemore, carbon dioxide cm
work as a nucleating agent. Thus, carbon dioxide gas was chosen as the blowing agent
for this study.
Force n Dia1 Indicator
(a) Cylinder-Piston Type Dilatometer for Molten Polymer
Polymer SampIe
Bellow Type Dilatometer with a Polymer Sample immersed in Mercury
Figure 2- 1. Conventional Dilatometers
gas s vacuum
cathetometer
Figure 2.2. Solid-State Diiation Device
T
Figure 2.3. PVT Behaviour of Semi-crystaihe Polymers
t Gas Solubility
Temperature
Figure 2.4. Relationships between Pressure-Tempe ramre-Solubilit>: [5 1 ]
CONCEPTUAL DESIGN OF PVT MEASURING DEVICE
BASED ON AXIOMATIC DESIGN
In this chapter, the detailed description of the overall strategy for measuring the
PVT reiationships using the gear pump, based on the axiomatic design approach, and the
detailed calibration of the positive displacement gear pump are presented. One of the
most important steps prior to measurement is calibration of the gear pump. Both water
and vegetable oil were used to verify the exact volumetnc flow rate. The enumerated
procedure for calibration of the gear pump is also presented in this chapter.
3.1 OVERALL STRATEGY
The overall strategy for the PVT measurement of polynierlgas solutions is
depicted in Figure 3.1 in a fonn of step-by-step flow chart. The axiomatic design
concept, descnbed in the following section, is utiiized to effectively design the PVT
measuring apparatus for polymer/gas solutions. Once the design is finalized, the
positive-displacernent gear pump is calibrated to determine the volumetric flow rate per
revolution of the gear in the gear pump. Two different mzterials, water and vegetable oil,
are used for the calibration of the gear pump. The apparatus is built based on a tandem
extrusion line on which the gear pump is rnounted, The critical sets of experiments for
pure polymers are performed to verify the design by comparing the experimentai results
with the data from the literature. Once the proposed system is verified, carbon dioxide is
injected into a molten polymer matrix to form a single-phase polymer/gas solution. The
mass and volume flow rates of the solution are acquired- Based on these two sets of
results, the specific volume of the solution with respect to pressure and temperature is
gathered. The experimental results are then mathematically interpreted using various
EOS to predict the trends.
3.2 BACKGROUND OF AXIOMATIC DESIGN APPROACH 1521
In order to effectively come up with the strategies to achieve the goal, the
axiomatic design concept, a systematic method for guiding the design process, was used.
The approach consists of the following steps: i) establishment of desired needs; ii)
conceptualization of design solutions; iii) anaiysis of the proposed solutions; iv) selection
of the most suitable design from the proposed ones, and v) implementation of the chosen
design. The importance of the axiomatic design approach is to Iet designers be aware of
the potential effects of the design variables and shift their paradigms into goal oriented
thinking.
The first step in designing a product or a process is to come up with a set of
fitncrionnl requirements (FRs) that represent "what we wmt" in the design. In order to
achieve the FRs, design parameters (DPs) are defined. Each DP is selected to satisfy the
corresponding FR.
The axiomatic design approach enables identification of good designs by
satisfying two design axioms: the independence of Functional requirements (FRs), and the
minimization of the information content. The fïrst axiom guarantees independent control
of each FR, and the second ensures simplicity of the design.
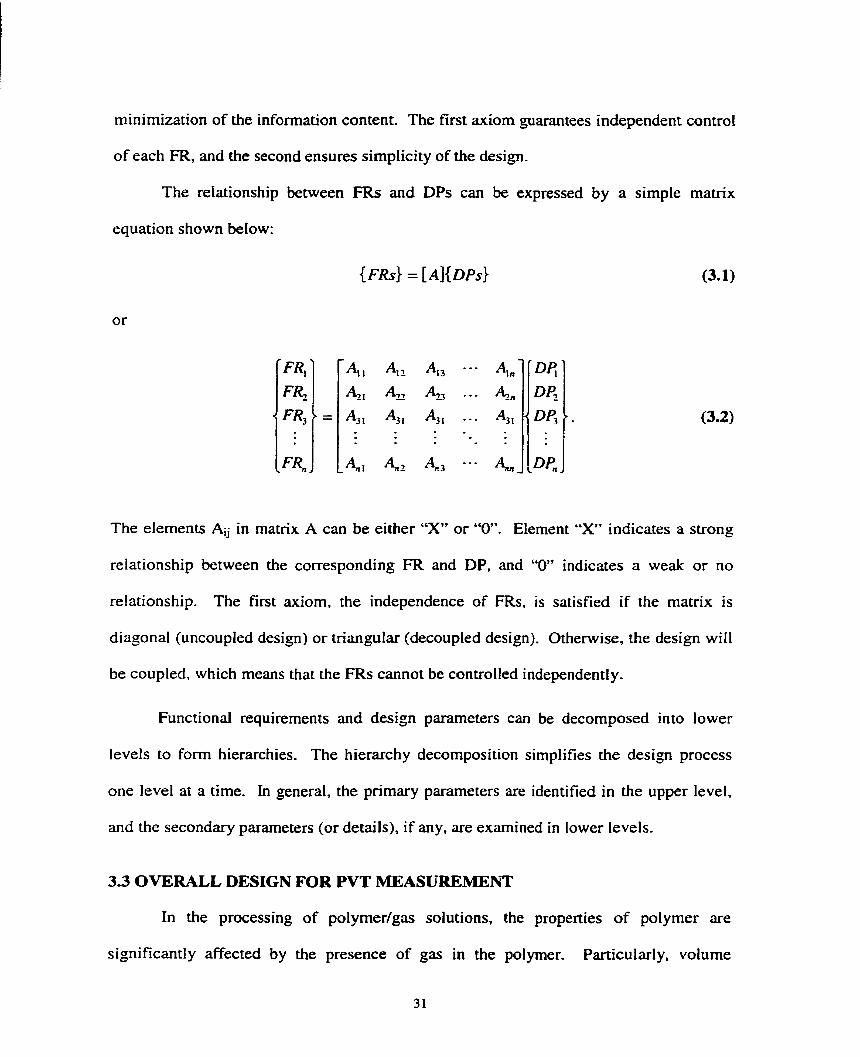
The reIationship between FRs and DPs can be expressed by a simple matrix
equation shown below:
The elements AG in matrix A c m be either "X" or "0 . Element "X" indicates a strong
relationship between the corresponding FR and DP, and "û" indicates a weak or no
reIationship. The first axiom, the independence of FRs, is satisfied if the matrix is
diagonal (uncoupled design) o r triangular (decoupled design). Otherwise, the design wiIl
be coupled, which means that the FRs cannot be controlled independently.
Functionai requirements and design parameters can be decomposed into lower
levels to form hierarchies. The hierarchy decomposition simplifies the design process
one level at a time. In general, the primary parameters are identified in the upper level,
and the secondary parameters (or details), if my, are examined in lower levels-
3.3 OVERALL DESIGN FOR PVT MEASUREMENT
In the processing of polyrner/gas solutions, the properties of polymer are
significantly affected by the presence of gas in the polymer- Particutarly, volume
swelling due to the dissolved gas is important because it significantly affects the
processing conditions. The basic rationale behind PVT measurements for a polyrner/COz
solution is to measure the volume and mass flow rates separateiy while independently
controlling the temperature and pressure in an extrusion system. Therefore, if the
volumetric fIow rate (Q) and mass flow rate (th) can be measured accurately in a
continuous extrusion process at a specific temperature and pressure, then the specific
volume (or equivaiently, the density) can be calculated using the equation below:
The positive displacement nature of a gear pump can be utilized to rneasure the
volume flow rate of a polymer/C02 solution, and the PVT measurement system is
designed based on a tandem extruder with the gear pump. Figure 3.2 shows a schematic
of the designed PVT measurement system.
The axiomatic design approach is used to ensure that each required processing
parameter could be independently controlled to allow measurement of the PVT
properties. In order to measure the specific volume. we first need to satisfy four
(primary) functionai requirernents (FRs). The FRs at the primary level are the following:
FR, = Plastication of a polymer
FR, = Formation of a polymer/gas solution
FR, = Measurement of the volumetric flow rate for a given temperature and
pressure of the solution
FR, = Measurement of the mass flow rate of the solution
The design parameters @Ps) chosen to satisfy the functional requirements are the
following:
DP, = Screw motion in the first extruder of a tandem extrusion system
DP, = Convective diffusion device with temperature and pressure control devices
DP, = Rotational speed of the gear pump with AP = O
DP, = Collection of sampIe per unit time using a srnaII diarneter filament die
Plastication of the polyrner can be achieved by two heat sources in the system.
The primary source is the frictional heat generated by the rotation of the plasticating
screw in the first extnision barrel. The secondary source is the extemally mounted band
heaters. The band heaters are important in the start-up penod to promote easy rotation of
the plasticating screw. However, the band heaten cannot be the prirnary source of heat to
plasticate polymers because polymers are poor conductors. The mechanicd shear work
done on the polyrner by the motion of the screw makes a significant contribution to the
melting of the polymer pellets.
Formation of a single-phase polymer/gas solution requires an injection of a gas
into the molten polymer with the assistance of a convective diffusion device [53, 541.
The amount of gas is metered by a processor controlled gas injection syringe pump.
which supplies the gas at a high pressure into the plasticated polymer Stream in the
extruder forming a single-phase polymer/gas solution. As the polymer is conveyed in the
extruder barrel, the shear field generated by the plasticating screw stretches the gas
bubbles, ultimately breaking them into smaller bubbles. This process eventually leads to
dissolution of the gas into the polymer matnx. To further assist in the formation of a
consistent polymer/gas solution, a static mixer and band heaters can be used. The arnount
of CO2 injected into the Stream of polymer melt should be maintained below the
solubility limit because an excessive gas arnount would result in undesirable voids, which
alter the final product. The required gas flow rate c m be determined by specifying the
gas weight percentage based on the mass flow rate of the polymer/gas solution.
Therefore, close control of the gas-to-polymer weight ratio is important in the continuous
formation of the polyrner/gas solution.
Since the leakage between the inlet and outlet of the gear pump must be
minirnized to effectively measure the volumetric flow rate, precise pressure control is
needed. The second extruder with a large volume capacity can be used to reduce the
pressure fluctuations. The upstrearn pressure of the gear pump can be controlled by
varying the rotational speeds of the screws while fixing the gear pump speed. Changing
the cross sectional area of the variable resistance valve attached to the gear pump c m
control the downstream pressure.
In order to control the temperature, the second extruder and a heat exchanger
consisting of a homogenizing static mixer and a cooling channe1 can be utilized. The
temperature of the polymer melt flowing out of the plasticating extruder (i-e., the first
extruder) is typically very high. This high melt temperature can be lowered unifomly
while rnaintaining a high pressure by the second extruder. In order to reduce the
additional heating by the shear motion of the screw, the rotational speed of the screw for
the second extruder should be maintained low. The c o o h g of the melt using a second
extruder is effective only in a certain range. If the melt temperature is to be lowered
further, a heat exchanger can be also utilized.
When the system attains the desired temperature and pressure condition, the
volumetric flow rate G: the polyrner/COz solution can be determined by measuring the
rotational speed of the positive displacement gear pump. The specific volume can be
measured only when the pressure difference between the inlet and outlet of the gear pump
becomes zero, indicating there is no leakage. In order to mesure the volume flow rate of
the gear pump accurately, the volume displacement of a gear pump per revolution needs
to be calibrated. The calibration of the gear pump was conducted carefuIIy using a
separately designed setup, as described in the next section. Based on the calibrated
throughput of the gear pump, the specific volume can be determined by multiplying the
rotational speed of the gear pump by the volumetnc displacement per revolution of the
gear pump.
The mass flow rate can be determined by collecting the extruded melt for a fixed
time and measuring the weight. In order to facilitate the collection of extrudate for mass
flow rate measurement, a smail diameter filament die is attached at the end. Since gas
loss from the extruded foarn is inevitable 155, 561, the measurement of the mass flow rate
of a po1ymer/CO2 solution might not be accurate by simply weighting the collected
extrudate. It is suggested that gas loss be induced as much as possible by increasing the
temperature of the filament die and reducing the diameter of the die. Thus, the mass flow
rate of the polymer/C02 solution is calculated by adding the measured mass fiow rate of
the degassed polyrner and the mass flow rate of CO2, which is read from the synnge
PumP-
Based on the acquired volume and the mass flow rates at a given temperature and
pressure, the specific volume c m be calculated as the ratio of the mass flow rate to the
volume flow rate (Equation 3-3).
The design equation for the proposed design may be written as the foliowing:
In order to corne up with a good design, we should either have a decoupled design
(triangular matrix) or an uncoupled design (diagonal matrix). The gas injection, diffusion
in the solution formation device, and the measurement of volume and mass flow rates do
not affect the plastication because the polymer is completely plasticated by the screw
before the plasticated polymer reaches the gas injection system. Thus, the elements Al?,
Al3, and Al? are zero. The formation of a polymer/gas solution is a function of the screw
motion as well as the convective diffusion device and its temperature and pressure
control devices. The screw motion induces dif is ion of the injected gas. Thus, elements
AZI, and Aï should be non-zero. However, the formation of the polymerlgas solution is
not affected by the measurement of mass and volume fiow rates, The measurernent of
volumetric flow rate is affected by pressure devices and rotational speed of the gear
pump. In order to prevent leakage between the inlet and the outlet of the gear pump, the
difference in the inlet and outlet pressures of the gear pump should be zero. Thus,
elernents &, and A33 should be non-zero as well. The measurement of the mass flow
rate is only a function of a sample weight per unit time. According to these observations,
Equation 3.4 now becornes:
The design rnatrix shown above is triangular, which means that this design is
decoupled, This indicates that FRs of the overall designed system c m be controlied
independently by DPs and it is an acceptable design. Therefore, the design and strategies
for measuring the PVT properties are sound according to the first axiom of the axiomatic
design approach.
3.4 DETERMINATION OF THE POSITIVE DISPLACEMENT RATE OF THE
GEAR PUMP
The specific volume of a solution can be determined by v = Q /m. where Q is the
volumetric flow rate and m is the mass flow rate. Since we can readily obtain mass flow
rate by collecting the extrudate for a fixed time period and measuring the weight of the
degassed extrudate as desctibed in the previous section, Our research focused on the
measurement of the volume flow rate. A gear pump (Zenith PEP-II) is used as a positive-
dispIacement pump to feed the polymer/C02 solution. As a first step, the positive
volumetric displacement of the gear pump per revolution, a, needs to be determined.
Water and a vegetable oil are used to determine @ of the pump. Once the gear pump is
calibrated, the volume flow rate of a polymer/CO2 solution can be measured üccurately.
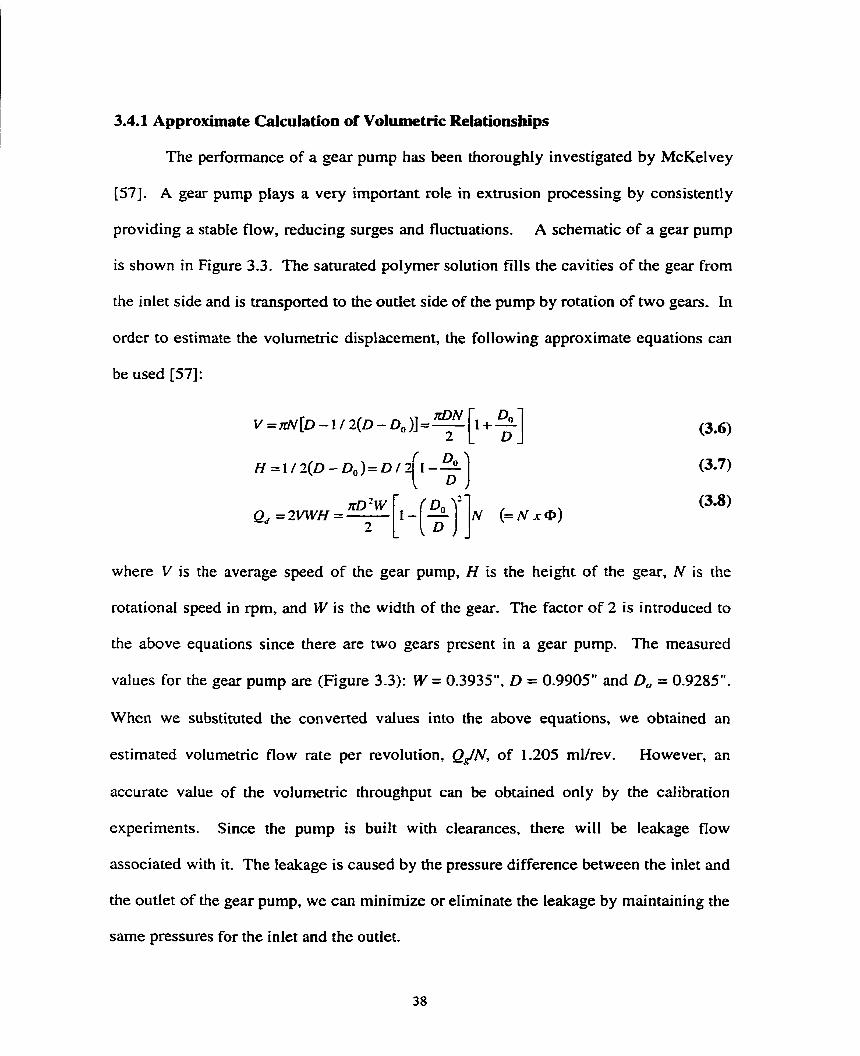
3.4.1 Approximate Calculation of Volumetric Relationsbips
The performance of a gear pump has been thoroughly investigated by McKelvey
1571. A gear pump plays a very important role in extrusion processing by consistently
providing a stable flow, reducing surges and fluctuations. A schematic of a gear pump
is shown in Figure 3.3. The saturated polymer solution fills the cavities of the gear from
the inlet side and is transported to the outlet side of the pump by rotation of two gears. In
order to estimate the volurnetric displacement, the following approximate equations can
be used [57]:
where V is the average speed of the gear pump, H is the height of the gear, N is the
rotationai speed in rpm, and W is the width of the gear. The factor of 2 is introduced to
the above equations since there are two gears present in a gear pump. The measured
values for the gear pump are (Figure 3.3): W = 0.3935", D = 0.9905" and Do = 0.9285".
When we substihited the converted values into the above equations, we obtained an
estimated volumetric flow rate per revolution, Q&V, of 1.205 mlhev. However, an
accurate value of the volumetric throughput can be obtained only by the calibration
experiments. Since the pump is built with clearances, there will be leakage flow
associated with it. The ieakage is caused by the pressure difference between the inlet and
the outlet of the gear pump, we c m minimize or eliminate the leakage by maintaining the
same pressures for the inlet and the outlet.
3.4.2 Calibration of the Gear Pump
In order to accurately determine the volume flow rate per revolution of the gear
pump, (@ = 0, the gear pump was calibrated experimentally. A separate setup is
constmcted to calibrate the gear pump as shown in Figure 3.4.
A syringe pump (ISCO 260D) that c m detect the volumeuic displacement
accurately is attached to the gear pump and two pressure gauges (Wika Instruments
213.53) with the maximum pressure of 206.8 kPa (30 psi) are installed at the inlet and
outlet of the gear purnp. A commercial needle valve (Sno-Trik SS-410-FP) is used as a
variable resistance valve to control the downstream pressure.
The rationaie of the calibration setup is that the amount of liquid going through
the gear pump can be metered by the syringe pump as long as there is no leakage flow
across the gear pump. Since the leakage flow occurs when there is a pressure difference
across the pump, the downstrearn pressure needs to be adjusted to be the same as the
upstrearn pressure by varying the resistance of valve. The control pararneters for the
calibration experiment are the volumetnc flow rate of the syringe pump (Q,), the
rotational speed of the gear pump (N}, and the resistance of the valve. The output
parameters are the pressure of synnge pump (P,), the inlet pressure of gear pump (P,),
and the outlet pressure (P,) of the gear pump.
When liquid flows, the pressure drops from P, at the synnge pump to P, at the
upstream of the gear pump because of resistance. The volume flow rate in the gear pump
(Q,) can be detemined from the volume flow rate in the syringe pump (Q,) and
consideration of the pressure difference and the compressibility of liquid using Equation
3 -9:
Q, mg v, v Volume of liquid ut P = P; (= P, ) = = R = Voirne of liquid at P = P,
(3.9) Qs &Y, vs
where h, and mg are mass flow rate of the syringe pump and the gear pump, respectively.
Calibration experiments are conducted with water and vegetable oil at various
speeds of the gear pump at room temperature (23°C 4- 1 OC). The volume flow rate of
water in the gear pump (Q,) is calculated using the bulk-modulus correction method and
the PVT properties of water [58]. Since the PVT properties of the vegetable oil are not
available, an experiment was conducted to determine the ratio of volumes at two different
pressures (Equation 3.9) using a syringe pump as shown in Figure 3.5. The rneasured
voiurne of oil as a function of pressure is shown in Figure 3-6. Using these results by
logarithmic regression curve fitting and Equation 3.9. the volume flow rate of oil in the
gear pump (Qg) is calculated based on the experimental data. Al1 the acquired data for
the calibration experiment are shown in Tables 3.1 and 3.2 for water and oil, respectively.
The flow rates of water and oil through the gear pump (Q,) are ploned against the
rotational speed (N) in Figures 3-7 (a) and (b), respectively. The volume throughput per
revolution of pump (8 =Q#'V) is calculated from these curves by fitting a linear
regression line. For both cases, Q, is estimated to be 1.170 rnE/rev.
In order to determine the accuracy of the rneasured volume displacement of the
gear pump, an error analysis is conducted for the calibration experiments with water and
vegetable oil. Even though the calibration experiment is conducted while maintaining the
same inlet and outlet pressures, there would be some leakage of low viscous water and oil
if there are any pressure difference because of inaccuracy of the pressure gauges. In
order to calculate the error associated with the inaccuracy of the pressure gauge reading,
a dynamic leakage flow analysis is conducted using the setup shown in Figure 3.8. When
the gear pump is running in this setup, the downstream pressure increased, In order to
avoid vacuuming in the upstrearn pressure, the whoie system is initially pressurized by
the syringe pump. Since the net flow of liquid in the gear pump is zero, the amount of
liquid pumped by the gear pump wouid be baianced by the Ieakage from downstream to
upstream dce to the pressure difference. Therefore. these results show the amount of
leakage flow (Q,) due to a pressure difference for each liquid. The results are shown in
Figures 3.9 (a) and (b) for water and oil, respectively. Even though a higher order
polynomial fit (Le., a order polynomial fit) may be better in describing the results, the
plots were linearly fitted to correlate the data of pressure difference to the two different
parameters of the gear pump speed and leakage flow rate shown in the vertical axis. For
a pressure gauge error range of +/- 0.689 kPa (O. 1 psi), the corresponding leakage flow
rate would be +/- 0.033 rnVmin and 0.003 mumin for water and oil, respectively. This
means that when we masure the flow rate at 10 mumin, the actual flow rate could be 10
+/- 0.033 mumin and 10 +/- 0.003 mumin for water and oil, respectively. When al1 the
flow rates of water shown in Figure 3.9 are corrected to the maximum and minimum
values because of the leakage flow. the values of Q/!V for water is changed by +/- 0.001
mUrev. However, the values of Q#V for a vegetable oil are not changed by the leakage
flow which would have been caused by inaccuracy of the pressure gauges.
The fluctuation of the gear pump speed could also have affected the accuracy of
the measurements. The fluctuation of the gear pump speed is in the range of +/- 0.03
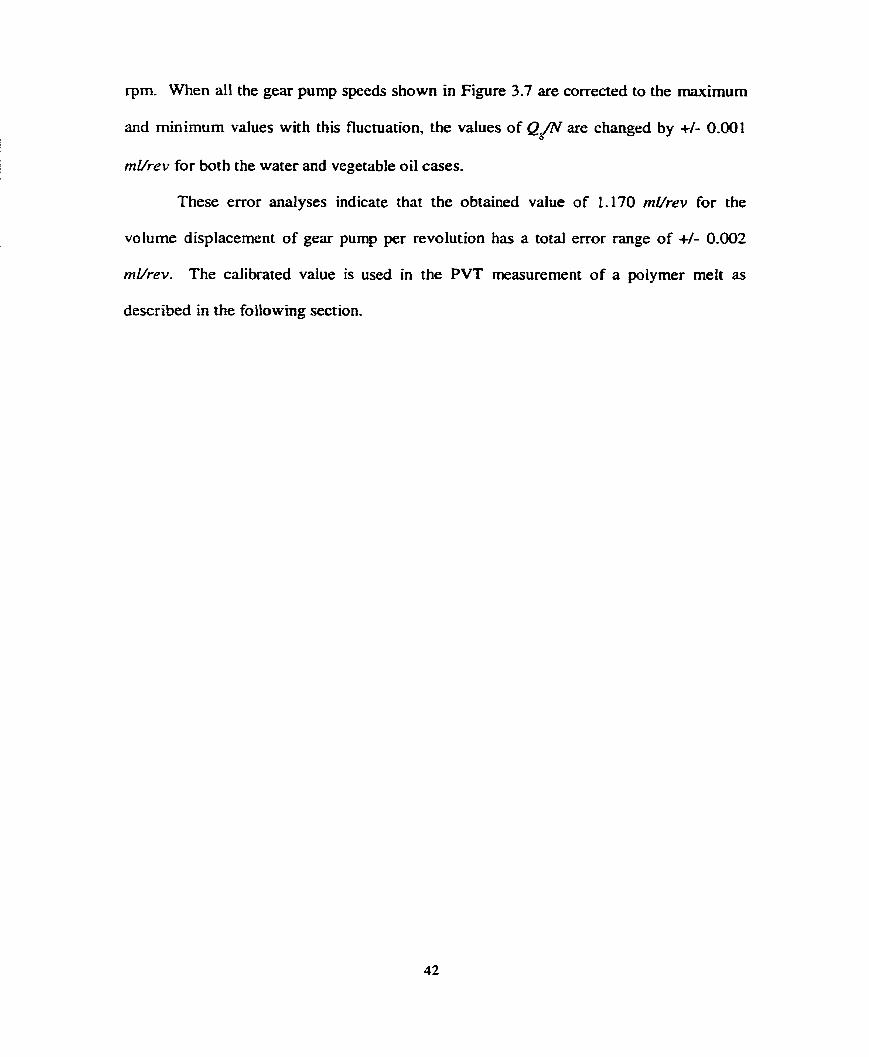
rpm. When al1 the gear pump speeds shown in Figure 3.7 are corrected to the maximum
and minimum values with this fluctuation, the values of Q/V are changed by +/- 0.001
mUrev for both the water and vegetable oil cases.
These en-or analyses indicate that the obtained value of 1.170 rnVrev for the
volume displacement of gear pump per revolution has a total error range of +/- 0.002
mUrev. The calibrated value is used in the PVT rneasurement of a polymer melt as
descnbed in the followmg section.
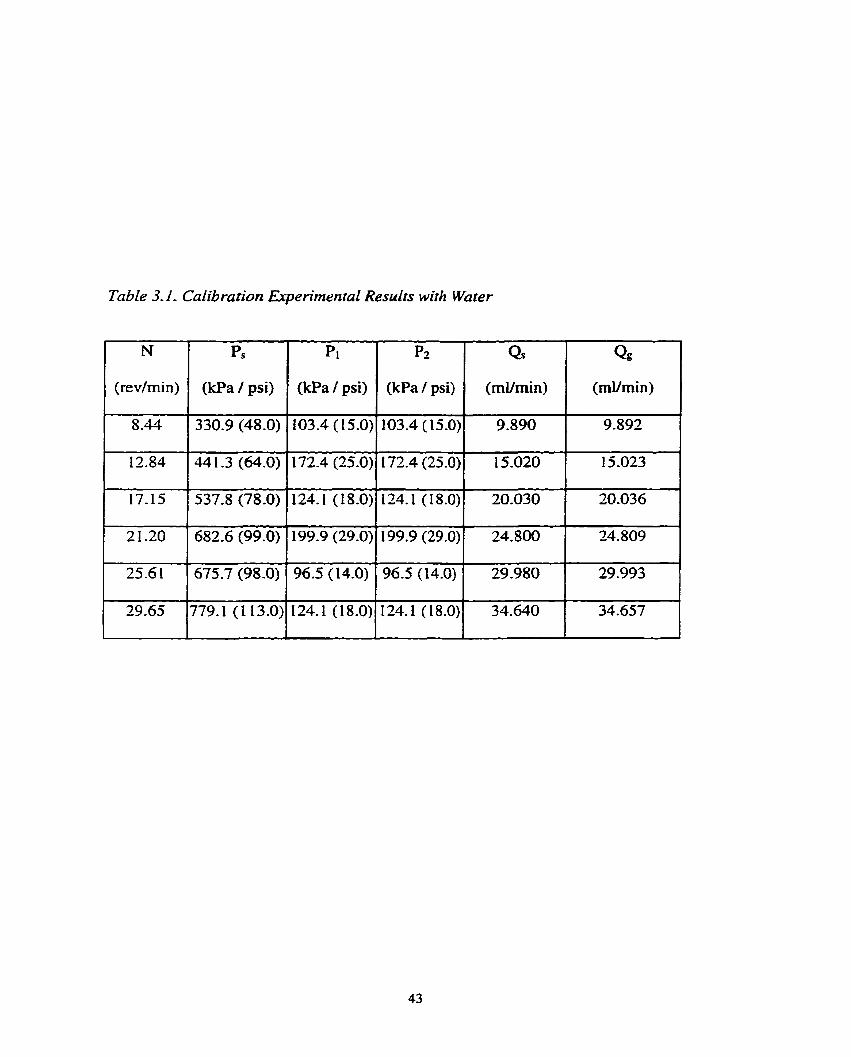
Table 3.1, Calibration Experimental Resulrs wirh Wuter
N
(revhin)
8.44
12.84
[ 17.15 /537.8(78.0)~124.1(18.0)~124.1(18.0)) 20.030 1 20.036 I
PS
(kPa / psi)
330.9 (48.0)
44 1 -3 (64.0)
&
(mVmin)
9.892
1 5-023
PI
(kPa / psi)
103.4 (15.0)
172.4 (25.0)
p2
(kPa / psi)
103.4 (15.0)
172.4 (25.0)
Qs
(mumin)
9.890
15.020
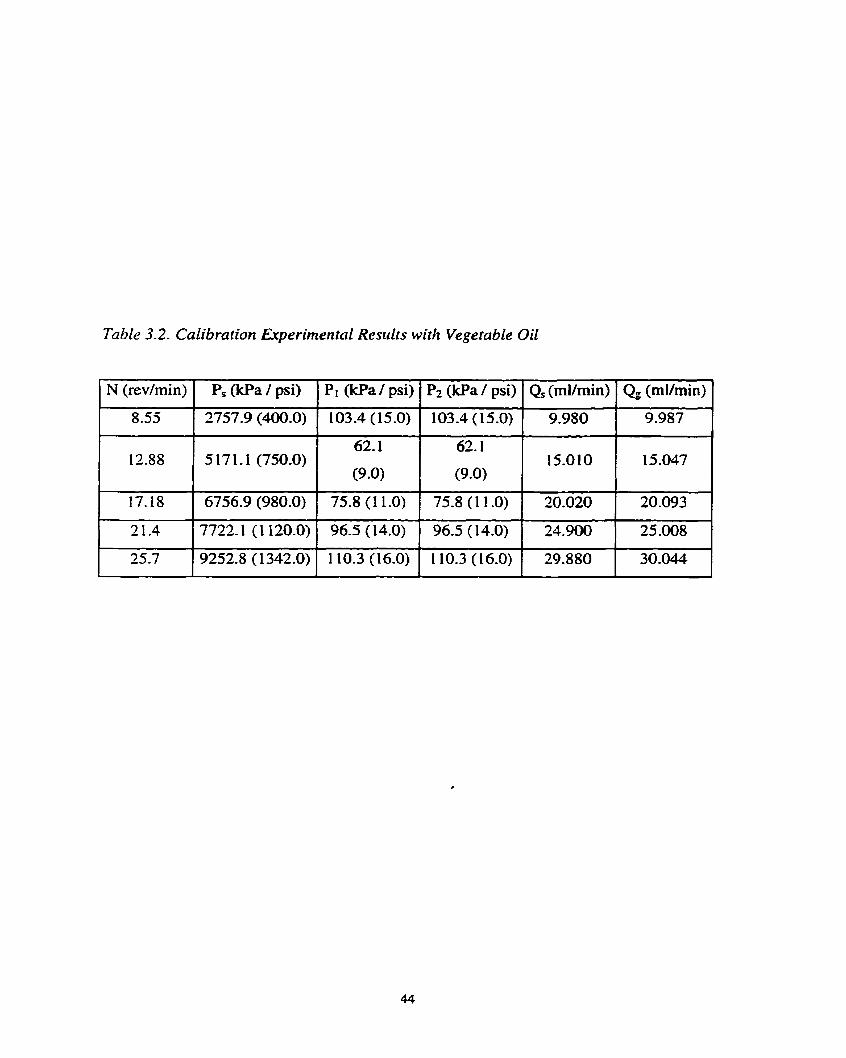
Table 3.2. Calibration Erperimental Rescrits with Vegetabie Oil
1 N (revhin) 1 P, (kPa I psi) 1 PI (kPa I psi) 1 Pz &Pa / psi) ~=(mVrnin) Q, (ml/m%) C
103.4 (1 5.0) 9.980 9.987
-- - - - - -
Axiomatic Design of a PVT Measuring Apparatus
Calibration of the Gear Purn p
1
i 1 t Apparatus Setup 1
I PVT Measurements for Pure Polymer for Verification of the Systern
b y Corn parison and EOS Modeling
P V T Measorement of Polym erlGas Solutions i 1
Figure 3.1. Overall Strrrtegy
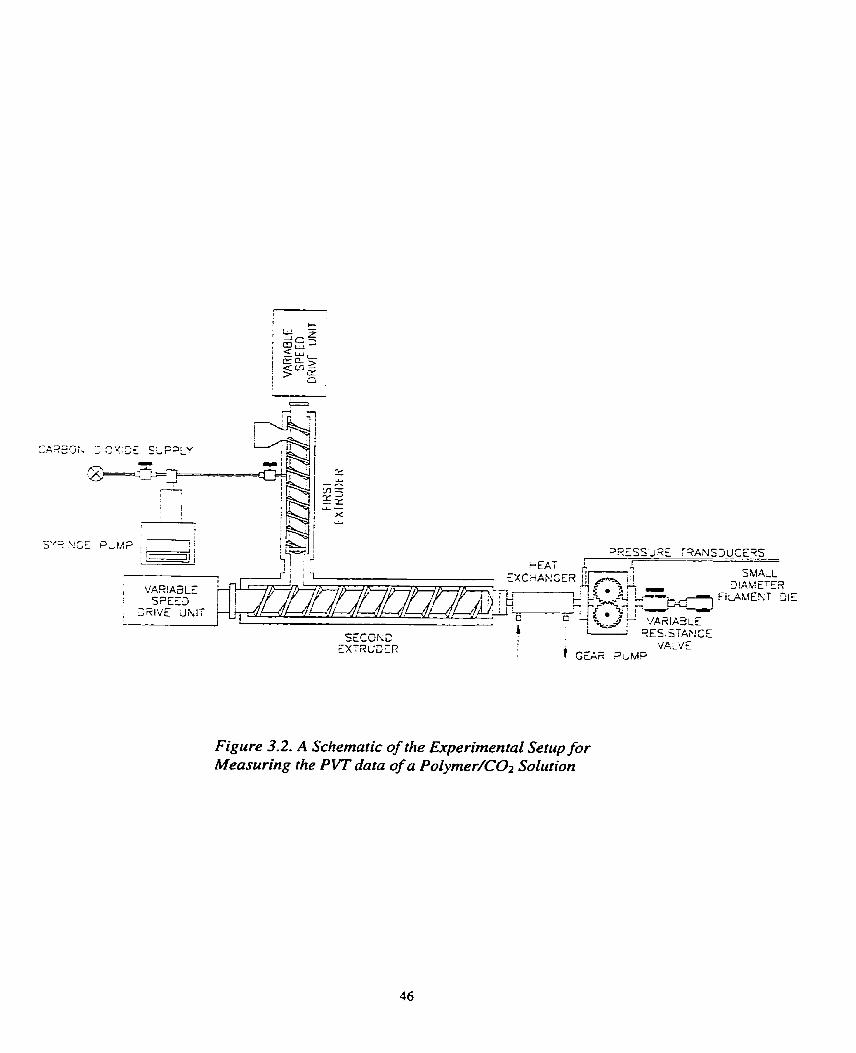
Figure 3.2. A Schematic of the Experimental Setup for Measuring the P VT data of a PolymerKO* Solution
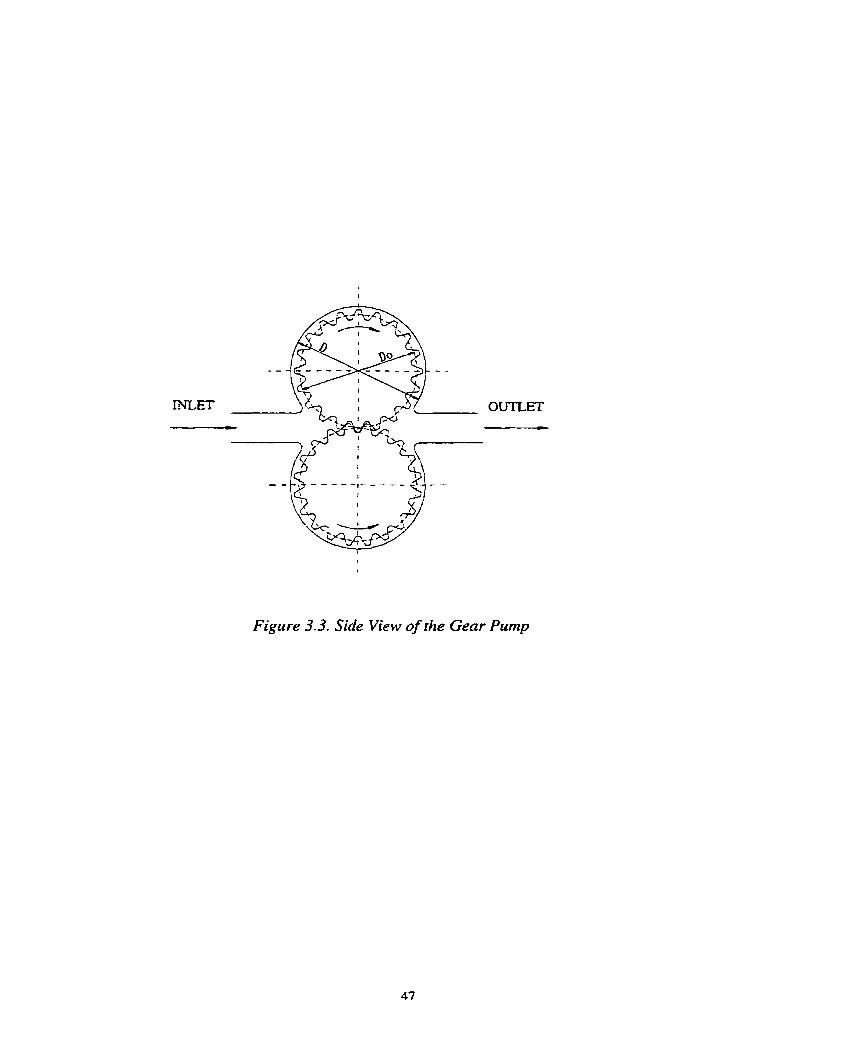
Figure 3.3. Side View of the Genr Prtmp
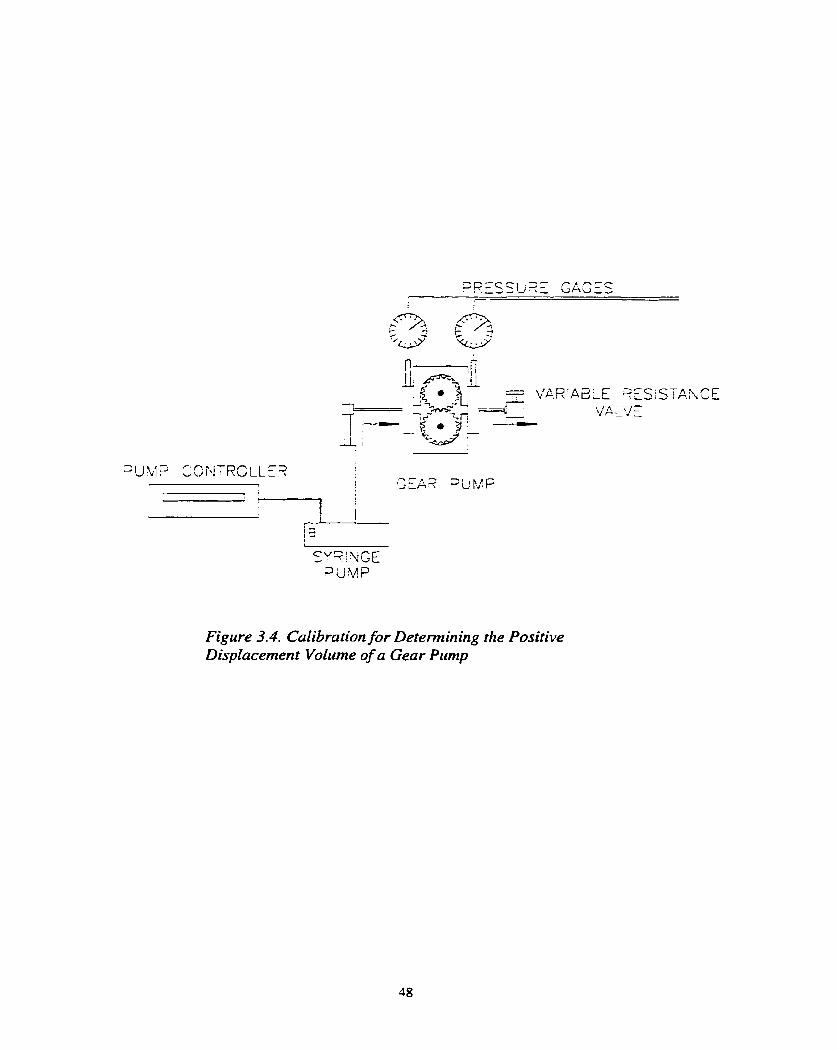
Figure 3.4. Calibration for Deteminhg the Positive Displacement Volume of a Gear Pump
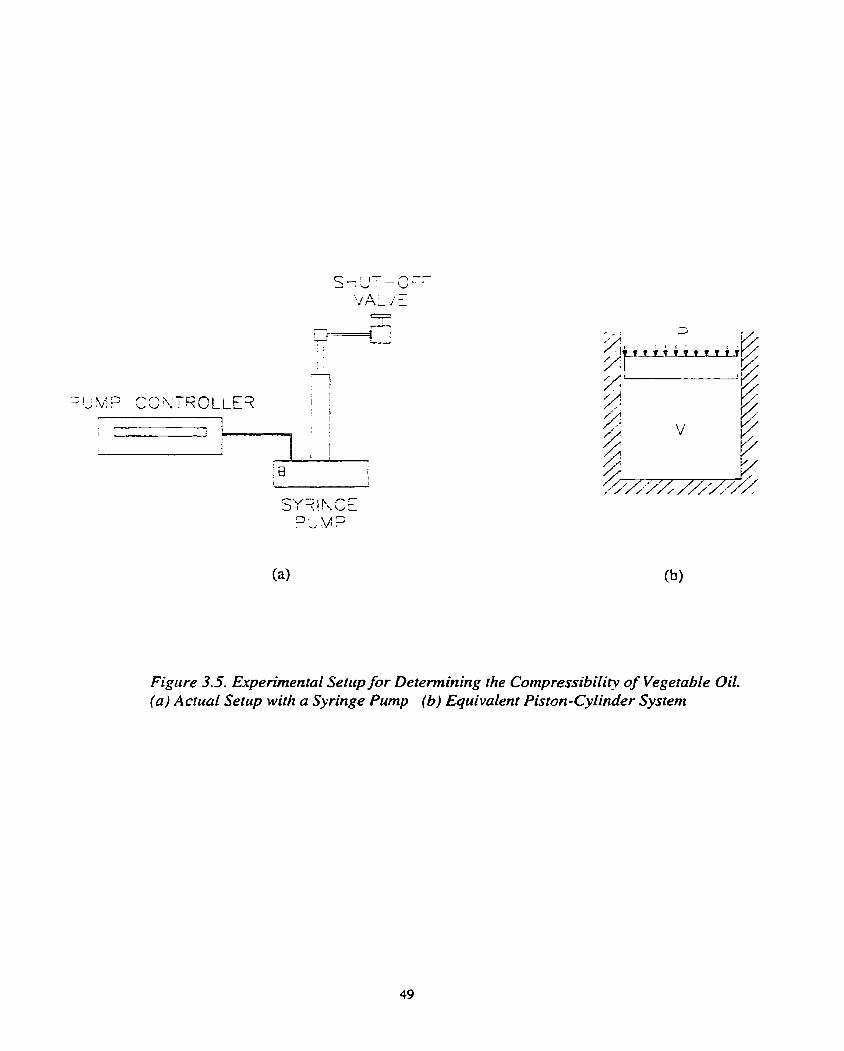
Figure 3.5. Ejcperimental Setup for Determin ing the Compressibility of Vegetable Oil. (a ) Actual Setup with a Syringe Pump (6) Equivalent Piston-Cylinder Sysrenr
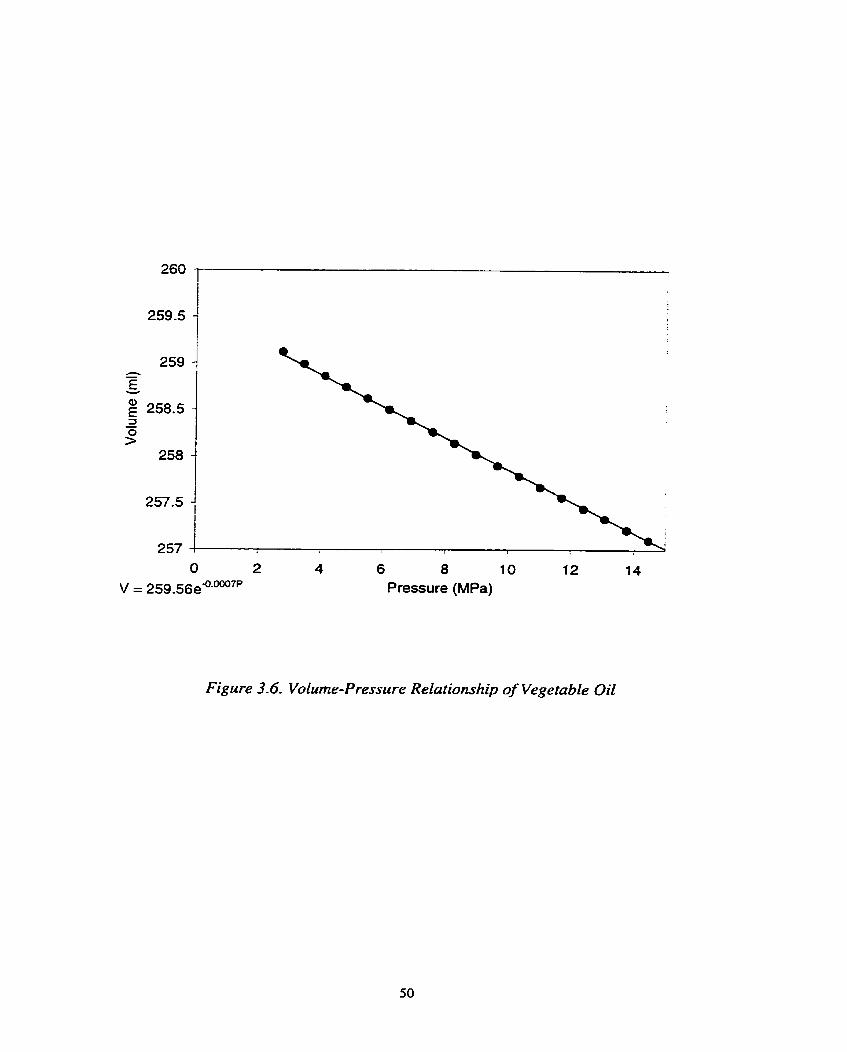
V = 259-56e4-0007P Pressure (MPa)
Figure 3.6. Volume-Pressnre Relationship of Vegetable Oil
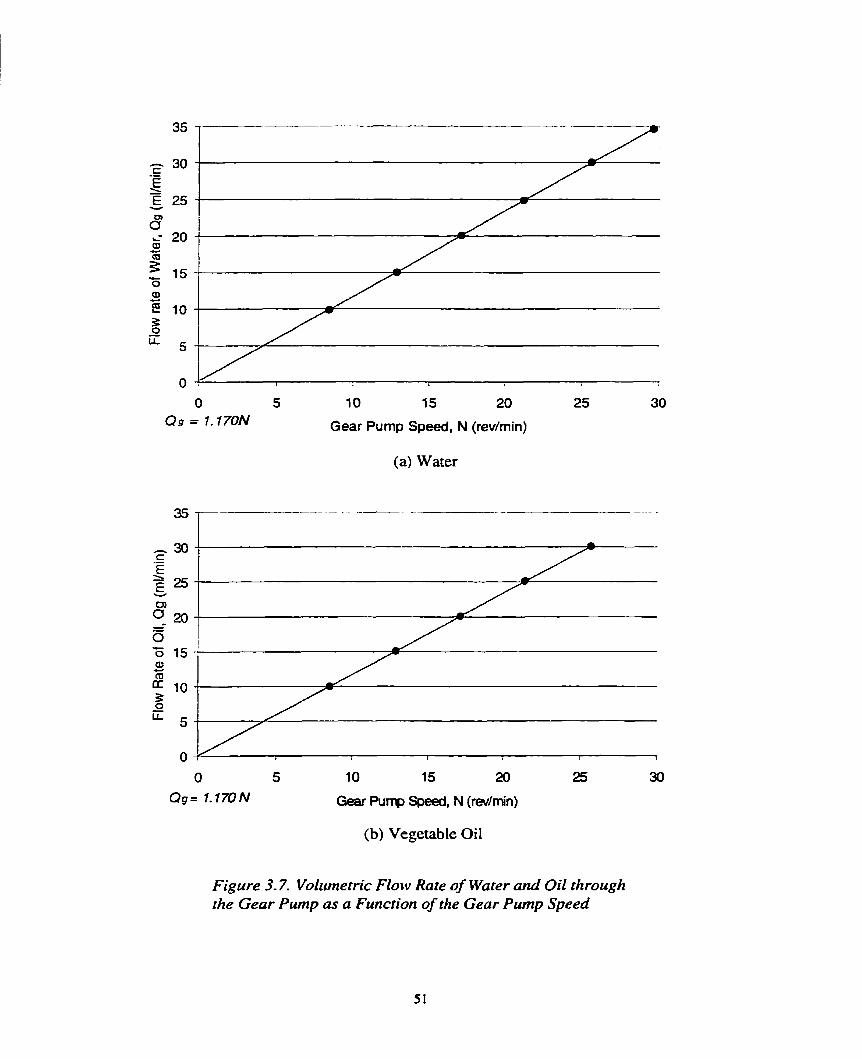
Gear Pump Speed, N (revhin)
(a) Water
10 15 20
Gear Pump Speed, N (revhin)
(b) Vegetable Oil
Figure 3.7. Volrïmerric Flow Rate of Water and Oil through the Gear Pump as a Function of the Gear Pump Speed
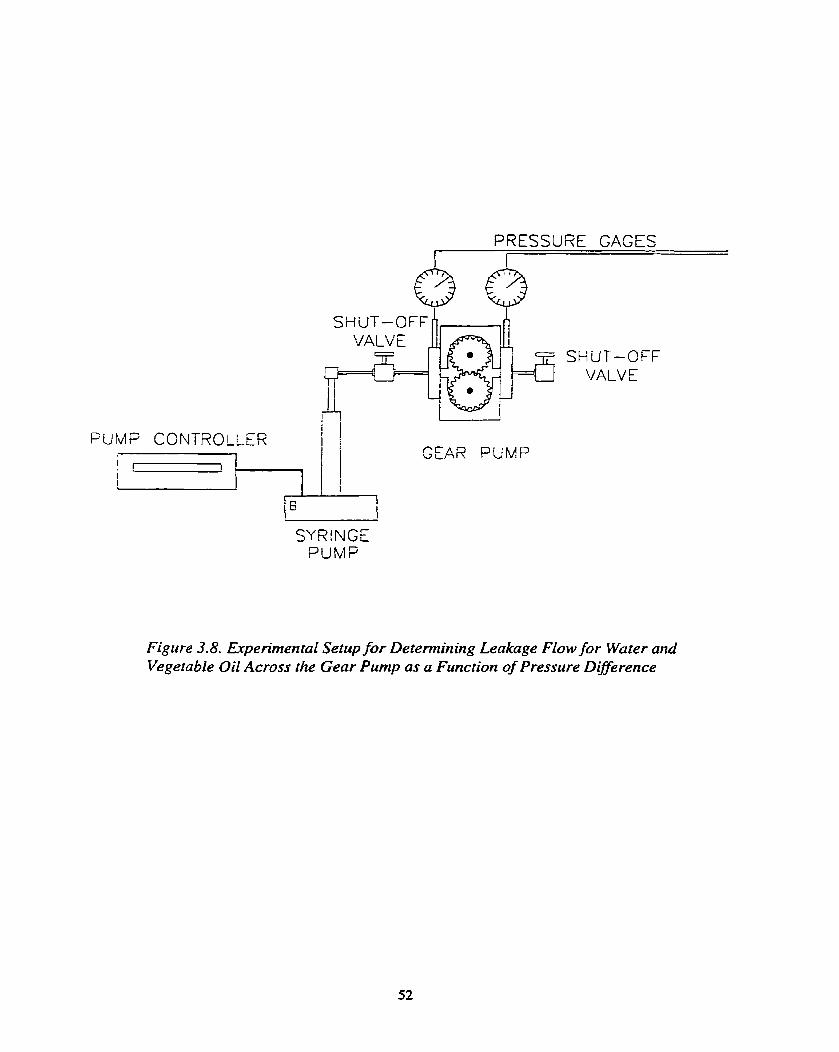
PRESSURE GAGES
SHUT-OFF VALVE
FUMP CONTROI LER VI--$, SEAS PUMP
SYRlNGE PUMP
Figure 3.8. Expeninental Setup for Detennining Leakage Flow for LVater and Vegetable Oil Across the Gear Pump as a Funcrion of Pressure D~rerence
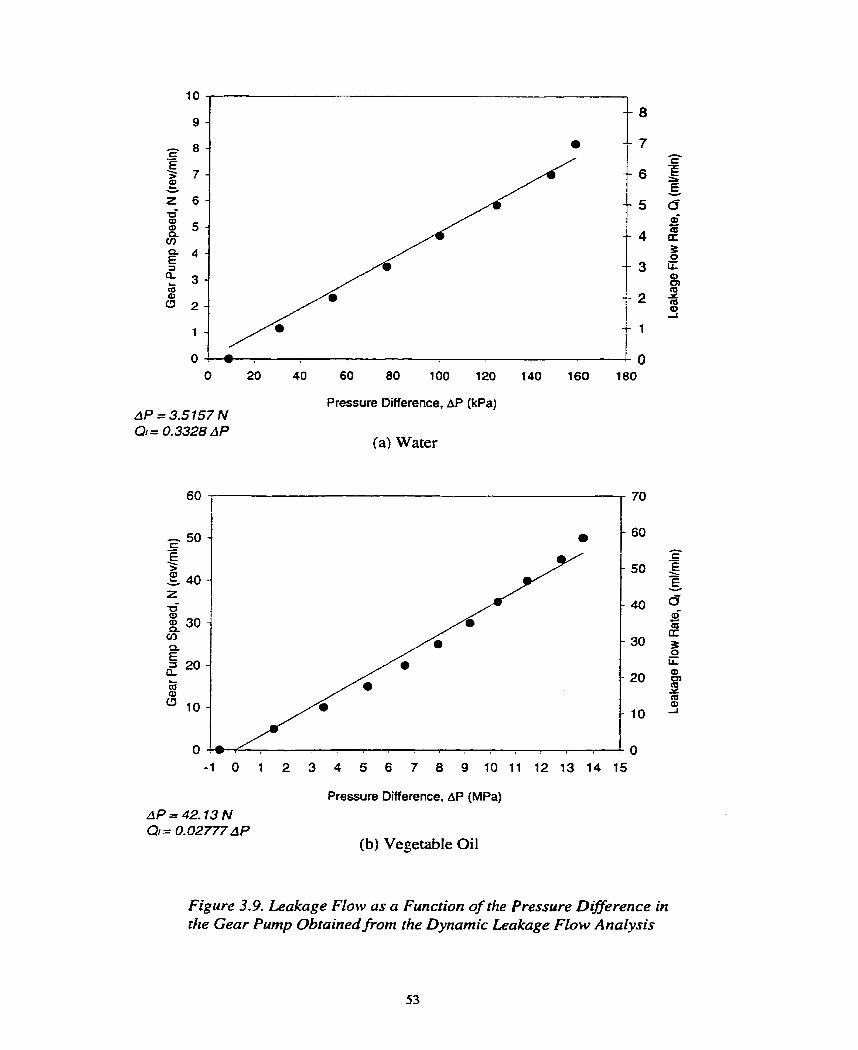
Pressure Difference, AP (kPa) AP = 3.5157 N QI = O. 3328 A P
(a) Water
Pressure Difference. AP (MPa)
(b) Vegetable Oil
Figure 3.9. Leakage Flow as a Function of the Pressure Dzrerence in the Gear Pump Obtained front the Dynamic Leakage Flow Analysis

MEASUREMENT AND MODELING OF THE PVT
RELATIONSHIP~ OF PURE POLYMER MELTS
This chapter describes the verification of the dilatometer designed for the
rneasurement of the PVT properties of po1ymer/CO2 solutions by using the system for pure
polymer melts. Various pure polymers such as Iinear polypropylene (PP), polystyrene (PS),
Iinear polybutylene succinate (PBS) homopolymer, and branched PBS were used to validate
the accuracy of the system by comparing the data obtained with the new method to data from
the literature that were measured by the conventional bellows type method. Furtherrnore,
modeling of the experimental data with the FOV, MCM, and S-L EOS are presented.
Mathematically acquired EOS based on the experimental data enables prediction of the PVT
behaviour within and beyond the experimental ranges of pressure and temperature.
4.1 EXPERIMENTAL SETUP
The PVT measurement system was constmcted based on the schematic design shown
in Figure 3.2, which was derived from the axiomatic design approach analysis. Figure 4.1
shows a photograph of the actual setup. In the verification experiments with pure polymer
met ts, the gas was not injected. The apparatus was based on a tandem extruder that consisted
of two extmders, which were attached side-by-side. The first extruder was a %" diarneter
extruder (Brabender: 05-25-000) with a mixing screw (Brabender: 05-00-05 1) which has an
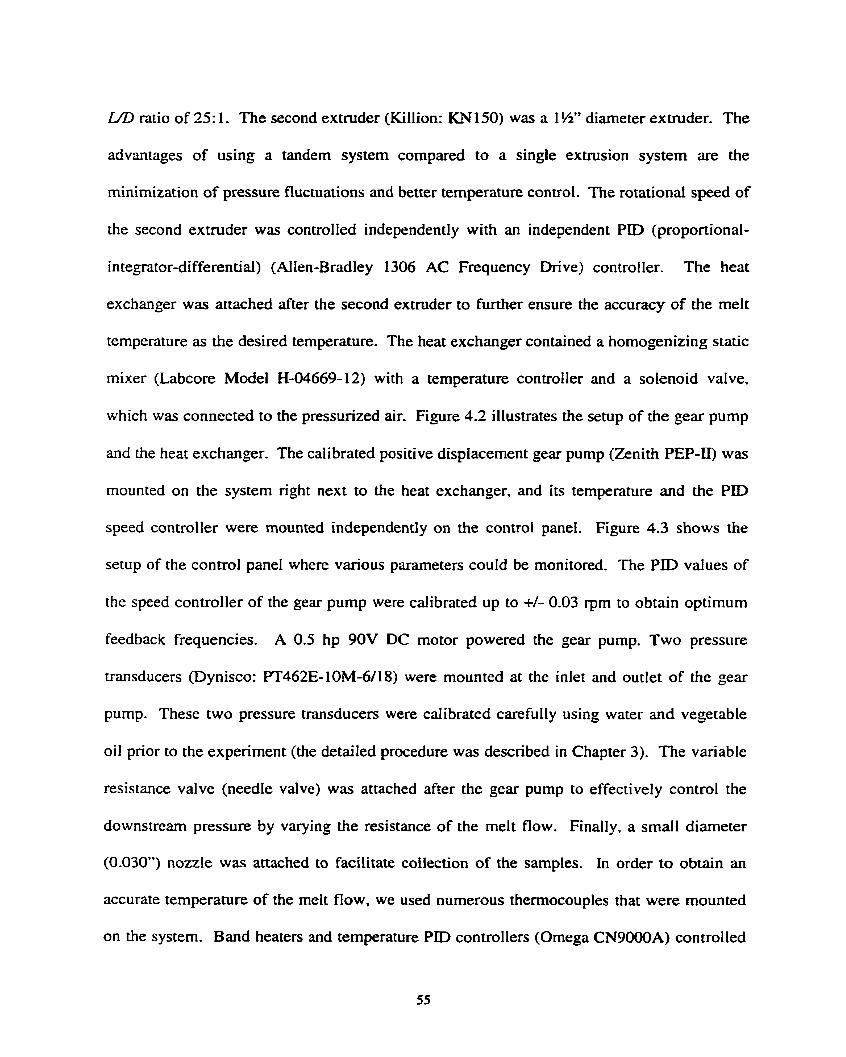
Uû ratio of 25: 1, The second extruder (Killion: KNISO) was a l W diameter extruder. The
advantages of using a tandem system compared to a single extrusion system are the
rninimization of pressure fluctuations and better temperature control. The rotationai speed of
the second extruder was controlled independently with an independent PID (proportional-
integrator-differentid) (Allen-Bradley 1306 AC Frequency Drive) control ler. The heat
exchanger was attached after the second extruder to m e r ensure the accuracy of the melt
temperature as the desired temperature. The heat exchanger contained a homogenizing static
mixer (Labcore Mode1 H-04669-12) with a temperature controller and a solenoid valve,
which was connected to the pressurïzed air. Figure 4.2 illustrates the setup of the gear pump
and the heat exchanger. The calibrated positive displacement gear pump (Zenith PEP-II) was
rnounted on the system right next to the heat exchanger, and its temperature and the P D
speed controller were mounted independently on the control panel. Figure 4.3 shows the
setup of the control panel where various parameters could be monitored. The Pm values of
the speed controller of the gear pump were calibrated up to +/- 0.03 rpm to obtain optimum
feedback frequencies. A 0.5 hp 90V DC motor powered the par pump. Two pressure
transducers (Dynisco: PT462E-10M-6/18) were mounted at the inlet and outlet of the gear
purnp. These two pressure tnnsducers were calibrated carefully using water and vegetabie
oil prior to the experiment (the detailed procedure was described in Chapter 3). The variable
resistance valve (needle valve) was attached after the gear pump to effectively control the
downstrearn pressure by varying the resistance of the melt flow. Finally, a small diameter
(0.030") nozzie was attached to facilitate coilection of the samples. In order to obtain an
accurate temperature of the melt fiow, we used numerous themocouples that were mounted
on the system. Band heaters and temperature PID controllers (Omega CN9000A) controlled
the temperatures of the difision enhancing device, the variable resistance valve, and the
nozzle. The extrudated sarnple was measured using a precise micro-balance (Mettler Toledo
AB204). The micro-balance was calibrated up to +/- 0.000 1g accuracy prior to the
experiments.
4.2 MATERIALS
The polyrneric materials used in this study were isotactic PP (Boredis AG, Daplen
DM55), PS (Japan Polystyrene Inc., G440K), linear PBS (Showa Highpolyrner, Bionelle
# 1003), and branched PBS (Showa Highpolyrner, Bionelle #1903).
PP is polyrnerized from the organic compound propylene (CHyCH=CH2) and has
a methyl group (-CH3) branching off of every other carbon along the molecular backbone.
Since the methyl groups of polypropylene are located on one side of the carbon backbone,
polypropylene molecules tend to be highly aligned and compact. Because of these reasons,
PP has excellent chernical resistance, is strong, and has the lowest density of the plastics
used in packaging. In addition, the material has a high melting temperature and is very
economical.
PS, produced from styrene (C6H5CH=CH-), has phenyl groups (six-member carbon
ring) attached in random locations along the carbon backbone of the rnolecule- The random
attachment of benzene prevents the molecules from becoming highly aligned- As a result.
polystyrene is an amorphous, transparent, and somewhat bt-ittle plastic. PS is a very versatile
plastic that can be rigid or foamed. It has a relatively low plasticating point compared to
other thennoplastic materiais. A specific PS supplied from the Japan Polystyrene Inc. was
chosen for the experiment because the resin manufacturer supplied its PVT data to be
cornpared with our experimental data. In addition, PS is commonly used in plastic foam
processing with CO2.
PBS is a thennoplastic aliphatic polyester produced through the chemicd reaction and
polycondensation of a glycol with an aliphatic dicarboxylic acid. PBS is stable in the
atmosphere but biodegradable in compost, wet soil, fresh water, seawater and activated
sludge, where a large number of microorganisms are present. Linear PBS material is a
biodegradable polyester with good stiffness. The material is not as viscous as PP or PS.
Branched PBS materid was aiso used to investigate the effect of the branching on the PVT
properties by comparing with the linear PBS. This material has excellent foamability and is
quite ductile.
The material properties of these polymers are summarized in Table 4.1. Both the
linear and branched PBS materiais were dried pnor to the experiment because of their
hygroscopic nature, and PP and PS materials were used as received.
4.3 EXPERIMENTAL PROCEDURE
The general procedure to measure the PVT properties of a pure polymer melt is
shown in Figure 4.4. Prior to the experiments, both the linear and branched materials were
dried because they are very hygroscopic, Le., absorbs moisture easily. The absorption of
moisture into the materials may pose some problems during the extrusion process because the
rnoisture causes oxidation of the material that dramatically degrades the material. For this
reason, the pellets were dried in a vacuum oven for a period of 4 hours at 90°C. Then, the
dried PBS pellets were fed into the hopper. To further minimize atmospheric contact,
nitrogen gas was continuously fed into the hopper to prevent absorption of moisture. On the
other hand, PP and PS pellets were fed directly into the barre1 through the hopper of the first
extruder without drying. The pellets were completely melted by the screw motion of the first
extruder. The molten polyrner was transferred to the second extruder, and the melt went
through the second extruder and the heat exchanger to decrease the temperature of the meit
uniforrnly. The melt reached the gear pump at a desired temperature and pressure at which
time the experiments were conducted-
At a fixed gear pump speed, the upstream pressure of the gear pump was initiaily set
to be close to the desired pressure by varying the rotational speed of the second extruder.
Then, the downstream pressure was controlled to be close to the desired pressure by turning
the variable resistance vdve. When the upstream and downstream pressures were close to
the desired pressure, the second extruder screw speed and the variable resistance valve were
again minutely varied to equalize these pressures. It should be noted that the upstream and
downstream pressures could not be made the same as the desired pressure with a single
adjustment because of the unavoidable leakage across the gear pump. By accurately
controlling upstream and downstrearn pressures, the desired pressure was achieved for both.
In order to investigate the effects of the rotational speed of the gear pump on the PVT data,
experiments were conducted at three different rotational speeds for PS, linear PBS, and
branched PBS. Three sets of the rotation speeds were performed for the expenments: for PS
the speeds were 15, 20 and 25 rpm and for linear and branched PBS the speeds were 5, 10,
and 15 rpm.
When a steady-state condition was achieved at each temperature, pressure, and gear
pump speed, the mass flow rate was measured by collecting the extrudate for a fixed time and
weighing it. The volume flow rate was calculated to be the gear pump speed rnultiplied by
the gear pump throughput per revolution that was determined in Chapter 3. The specific
density was caiculated as the ratio of the mass flow rate to the volume flow rate.
For PP, the selected melt temperatures were 180°C, 190°C, 200°C, 2 10°C and 230°C.
The selected gear pump pressure in the experiments with PP was in the range of 6.9 MPa to
29.6 MPa (1000 psi to 4300 pso-
For the case of PS, the selected melt temperatures were 180°C, 200°C, and 220°C.
The selected gear pump pressures in the experiments were 13.78 MPa (2000 psi), 20.68 MPa
(3000 psi), and 27.58 MPa (4000 psi).
For the cases of linear and branched PBS, the selected melt temperatures were 147"C,
1 57"C, 167°C and 177°C. The selected gear pump pressures in the experiments were 13-78
MPn (2000 psi), 20.68 lMPa (3000 psr], and 27.58 MPa (4000 psi).
4.4 RESULTS A i i DISCUSSION
Four series of experirnents were conducted to measure the specific volumes of PP,
PS, linear PBS and branched PBS. The experimental results were compared to the
conventionaily measured PVT properties in order to verify the system design. Finally, the
measured PVT properties in the melt state were correlated using three different EOS models:
FOV (Equation 2.9), MCM (Equation 2-10)? and S-L EOS (Equation 2.14). The correlated
reduced constants were acquired by using the l e s t squares method based on the Marquardt-
Leven berg algorithm [59,60].
Polvpropvlene
We measured the PVT properties of linear PP at the steady-state condition, and the
results are plotted in Figure 4.5 and tabulated in Table 4.5. Figures 4.6 (a), (b), and (c) show
the fitted models using FOV, MCM, and S-L EOS, respectively. The measured specific
volume properties of PP were also cornpared to the work of Sato et ai. [i9] in Figure 4.7.
Although the two data sets were well matched in general, the experimental data measured at a
low temperature of 180°C fluctuated slightly because of the fluctuations in the pressures in
the extruder barrels at a lower temperature. The slight deviation motivated fùrther study of
other effects, such as the effect of the speed of the gear pump, with other materials.
Polvstvrene
The measured data of PS are tabulated in Table 4.6 and plotted in Figure 4.8. Figures
4.9 (a), (b), and (c) show the fitted models using FOV, MCM, and S-L EOS, respectively.
The measured PVT properties of PS were also compared to the manufacturer's reference data
(Table 4.7) in Figure 4.10. A minute upward deviation between the two data sets was
observed. It was speculated that this deviation was due to a slight increase in the melt
temperature through friction in the gear pump.
Linear PBS
The measured data of linear PBS are tabulated in Table 4.8 and plotted in Figure 4.1 1.
Figures 4.12 (a), (b), and (c) show the fitted models using FOV, MCM, and S-L EOS,
respectively. The cornparison between the experimental data and the manufacturer's data is
depicted in Figure 4.13. Our experimental data has small deviations (up to 0.005 cm3/$
compared to the manufacturer's data, This small discrepancy may have k e n used by
experimental errors. However, the validity of the manufacturer's data shouId be confimed.
Furtherrnore, the way we have interpreted the manufacturer's data may have caused
significant errors, since the data we acquired from the manufacturer were in a graphical
format. Nonetheless, the discrepancies are quite srnall and the stopes of the experimental
data are consistent with each other.
Branched PBS
The PVT experimental results for branched PBS are shown in Figure 4.14. Figures
4-15 (a), (b), and (c) show the fitted models using FOV, MCM, and S-L EOS, respectively.
The tabulated experimental data are shown in Table 4.9. The PVT properties of the branched
PBS were compared to those of the Iinear PBS in Figure 4.16. The deviation was expected
and this deviation rnay be due to branching of mers.
4.4.1 System VeriFtcation
The specific volume of polyrner melt was observed to be a very sensitive function of
pressure and temperature. The experimental results indicate that the developed system
accurately measured the specific volume of a polyrner melt at a high temperature and high
pressure in the range of extrusion and injection molding processing. The experimentd results
for most materiah showed good agreement with the reference data measured by the
conventional beilow type dilatometer. The deviation measured for the Iinear PBS needs
further clarification.
4.4.2 Effect of the Gear Pump Speed On the Measured Specific Volume
The effect of the rotational speed of the gear pump on the measured PVT properties
was investigated. We acquired the data at three different rotationai speeds (Le-, 15, 20, and
25 rpm) of the gear pump. As the gear pump speed increased, both the mass and volume
flow rates of the melt increased. Figure 4.17 shows the mass flow rates of PS melts as a
function of the gear pump speed at various temperatures and pressures.
Since the specific volume of polyrner is calculated as the ratio of the volume flow rate
to the mass flow rate, the gear pump speed is not supposed to affect the measured specific
volume.
From Equation 4.1, the specific volume can be calculated from the ratio of the mass flow rate
to the gear pump speed, or equivalently, from the slope in the graph of the mass flow rate
versus gear purnp speed shown in Figure 4.17. Therefore, the specific volume can be
determined from each set of the gear pump speed and the determined m a s flow rate. The
average of the values measured for al1 gear pump speeds was taken as the specific volume for
each temperature and pressure. Another way of detemining the specific volume is to take
the dopes of the fitted lines of m = UN using the l e s t squares method as shown in Figure
4.17. Al1 these specific volumes are included in Tables 4.6, 4.8, and 4.9 for PS, linear PBS,
and branched PBS, respectively. In this study, the value determined from the fitted line was
selected as the specific volume at each temperature and pressure. The error range due to the
change of the gear pump speed for PS, as a case example, is depicted in Figure 4.18.
4.4.3 Effect of Friction in the Gear Pump on the Measured Specific Volume
The friction generated in the gear pump may aFfect the temperature of the melt (or the
solution), and thereby the measured specific volume. Figure 4.19 depicts a schematic of the
energy balance on the gear pump system. Since, the pressure difference between the inlet and
outlet of the gear pump is assumed to be zero, the following energy balance applies:
where w is the rate of energy transferred from the electric motor through friction and QcooIhg
is the rate of heat transferred to the cooling water running in the gear pump. The parameter h
is the enthalpy and C, is the specific heat capacity. Equation 4.4 indicates that if the amount
of cooling is insufficient, the temperature of melt across the gear pump will increase.
Accurate analysis of the heat transfer was very difficult due to various heat transfer effects.
But we measured the temperature difference between the inlet (TI) and the outlet (Ti) by
directly measunng the temperature of the melts flowing into and out of the pump. The
measured temperature difference was approximately 2°C in the PVT measurement of PS
melts. The slight increase in the melt temperature may be responsible for the discrepancies
observed in the experimental data.
This chapter was dedicated to the verification of the designed dilatometer that c m
measure the specific volume of a polymer/COz solution. The designed system based on a
tandem extruder and a gear pump was evduated using numerous pure polymer melts whose
PVT properties were known. With the developed system, we could successfully measure the
PVT properties of PP, PS, linear PBS, and branched PBS mefts. It was verified that the
rneasured PVT propenies of PP, PS and linear PBS materials are compatible with the
conventionally rneasured results.
Table 4.1. Sumrnary of Material Propenies for PP, PS, Linear PBS, and Branched PBS
PP
PS
Linear PBS
Branched PBS
T E
-18°C
98.8S°C
-
-
T m
159.80C
-
1 14°C
115°C
MFR (ASTM D 1238)
3.8 g/lOmin (230°C/l -2 kgf)
9 g/lOmin (200°C/5 kfi 3.5 g/10 min
( 1 90°C/2. 16 kgf) 4.7 g/lOmin
( 1 90°C/2. 1 6 kgf)
M W
-
23.813x10⁴
14 x lo4
14 x 104
M n
-
9 . 4 7 6 ~ 1 0 '
7.6 x 10'
3.8 x 10'
Table 4.2. The FOV Equation Constants for PS, PP, Linear PBS, and Branched PBS
Linear 1 PBS 1 3481
Branched
T* (K) v* (cm3/@ Standard Error for v*
Table 4.3. The MCM Equafion Constanfsfor PS, PP, Linear PBS, and Branched PBS
Linear 1
Table 4.4. The S-L Equation Constants for PS, PP, Linear PBS, and Branched PBS
1 PBS
Branched t-- 1 PBS
P* (bar)
2758
T* (K)
803.1
p* (cm31g)
1 .O72
Standard Error for pf
5.35E-3
Table 4.5. Experintentai PVT Data of Linear PP
Temperature (OC)
180
180
180
200
200
200
220
220
220
Pressure (M Pa)
13.790
20.684
27.579
13.790
20.684
27,579
13.790
20.684
27.579
cir ai 15 rpiii (glm i n)
17.250
17.370
1 7.450
17.1 I O
17.2 12
17.303
16.960
17,010
17.1 10
v nt 15 rprn
1.017
1.010
1,006
1.026
1.020
1.014
1,035
1,032
1,026
lit nt 20 rpm (glnii n)
22,950
23,160
23.300
22.800
23,030
23.142
22,620
22.778
22.890
ri1 üt 25 rpm (g/min)
28,770
28.990
29.132
28.457
28.600
28.792
28% 1
28.383
28.566
v iit 20 rpm
1.020
1 .O10
1,004
1.026
1.016
1.01 1
1 .O34
1,027
1,022
v nt 25 rpm (cm3/@
1,017
1.009
1.004
1,028
1.023
1.016
1.036
1 ,O3 1
1.024
Avengc v (cm3/@
1.0179
1,0099
1.0047
1,0266
1 ,0195
1 .O138
Curve fitied v (cm31g)
1.0177
1.0097
1.0045
1,0269
1.0203
1.014 1
1,0350
1.0299
1,0240
1.035 1
t ,0297
1.0237
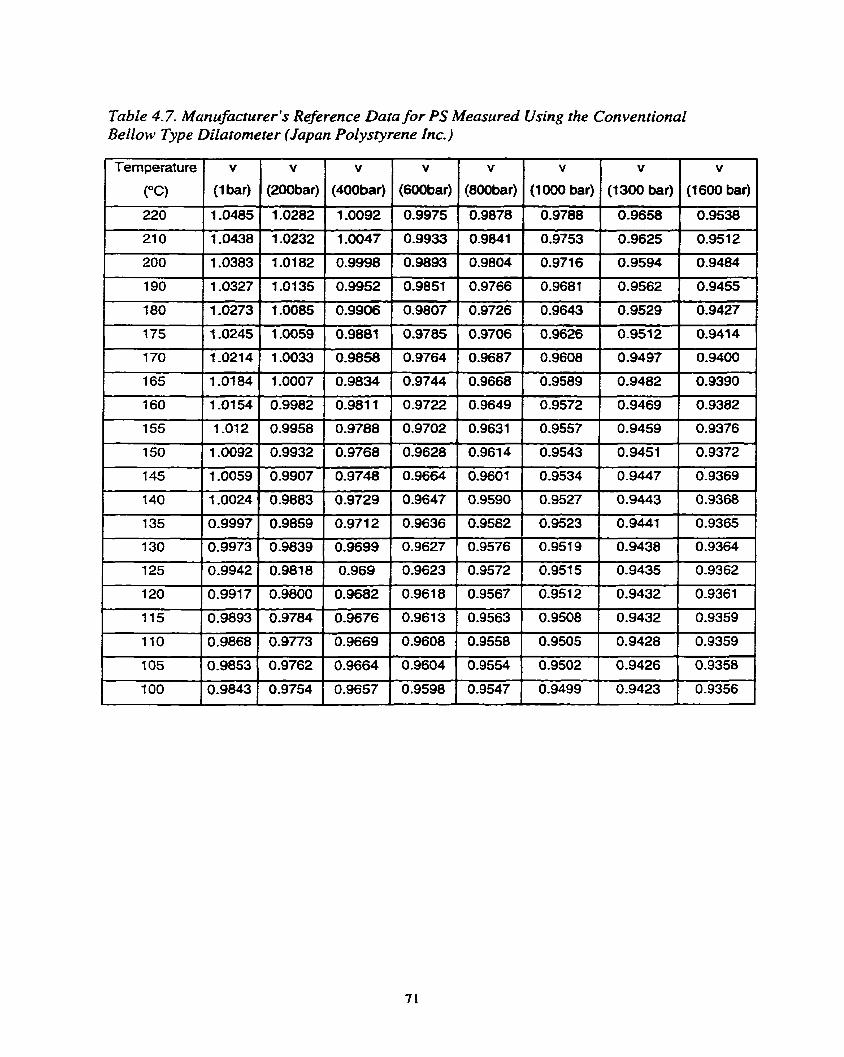
Table 4.7. Manufacturer's Reference Data for PS Memrred Using the Conventional Bellow Type Dilatometer (Japan Polystyrene Inc.)
Cc) 1 (Ibar) ( (2Obar) 1 (400bar) 1 (6ûûbar) 1 (800bar) 1 (1ûûû bar) 1 (1300 bar) 1 (1600 bar)
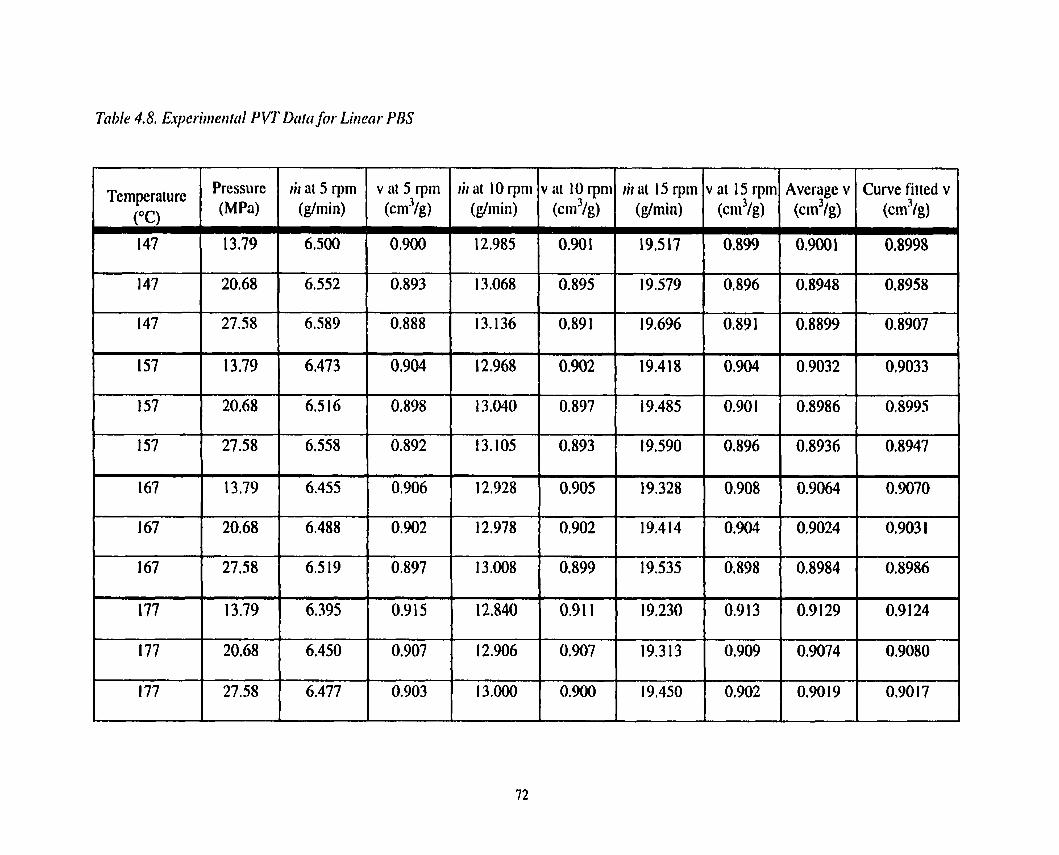
Temperature Pressure ,il ai 5 rpm v ni 5 rpin ri1 at 10 rpni
(OC) i (MPa) (glmin) (cm3&) (@min)
ai 10 rpni rit ai 1 5 rpm (c m31g'/g) I (g/mi n)
1 nt 15 rpm Average v Curve fiited v (ctn3ig)
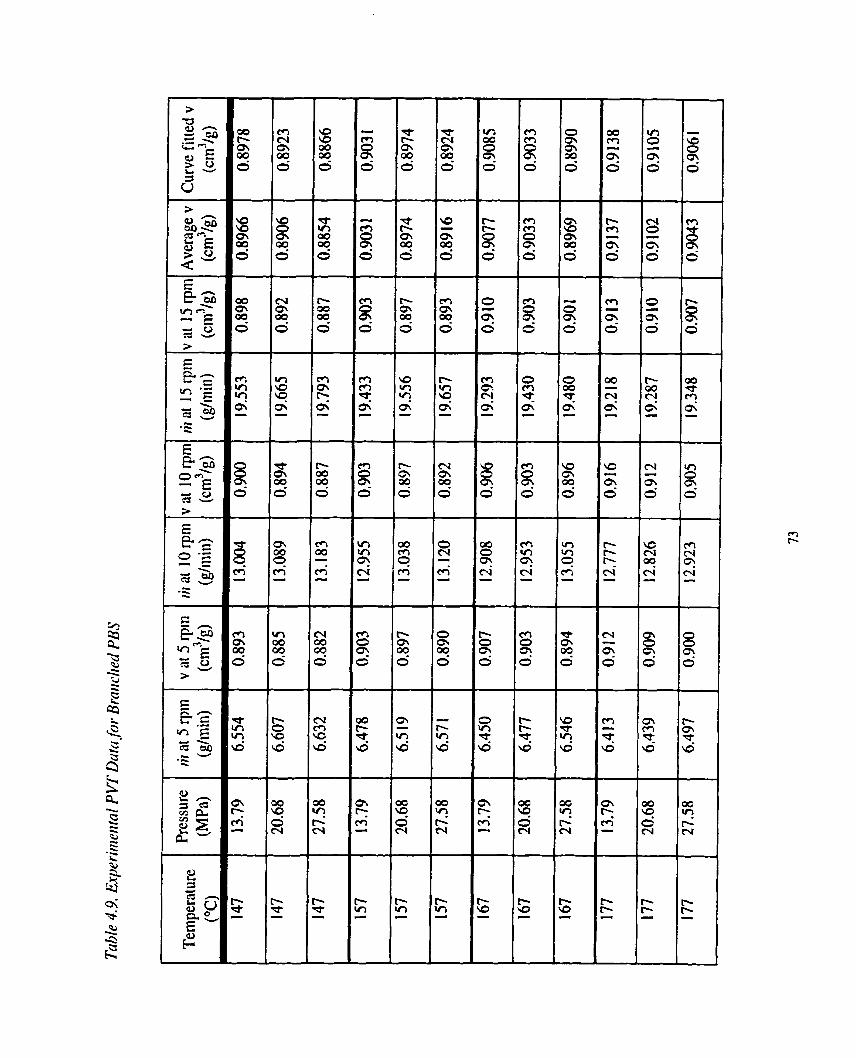
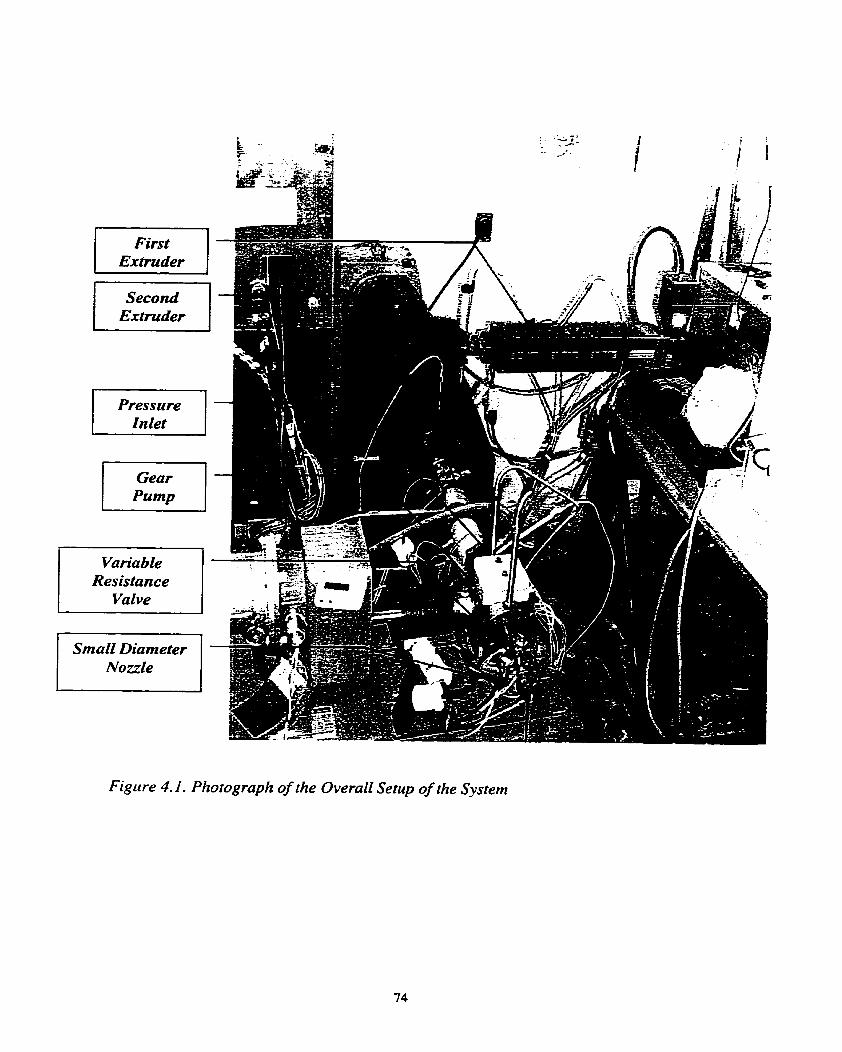
First
Exîruder
Pressure In let
Variable Resis tance
Valve
Figrire 4.1. Photograph of the Overall Setup of the System
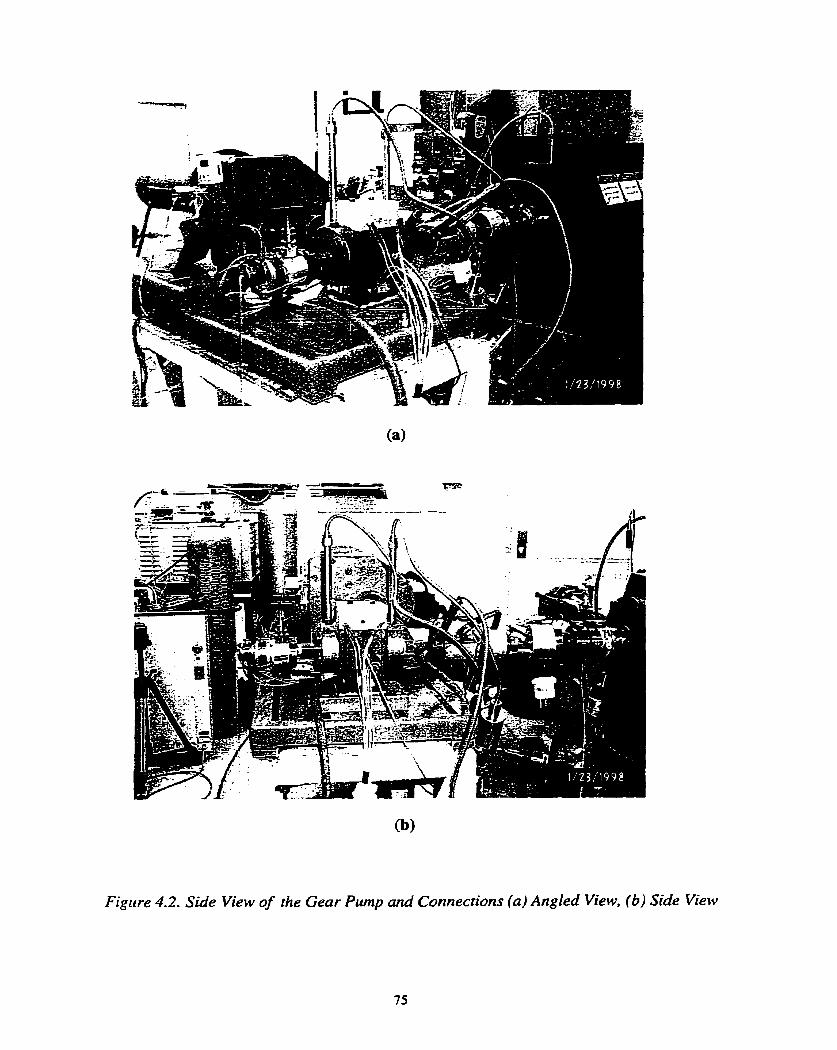
Figure 4.2. Side View of the Gear Pump and Connections (a) Angled View, (b) Side View
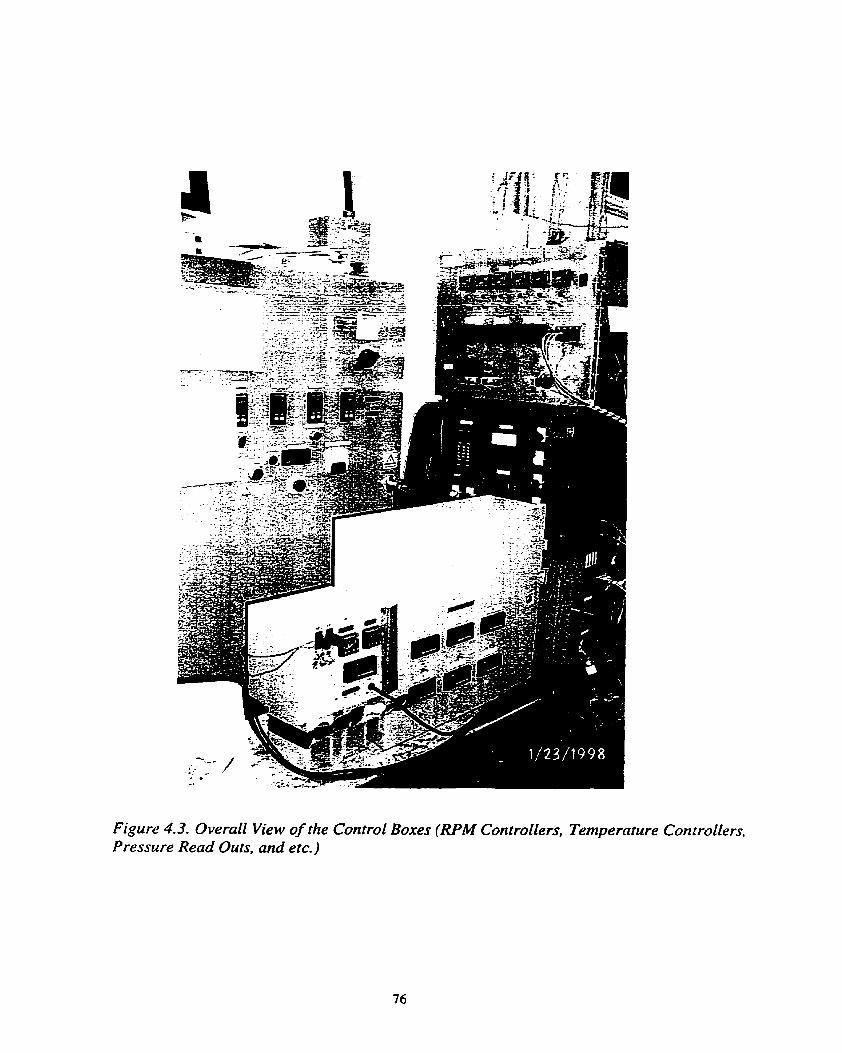
Figure 4.3. Overall View of the Control Boxes (RPM Con trollers. Temperature Con trollers, Pressure Read Outs, and etc.)
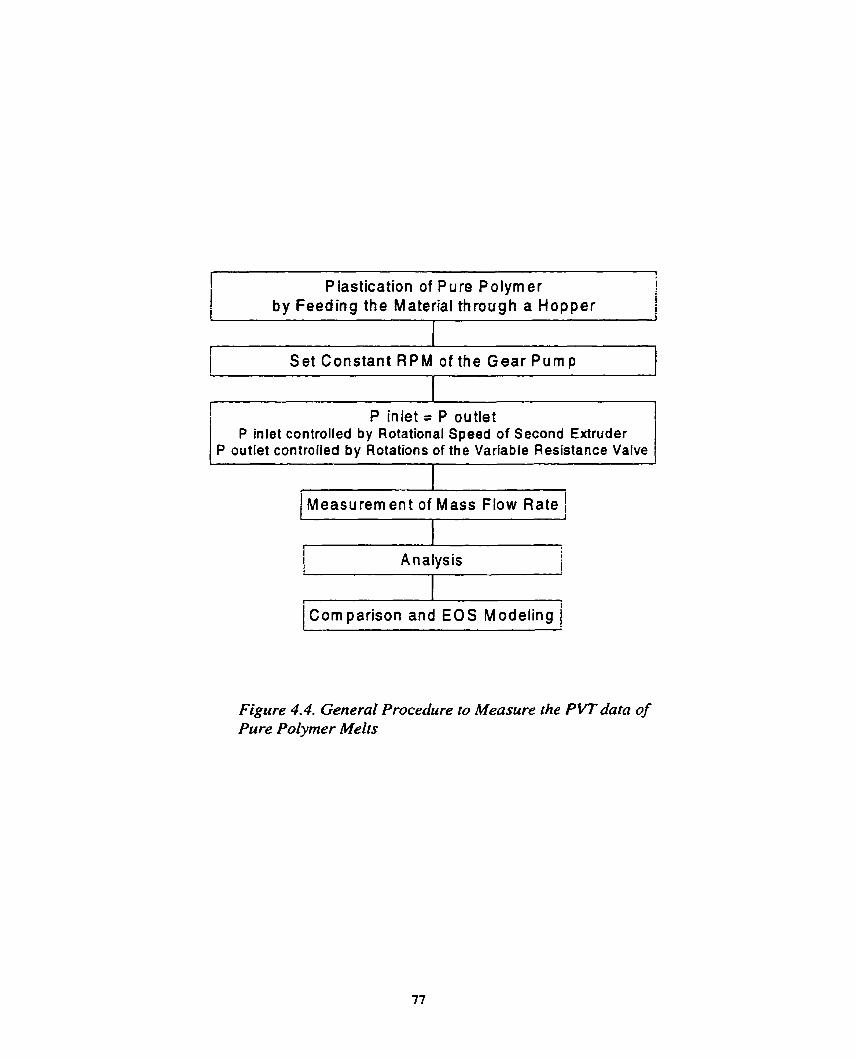
Piastication of Pure Polymer 1 1 by Feeding the Materiai t h r o ~ g h a Happe: 1 i
I I
i Set Constant R P M of the Gear Pump
I I
r P inlet = P outlet
P inlet controlled by Rotational Speed of Second Extruder P outlet controlled by Rotations of the Variable Resistance Valve
Measurem ent of Mass Flow Rate , I 1
I A n alys is i
/ corn p i s o n and EOS Modeling /
Figure 4.4. General Procedure to Measure the PVT data of Pure Polymer Melrs
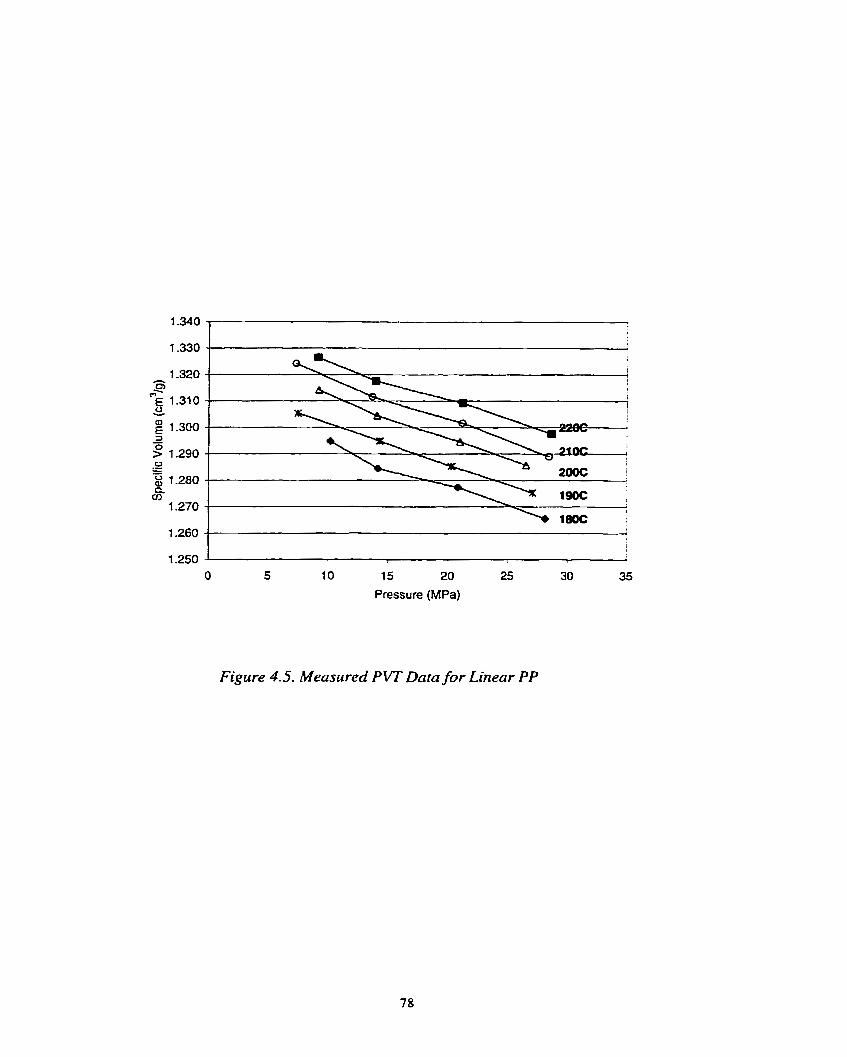
4.250 ! ! O 5 1 O 15 20 25 30 35
Pressure (MPa)
Figure 4.5. Measrtred PVT Data for Linear PP
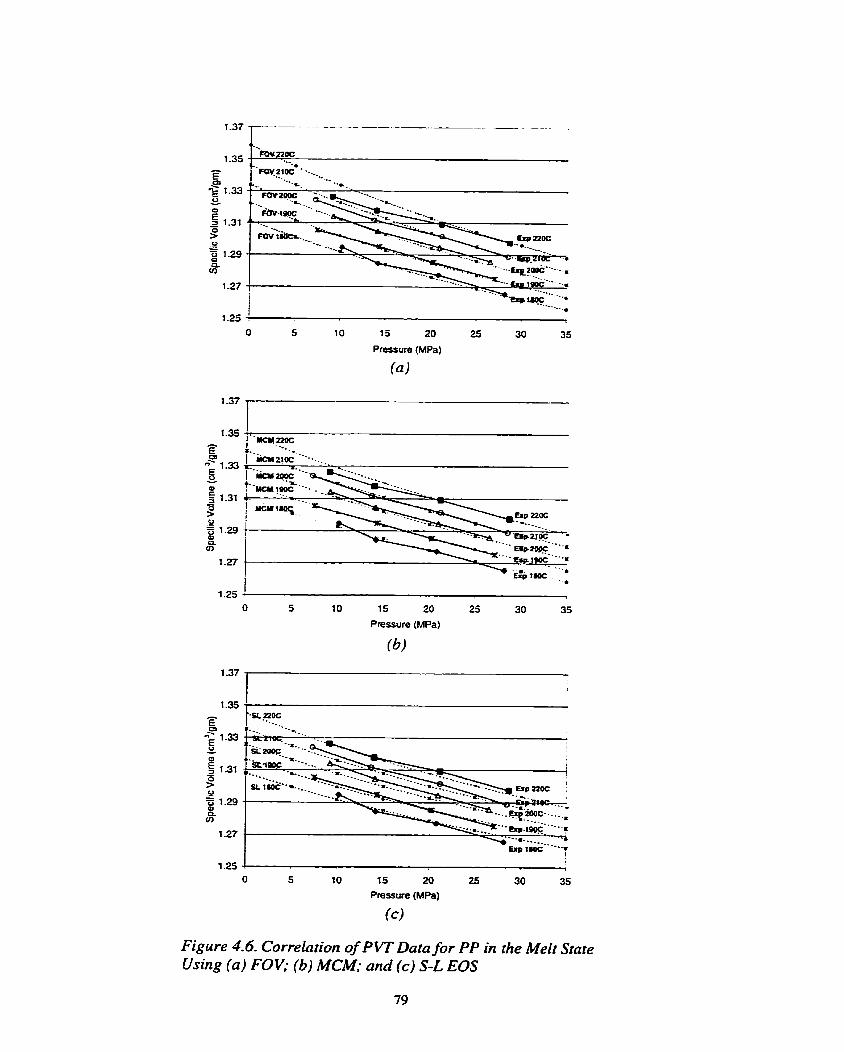
O 5 10 15 20 25 30 35
Pressure (MPa)
(4
1.25 - I 1
O 5 10 15 20 25 30 35
Pressure (MPa)
(b)
1.25 4 , O 5 10 15 20 25 30 35
Pressure (MPa)
(cl
Figure 4.6. Correlarion of PVT Data for PP in the Melt Srate Using (a) FOV; (b) MCM; and (cl S-L EOS
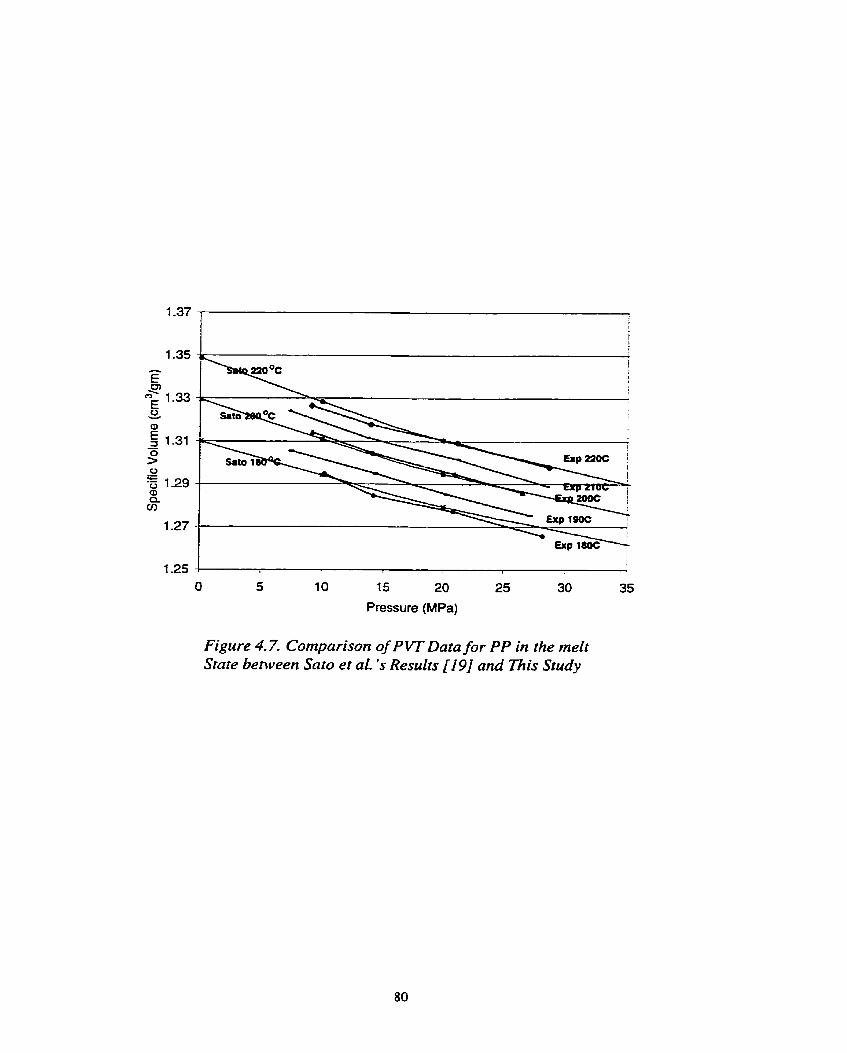
1.25 ! l i !
O 5 10 15 20 25 30 35
Pressure (MPa)
Figure 4.7. Cornparison of PVT Data for PP in the melt State behveen Sato et aL's Results [19] and Khis Study
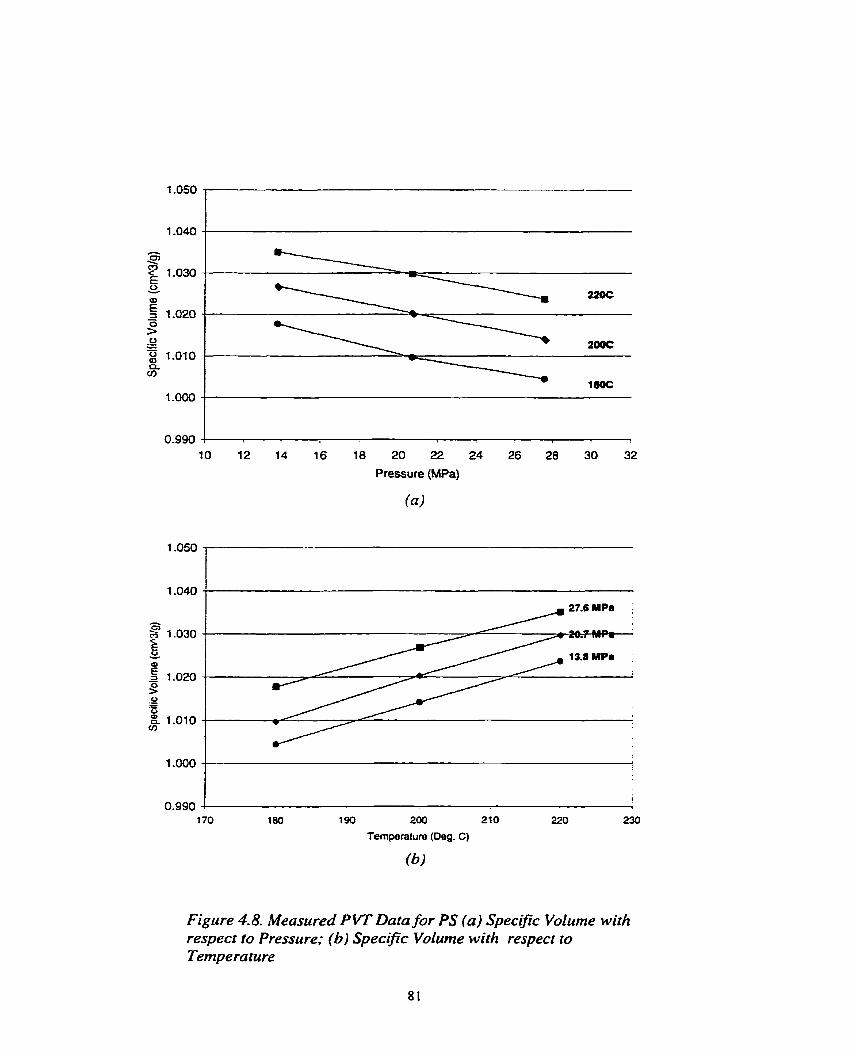
10 12 14 16 18 20 22 24 26 28 30 32
Pressure (MPa)
190 200 210
Temperature (Deg. C)
(6)
Figure 4.8. Measured PVT Data for PS (a) Specijk Volume with respect to Pressure; (b) Specrfic Volume with respect ro Tempe ratu re
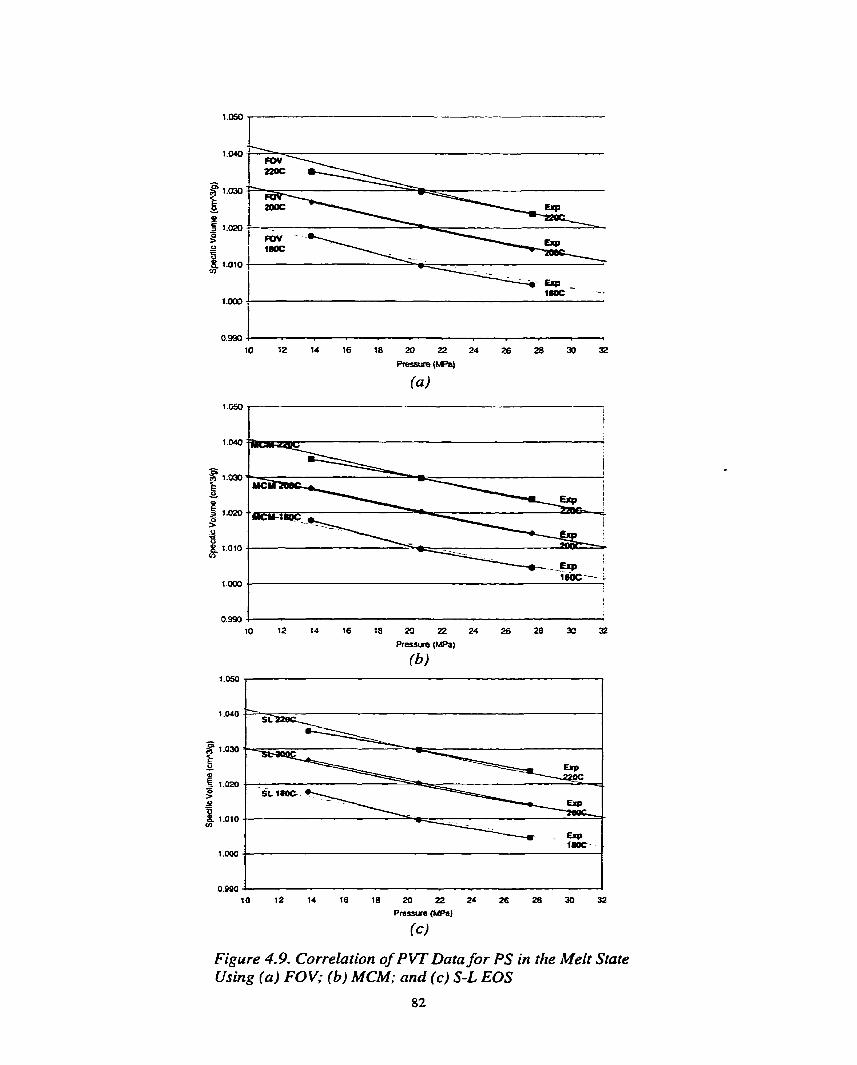
10 12 14 16 18 20 22 24 26 28 30 32
Pressure (MPa)
(d
Figure 4.9. Correlation of PVT Data for PS in the Melt State Using (a) FOV; (6) MCM; and (c) S-L EOS
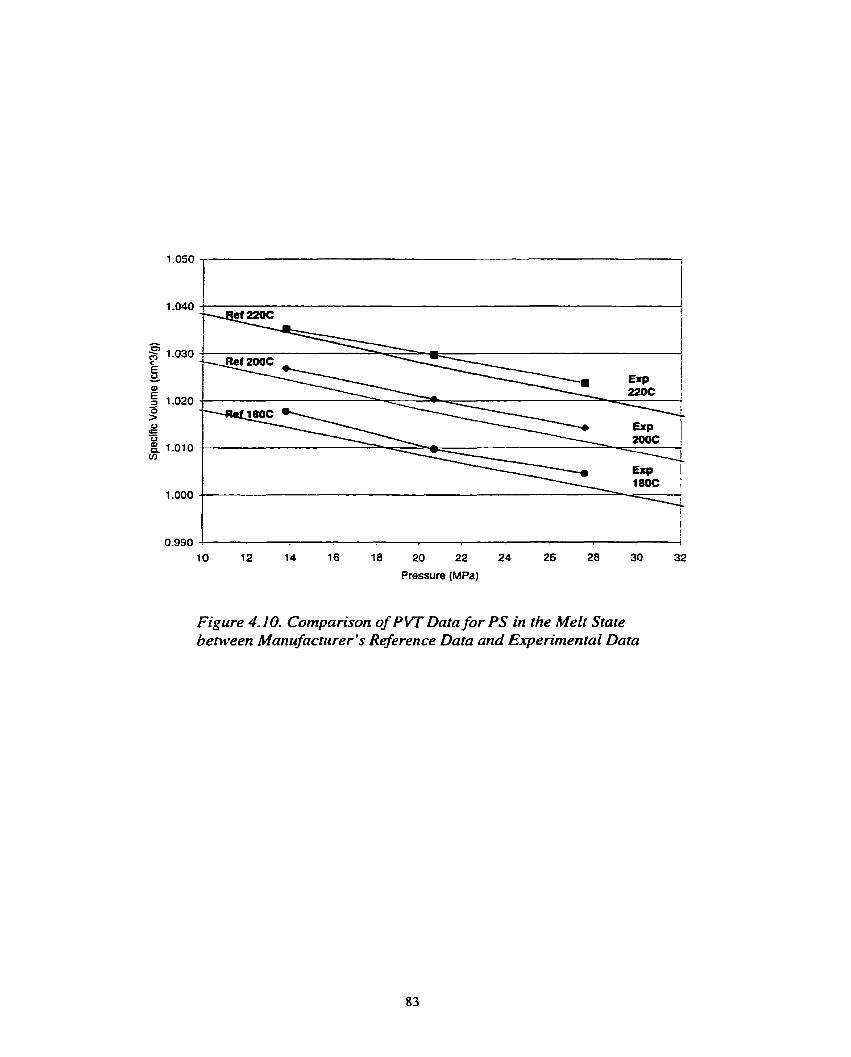
! i
0.990 7
10 12 14 16 18 20 22 24 26 28 30 32
Pressure (MPa)
Figure 4.10. Cornparison of P VT Data for PS in the Me& State between Manufacturer's Reference Data and Experimental Data
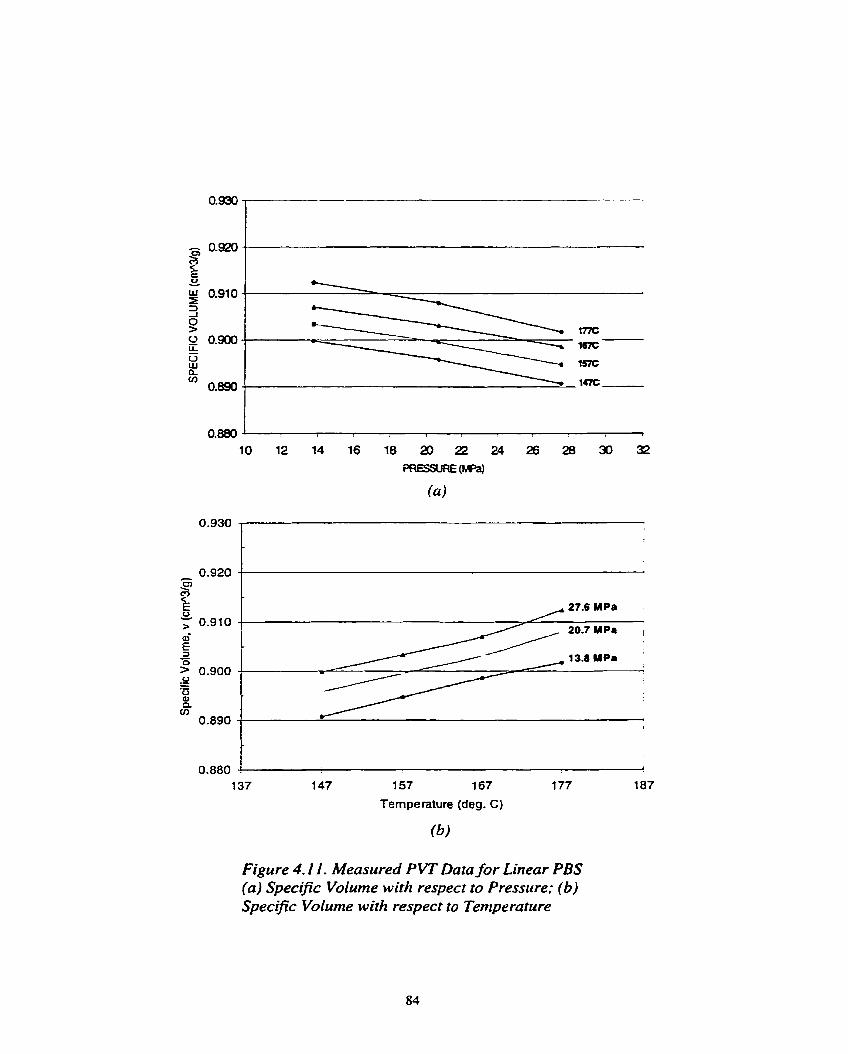
1 57 167
Temperature (deg. C)
Figure 4.1 1. Measured PVT Data for Linear PBS (a) Specij7c Volume with respect to Pressure; (6) Specific Volume with respect to Temperature
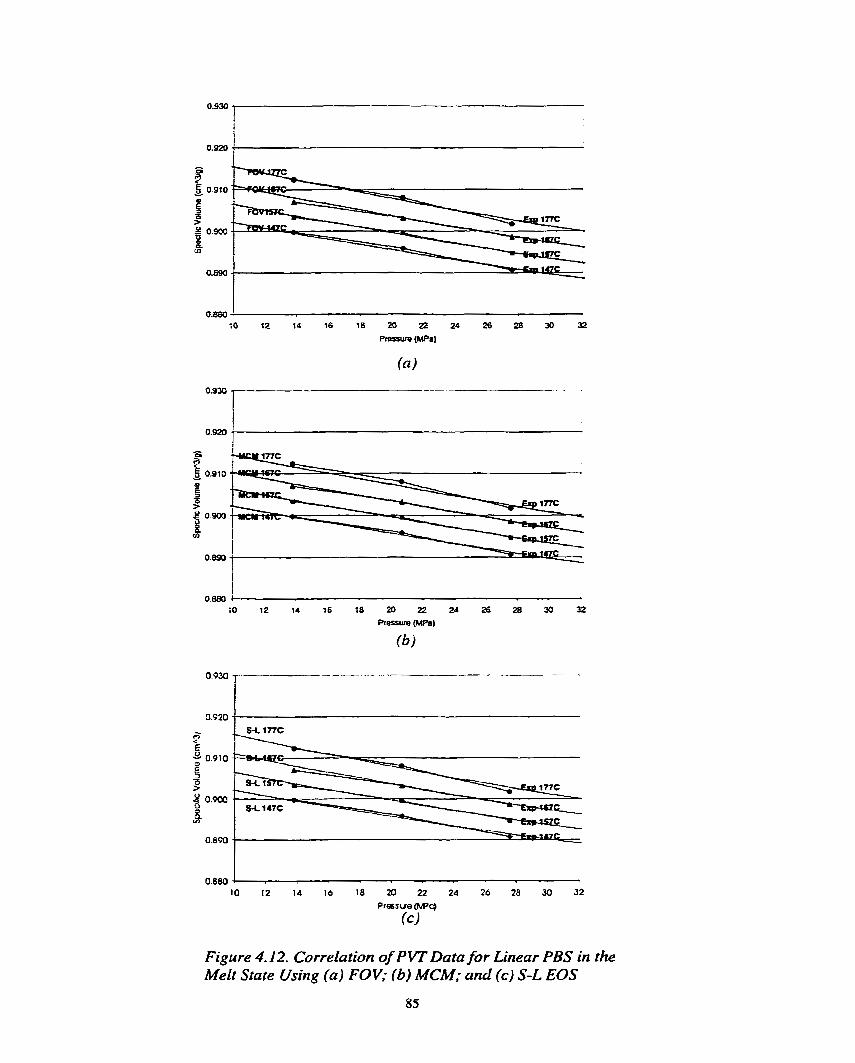
Figure 4.12. Correlation of PVT Data for Linear PBS in the Melt Srate Using (a) FOV; (6) MCM; and (c) S-L EOS
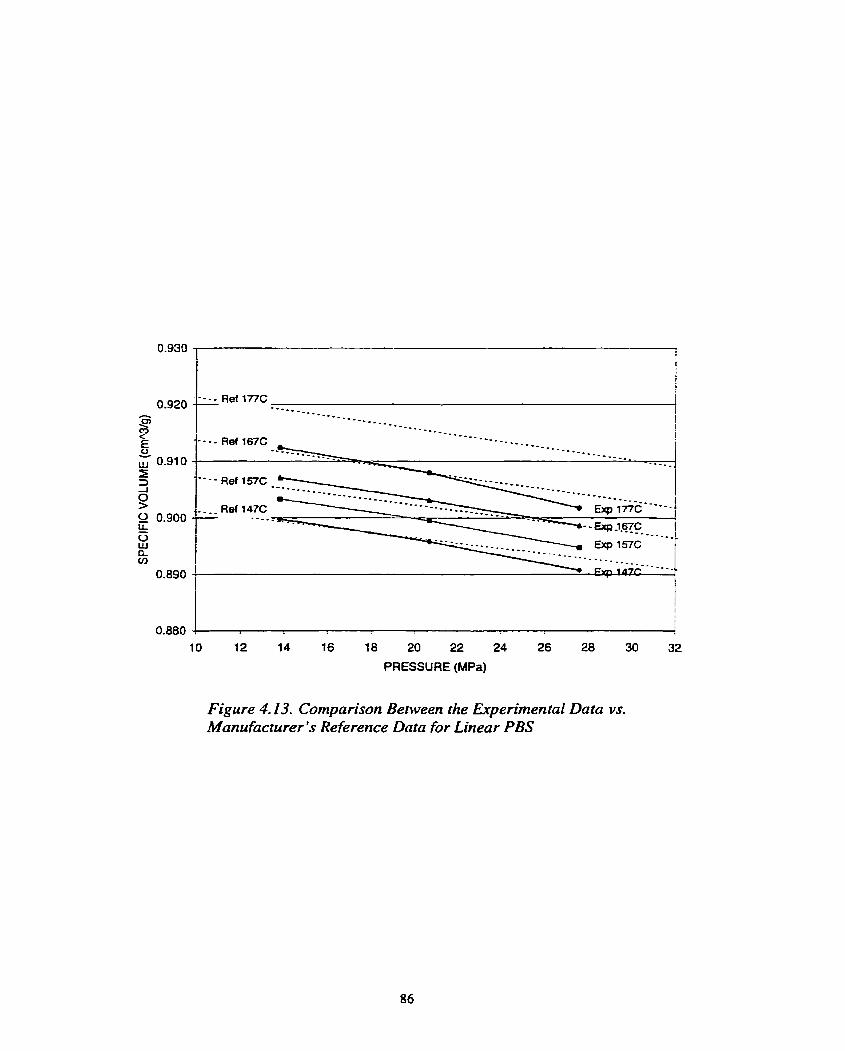
i - - - - Ref 1TÏC L
10 12 14 16 18 20 22 24 26 28 30 32
PRESSURE (MPa)
Figure 4.13. Cornparison Between the Experimental Data vs. Manufacturer's Reference Data for Linear PBS
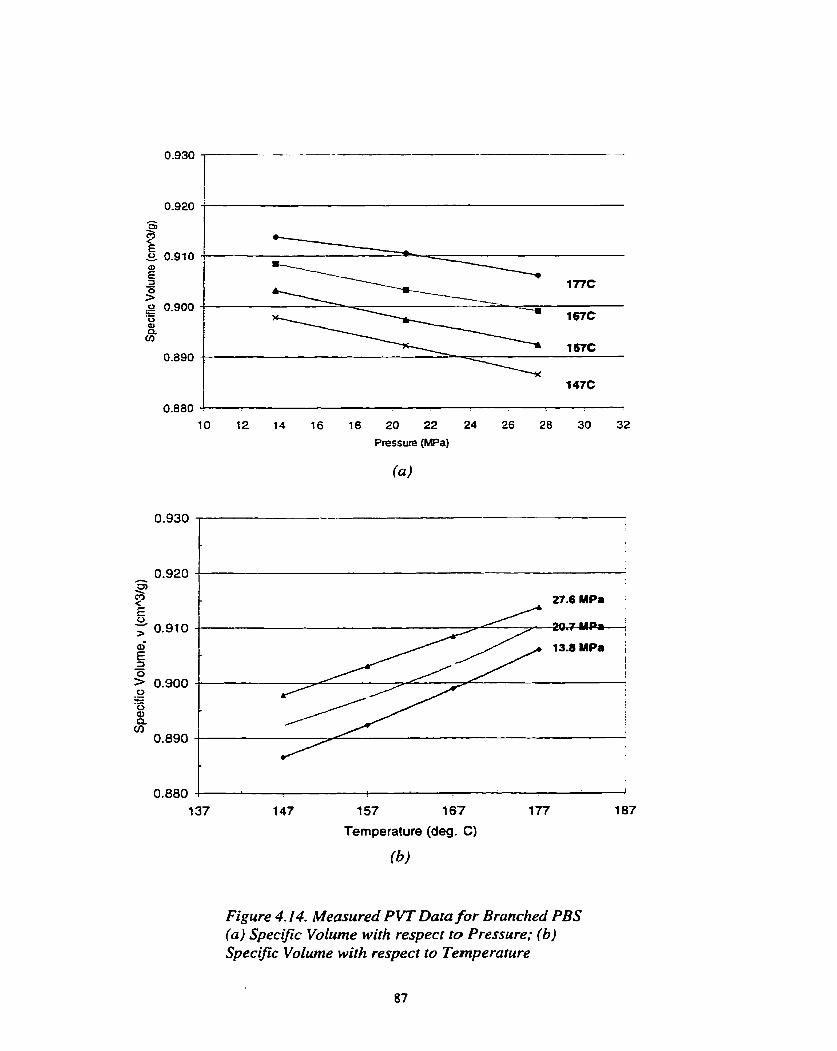
10 12 14 16 18 20 22 24 26 28 30 32
Pressure (MPa)
27.6 MPa
-PI-:
13.8 MPa i j
157 167
Temperature (deg. C)
(b)
Figure 4.14. Measured PVT Data for Branched PBS (a) Specifiç Volume with respect to Pressure; (6) Specifrc Volume with respect tu Temperature
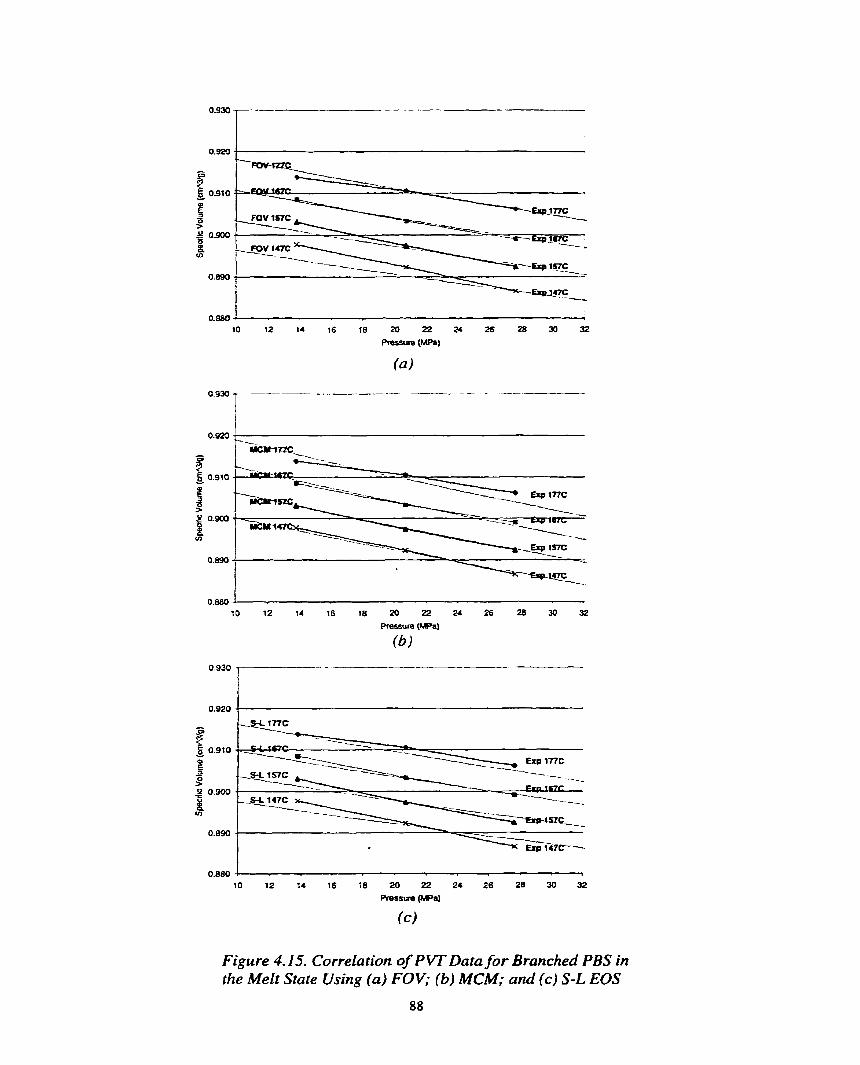
Figure 4.15. Correlation of PVT Data for Branched PBS in the Melt State Using (a) FOV; (b) MCM; and (c) S-L EOS
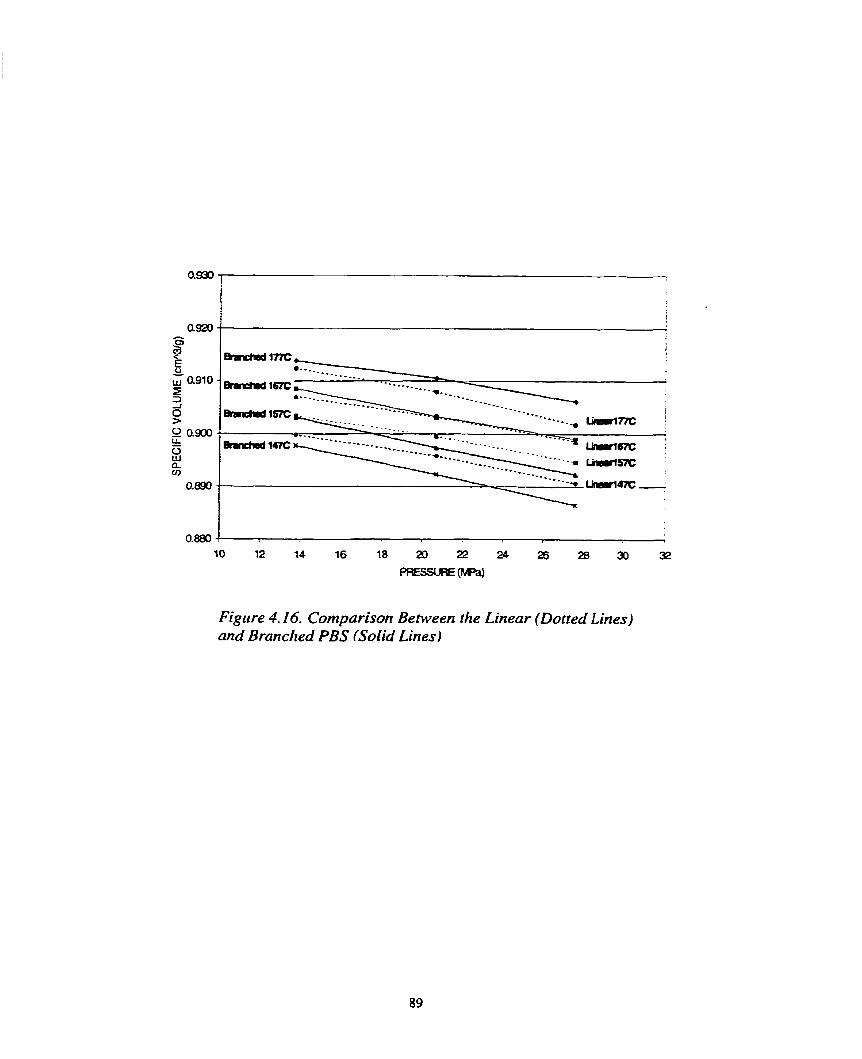
Figure 4-16. Cornparison Berween the Linear (Dotted Lines) and Branched PBS (Solid Lines)
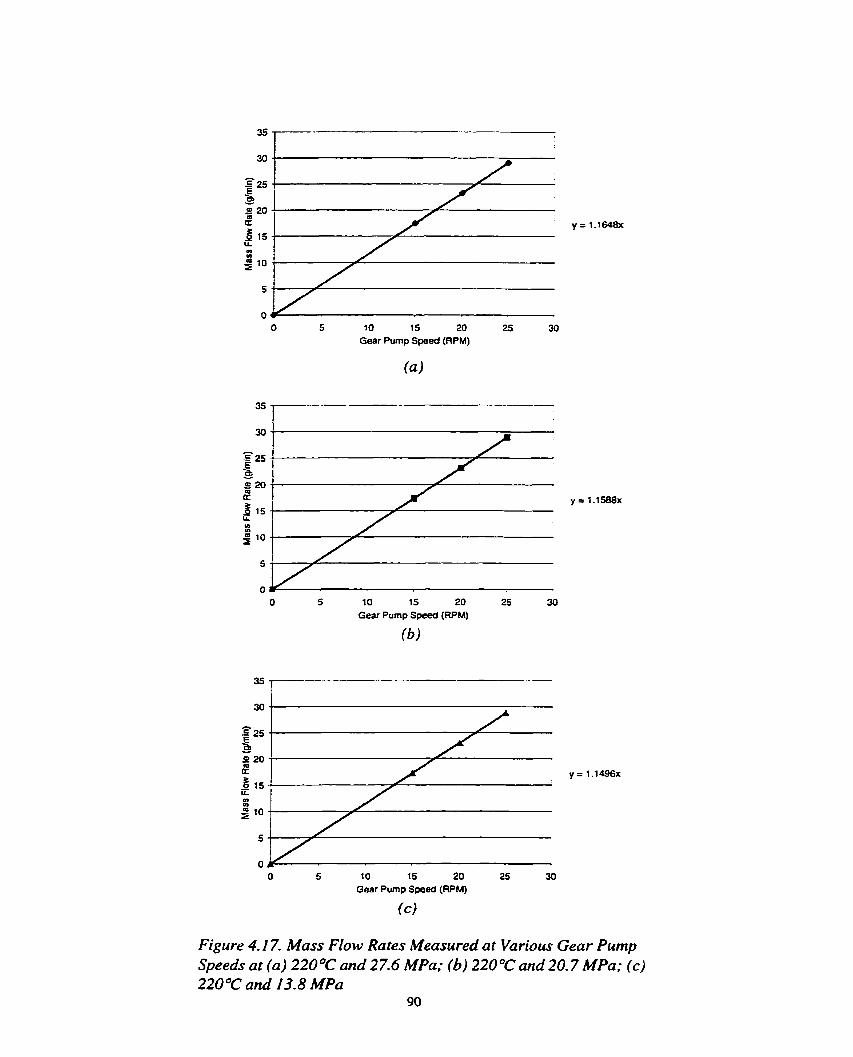
O 5 1 O 15 20 25 30 Gear Pump Speed (RPM)
5 10 15 20 25 30 Gear Pump Speed (RPM)
5 10 15 20 25 30 Gear Pump Speed (RPM)
(cl
Figure 4.1 7. Mass Flow Rates Measured at Various Gear Pump Speeds at (a) 220 OC and 27.6 MPa; (b) 220 O C and 20.7 MPa; (c) 220 OC and 13-8 MPa
90
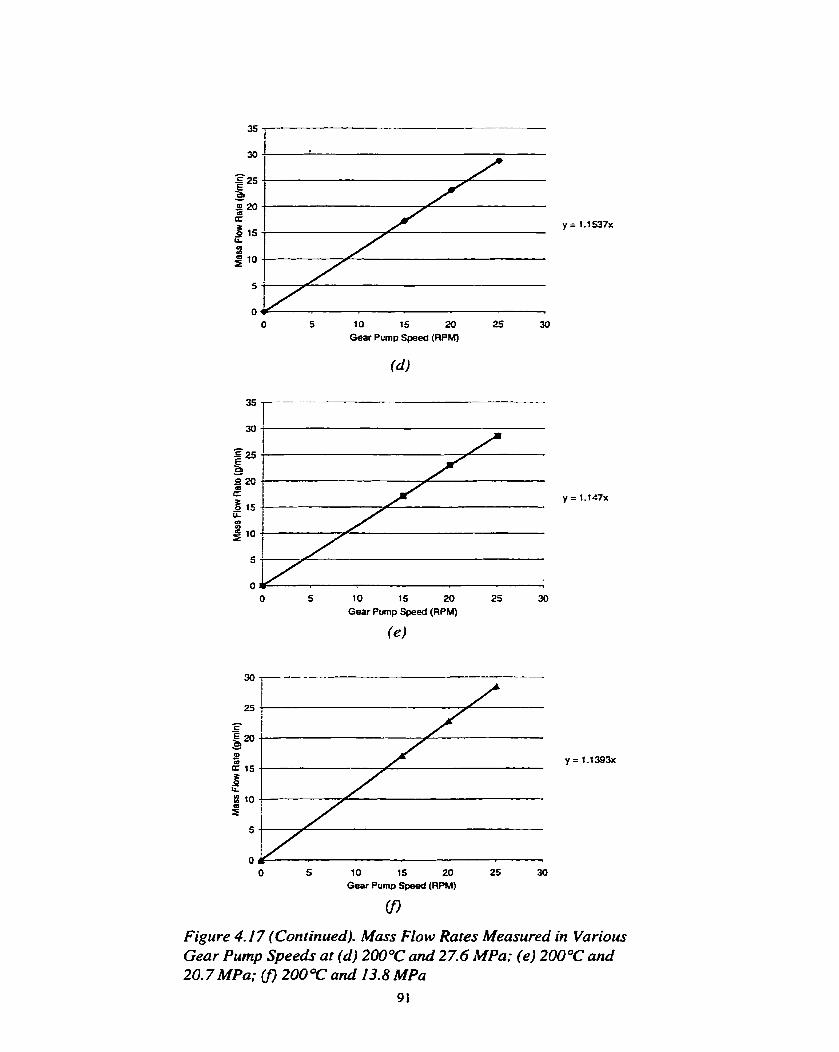
O 5 10 15 20 25 30 Gear Pump Speed (RPM)
5 10 15 20 25 30 Gear Pump Speed (RPM)
5 1 O 15 20 25 30 Gear Pump Speed (RPM)
(B
Figure 4.17 (Continued). Mass Flow Rates Measured in Various Gear Pump Speeds at (d) 2W°C and 2 7.6 MPa; (e) 200 OC and 20.7 MPa; Cf) 200°C and 13.8 MPa
9 1
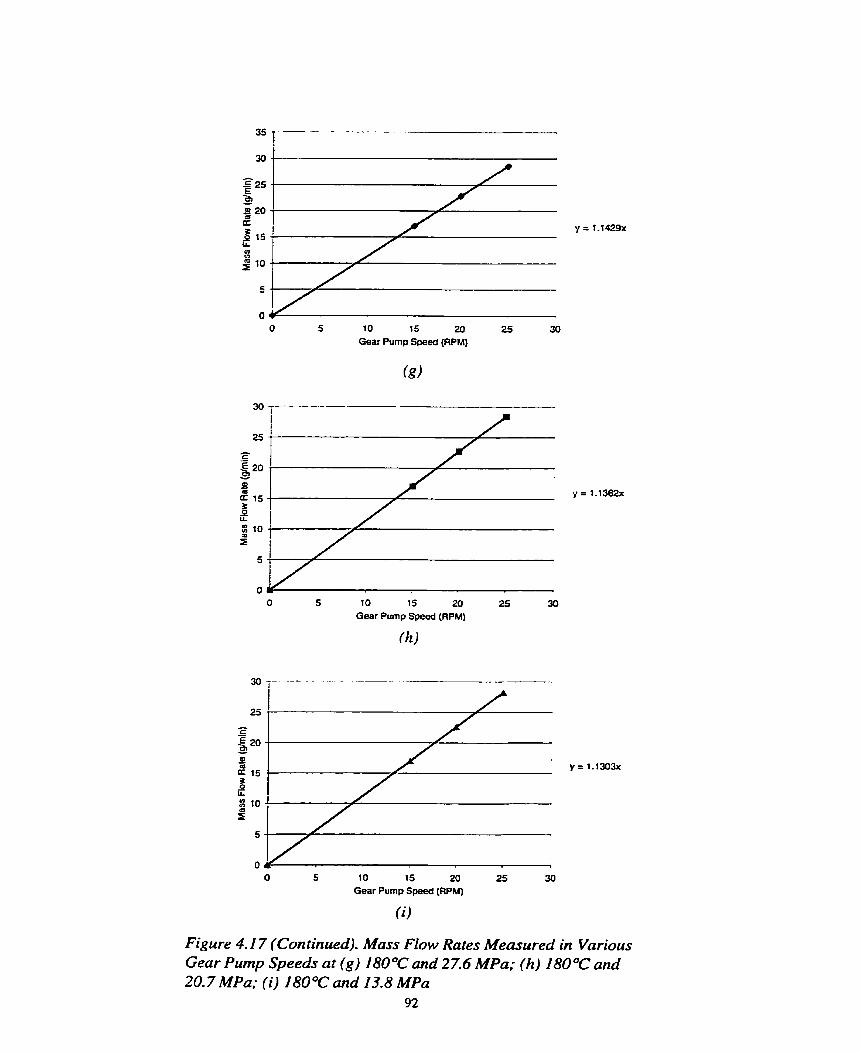
O 5 1 O 15 20 25 30 Gear Pump Speed (RPM)
5 10 15 20 25 Gear Pump Speed (RPM)
--
A
t
y = 1.1303~
O 5 10 15 20 25 30 Gear Pump Speed (RPM)
0)
Figure 4.17 (Continued). Mass Flow Rates Measured in Various Gear Purnp Speeds at (g ) 180 OC and 27.6 MPa; (h) 180 OC and 20.7 MPa; (i) 180 OC and 13.8 MPa
92
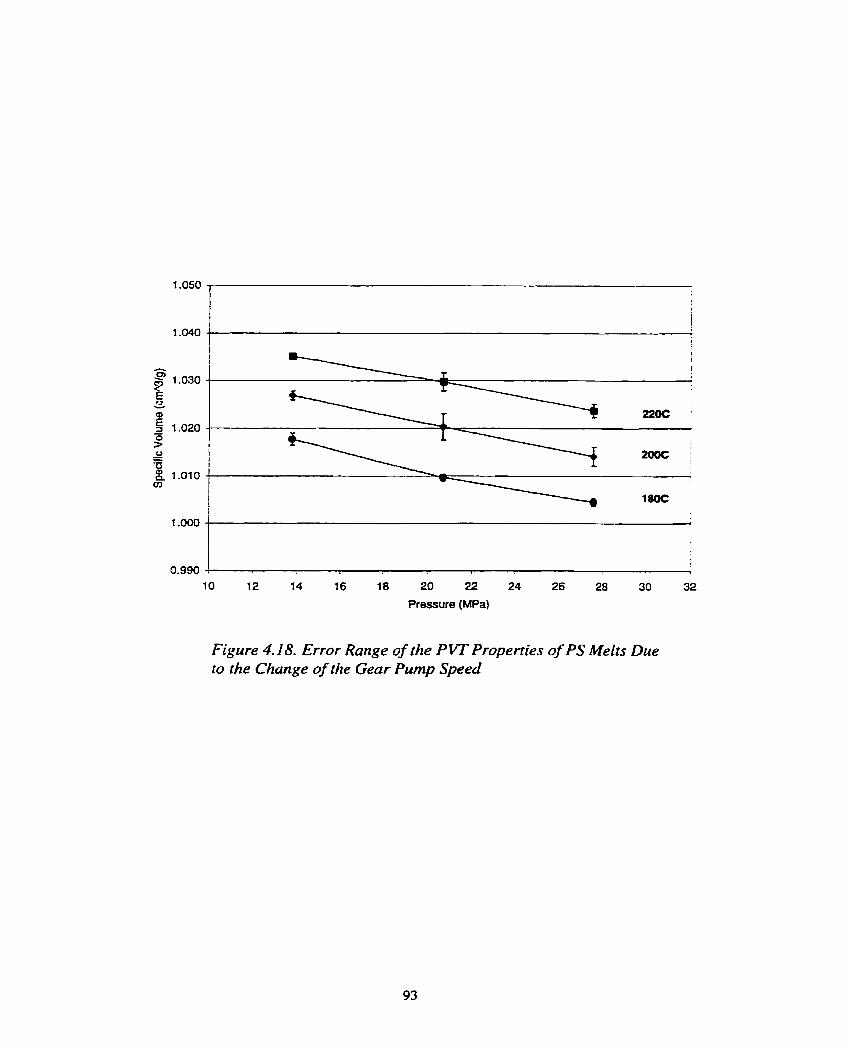
+ 0.990 i
10 12 14 16 18 20 22 24 26 28 30 32
Pressure (MPa)
Figure 4.18. Error Range of the P VT Properties of PS Melts Due to the Change of the Gear Pump Speed
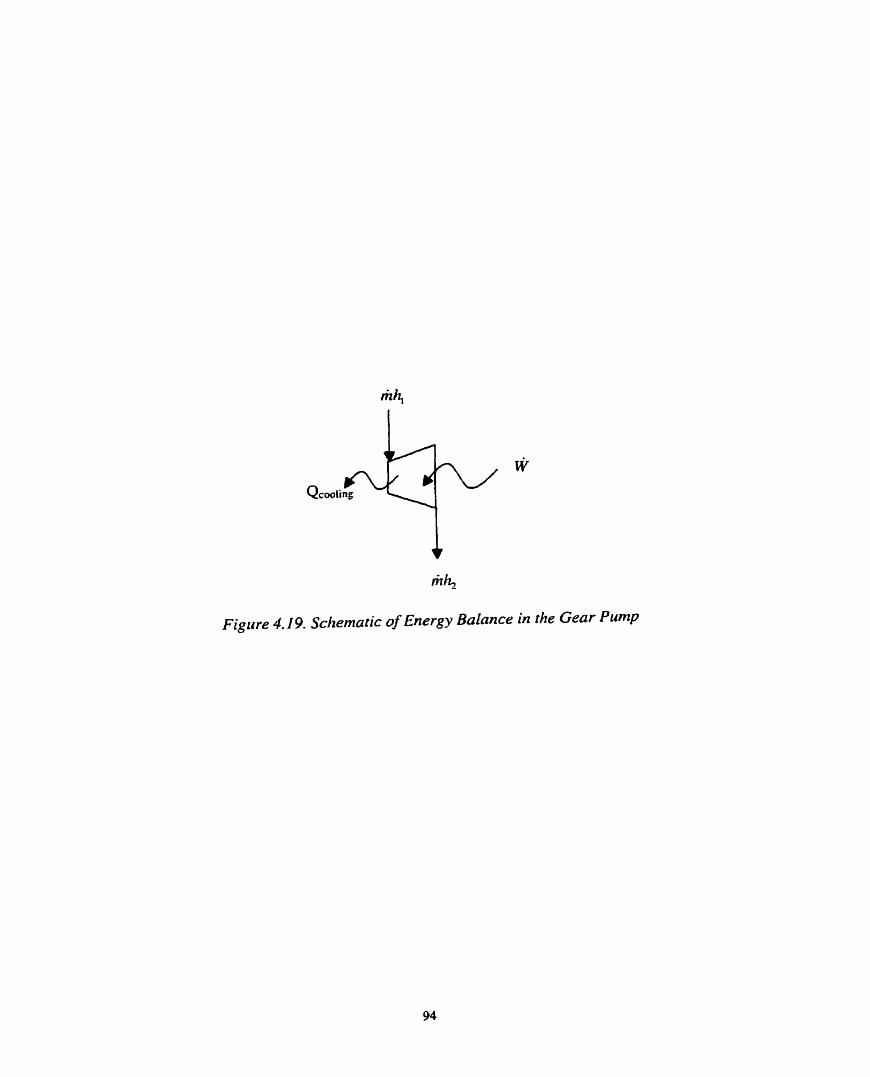
w
v mh,
Figure 4.19. Schematic of Energy Balance in the Gear Pump
MEASUREMENT AND MODELING OF THE PVT RELATIONSHIPS OF POLYMERKO~ SOLUTIONS
Although a great deal of research and development has been conducted on foam
processing, there has been no report on any direct measurement of the PVT properties of a
polymedgas solution in a rnolten state of the polymer, which is crucial to understand foam
processing. In fact, the rneasurement of PVT data of single-phase polymedgas solutions is an
extremely challenging task because maintaining the single-phase polyrner/gas solution 2t a
high pressure condition is very difficult, Attempts have been made to measure the PVT
relationship of a polyrner/gas solution at the maximum sotubility equilibrium state by
gathering the solubility data [25-28, 6 1, 623 (see Section 2.2). However, this method has
been criticized because it is Iimited to the solubility equilibrium condition.
The novel method developed in this study overcomes the limitation of the
conventional apparatus for rneasunng the PVT data, This was possible because the new
method uses a continuous on-Iine extrusion system with a gear pump to maintain a high-
pressure condition. The on-line rneasurement system reduces the tirne required for the
saturation of the polymer with gas. A metered amount of carbon dioxide, which is less than
the solubility Iirnit, is injected into the Stream of molten polymer to form a single-phase
polymer/gas solution in the tandem extrusion system. The injected gas diffuses into the
polymer matrix at a rate that is much higher than a batch process by stretching of the gas
bubbles which increases interfacial area between the gas and the polymer molecules [63].
In the previous Chapter (Chapter 4), the designed system was venfied using numerous
pure polymers. This chapter further elaborates the measurements of the PVT data of PS/C02
solutions, linear PBS/C02 solutions, and branched PBS/C02 solutions. The experimental
procedure for the PVT measurements of polyrner/gas solutions requires careh1 and accurate
control of pressure, temperature, and COz content. The acquired experimental data are used
to examine the effects of COt in the polymer matrix on the PVT relationships. The swelling
of poiymer melt due to the dissolved C O was precisely characterized as a hinction of COt
concentration, temperature, and pressure. Efforts were made to mode1 the experimental data
using conventional EOS methods. However, further study is required to predict theoretically
the effects of gas content in a polynier matrix.
5.1 EXPERIMl3NTAL SETUP
A PVT measurement system was constructed based on the designed setup shown in
Figure 3.2. The experimental setup to measure the PVT relationships of polymer/gas
solutions is similar to that used to measure the PVT relationships of pure polymers (Chapter
4), except for the CO2 injection apparatus. Figure 5.1 illustrates the actual setup of the PVT
measuring device for a polyrner/gas solution. The newly developed dilatometer consisted of
a %i" extruder (Brabender: 05-25-000) as the first extruder. a mixing screw (Brabender: 05-
00- 144) in the first extruder, a gas injection apparatus, a 1%" extruder (Killion: KN 150) as
the second extruder, a diffusion-enhancing device containing static mixers (Labcore: Mode1
H-04669-12), a positive displacement gear pump (Zenith: PEP-Il), a variable resistance
valve, and a filament die.
The gas injection apparatus consisted of a gas cylinder, a chilIer, a syringe pump,
and an injection port. The injection port was located at a distance of one third from the outlet
of the first extruder and two thirds from the hopper to ensure good absorption of gas into the
polymer matrix [3]. The volume flow rate of the gas was accurately controlled by a syringe
pump, which was calibrated prior to the experiment. Figure 5.2 shows a pictonal view of the
synnge pump used in the experiment. A refrigeration unit was used to chitl the gas line to
promote better CO2 flow between the syringe pump and the cylinder. A heat exchanger was
used to cool the p o l p e r melt, and it contains a homogenizing static mixer with a
temperature controller and a solenoid valve, which was connected to a pressurized air. The
static mixer enhanced complete dissolution of carbon dioxide into the polymer melt. The
calibrated positive-displacement gear pump and its P D controller were mounted on the
system. Two pressure transducers (Dynisco: PT462E-10M-6/18) were mounted at the inlet
and outlet of the gear pump. In addition, numerous thermocouples were mounted on the
system to monitor the temperatures of the melt. Band heaters and temperature P D
controllers (Omega: C N 9 O A ) controlled the temperatures of the diffusion enhancing
device, the variable resistance valve, and the filament die. A precise micro-balance (Mettler
Toledo: AB204) was utilized to measure the weight of the extrudate.
The polymeric materials used in this study were polystyrene (Japan Polystyrene inc.,
G440K), linear PBS (Showa Highpolyrner, Bionelle #1003) and branched PBS (Showa
Highpolymer, Bionelle #1903). The properties of these polymers are sumrnarized in Table
4.1. Carbon dioxide (BOC Gas Inc., 99.5 mol. % purity) was used as a blowing agent,
5.3 EXPERIMENTAL P R O C E D W
Figure 5.3 illustrates the step-by-step experimental procedure for the measurement of
the PVT relationships for polymer/gas solutions. Linear PBS and branched PBS were dried
in a vacuum oven for 4 hours prior to the experiments because of the hygroscopic nature of
the resins. Unlike the PBS materiais, PS was not dried and was fed directly into the barrel
through the hopper of the first extruder.
Initially, the speed of the gear pump was set and the system was srarted. While the
system ran, COt was injected into the first extruder by the syringe pump. During the start-up,
the pressure in the barrel increased due to the screw motion. The polymer pellets were
completely melted and rnixed with carbon dioxide by the screw motion of the first extruder.
The mixing section of the screw chopped the carbon dioxide from bigger bubbles into smailer
bubbles, which induced better gas solubility in the polymer. The polyrner melt went through
the second extruder and the heat exchanger to decrease the temperature of the melt uniforrnIy.
When the inlet and the outlet pressures of the gear pump equalized and the system reached a
thermodynarnic equilibrium, the volumetric and m a s flows rates of the polyrner/gas solution
were measured,
Iniection of CO2 inro a Stream of Polvmer Melt
Prior to the expriment, CO2 was filled in the syringe pump and pressurized to a high
pressure (Le., 48 MPa). The injection pressure of the gas into the first extruder must be
maintained higher than the extrusion pressure to prevent a back flow of polymer.
Close control of the gas-to-polyrner weight ratio is very important, because only a
soluble amount of gas injected into a polymer matrix will be dissoived. If an excessive
arnount of gas is injected, voids will be created which generate errors in the expenments.
The required gas flow rate is determined by the solubility of gas in the polymer at the given
terr.perature and pressure. It should be noted that the weight of CO2 with respect to the
weight polymer/C02 solution must be maintaineci constant throughout each experiment to
ensure the consistency. This requires repeated rneasurements of mass flow rates of the
polymer/gas solution, as well as, the mass flow rate of CO2 from the syringe pump. In order
to thermodynamically stabilize the molten poIymer/gas solution and reach the steady-state
condition, the system was mnning for approximately 20 minutes or more before each
measurement.
Convective Diffusion in the Extrusion Barre1
According to the previous studies [54,63], it was believed that a single-phase
polyrner/gas solution was formed in our expenments when the gas was injected (below the
solubility limit) into the extrusion barrel under a high pressure. Convective diffusion in the
extrusion barrel accelerated the gas diffusion process into the polymer matrix [53,54,63].
The shear action of the screw rotation stretches the gas bubbles, which increases the
interfacial area between the polyrner and the gas molecules, to promote better diffusion.
Since diffusion is also a function of the mixing quality of the polymer and gas molecules, the
diffusion time is dependent on the degree of mixing. Thus, the mixing sections of the screw
and the static mixer promoted good mixing between the polymer and gas molecules.
Furtherrnore, heat generated by the screw motion and high pressure (Le., above 20.7 MPa)
promoted gas saturation into the polymer matrix as well.
Measurement of Volume and Mass Flow Rare o f the Polvmer/Gas Solution
In order to reduce the leakage across the gear pump, the difference between the
upstream and downstream pressures was rninimized by using a variabje resistance die
attached to the downstream outlet of the gear pump. The upstream pressure of the gear pump
was initiaily set to be close to the desired pressure by varying the rotationd speed of the
second extruder. Then, the downstream pressure was set close to the desired pressure by
tuming the variable resistance valve. When the upstream and downstream pressures were
close to the desired pressure, the second extruder screw speed and the variable resistance
valve were again rninutely varied to equalize these pressures.
When the steady-state condition was achieved at each temperature, pressure, and gear
pump speed, the volume and mass flow rates were measured. The volume flow rate was
calculated to be the gear pump speed multiplied by the gear pump throughput per revolution.
The mass flow rate was measured by collecting the extmded foam for a fixed tirne and
weighing it. Since gas loss from the extruded foarn is unavoidabie [SS, 561, it would be
impossible to accurately measure the flow rate of polymer/gas solution by directly measuring
the weight of the extmded foam for a fixed time. But most of CO2 escapes during expansion
at a high temperature in case the expanded foam contracts after the initial expansion and the
resultant volume expansion ratio is less than 1.5 [Sd]. In order to promote gas loss, the die
temperature was increased significandy (220°C for PS and 200°C for linear and branched
PBS). Also, the diameter of the extnided foam was made very srna11 to expedite the gas loss
LOO
by using a thin filament die (diameter of 0.030") because the cell-to-ce11 dif is ion will be
faster for a thinner filament. It should also be noted that the small-sized filament die
facilitated the collection of extrudate for mass flow rate measurement. Thus, the weipht of
the extrudate coming out from the filament die was the weight of the polymer melt only. In
order to acquire the actual mass fiow rate of the poIyrner/gas solution, the mass flow rate of
carbon dioxide injected from the syringe pump was added to the weight flow rate of the
polymer extrudate. Since the residual gas in the polymer melt can cause some error in the
measurement of the mass flow rate, attention was paid to maintaining a high temperature in
the extruded thin filament foam to rninimize the residual gas.
The specific volume was calculated as the ratio of the mass flow rate to the volume
flow rate of the polymer/gas solution (i.e.. v = /i )-
For the case of PS, the selected melt temperatures were 180°C, 200°C, and 220°C.
The selected gear pump pressures in the experiments were 1 3 -78 MPa, 20.68 MPa, and 27.58
MPa (2000 psi, 3000 psi, and 4000 psi). The carbon dioxide contents were 1, 2, 3, and 4
wt%.
For the linear PBS and branched PBS, the selected melt temperatures were 147"C,
1S7"C7 and 167OC. The selected gear pump pressures in the experiments were 13-78 MPa,
20.68 MPa, and 27.58 MPa (2ûûûpsi, 3000psi, and 4000 psi). The carbon dioxide contents
were 1,2,4, and 6 wt%.
5.4 RESULTS AND DISCUSSION
Three sets of expenrnents were conducted to measure the specific volumes of the
PS/C02 solutions, linear PBS/C02 solutions, and branched PBS/C02 solutions. The
measured specific volumes of the PS/C02 solutions are shown in Figures 5-4-59, where the
effects of pressure, temperature, and gas content on the specific volumes are presented
clearly. The measured specific volumes of linear PBS/C02 and branched PBS/C02 solutions
are pIotted in Figures 5.10-5.15. Al1 the experimental conditions and measured data for the
PS1CO2 solutions, linear PBS/C02 solutions, and branched PBSlC02 solutions are given
specifically in Tables 5.1, 5.2, and 5.3, respectively, for three different rotational speeds (Le.,
5, 10, and 15 rpm) of the gear pump.
The experimentd data were curve-fitted by detemining the slope of the mass flow
rate of the polymer/gas solution versus the rotationai speed of the gear pump. The error due
to the change in the rotational speed of the gear pump was found to be minor. It seemed that
most of the experimental error was attributable to human error in measuring the mass flow
rate of the polyrner1CO2 mixtures as described in Section "Errors Involved in the
Measurement of the Mass Flow Rate".
The specific volume of the polyrner melt was observed to be a sensitive function of
pressure, temperature, and gas content. An increase in pressure from 13.79 MPa (2000 psi)
to 27.58 MPa (4000 psi) decreased the specific volume of PS by approximately 0.01 cm31g
(Figures 5.4 and 5.5). For linear and branched PBS, the sarne increase in pressure (from
13.79 MPa to 27.58 MPa) decreased the specific volume by approximately 0.015 cm31g
(Figures 5.10 and 5.1 1). The slopes of the pressure versus specific volume curves were
almost the same for the linear and branched PBS.
The specific volume of PS (Figures 5.6 and 5.7) increased as the temperature was
increased. One interesting point to note is that when a high gas concentration (Le., 4 wt% of
COz) was dissolved in the polymer mauix, the sensitivity of the specific volume with respect
to the temperature (Le., the change of specific volume for a unit change of temperature) was
not significant. For instance, at O wt% of COz, the specific volume of PS increased by
approximately 0.02 cm3/g from 180°C to 220°C, regardless of pressure. At 4 wt% of CO?,
however, the specific volume of PS increased by only 0.007 cm3ig from 180°C to 220°C.
This indicates that for P S f C 0 2 solutions, the specific volume was less dependent on
temperature when the amount of gas dissolved in the polymer was high- In the case of linear
and branched PBS, the specific volumes increased by approximately 0.01 with an
increase in the temperature from 147°C to 167°C (Figures 5.12 and 5.13). For these
materials, the gas content did not affect the temperature as much as with PS/C02 solutions.
The effects of gas content on the specific volumes for PS, linear PBS, and branched
PBS were also investigated. An increase in the gas content increased the specific volume due
to polymer swelling. For the case of PS (Figures 5.8 and 5.9), the specific volume increased
by approximately 0.05 cm31g as the gas content was increased from O wt% to 4 wt%- This
increase in specific volume was approximately constant over the temperature range of 180°C
to 220°C. For the case of linear and branched PBS (Figures 5.14 and 5-15), the specific
volume increased by approximately 0.07 crn3lg and 0.04 cm3/g, respectively as the gas
content was increased from O wt% to 6 wt%. For al1 the materials, a sharp increase in the
specific volume was observed when the gas content was increased from O wt% to 1 wt%. It
is not clear whether this was caused by experimental error due to the difficulty in controlling
the gas flow rate minutely from O wt% to 1 wt%, or if it represents the actual trends resulting
from gas dissolution into the polymer. Further experiments are required to verifj these
phenomena,
Cornparison Between Linear and Branched PBS
The presence of branches in a polymer chah may have profound effects on the
properties of a po1 yrner such as compressibility, stiffness, chernical resistance, and density
[64]. A linear, non-branched material exhibits one-dimensional connectivity between
molecuIes, whereas a branched material contains several branch points that connect three or
more sub chains. At roorn temperature, the specific volume of a branched material is
typically larger than that of a linear materid and it is mainly due to the low crystallinity of
branched materials [ 171.
However, at temperatures above the melting point, al1 the crystals melt and the
difference in the specific volume due to differences in crystallinity does not exist. In fact,
previous research has shown that the difference in the specific volumes of linear and
branched polyethylene melts was negligible even when the temperature and pressure were
varied [17]. Although it is known that the specific volume of a melt tends to increase slightly
with increasing degree of branching [os], the change is very minor and insipificant.
When gas was injected into the molten polymer, however, the effect of branching on
the specific volume became significant. The experimental results showed that at
temperatures above the melting point, linear PBS exhibited higher swelling due to the
dissolved gas than the branched PBS materiai, The specific volumes of linear and branched
PBS/C02 solutions are compared in Figures 5.10-5.15 for variations in pressure, temperature,
and CO2 concentration. It is speculated that the difference in the arnount of swelling of the
Iinear and branched PBS by the dissolved gas may be due to the extent of molecular-chah
entanglement- A greater degree of molecular£hain entanglement would Iimit the movernent
of the molecules, and therefore, the branched PBS would not expand or swell as much as the
linear PBS due to gas dissolution. When there was no gas dissolved in the polymer (Le., at O
wt% of Cod, the specific volumes of the Linear and branched PBS showed a minor
difference, approximately 0.003 cm3/g (Figure 5.12(a)). However, as the arnount of
dissolved gas was increased, the difference in the specific volume between the linear and
branched PBS increased as rnuch as 0.028 cm3/g (Figure 5.12(e)). Moreover, the specific
volume of the linear PBS increased by approximately 0.065 cm3& (Figure 5.14(c)) due to
injection of 6 wt% of CO2 at 13.8 MPcr (2000 psi), which results in 7 % swelling. The
specific volume of the branched PBS increased as much as 0.042 crn3lg (Figure 5.14(c)) due
to injection of 6 wt% of CO2 at 13.8 MPa (2000 psi!), which indicates approximately a 4.7%
increase in the specific volume. Our results aIso showed that the effects of temperature and
pressure on the specific volumes of linear and branched PBS were minor compared to the
effect of CO2 content [Figures 5.10-5-13].
Sanchez-Lacombe EOS and Mixina Rules for Binarv Solutions
The experimental results were mathematically modeled using the Sanchez-Lacombe
(S-L) EOS. The S-L EOS for polymer/gas solutions utilizes a number of mixing d e s , as
described in Section 2.4.2.4. In order to describe the polyrner/C02 solutions using the S-L
EOS, the pure material characteristic parameters are needed. The estimated characteristic
parameters for pure polyrners (Le., PS, linear PBS, and branched PBS) are taken from the
previous Chapter, and the results are shown in Table 5.4. The estimated parameter values for
CO2 [66] are also shown in Table 5.4.
The critical parameters acquired for the S-L EOS and the mixing rules (Table 5.5)
were calculated using the pure material characteristic parameters. Using the critical
parameters, the remaining mode1 variables were calculated using the S-L EOS and mixing
rules. The calculated values of the variables are presented in TabIes 5.6. 5.7, and 5.8 for
PS/C02 solutions, linear PBS/C02 solutions, and branched PBS/C02 solutions, respectively.
Since the size of the molecules and the critical/melting temperatures of carbon
dioxide and the polymer differ greatly (Le., Tc of CO2 is 3 1.3OC, and Tg of PS is 98.85"C). a
binary interaction parameter, &, between the gas and the polymer was introduced to account
for these differences in the S-L EOS mode1 [24]. The mixing niles used in S-L EOS to
deterrnine the interaction parameter assume: (a) the solubility vaiues were measured at
solubility equilibrium, and (b) the polymer is treated as a liquid above the glass transition
temperature [6 11. However in Our experiments, the experimental conditions did not reach the
solubili ty equilibrium state. Rather, our experiments were conducted with a concentration
much lower than the solubility equilibrium concentration (or equivalently, at a pressure much
higher than the solubility equilibrium pressure, or at a temperature much lower than the
solubili ty equil ibrium temperature) to ensure complete dissolution o f the injected gas in the
polymer rnatrix and to prevent the presence of the second phase. Figure 5.16 depicts the
typical experimental range on a temperature versus specific volume graph; our experimental
data are located above the solubility equitibrium.
Because previous work was done only at the solubility equilibrium state [25, 623, our
data cannot be compared directly with others' results. Furthemore, the binary interaction
parameter, &, obtained from this study would be different from that obtained by others,
where the parameter was a function of temperature only. It was speculated that the
interaction parameter for Our results should be a function of temperature, pressure, and gas
concentration because Our experiments were conducted in non-solubility equilibrium
conditions. Therefore, the interaction parameters were fitted as a function of temperature,
pressure, and gas concentration.
The interaction parameters are fitted using S-L EOS (Equation 2.13) and various
mixing rules (Section 2.4.2.4) based on the characteristic variables determined af each
processing condition (Tables 5-6-57}. The interaction parameters are plotted in Figures 5.17-
5.1 9, Figures 5.20-5.22, and Figures 5.23-5.25 for PS/C02 solutions, Iinear PBS/C02
solutions, and branched PBS/C02 solutions, respectively. The interaction parameters were
not sensitive functions of pressure, especially for Iinear and branched PBS (Figures 5.18,
5.31, and 5.24) as reported by others [25, 621. However, the interaction parameters were
sensitive functions of the gas concentration and decreased significantly with an increase in
the gas concentration (Figures 5-19, 5.22, and 5.25). Similady, the interaction parameters
decreased as the temperature was increased (Figures 5.17, 5.20, and 5.23). It was observed
that as the temperature and CO2 content approached the solubility equilibrium conditions, the
interaction parameter approached the conventional values ranging from -1 to +1 [25] .
However, the interaction parameter did not seem to converge to this range as the pressure
decreased to the solubility equilibrium pressure. Therefore, it is speculated that S-L EOS
might not be able to describe our experimental results well.
Even though the S-L EOS might not be the perfect mode1 to describe the PVT
relationships of polymer/COz solutions, the derived S-L EOS c m be used effectively to
calculate the data in the range of measurements by interpolating the experimental results.
Further studies on the interactions between the gas and polymer molecules are needed to
check the accuracy of the results and the validity of the S-L EOS to describe our results at
various experimental conditions,
EOS as a Function of the Gas Concentration
We aiso investigated the possibility of finding a relationship between the EOS and gas
concentration by treating each combination of polymer and COz content as a new material.
The Modified Cell Theory (MCM) EOS and the Sanchez-Lacombe (S-L) EOS were used for
this approach. The independent sets of experimental data were analyzed to find the
characteristic parameters by a non-linear regression method; this procedure was similar to
that used to determine the parameters for pure polymers. Once the parameters were obtained
using a mathematical analysis software tool ( ~ i g m a - ~ l o t ~ ~ ) , they were correlated as a
function of gas content.
First, we obtained the characteristic parameters for the MCM EOS at each gas
concentration. The parameters obtained are given in Tables 5.9, 5.10, and 5.1 1 for PS/C02
solutions, linear PBS/C02 solutions, and branched PBS/C02 solutions, respectively. The
parameters did not exhibit any trend as a function of the gas content. Rather, the parameters
fluctuated significantly as the gas concentration was varied. In a similar manner, we used the
S-L EOS to fit the parameters as a function of gas content. The parameters obtained are
shown in Tables 5.12, 5.13, and 5.14 for PS/C02 solutions, linear PBS/C02 solutions, and
branched PBS/C02 so tutions, respective1 y. As with the MCM EOS, the parameters obtained
using the S-L EOS did not show a trend as a function of gas concentration. One of the
reasons for this poor correlation may be due to the iack of data points obtained in the
experiments. Moreover, it is suspected that the v*, P*, and P are conjugated with each
other; in other words, v*, P*, and P are dependent on each other, even when gas
concentrations are changed.
Effect of the Residual Gas on the Measurement of the Mass Flow Rate
Although Our research has focused on the accurate measurement of the volume flow
rate of the poIyrner/COt solutions, a great deal of effort was aiso made to accurateiy measure
the mass flow rate of the polymer/gas solutions. It was impossible to rneasure the mass flow
rate of the poIymer/C02 solution by direct collection because gas loss from the extruded foarn
at the exit is unavoidable [3]. Therefore, we measured the mass flow rate of the polymer melt
only by intentionally promoting the Ioss of most of the gas in the extruded polyrner/CO1
solutions. Gas loss to the environment was promoted by increasing the temperature of the
filament die, and thus accelerating the diffusion rate of the gas from the extruded foam. A
very thin filament die of diarneter 0.030" was used to enhance the gas escape. CO2 motecules
in particular c m escape easily since the difisivity of CO2 is much higher than that of longer
chah blowing agents s w h as butane [55] , The mass flow rate of the polymedgas solution
was then determined by adding the measured mass flow rate of the polymer melt to the mass
fiow rate of CO2, which was readily determined by the readings of the gas injection pump.
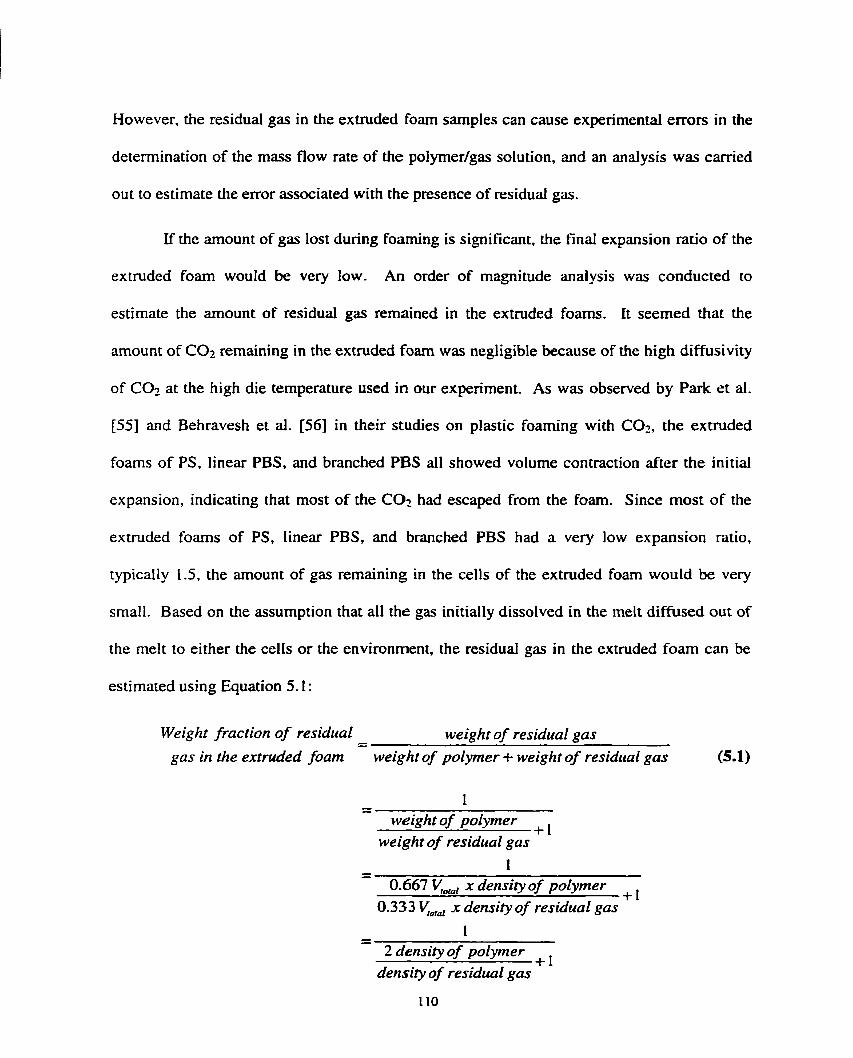
However, the residuai gas in the extmded foam samples can cause experimental errors in the
determination of the mass flow rate of the polyrner/gas solution, and an analysis was carried
out to estimate the error associated with the presence of residuai gas.
If the amount of gas lost during foarning is significant, the final expansion ratio of the
extruded foam would be very low. An order of magnitude analysis was conducted to
estirnate the amount of residual gas remained in the extruded foams. B seemed that the
amount of COz remaining in the extmded foarn was negligible because of the high diffusivity
of CO7 at the high die temperature used in our expriment. As was observed by Park et al.
[55] and Behravesh et al. [56] in their studies on plastic foaming with CO?, the extruded
foams of PS, linear PBS, and branched PBS al1 showed volume contraction after the initial
expansion, indicating that rnost of the CO? had escaped frorn the foam. Since most of the
extruded foams of PS, linear PBS, and branched PBS had a very low expansion ratio,
typicdly 1.5, the arnount of gas remaining in the cells of the extmded foam would be very
small. Based on the assumption that al1 the gas initially dissolved in the melt diffused out of
the melt to either the cells or the environment, the residual gas in the extruded foam c m be
estirnated using Equation 5.1 :
Weight fraction of residual - - weight of residual gus gas in the extruded foam weight of polymer + weight of residrtal gus (5.1)
- - 1 weight of polymer
+ l weight of residual gus
- - 1 0.667 v a , x density of polymer
+I 0.333 V;,,, x density of residual gas
- - 1 2 density of polymer
+ l densiîy of residual gus
It should be noted that the density of the polymer in Equation 5.1 is the value at room
temperature and the density of COz is the value at the crystallization temperature of the
polymer at 1 atm. Because the cellular structure is solidified and fixed at the crystailization
temperature, the amount of gas in the foam is determined by the occupying volume of cells at
this temperature [56,67]. Based on the density of PS as 1 .O4 @cm3 and the density of COz at
100°C as 0.00142 g/cm3 [68], the weight fraction of residual gas in the extruded PS foarns is
estimated to be 0.07%. For the case of PBS/C02 solutions, the weight fraction of residual
gas in the extmded foam is estimated to be 0.06% based on the density of PBS as 1-27 @cm3
and the density of CO2 at 88°C as 0.00147 glcm3 [68]. This analysis indicates that the
amount of residual gas that remained in the extruded foarns dunng the measurement of the
mass flow rate of the polymer melt was negligible.
Errors InvoIved in the Measurement of the Mass Flow Rate
The human error associated with measuring the amount of extrudate per given tirne
could be significant. The mass flow rate was determined by collecting the extruded foam for
a fixed tirne and weighing it. A watch was used to monitor the time and a sharp edged cutter
was used to cut the extrudate corning out of the small diarneter filament die. Since we did
not use a precise stopwatch to measure the fixed time period, the cutting of the extrudate may
not have been synchronized exactly with the tirne. If we consider the human error range
involved in the time watch operation or in the cutting action for the extruded system, the error
in the length of the time period would be as much as 0.3 seconds. if we collect the extrudate
foarn for one minute, the corresponding error on the measured m a s flow rate would be
approximately 0.5% (Le., equal to 0.3s/6Os). This means that the error range for the
cdculated specific volume due to this human error would be as much as OS%, since the
specific volume is inversely proportional to the mass flow rate.
However, if a precise stopwatch was used to time the collection period, the error
associated with the extrudate collection would have been reduced to be approxirnately 0.1
seconds, then the associated human error in the measured mass flow rate would be reduced to
0.17% (Le., equal to O. ls/6Os). Using a longer collection time period woutd further reduce
this error. To minimize the human error associated with collection of the extrudate, a more
effective method for accurately measuring the m a s flow rate should be developed in the
future.
Additional Remarks on the Developed PVT Measurement Svstem
The newly developed system seems to be capable of measuring the specific volumes
of polyrner/COt solutions within an observed error range of +/- 0.8%. Since the specific
volumes of polyrner/COz solutions in a molten state have never been available previously, the
newly measured PVT data are expected to exert a great impact on the fundamental
understanding of the interactions between polymer and gas molecules. Furthermore, other
thermodynamic and rheological properties, such as the viscosity of polymer/gas solutions and
the solubiIity of gas in the polymer matnx, cm be anaiyzed based on the measured PVT data.
One limitation of the developed apparatus is that it can measure the PVT relationship
of a polymer/gas solution only under extrusion processing conditions above the
crystallization temperature of the polyrner. Thus, the ranges of temperature and pressure for
the measurement are Limited to the extrusion processing conditions. In order to determine the
swelling of a polymer in a solid state due to dissolved gas, the apparatus developed by Hirose
et al. 1221 should be used as discussed in Section 2.1.
5.5 CONCLUSIONS
An innovative system for measuring the PVT properties of polyrner/gas solutions was
designed and constructed using a positive displacement gear pump rnounted on a tandem
extrusion system, A metered amount of gas was injected into the polyrner matrix to form a
single-phase solution. The temperature was controlled by the second extruder and a heat
exchanger. The pressures in the upstream and downstream of the gear pump were controlled
by the rotational speed of the second extruder and a variable resistance die, respectively. With
the developed system, we successfully rneasured the PVT properties of PS/C02 solutions,
Iinear PBS/C02 solutions, and branched PBS/C02 solutions, at temperatures ranging from
147°C to 167°C for PBS materials and from 180°C to 220°C for PS material and at pressures
of 1 3 -78 MPa, 20.68 MPa, and 27.58 MPa (2000 psi, 3000 psi, and 4000 psi). Mathematical
modeling of the measured data based on the Sanchez-Lacombe EOS and rnixing niles
produced interaction parameters that differed from data obtained conventionally at the
solubility equilibrium condition because Our experiments were conducted with a CO2
concentration much lower than the solubility equil ibrium concentration. Since the
experïmental conditions varied from the conventional method, we modified and fitted the
interaction parameters as a function of temperature, pressure, and gas content. The
inconsistency between the interaction parameters calculated using the S-L EOS and those
reported previously suggests that the S-L EOS may be insufficient for describing the PVT
behaviours of potymer/CO2 sohtions.
The newly developed method represents a significant contribution to PVT
measurement instrumentation since it enables direct measurement of the PVT properties of
polyrner/gas solutions in a molten poiyrner state, which has not been reaiized previously. The
measured PVT relationships for poIyrner/gas soIutions would be very useful in predicting and
understanding the thermodynamic and rheological behaviours of various poIymer/gas
solutions.
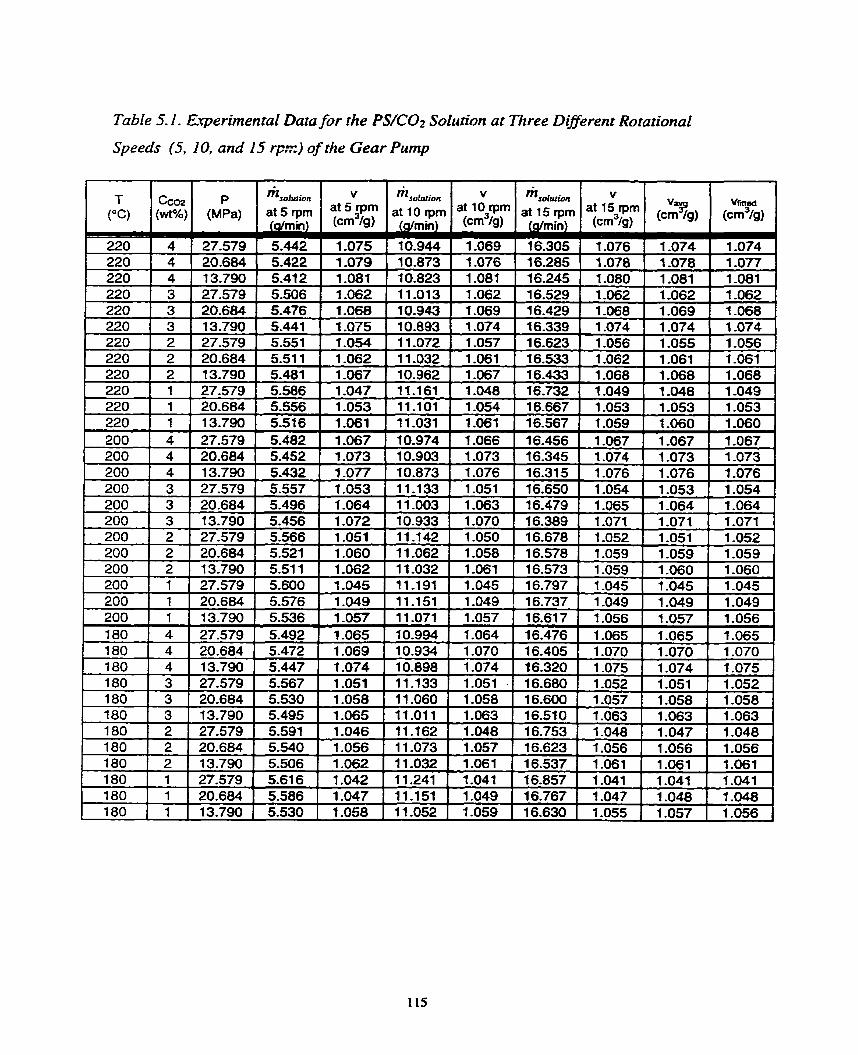
Table 5.1. Erperirnental Data for the PS/C02 Solution ut Three Different Rotational
Speeds (5, 10, and 1.5 qx) of the Gear Prtmp
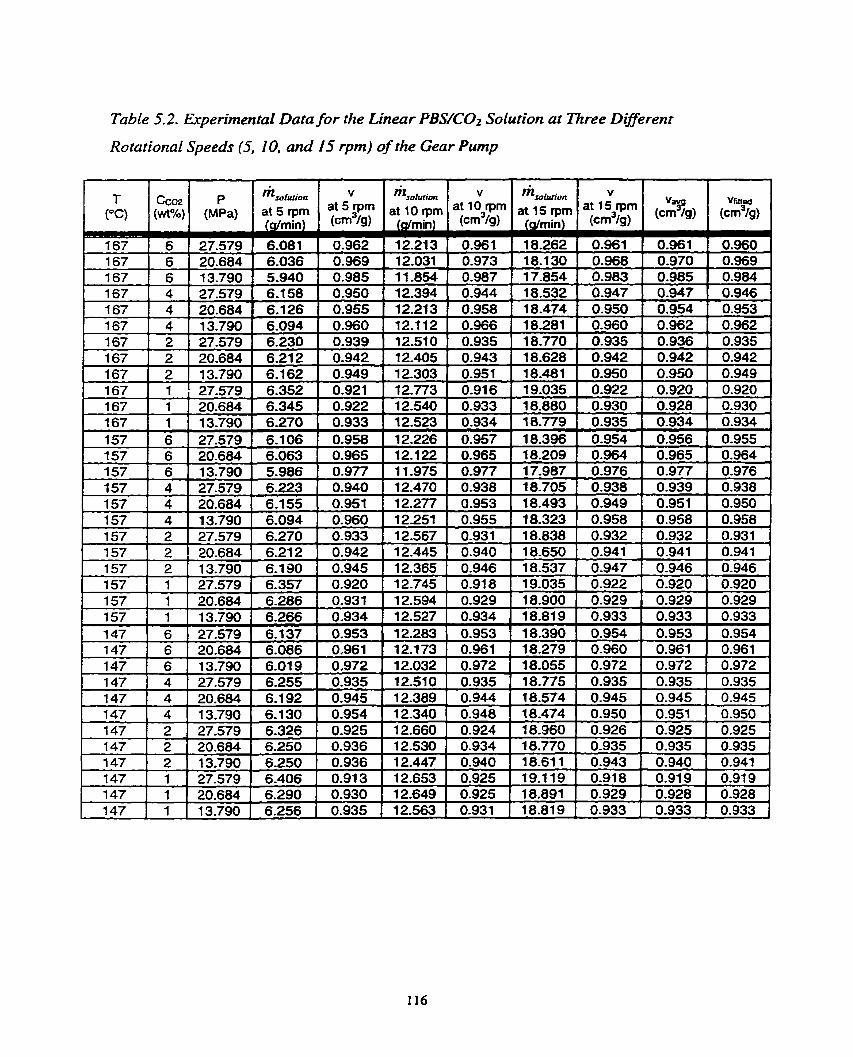
Table 5.2. Experimental Data for the Linear PBS/C02 Solution at Three Differenr
Rotational Speeds (5, IO. and 15 rpm) of the Gear Pump
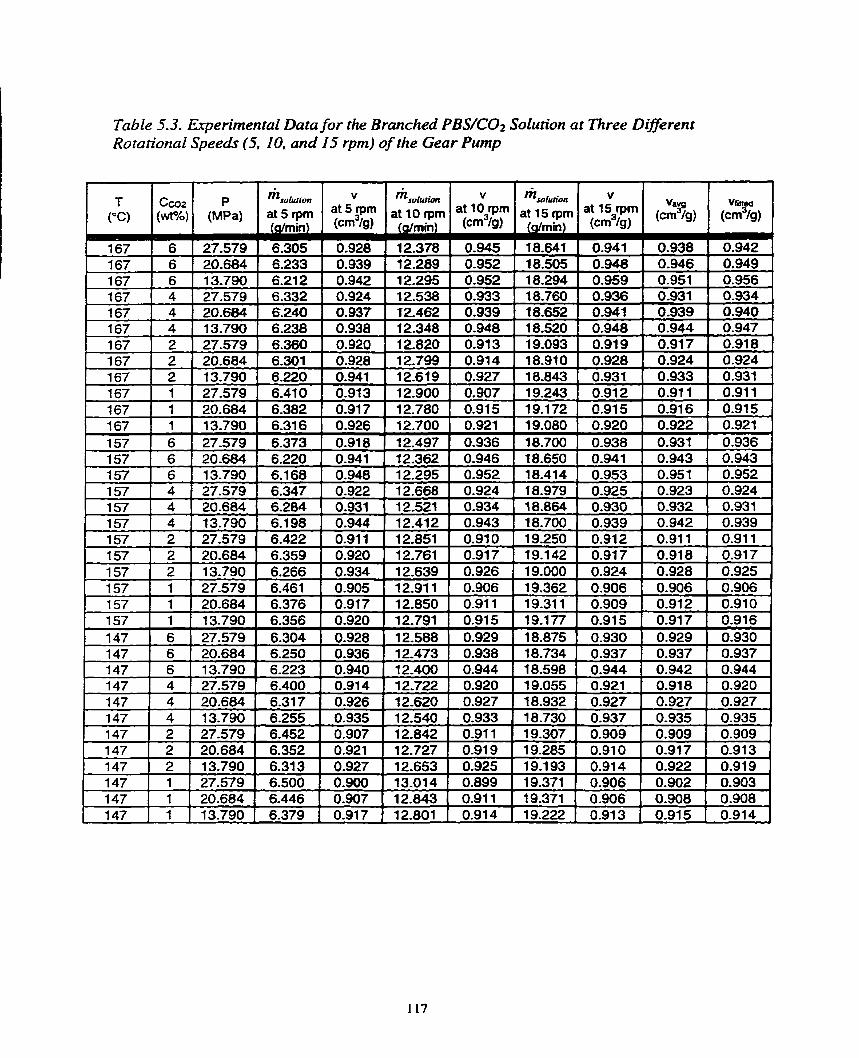
Table 5.3. Experimentai Data for the Branched PBS/C02 Solution as Three Dzzerent Rotational Speeds (5, 10, and 15 rpm) of the Gear Pump
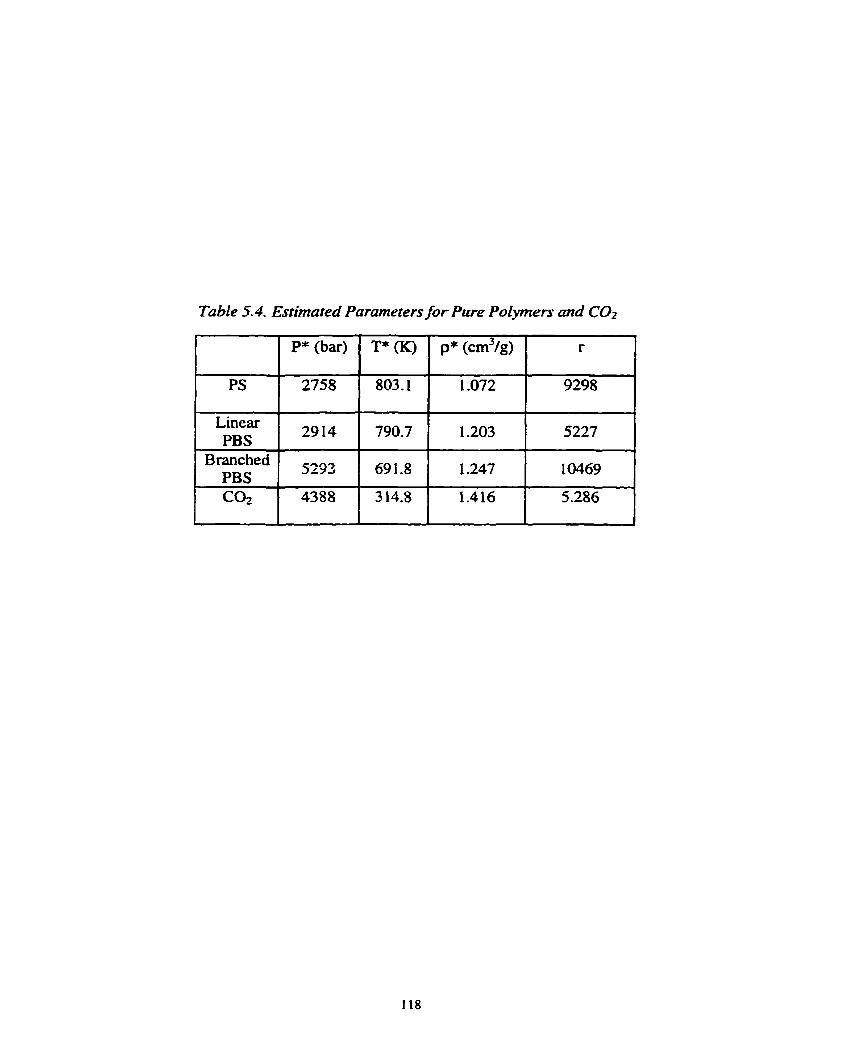
Table 5.4, Estimated Parameters for Pure PoZymers and CO2
PS
Linear PBS
Branched PBS COz
T* (K)
803.1
790.7
69 1 -8
3 14.8
P* (bar)
2758
2914
5293
4388
p* (cm31g)
1.072
1.203
1 -247
1.416
r
9298
5227
10469
5.286
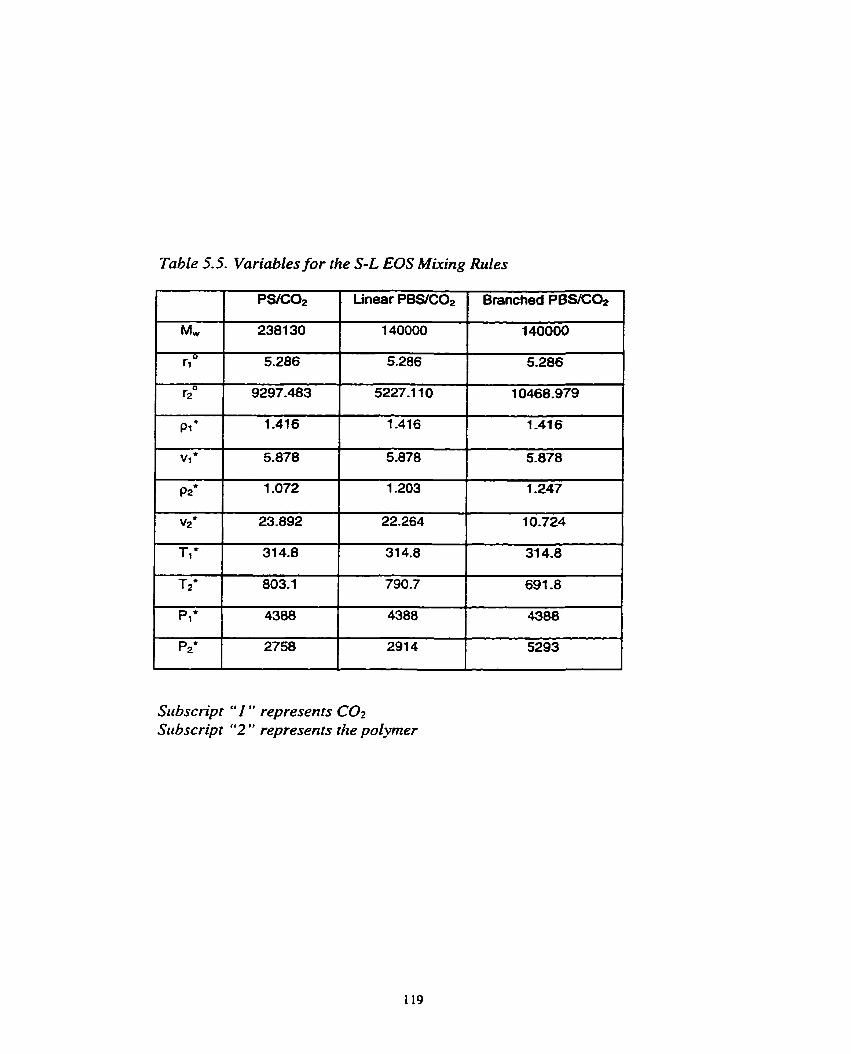
Table 5.5. Variables for the S-L EOS MUcing Rules
Srrbscn'pt " 1 " represen rs COz Subscript "2 " represents the polymer
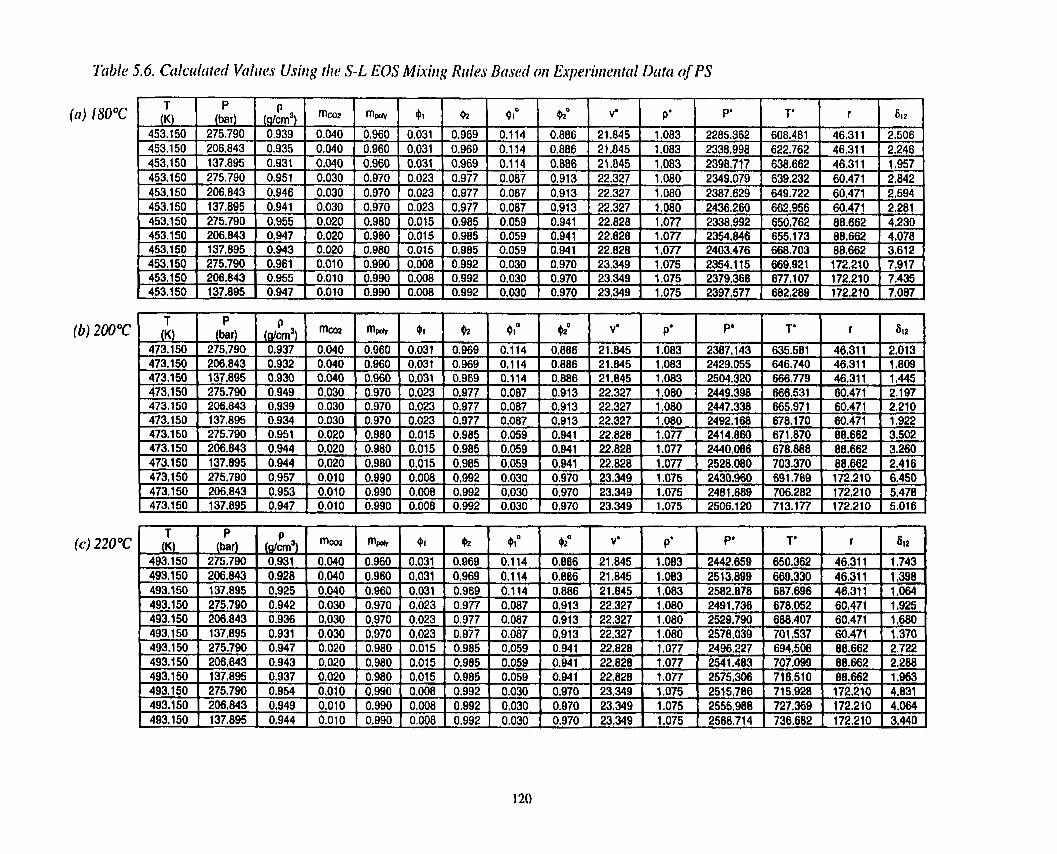
(a ) 180°C
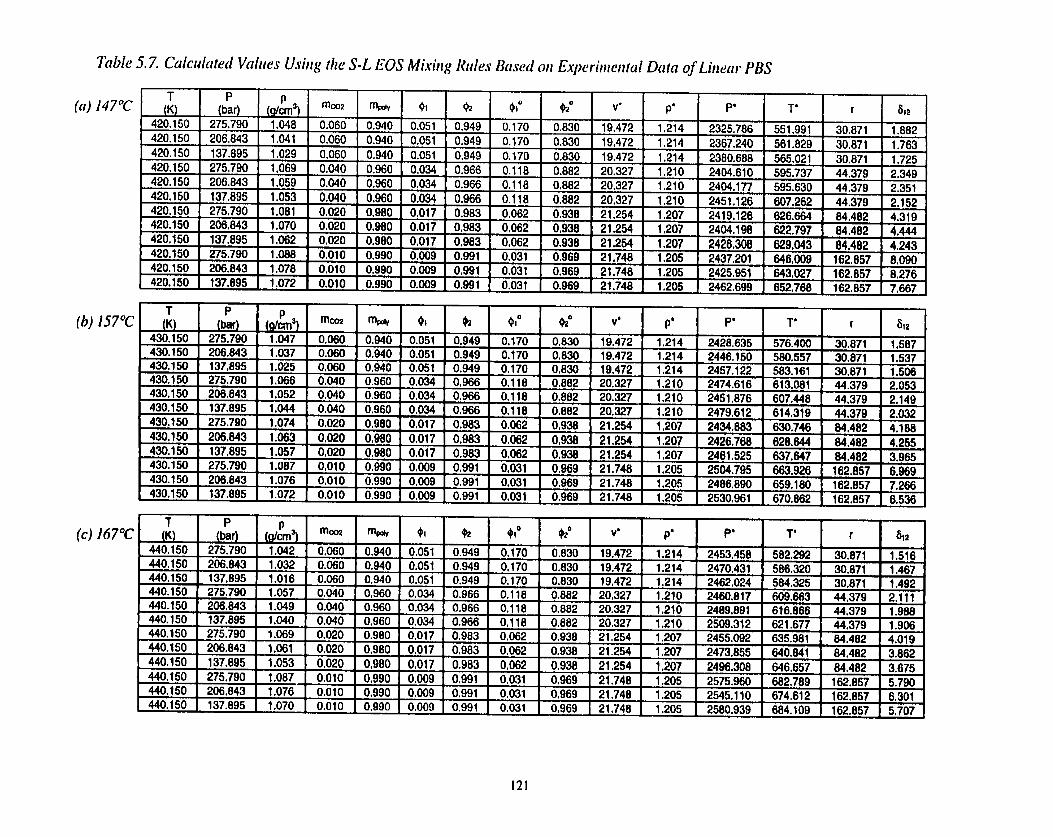
(c) 167OC
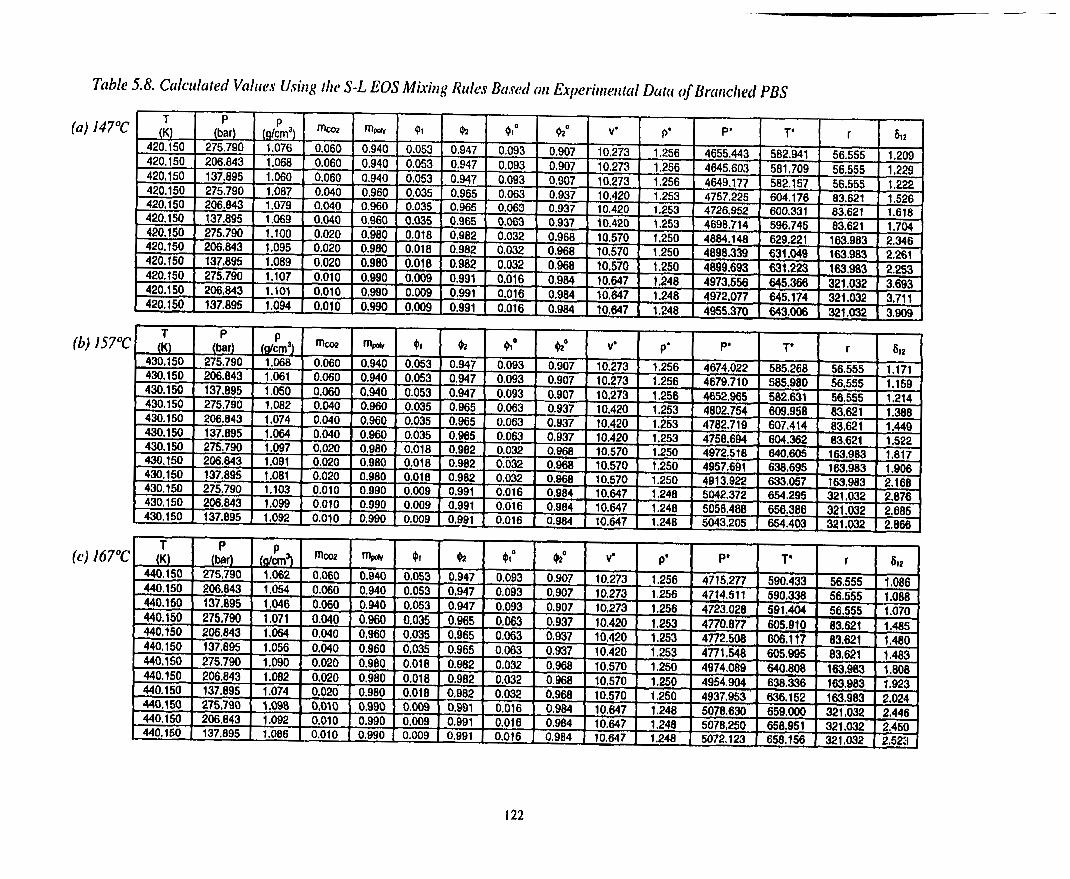
(b) 157°C
Table 5.9. Characteristic Parameters of MCM EOS for PS/COL Solutions as a
Function of the Co2 Concentration
Tab[e 5-10. Characrerisric Parameters of MCM EOS for Linear PBS/C02
Solutions as a Function of the COt Corzcentration
Table 5.1 I. Characten3tic Paramerers of MCM EOS for Branched PBS/COt
Solutions as a Function of the CO2 Concentration
Table 5-12. Characteristic Parameters of S-L EOS for PSfC02 Solrtrions as a
Funcriorr of the COz Concentration
Table 5.13. Characreristic Parameters of S-L EOS for Linear PBS/CU2 Solutions
as a Function cf the CO2 Concentration
Table 5.14. Characterisric Parameters of S-L EOS for Branched PBSiCO?
Solutions as a Function of rhe CO? Concentration
Figure 5.1. Photograph of the Overall Setup with the Gus Injection System
Figure 5.2. Photograph of the Gus Syringe Pump
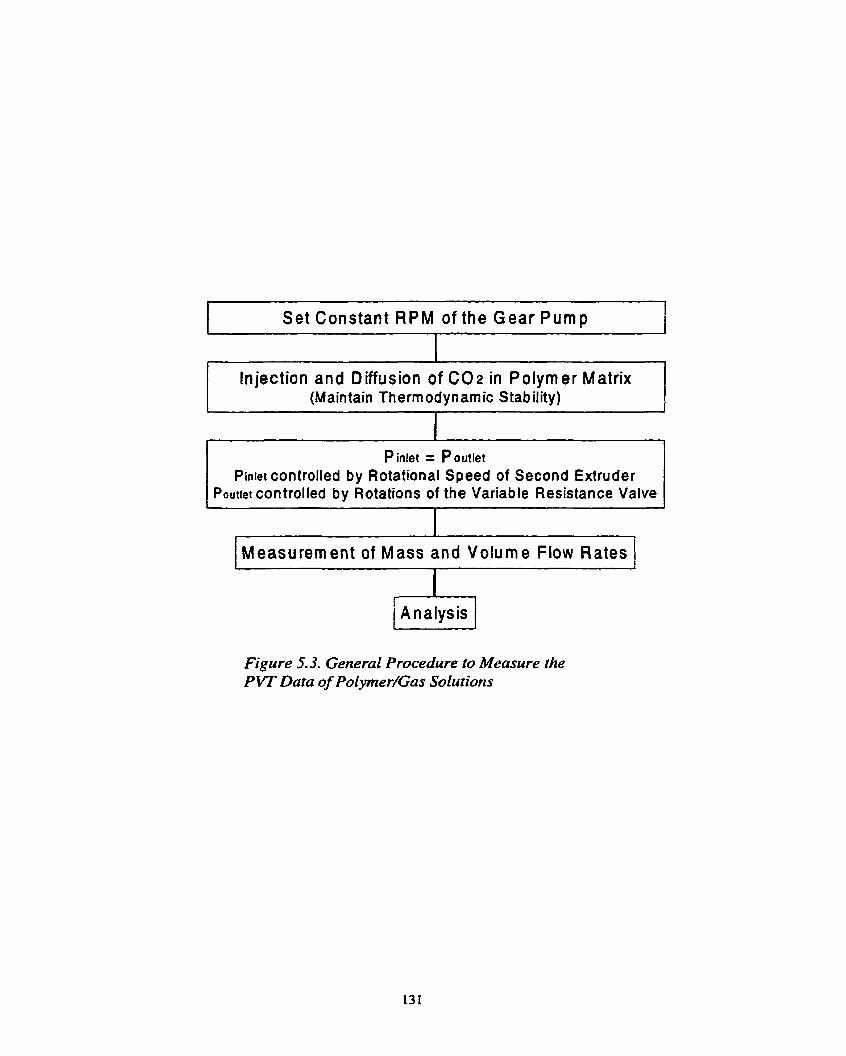
Set Constant RPM of the Gear Pump
/ Injection and Diffusion of CO2 in Polyrner Matrix (Maintain Therm odynam ic Stability)
Piniet = Poutiet Piniet controlled by Rotational Speed of Second Extruder
Poutiet controlled by Rotations of the Variable Resistance Valve
I Measurement of Mass and Volume Flow Rates
1
( Analysis -5 Figure 5.3. General Procedure to Measure the PVT Data of Polymer/Gns Solutions
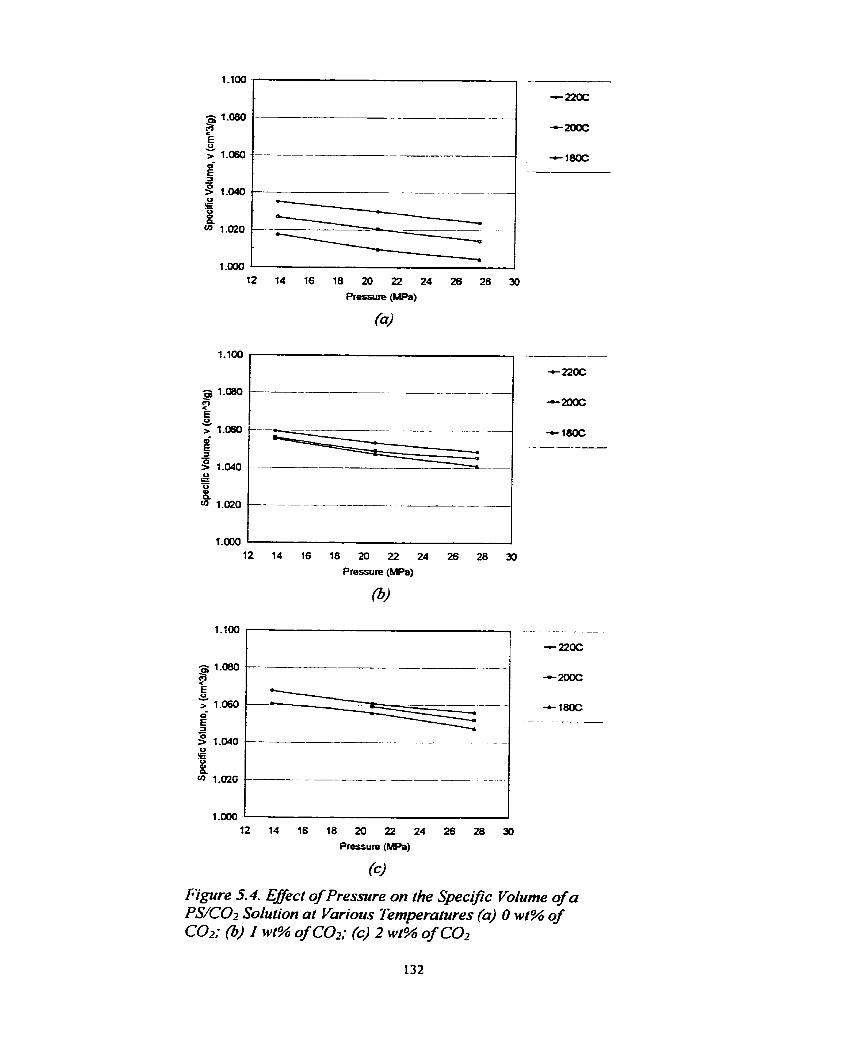
12 14 16 18 20 22 24 26 28 30 Pressure (MPa)
Figure 5.4. EjJecr of Pressure on the Specific Volume of a PS/CO2 Solution ut Various Temperatures (a) O wt% of C02; (3) I wl% of CO2; (c) 2 wt% of CO2
1 .Io0
.$1.080
I? E O - > 1.060 O 5 - Z 1.040 !2 ii v, 1026
1 . m - 12 14 16 18 20 22 24 26 28 30
Pressure (MPa)
- - -
-- - -- -
+ 220C
-
.--
. -
-200C
-lm - -
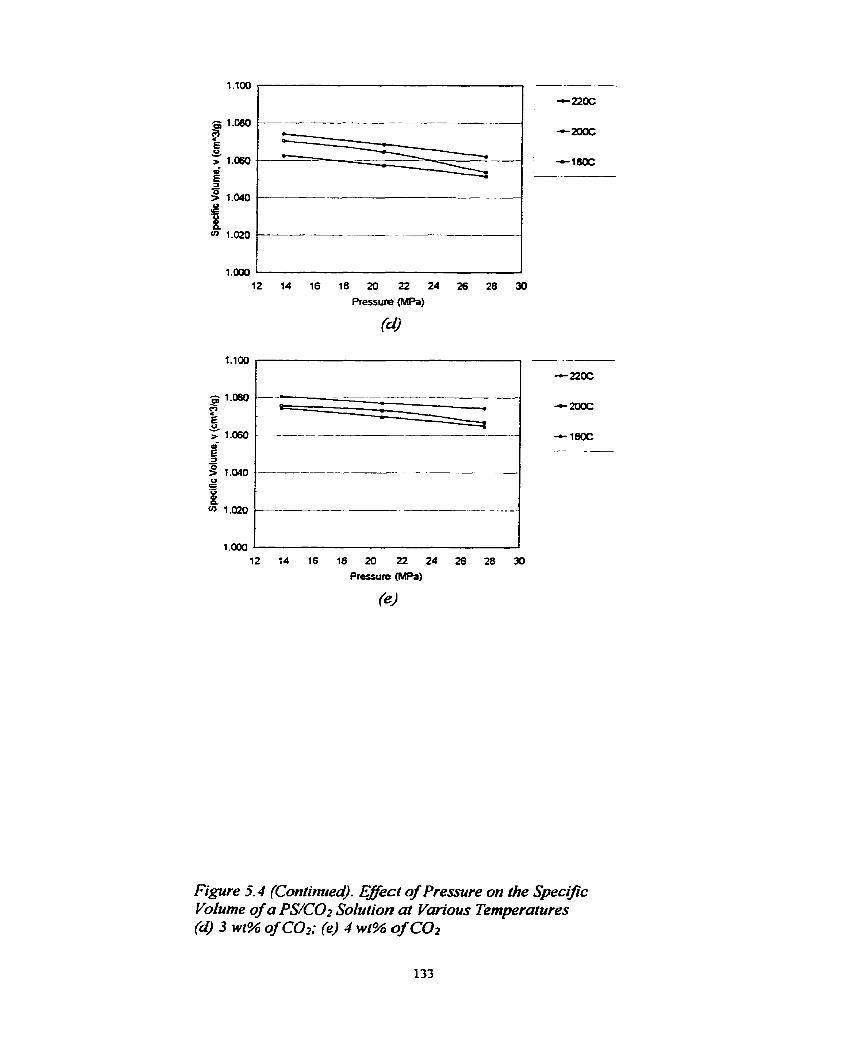
Figure 5.4 (Contimed)). Eflect of Pressure on the Spec~jk Volume of a PS/C02 Sohtion at Vmious Temperatures (d) 3 wi% of COz; (e) 4 wt% of CO2
1.100
â 1.060
9 Y E ? 1.060 Q)
5 - O > 1.040 0 E
ii vJ 1.020
1 .O00 12 14 16 18 20 22 24 26 28 30
Pressure (MPa)
(e)
-
.S. -- -p.
------- --- ---
----
--P - 220C
-200C
- 180C
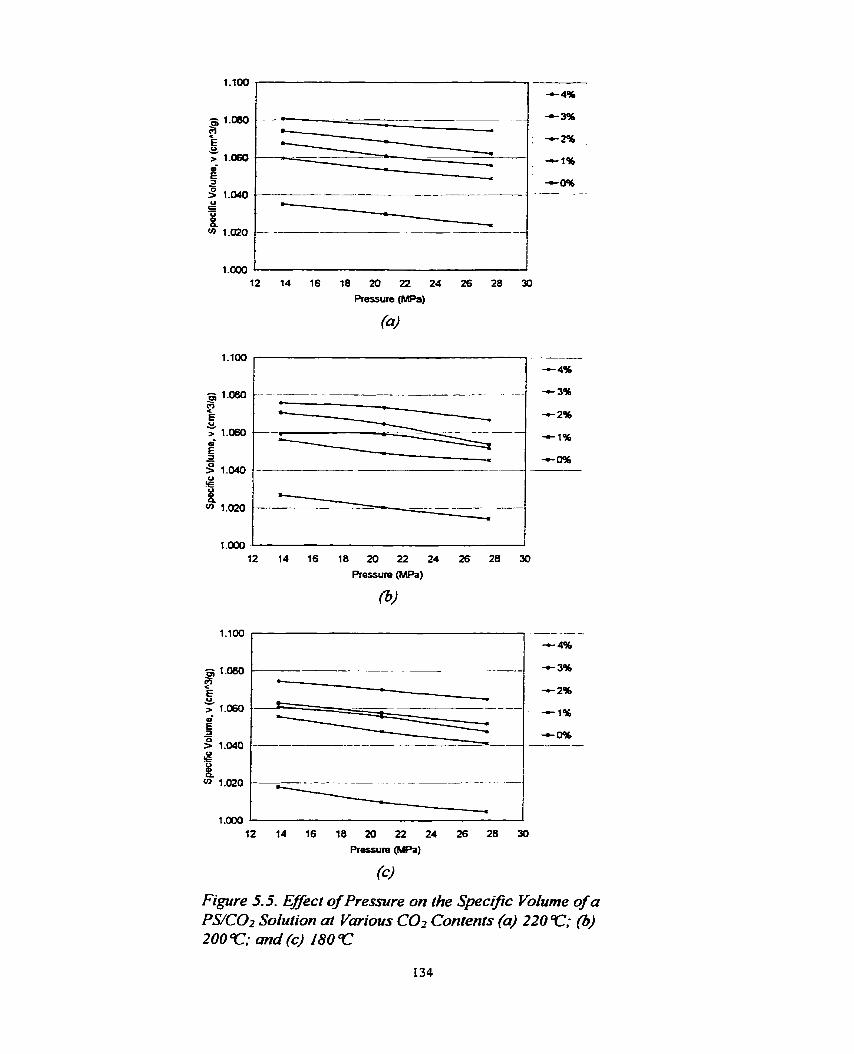
Figure 5.5. Effecf of Pressure on the Specific Vofume of a PS/C02 Soluiion af Various CO-, Conîenfs (a) 220 'C; (6) 200 C; and (c) 180
--- -4% - 3% -2% - 1%
+O96 --
1.100 .
1.1 00
- 1.080 e 9 E O - '-" S - 3 1.040
i 1.020
1.000
12 14 16 18 20 22 24 26 28 30 Pressure (MPa)
,l.oso
z' E 0 Y
> 1.060 e- S - 8 1.040 O
1 * 1.MO
1.000
-- -.
** --
-- -- - .
r
12 14 16 18 20 22 24 26 28 3û
Pressure (MF%)
-t 4%
4-3s - 2% :--- --- --
. - m
--Ir;
-0% --
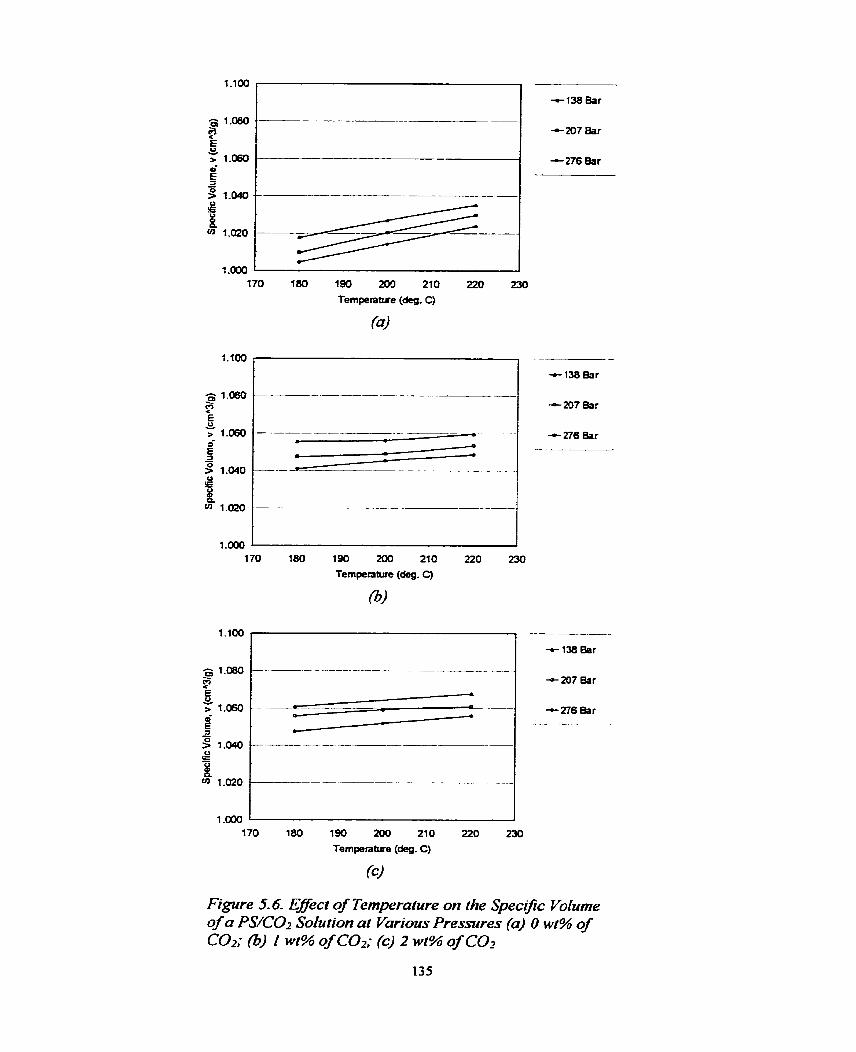
Temperature (deg. C)
(a)
1.100
-1.080 e P 5 V
2. 1.060 6 !E - 3 1.040
Temperature (deg. C)
O
-138 Bar
1,000 170 180 190 210 220 230
---
---
-- 207 Bar
-p.
-c 138 Bar
-207 Bar
-276 Bar
- 276 Bar --A--
- 138 Bar
170 180 190 200 210 220 230
Temperature (deg. C)
(c)
+207 Bar
-276 Bar .- - --
Figure 5.6. Ejecci of Temperature on the Spectjk Volume of a PS/C02 Solution ar Vmious Pressures (a) O wt% of COI; (I) i wt% of C02; (cl 2 wz% of CO2
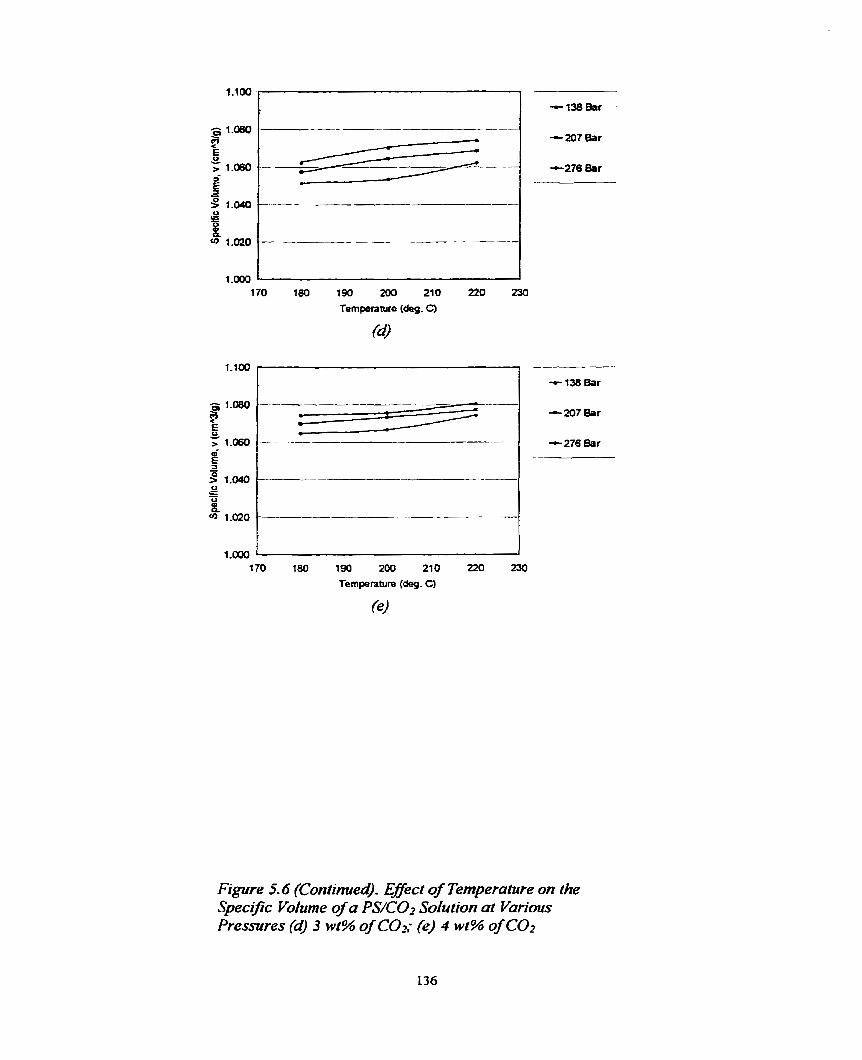
l-lm / - -r 138 Bar
1 170 180 190 200 210 220 230
Temperature (deg. C)
@..
, ---- -r 138 Bar
- 276 Bar
Figwe 5.6 (Contimed). Effeci of Temperature on the Specific Voiume of a PS/C02 Soiution aï Vatims Pressures (4 3 w f % of CO?; (el 4 WC% of CO2
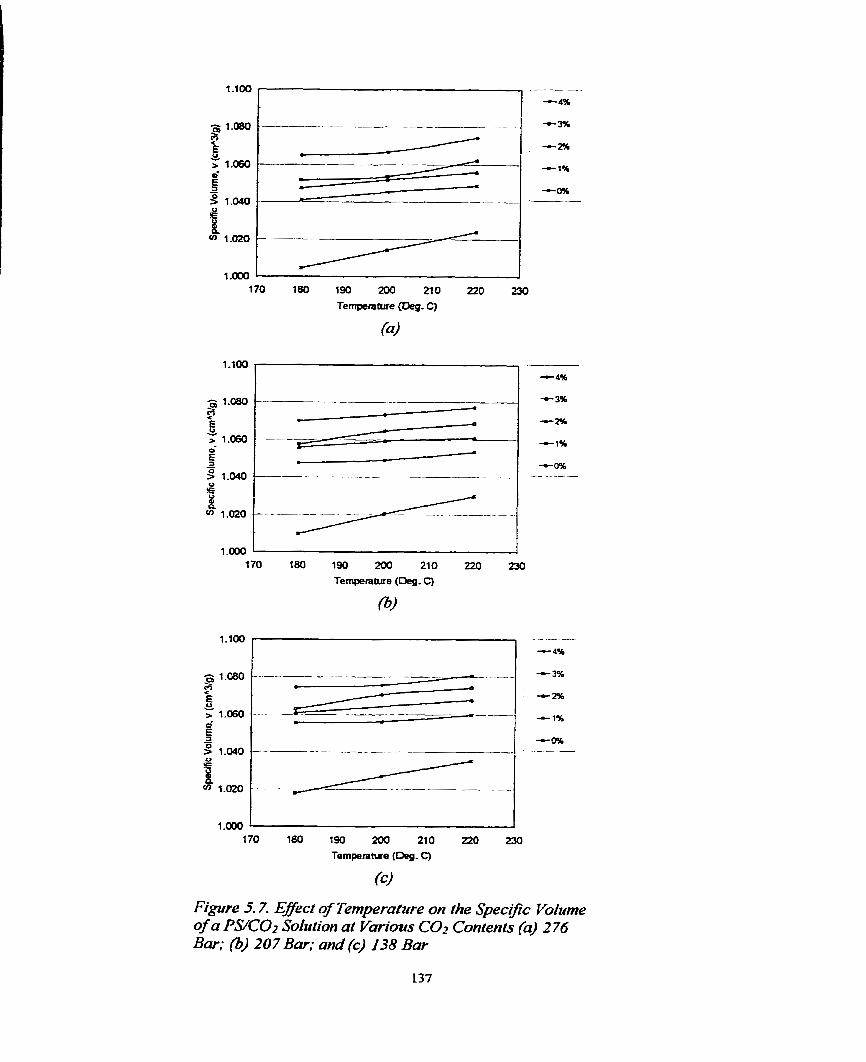
Figue 5.7. Efect of Temperature on the Specijc Volume of a PS.C02 Solution at Vwious CO2 Contents (a) 2 76 Bar; (3) 207 Bar; ond (c) 138 Bar
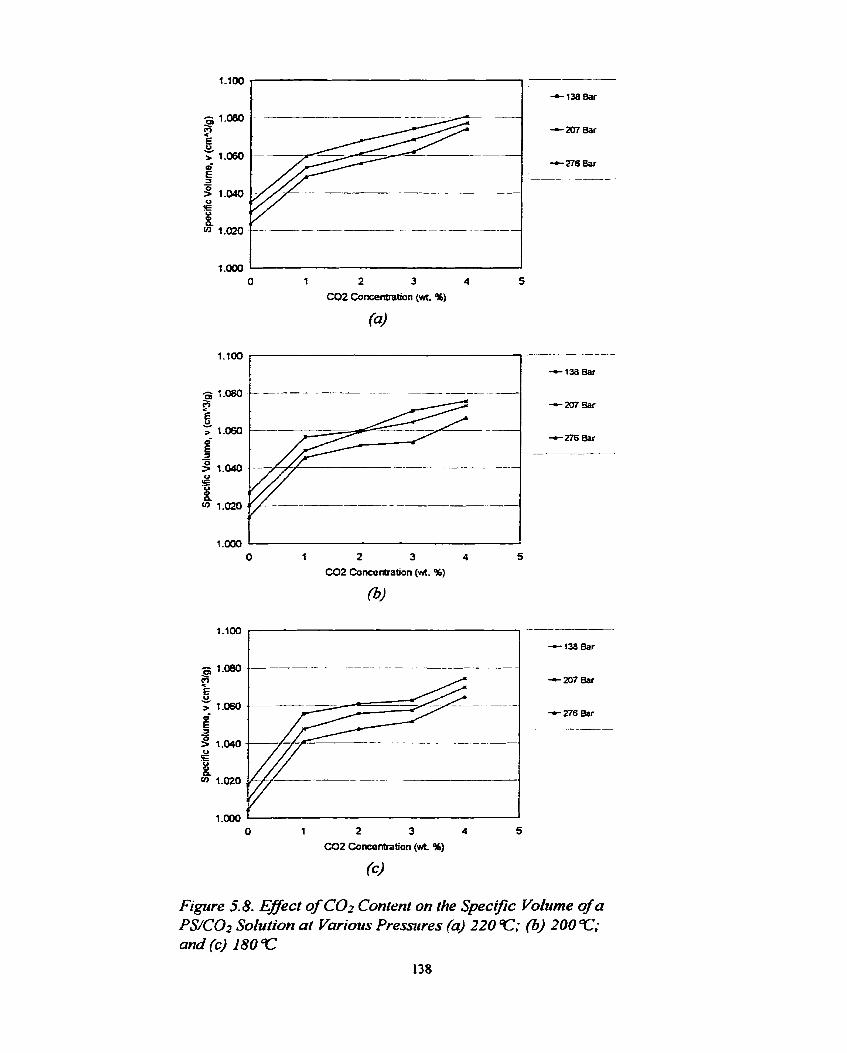
O 1 2 3 4 5 CO2 Concentration (wt. %)
Figure 5.8. Eflecr of CO2 Content on the Specific Vofume ofa PS/COr Solution at Various Pressures (a) 220 C; (6) 200 r; and (c) 180 4:
138
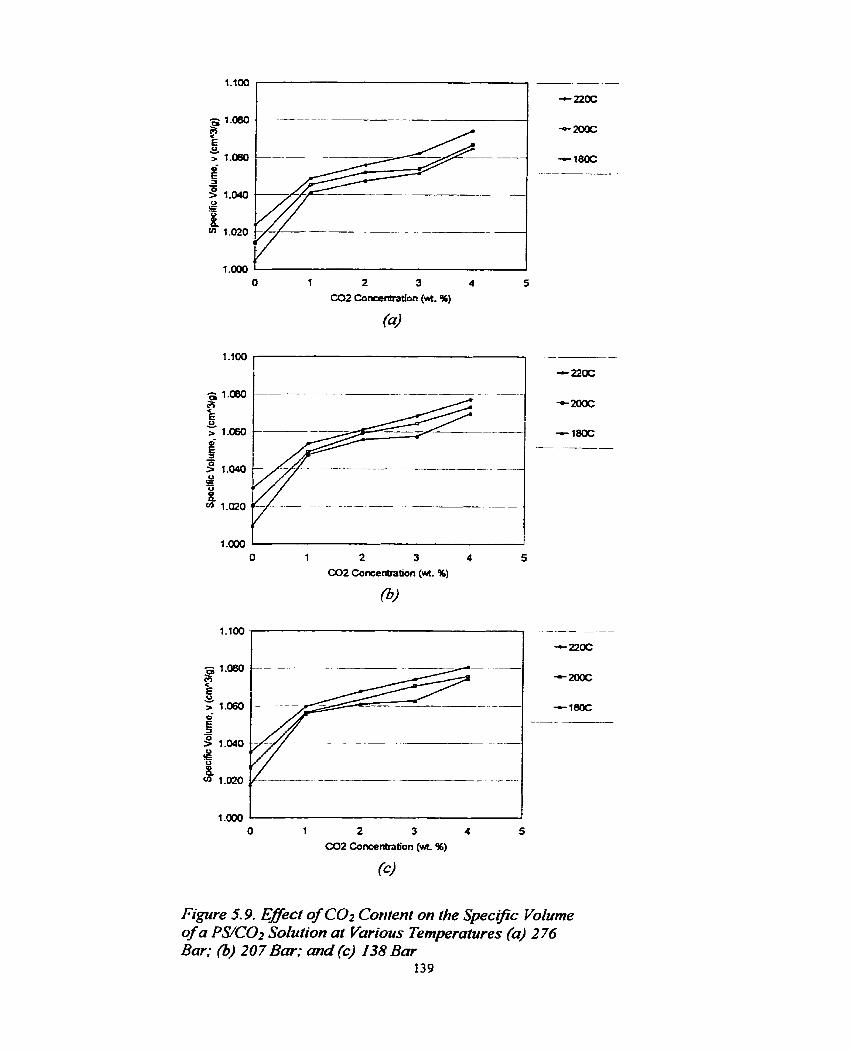
COZ Concentration (wt. %)
(a)
CO2 Concentration (M. %)
(6)
1 2 3 4
CO2 Concentration (wt %)
(c)
Figure 5.9. Efject of CO2 Cor~tenf on the Speczjic Volume of a PS/C02 Sohtlon al Vm*ous Tempera~ures (a) 276 Bar; (b) 207 Bar; and@) 138 Bar
139
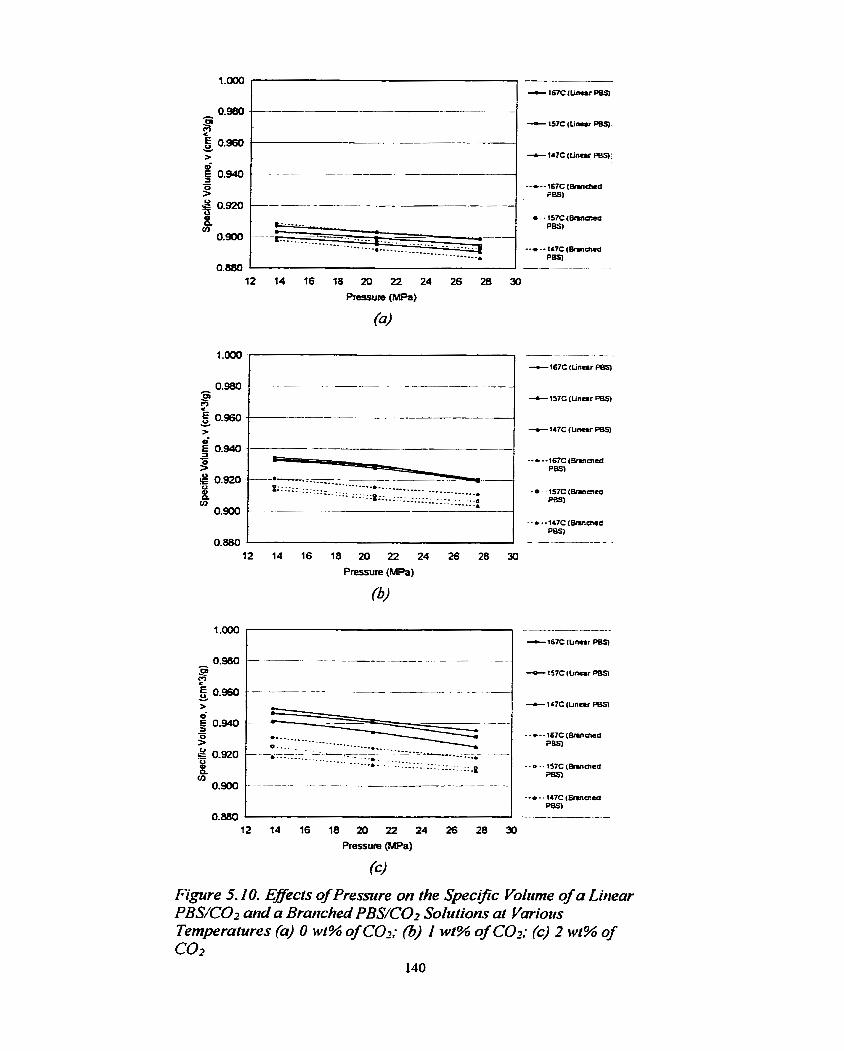
Figure 5.1 O. Ef/ects of Pressure on the Specifc Volume of a Linear PBS.C02 and a Branched PBS/COî Solutions at Vuriotcs Tempera~ures (4 O wî% of COz; (b) 1 wt% of COz; (c) 2 wt% of CO2
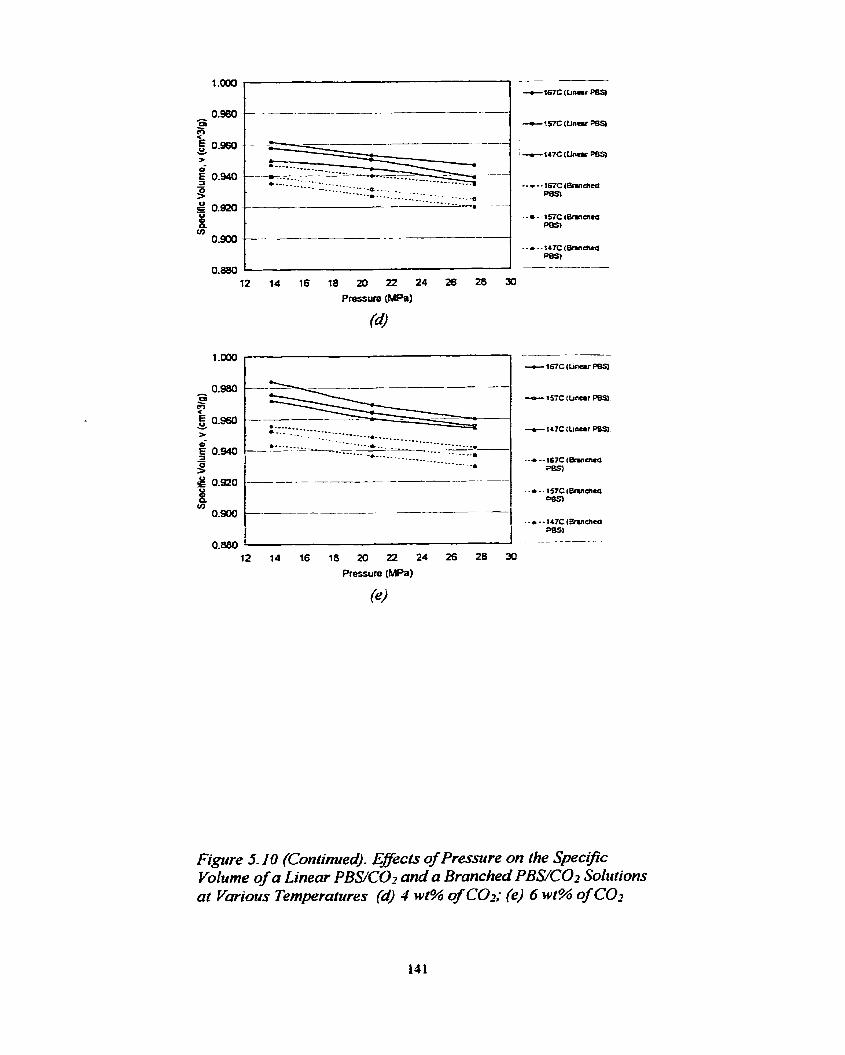
Figure 5- IO (Continued). Effecfs of Pressure on ihe Specific Volume of a Linear PBS/C02 and a Branched PBS/COz Solutions ut Varias Temperatures ( i 4 wr% of C a ; (el 6 wt% of Ca
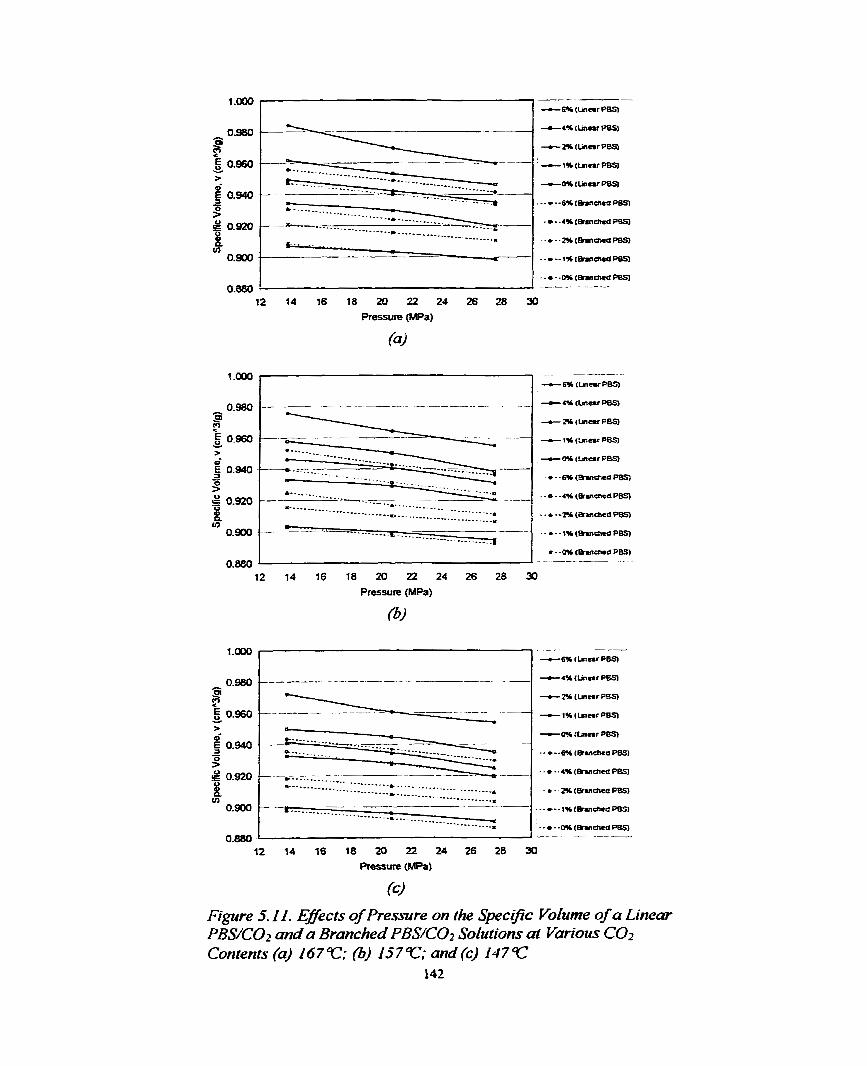
Figure 5. i. 1. Effects of Pressure on the Speczfc Volume of a L hem PBS/C02 nnd a Branched PBS/C02 Solutions ut Varrarrms CO2 Contents (a) 16793: (b) l57C; md(c) 147@
142
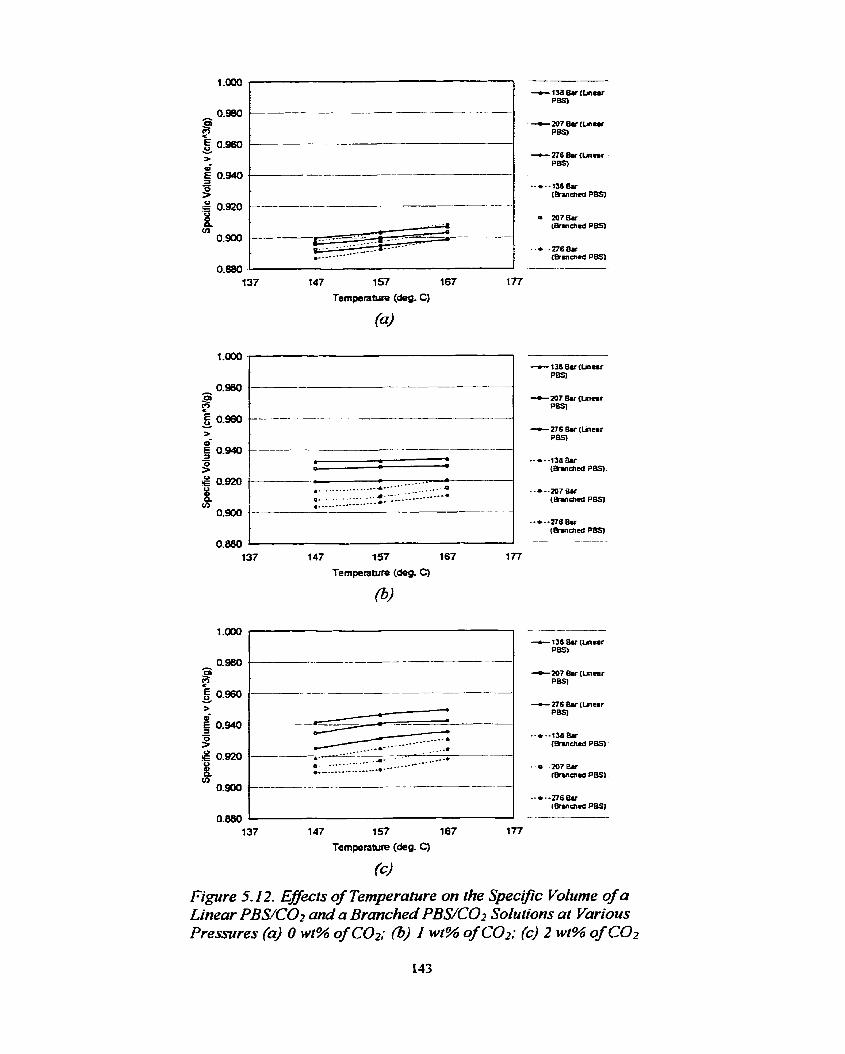
Figure 5.12. Effects of Temperature on the Specipc Volume of a Linear PBS/C02 and a Branched PBS/C02 Solutions al V ~ o u s Pressures (a) O wt% of COz; (3) i wt% of CO.?; (c) 2 wt% of C0.z
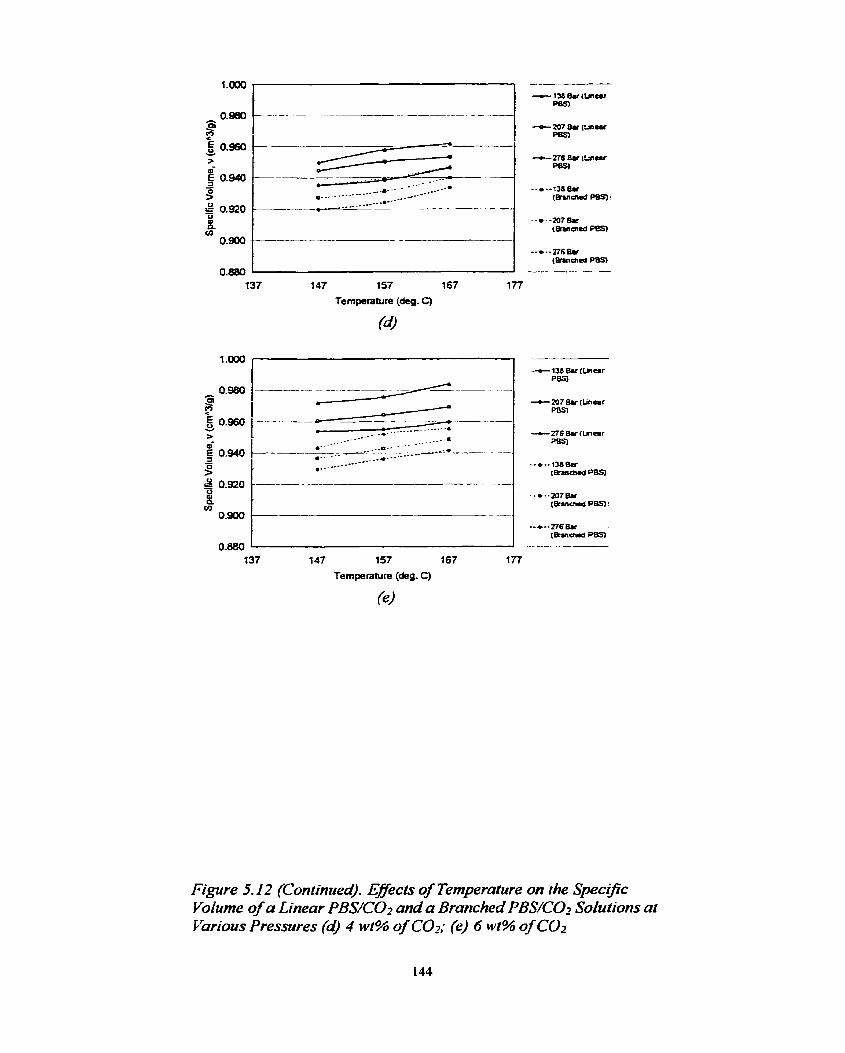
137 147 1 57 167 1 77 Temperature (deg. C)
(9
Figure 5.12 (Continued). Effects of Temperature on the Spec~jTc Volume of a Linear PBS/C02 and a Branched PBS/C02 Solutions at V i o u s Pressures (d) 4 wt % of COz; (e) 6 wt% of COz
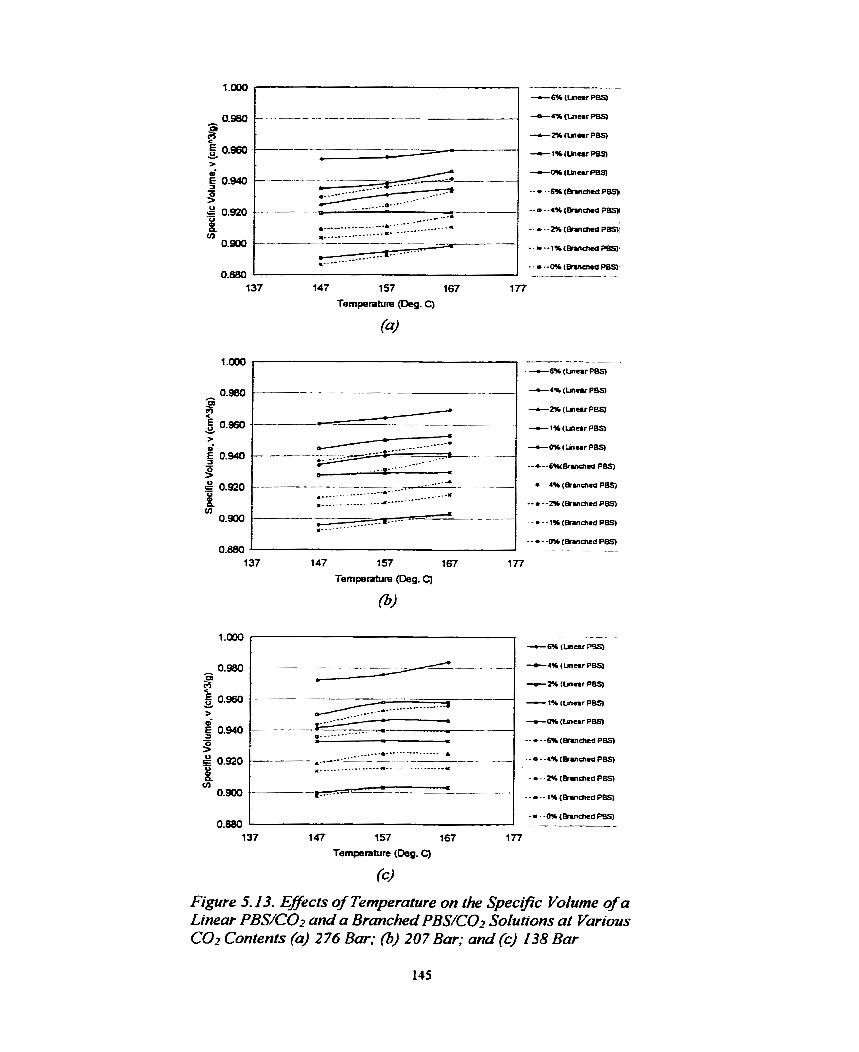
Temperature (Deg. C)
-2% (ûneir PeS, - 1% (imemr PBS) >
-Wb ( m u r PBS)
=..-- -. - - - - Q-
L ---.. 6% (Blnched PBS)
0.920 =.- -.-- . -...-.-... .--.-.... (
- a . ïs (&Mencd P m
- - - - - l % ( ~ v i c n e a ~ r n
0.880 --
137 147 157 167 1 77
Temperature (Deg. C)
Figure 5.13. Eflects of Temperature on the Specrfic Vofume of a Linem PBS/CO2 and a Brancheci PBS/C02 Sohrions at Various COr Conîents (a) 2 76 Bar; 0 20 7 Bar; and (c) 138 Bar
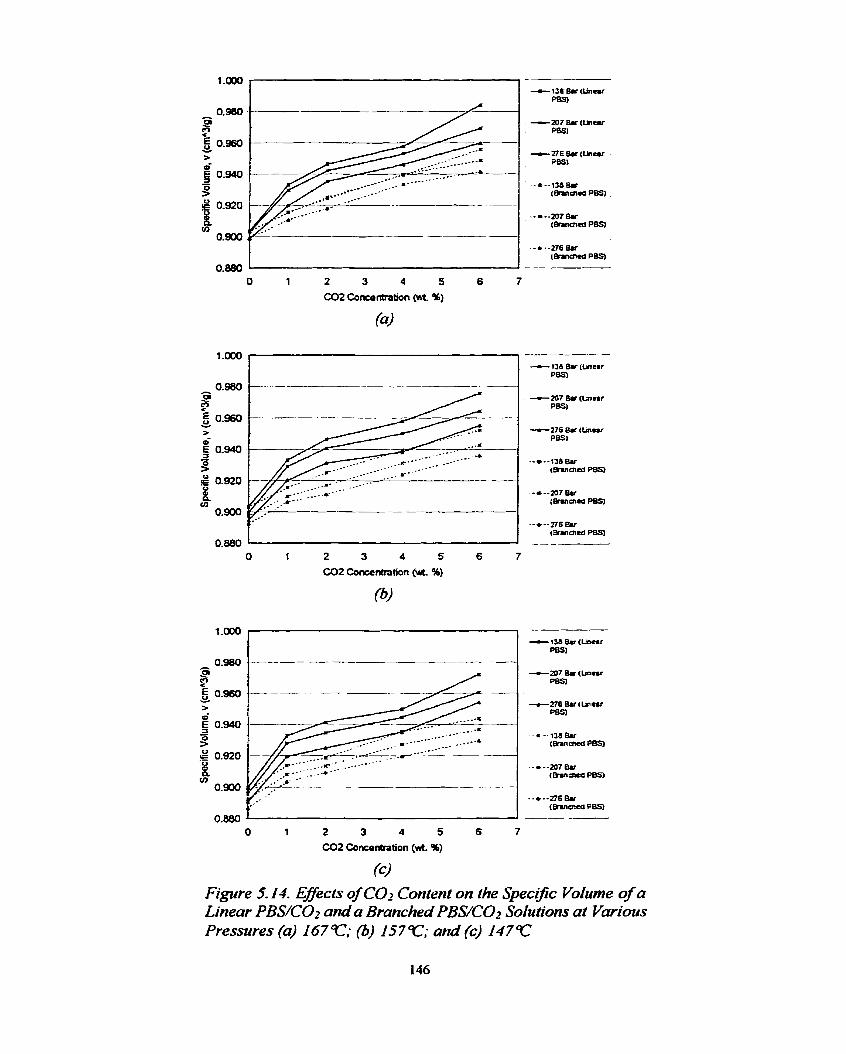
CO2 Concentration (HR- 94)
f i !
O t 2 3 4 5 6 7 (332 Concentration (wt. %)
(c) Figure 5. M. Effects of CO2 Content on the Specific Volume of a Linear PBS/C02 and a Brmched PBS/C02 Solutions at Various Pressures (a) 1 6 7 r ; (3) 1 5 7 r ; and (c) 1 4 7 r
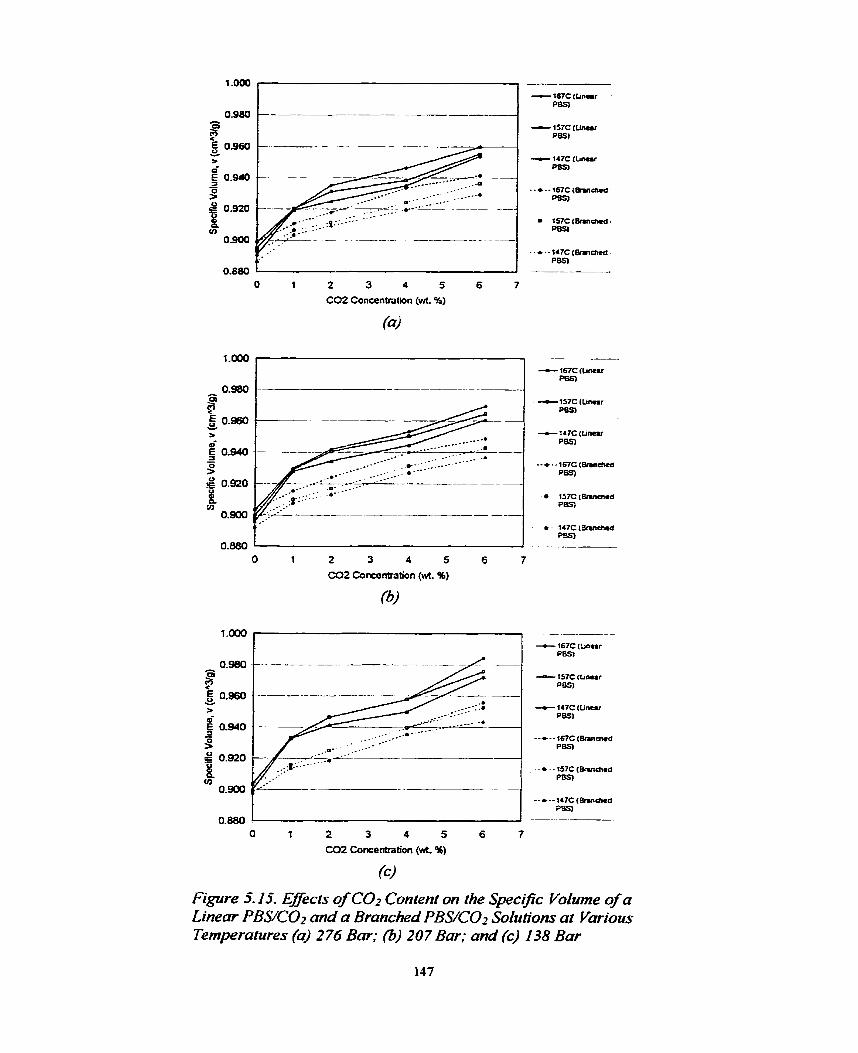
CO2 Concentration (wt. %)
0.880 O 1 2 3 4 5 6 7
CO2 Concentration (uh %)
(c)
Figure 5.15 Effects of CO2 Con~ent on the Specific Volume of a Linear PBS/COr and a Branched PBYC02 Solutiom at Various Temperatures (a) 2 76 Bar; (6) 207 Bar; and (c) 138 Bar
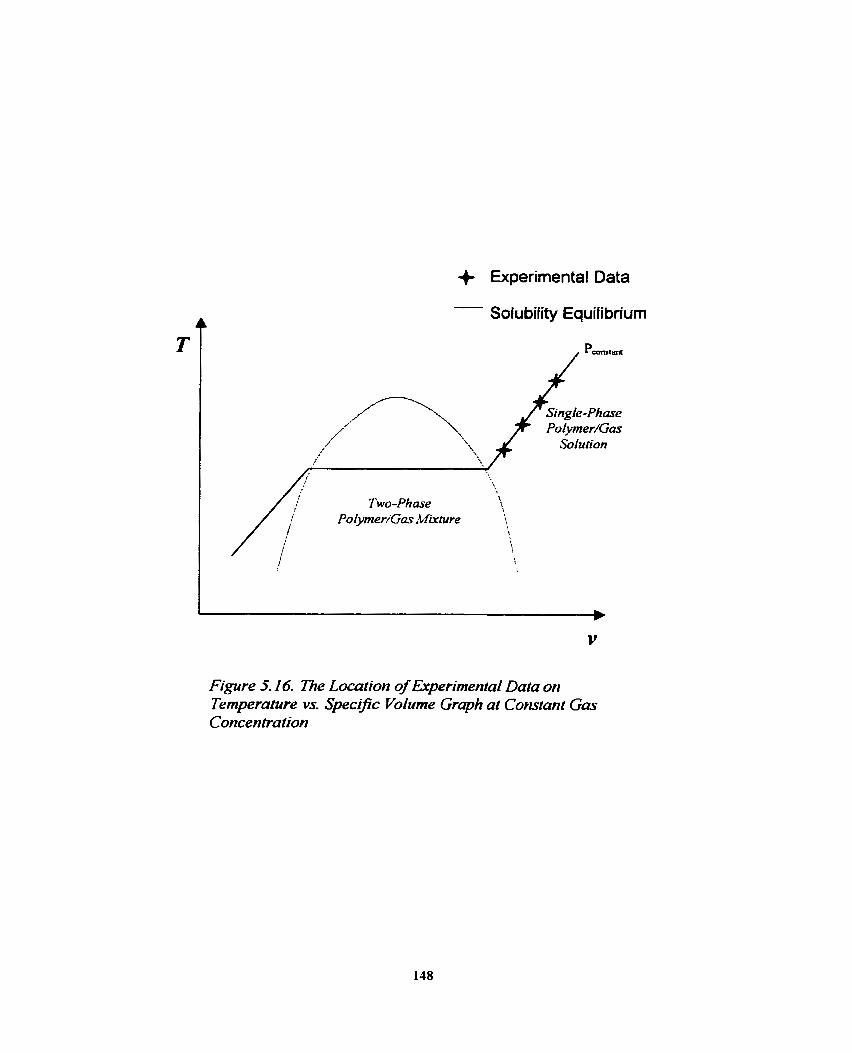
+ Experimental Data
Figure 5.16. The Location of Erperimentaf Data on Temperature vs. Spec~fic Volurne Graph at Constant Gas Concentration
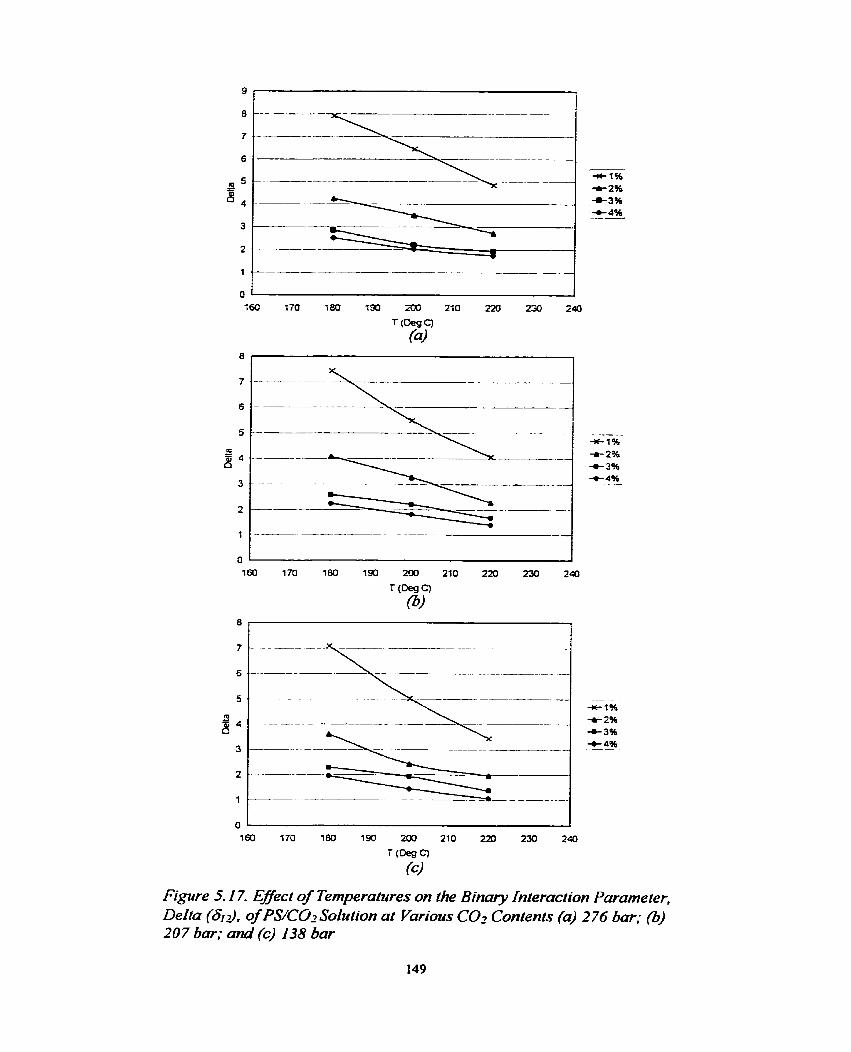
Figure 5.17. Ejject of Temperatures on the Binary Interaction Parumeter, Delta (6'3. of PS/COz Solulion at V d s CO2 Contents (a) 276 bar: (b) 20 7 bar; and (c) 138 bar
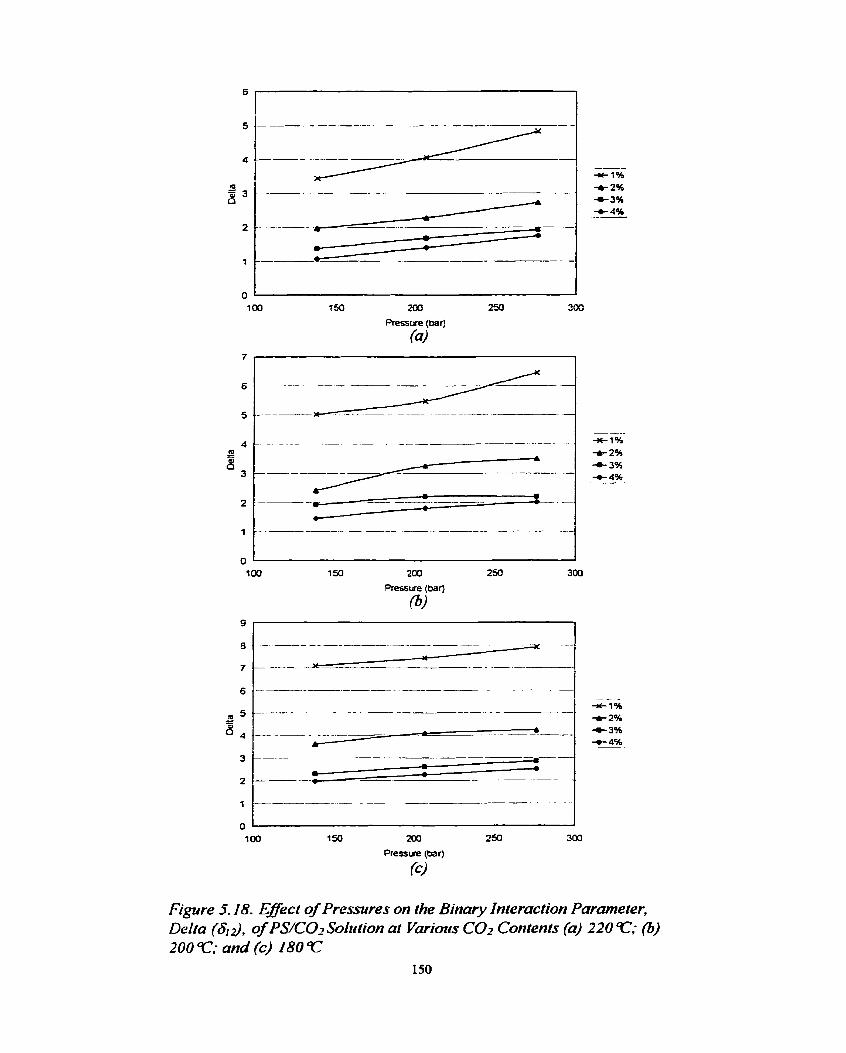
Figure 5.18. Effect of Pressures on the Binmy Interact~on Parame fer, Delta (&$, of PS/C02 Sokrtion at Vmious C a Contents (a) 220 97; (b) 200 Y; and (c) 180
150
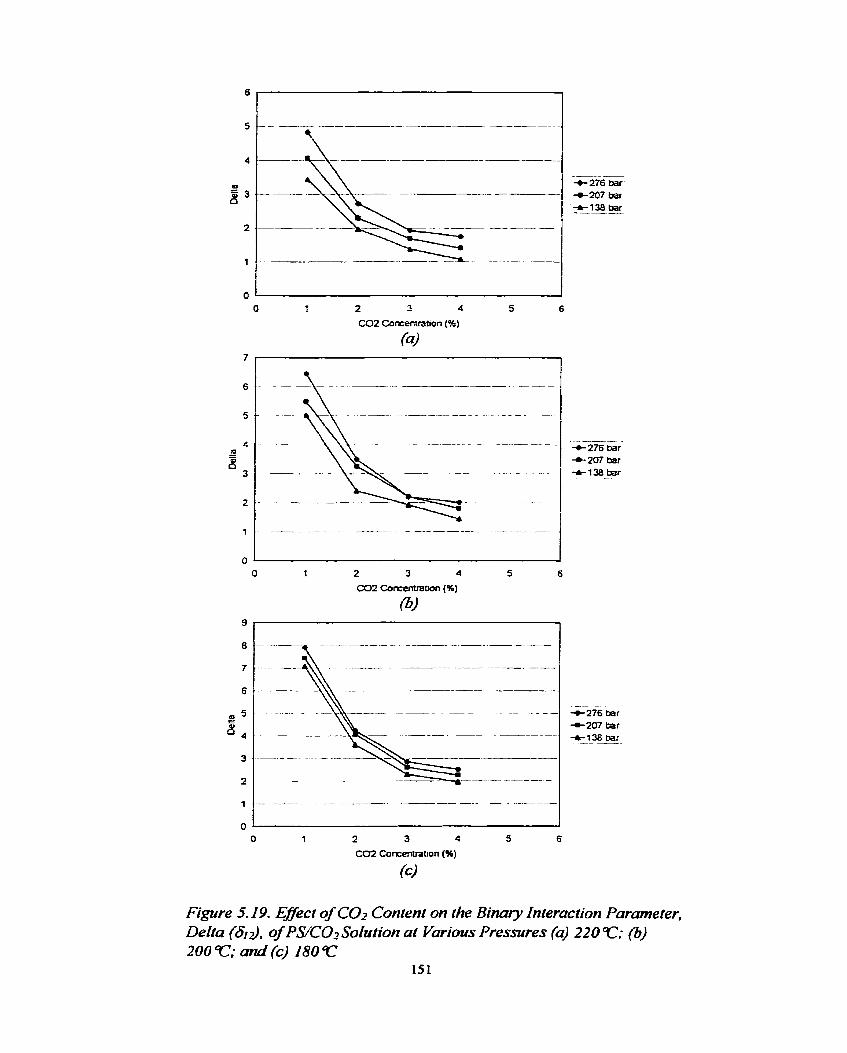
Figure 5.19. Eflect of CO2 Content on the Binary Interaction Parameter, Delta (6i3, of PS/COr Solution ut Various Pressures (a) 220 T; fi) 200 Y; and (c) 180T
15 1
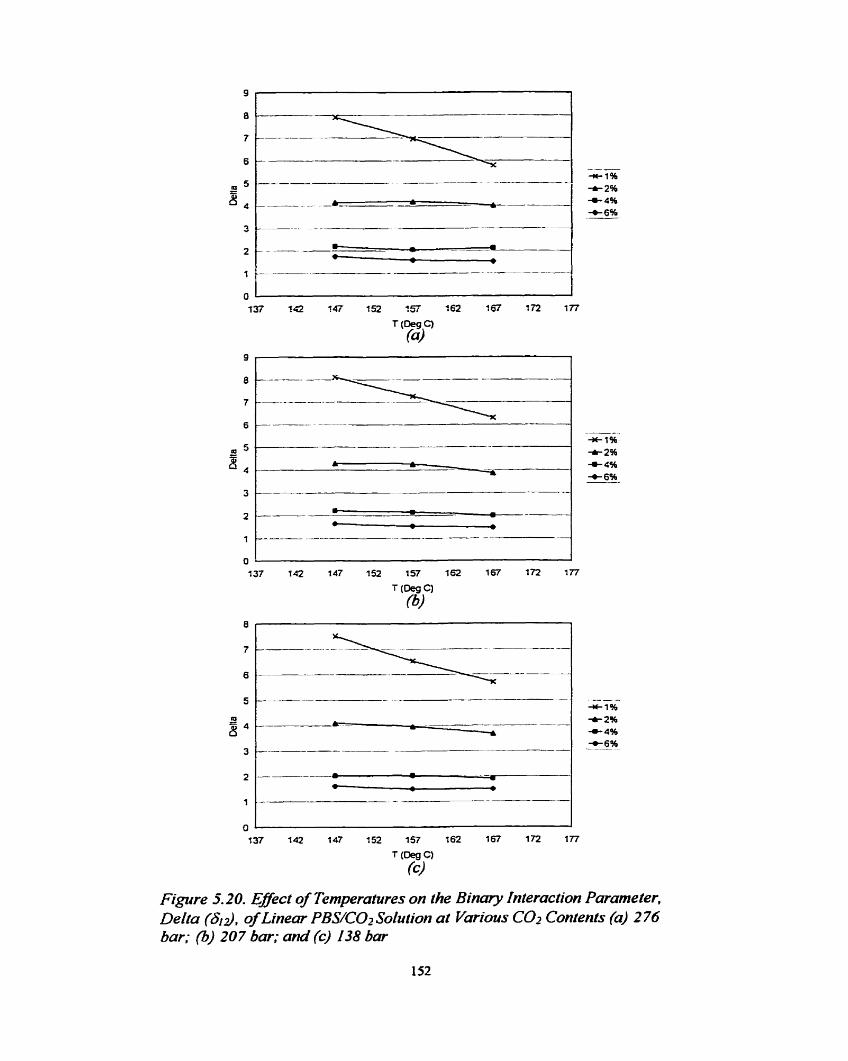
Figure 5.20. Eject of Temperatures on the Binary Interactzon Pmarneter. Deha (613. of LÏnear PBWCOZ Solution ut Various COz Contents (a) 276 bar; (iS) 20 7 bar; and (c) 138 bar
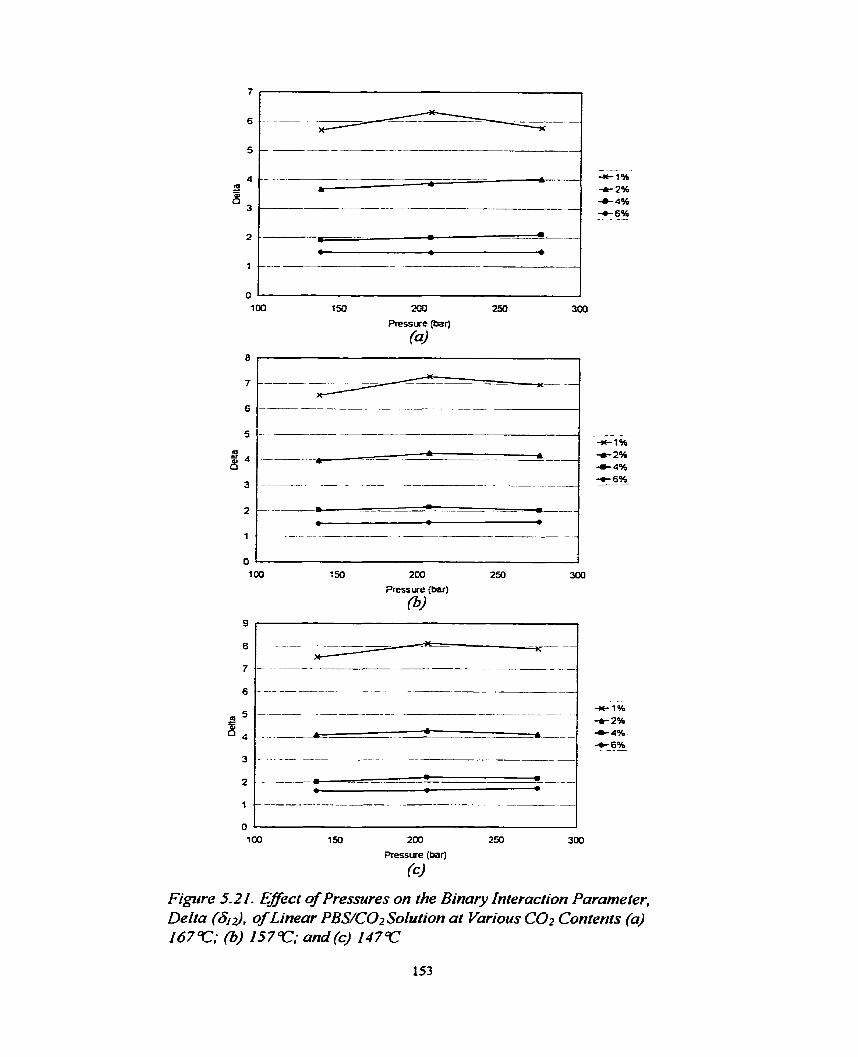
m Pressure (bar)
(a)
Pressure (bar)
O?!
200 2% 300
Pressure (bar)
(c)
Figure 5-21. Effect of Pressures on the Binary Interaction Parame fer, Della (613. of Linear PBS/C02 Solution a2 Various CO2 Contents (a) 1 6 7 r ; @) 1 5 7 C and(c) I47T
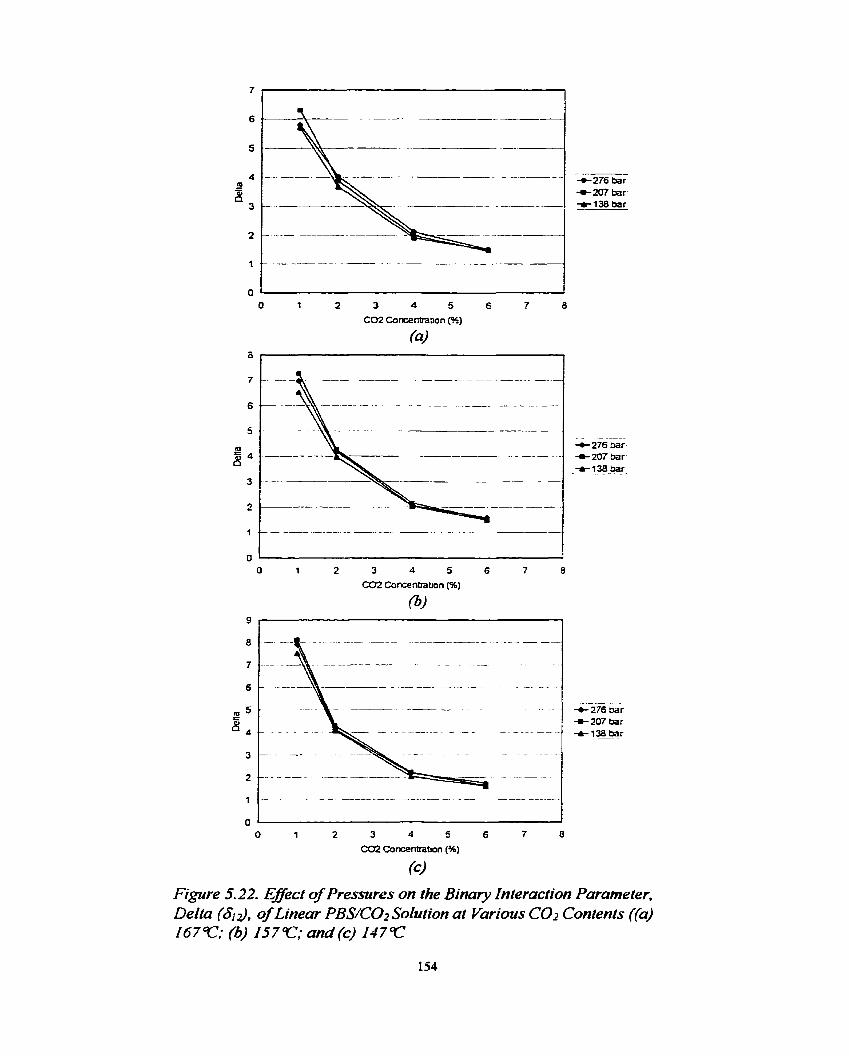
-- t 276 bar + 207 bar -138 bar
O 1 2 3 4 5 6 7 8
C02 Concentration (%)
O 1
. + 276 bar + 207 bar t 138 bar -----
-2% bar t 207 bar
t
Figure 5.22. Eflect of Pressures on the Binary Interaction Parameter, Delta f8''S. of Linear PBS/C02 Solution ut Various CO2 Contents ((a) 167T; (6) 157T; and (c) 1 4 7 r
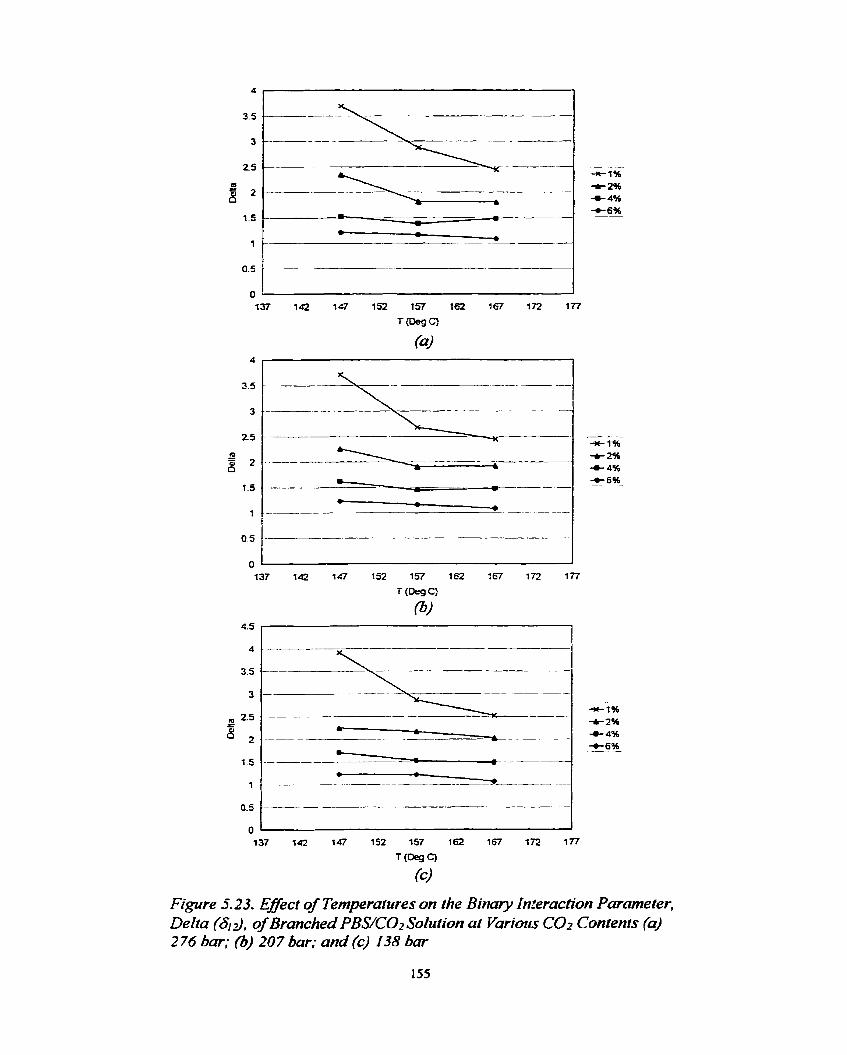
Figure 5.23. Effect of Ternperaf ures on the Binary in!eraction Parameter, Delta (613. of Branched PBS/C02 Solution at Variozrs CO2 Contents (a) 2 76 bar; (3) 207 bar; and (c) 138 bar
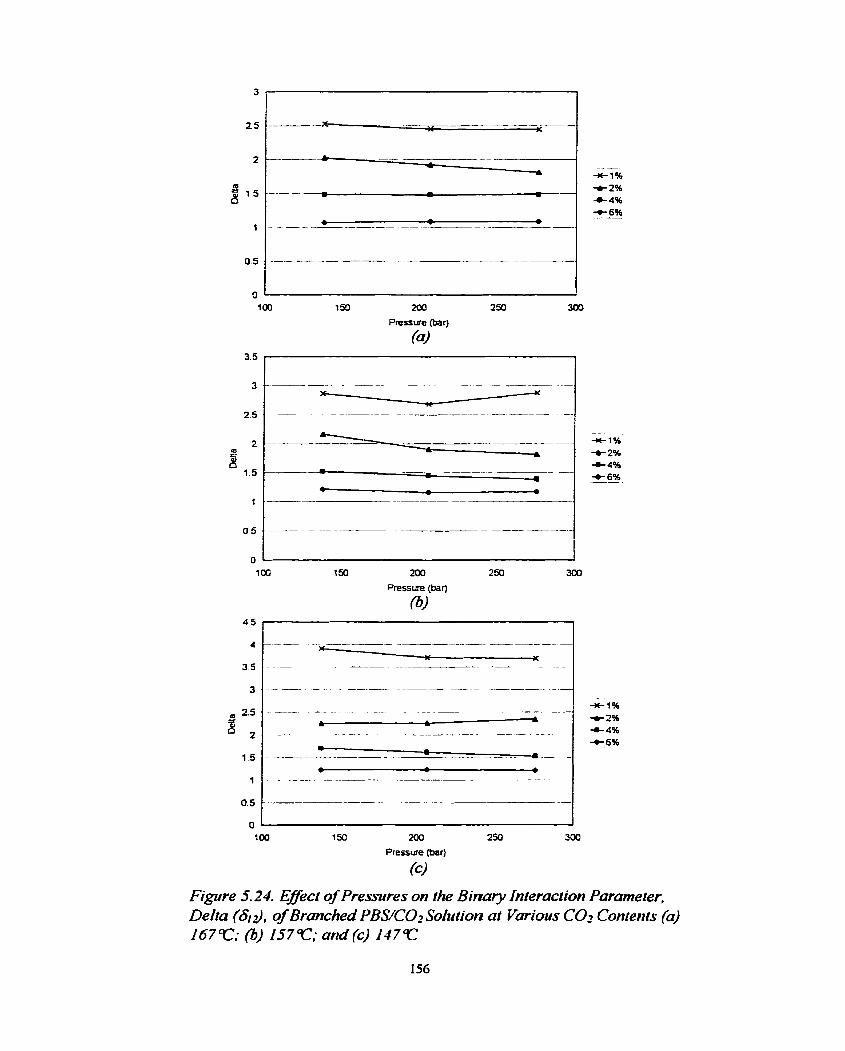
Pressure (br )
O
100 150 200 250 300
Pressure (bar)
Figure 5.24. Effect of Pressures on the Binary Interacrion Parameter, Delta (SIJ , of Branched PBS/C02 Sohtion at V&us CO2 Contents (a) 167'32 (b) 157T; and (c) i47r
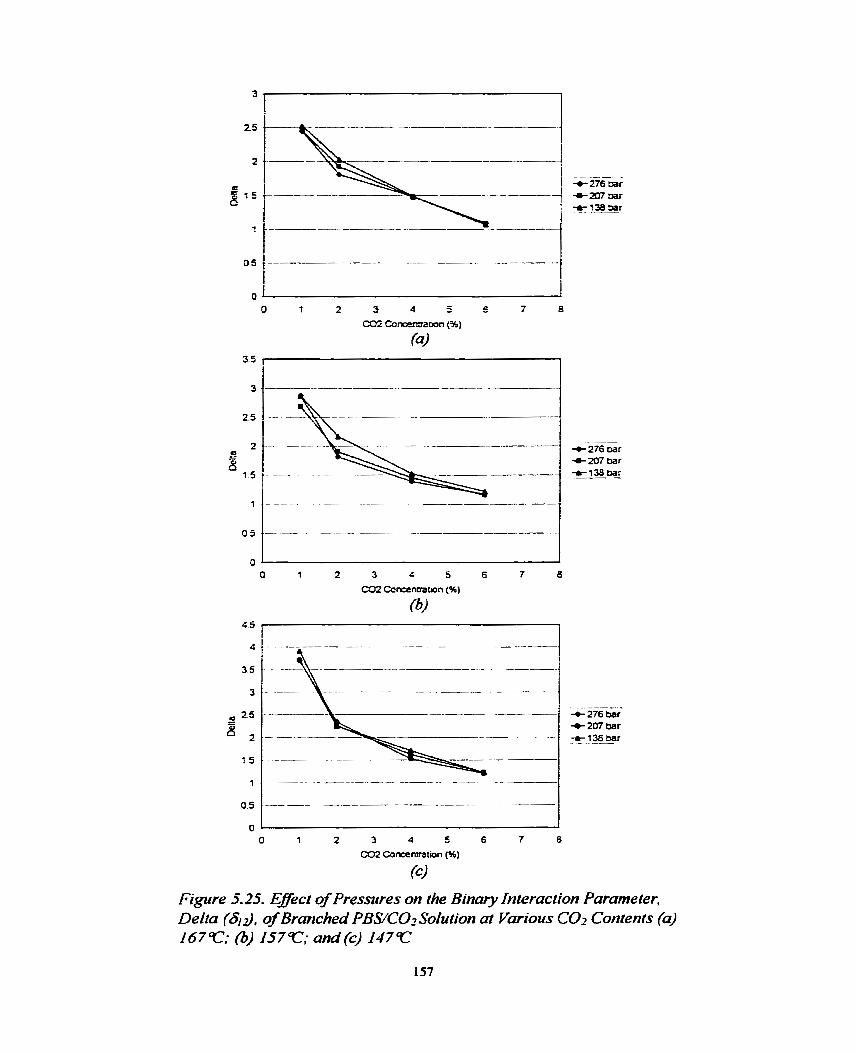
+ 276 mr +- 207 bar t l J 8 bar
Figure 5.25. Effect of Pressures on the Binary Interaction Parameter, Delta (613, of Brancheci PBS/C07 Soiution at Vùrious CO7 Contents (a) 167T; (b) 157C; and (c) 147T
SUMMARY AND CONCLUSIONS
6.1 SUM&IARY
The PVT relationships for polymedgas solutions are important in polymer processing,
especially in foam processing. For exarnple, the rneasurement of some therrnodynamic and
rheological properties, such as the surface tension of a melt, the solubility, the diffusivity, and
the viscosity of gas in a melt, requires the PVT relationship. However, measurement of the
PVT properties of polyrner/gas solutions in a molten state has not been realized because of
the di fficulties involved in the measurements. The newly developed dilatometer presented in
this thesis overcomes this limitation posed by conventional dilatometers by using a gear
pump and a tandem extrusion line. Although the repeatability and validity of the
experimentd data stil1 need to be verified, this research represents a significant contribution
towards the PVT measurement instrumentation for polyrner/gas solutions.
With the newly developed dilatometer, the specific volumes of a polymer/C02
solution were determined by rneasuring the mass and volume flow rates of the solution
independently. A positive-displacement gear pump mounted on the tandem extruder was
used to measure the volumetric flow rate of the solution. The gear pump was calibrated pnor
to the experirnent using water and vegetable oil in order to obtain the volumetric
displacement of the gear pump per revolution. The mass flow rate of the solutions was
determined by carefully measunng the weight of the sample produced in a given period of
time and adding the weight of CO2 injected from the syringe pump. The temperature of the
extmded polymerlgas mixture was increased in order to promote gas loss from the extrudate
coming out of the filament die with the goal of reducing the error involved in the
measurernent of the mass flow rate. Furthemore, the upstream and downstrearn pressures
were equaiized in order to prevent leakage between the inlet and outlet of the gear pump.
The upstream pressure was controlIed effectively by the rotation of the second screw and the
downstream pressure was controlled by a variable resistance valve.
One of the iimitations associateci with this experimental setup was that it could
measure the PVT relationship of a polyrnedgas solution only under extrusion processing
conditions. Due to the inherent nature of the extrusion system, obtaining consistent data
below !3.8 MPa (2000 psi) and above 27.6 MPa (4000 psi) was challenging. Since the
extrusion system can onIy process polymers at temperatures above their melting point, PVT
properties were rneasured over a relatively small range of temperatures. in the future, the
apparatus should be modified to handle higher pressure and temperature ranges.
6.2 CONCLUSIONS
i. The volumetric displacement of the gear pump was calibrated using water and vegetable
oil at various conditions. The volumetric flow rate was found to be 1.170 (+/- 0.002)
m h e v for the specific gear pump.
ii. The proposed design was verified by rneasuring the PVT retationships of numerous pure
polymers and comparing the experimental results with data from the literature.
The PVT relationships for linear PP melt were measured at temperatures ranging
from 180°C to 210°C and at pressures ranging from 6.9 MPa (1000 psi) to 29.6
MPa (4300 psi). The cornparison between the measured data and data published by
Sato e t al. showed that the experimentai results are almost the sarne as the reference
data.
The PVT relationships for PS melt were measured at temperatures ranging €rom
180°C to 220°C and at pressures ranging from 13.8 MPa (2000 psi) to 27.6 MPa
(4000 psi)- Cornparison witb the manufacturer's data showed a slight deviation,
which rnay have k e n caused by experimental errors.
The PVT relationships for linear PBS melt were measured at temperatures ranging
from 137°C to 167°C and at pressures ranging 13.8 MPa (2000 psi) to 27.6 MPa
(4000 psi). The experimental resuits were also compared with the manufacturer's
data. The experimen ta1 data sho wed a significant deviation from the manufacturer's
data which may have been caused by improper manipulation of the manufacturer's
data provided in a graphicd format. In addition, the PVT properties of branched
PBS were measured at temperatures ranging from 137°C to 167OC and at pressures
ranging from 13.8 MPa (2000 psi) to 27.6 MPa (4000 psi). Linear and branched
PBS materials were compared. Comparison between the two suggests that slight
differences in the PVT relationships may have been caused by the degree of
branching in the polymer matrix.
= The experimental PVT data for PP, PS, and linear and branched PBS were modeled
using FOV, MCM, and S-L EOS, and the characteristic variables for these EOS
were estirnated by using non-linear regression anaiysis. From the modeis. one can
predict the PVT behaviour beyond the experimentd ranges.
. . - 111.
iv.
v.
vi.
vii.
A syringe pump was used to inject CO2 gas into a Stream of molten polymer to form the
polymer/C02 solutions. Carbon dioxide was used as a physical blowing agent in this
study because of its high solubility in polytners as well as its environmentally benign
characteristics. The injected gas was completely dissolved by means of convective
diffusion processes to forrn single-phase polymer/C02 solutions.
The PVT data of PS/COZ solutions were measured at temperatures ranging from isO°C
to 220°C and at pressures ranging from 13.8 MPa (2000 psi) to 27.6 MPa (4000 psi).
Ga weight percentages of 1,2,3, and 4 wt% were used in the experiment.
The PVT data of linear PBS/C02 solutions were rneasured at temperatures ranging from
147°C to 167°C and at pressures ranging from 13.8 MPa (2000 psi) to 27.6 MPa (4000
psi). Gas weight percentages of 1,2,4, and 6 wt% were used in the experiment.
The PVT data of linear PBS/C02 and branched PBS/C02 solutions were compared. The
linear PBS exhibited higher swelling due to the gas content than the branched PBS
material. One hypothesis to explain this phenomenon is that the branched PBS material
has a large number of entangled molecular chahs, and therefore it swelled less thm the
Iinear PBS materials.
Attempts were made to mode1 the poIyrner/gas solutions using S-L EOS and its mixing
rules. The validity of this approach was unvetified, however, since the EOS assumes
solubility equilibrium conditions; in Our expenments, the solutions were above the
solubility equilibnum state. We assumed that the interaction parameter between the
polyrner and gas molecules should be a sensitive function of temperature and gas
content instead of temperature only when the condition is above the solubility
equilibrium. However, the derived interaction parameters were not consistent with the
conventiondly measured values. The validity of S-L EOS to describe our results is
suspected.
. - * viii. Another approach to investigate the effects of gas content on a polymer/gas solution was
performed by finding the characteristic parameters for MCM and S-L EOS. The
experimental data were treated as independent sets of different gas concentration. The
characteristic parameters were obtained using the non-linear regression method. The
results showed that the characteristic parameters were conjugated with each other and
the correIation did not show any trend. A large number of experimental data should be
obtained and modeled in order to corne up with solid conclusions about the modeling of
the specific volume of a polymer/gas solution.
Chapter 7
The following suggestions are made to direct future research on the measurernent
of the PVT properties of polymer/gas solutions:
i. PVT data should be acquired over a wider range of experimental conditions.
Increasing the temperature and pressure ranges is very important because a large
number of data points are needed to properly model the experimental data. Also,
finding the maximum solubility limit for the apparatus would be beneficid for
future studies.
ii. ModeIing using various EOS of polymedgas solutions should be performed. Since
the PVT relationships of polymer/gas solutions have not been measured before,
modeling the experimental data will be difficult. However, a detailed investigation
on the interaction between the polymer and CO2 molecules may provide insight to
predict the PVT behaviour. Perhaps a new EOS model, as well as mixing niles,
may be needed to predict the behaviour of the polyrner/gas solution above the
solubility equilibrium state.
... I i 1. The relationship between rheological behaviour and the PVT properties should be
investigated. Since both behaviours deal with free volumes in the polymer matrix, a
relationship between the two may be established.
iv. Alternative physical blowing agents, e.g., nitrogen and butane, may be used to
measure the PVT rekttionships of pol ymer/gas solutions. Finding the relationshi p
with different physical bIowing agents would be desirable since the PVT behaviours
of polyrners with these physical blowing agents have not been rneasured previously.
v. With the newly developed apparatus, more detailed research c m be performed to
investigate the effects of gas content, pressure, and temperature on specific volume.
The study should be focussed on the theoretical aspects of the PVT relationship.
Since the apparatus is the first of its kind, verification of the experimental results
should be performed as well.
References
1. K.C. Frisch and J.H. Sanders, Plastic Foams (In Two Parts), Part 1, Marcel Dekker
Inc., New York (1972).
2. J.L. Tfirone, Thermovlastic Foams, Sherwood Publishers, Ohio (1996).
3. A H . Behravesh, Ph.D. Thesis, University of Toronto (1998).
4. R.G. Wissinger and M.E. Paulaitis, "Swelling and Sorption in Polymer - CO2
Mixtures at Elevated Pressures", Journal of Polymer Science, 25, 2509 ( 1987)-
5. L.L. Blyler, Jr., and T.K. Kwei, "Flow Behavior of Polyethyiene Melts Containing
Dissolved Gases", Journal of Polymer Science, 35, 165 ( 197 1 ).
6. M. Lee, C.B. Park, and C. Tzoganakis, "Measurement and Modeling of PS/COr
Solution Viscosities", Polynier Engineering and Science, 39,99 (1999).
7. M. Lee, C.B. Park, C. Tzoganakis, and H.E. Naguib, "Cornparison of Various
Viscosity Models for PS/C02 Solutions," S f E ANTEC Technical Papers, 45, 124 1-
1 246 ( 1 999).
8. D.Y. Kwok, L.K. Cheung, C.B. Park, and W. Neumann, Polymer Engineering and
Science, 328,757 (1998).
9. R.J. Roe, "Surface Tension of Polymer Liquids", Jo~rrnal of Physical Chemistry, 72,
2013 (1968).
10. J. MuIrooney, M.A.Sc. Thesis, University of Toronto (1995).
1 1. S. Doroudiani, C.B. Park, and M.T. Kortschot, "Effect of Crystallinity and
Morphology on the Microcellular Foarn Structure of Semicrystalline Polyrners",
Polyrner Engineering and Science, 36,2645 (1 996).
1 2. P. Neogi, Diffusion In Polvmers, Marcel Dekker, New York ( 1 996).
13. S.S. Park, C.B. Park, D- Ladin, H.E. Naguib, and C. Tzoganakis, "On-Line
Measurement of Pol ymer Melt Specific Volume Using a Gear Pump". SPE M E C
Technicar Papers, 45,247 1 ( 1 999).
14. C.B. Park, S.S. Park, D. Ladin, and H.E. Naguib, "On-Line Measurement of the PVT
Properties of PoIymer Melts Using a Gear Pump", Polymer Engineering and Science,
(submitted in May 99).
15. G.N. Foster, N. Waldman. and R.G. Gnsley, "Pressure-Volume-Temperature
Behavior of Polypropylene", Polymer Engineering and Science, 6, 13 1 ( 1966).
16. P. Zoller, 'The Pressure-Volume-Temperature Properties of Three Well-
Characterized bw-Density Polyethylenes", Journal of Applied Polymer Science, 23.
105 1 and 1057 (1979).
17. P. ZoIler and D.J. Walsh, Standard Pressure-Volume-Tem~erature for Polvrners,
Technomic Pubtishing Co., Lancaster, PA (1995).
18. P.A. Rodgers, "Pressure-Volume-Temperature Relationships for Polymeric Liquids:
A Review of Equations of State and Their Characteristic Parameters for 56
Polyrners", Journal of Applied Polymer Science, 48. 106 1- 1080 (1993).
19. Y. Sato, Y. Yamasaki, S. Takishima, and H. Masuoka, "Precise Measurement of the
PVT of Polypropylene and Polycarbonate up to 330°C and 200 MPa", Journal of
Applied Polymer Science, 66, 14 1 - 150 ( 1 997).
20. S. Beret and J.M. Prausnitz, "Densities of Liquid Polymen at High Pressure",
Macromolecules, 8,536 ( 1975).
2 1. S. Rahman and M.A. Barnifet, "A New Technque for Simultaneous Measurement of
PVT and Phase Equilibna Properties of Huids at High Tmperatures and Pressures",
Petroleum Science and Engineering, 14,25 ( I 995).
22. T. Hirose, K. Mizoguchi, and Y. Kamiya, "Dilation of Polyethylene by Sorption of
Carbon Dioxide ", J. Poiym, Sci Polym. Phys., 24,2 107 (1 986).
23. H. Xie and R. Sirnha, "Theory of Solubility of Gases in Polymers", Poiymer
International, 44,348 ( 1 997).
24. I.C. Sanchez and P.A. Rodgers, "Solubility of Gases in Polymers", Pure and Appl.
Clrem., 62,2 107 (1 990).
25. Y. Sato, M. Yurugi, K. Fujiwara, S. Takishima, and H. Masuoka, "Soulbilities of
Carbon Dixoide and Nitrogen In Polystryene Under Hihg Tmeperature and Pessure".
Fluid Phase Equlibria, 125, 1 29 ( 1996).
26. W .J. Koros, D.R. Paul, and A.A. Rocha, "Carbon Dioxide Sorption and Transport In
PoIycarbonate", J. Polym. Sci. Pofym. Phys. Ed., 14,687 (1976).
27. K. Mishima, T. Tokuyasu, K. Matsuyama, N. Komorita, T. Enjoji, and M. Nagatani,
"Solubility of Polyrner In the Mixtures Containing Supercritical Carbon Dioxide and
Antisolvent". Fiicid Phase Eqrrilibria, 144,299 (1 998).
28. B. Wong, 2. Zhang, and Y.P. Handa, "High-Precision Gravimetric Technique for
Determining the Solubility and Diffusivity of Gases in Polymers". Journal of
Polymer Science: Part B: Polymer Physics, 36,2025 ( 1998).
29. B. Wunderlich, Macromolecular Phvsics. Vo1.2, Academic Press, Inc., New York
( i 976).
30. P.G. Tait, The Voyage of MHS Challenger, 2, Part 4 (1888).
3 1. P.J. Flory, R. A. Orwoll, and A. Vriz, J- Am- Chem. Soc., 86,3507 (1964).
32. G.T. Dee and D.J. Walsh,"Equations of State for Polyrner Liquids",
Macronrolecules, 21,8 1 1 ( 1988).
33. G.T. Dee and D.J. Walsh, "A Modified Ce11 Mode1 Equation of State for Polymer
Liquids", Macromolecules, 21,8 1 1 ( 1988).
34. I.C. Sanchez and R.H- Lacombe, J. Phys. Chem, 80,2352 ( 1976).
35. I.C. Sanchez and R.H. bcornbe, "Statisticd Thermodynamics of Polymer Solutions",
Macrornolecules, 11, 1 145 (1 978).
36. F.W. Sears, and G.L. Slinger, Thermodvnamics. Kinetic Theorv. and Statistical
Thermodvnamics, Addison-Wesley, pp. 302-347 (1986).
37. L.H. Sperling, Introduction To Phvsical Polvmer Science, John Wiley and Sons, pp.
97-i21 (1992).
38. P.J. Fiory, Chapter 7: Statistical Thermodynarnics of Polvmer Solutions, Corne11
Univ. Press., pp. 495-539 (1953).
39. C. Cercignani, Theorv and Application - of the Boitzmann Eauation, Springer (1988).
40. L.A. Blyumenfeld'd and A.Y. Grosberg, "Gibb's Paradox and the Concept of the
Construction of the System in Thermodynamics and Statistical Physics", Biophysics.
40,653 (1995).
4 1. 1. Prigogine, N. Trappeniers, and V. Mathot, Disc. Faraday Sci., 15,93 (1953).
42. J.J. Marano and G.D. Holder, Ind. Eng. Chem. Res., 36, 1904- 1905 (1 997).
43. M.L. Huggins, "Some properties of solutions of long-chain Cornpounds", J.
Phys-Clrem., 46,151 (1942).
44- M.P. Ekart, J.F. Brennecke, and C.A. Eckert, Molecular Analvsis of Phase Equlibria
in Supercritical Fluids in Supercritical Fluid Technology, CRC Press, pp. 163-1 88
(1991).
45. J. Park and H. Kim, "A New Equation of State Based on Hole Theory", Fhid Phase
Equlibria, 144,77 (1998).
46. D. Henderson, Chern. Phys, 37,63L (1962).
47. R. Sirnha and T. Somcynsky, Macromolecues, 2,342 (1 969).
48. J. Crank and G.S. Park, Diffusion in Polwners, Academic Press Inc., New York, N-Y.
( 1968).
49. P L . Dumll and R.G. Griskey, "Difision and Solution of Gases in Thermally
Softened or Molten Polymers: Part I", A.I.Ch.E.', 12, 1 147 (1966).
50. P.L. DuniIl and R.G. Griskey, "Diffusion and Solution of Gases in Therrnally
Softened or Molten Polymers: Part II?, A.I.Ch.E.J., 15, 106 (1969).
5 1. S.W. Cha, Ph-D. Thesis, Massachusetts Institute of Technology, Cambridge, MA
( 1993).
52. N.P. Suh, Th? Princi~les of Desim, Oxford University Press ( 1990).
53. C.B. Park and N.P. Suh, "Rapid Polymer/gas Solution Formation for Continuous
Processing of Microcellular Plastics", ASME Trans., J. Eng. Industry, 118,639
(1 996).
54. C.B. Park and N.P- Suh, "Filamentary Extrusion of Microcellular Polymers Using a
"Rapid Decompressive Element", Polymer Engineering and Science, 36, 34 ( 1996).
55. C.B. Park, A H . Behravesh, and R.D. Venter, Polymer Engineering and Science, 38,
1812 (1998).
56. A.H. Behravesh, C.B. Park, and R.D. Venter, Cellular Polymers, 17,309 (1998).
57. J.IM. McKelvey, b'Perfomance of Gear Pumps in Polymer Processing", Polymer
Engineering and Science, 24,39 18 (1984).
58. R.W. Miller, Flow Measurement Engineering Handbook, McGraw-Hill, 2.82 (1996).
59. D.W. Marquardt, J. Soc. Indust. AppL Math., 11,43 1 (1963).
60. K. Levenberg, Quart. Appl. Math., 2, 164 (1 944).
6 1. A. Garg, E. Gulari, and C.W. Manke, 'Therrnodynamics of Polymer Melts Swollen
with Supercritical Gases", Macrornolecriles, 27, 5650 (1 994).
62. C. Kwag, L.J. Gerhaedt, V. Khan, E. Gulari, and C.W. Manke, "Plasticization of
Polyrner Melts with Dense of Supercritical CO?, Meeting of the ACS, Polymeric
Materials Science and Engineering Div., 183- 185 ( 1996).
63. C.B. Park, Ph-D. Thesis, Massachusetts hstituce of Technology (1993).
64. M.D. Baijal, 9, Wiley miblication (1982).
65. Y. Sato, H. Hashiguchi, S. Takishima, and H. Masuoka, "PVT Properties of
Polyethylene Copolymer Melts", International Conference on High Pressure Science
and Technology (AIRAPT- Io), Kyoto, Japan, p.425 (1997).
66. A. Michels and C. Michels, Proc. R. Soc, Ser. A, 153, 20 1-2 14 ( 1936).
67. R. Pop-Illiev, G. Liu, F- Liu, C.B. Park, S. D'Uva, and J.A. Lefas, "Rotational Foam
Molding of Polyethylene and Polypropylene", SPE RETEC, Strongsville, Ohio, pp.
95- 104, June 6-8 ( 1999).
68. E.A. Avdlone and T. Baumeister, Standard Handbook for Mechanicd Eneineers. 9"
Edition, McGraw-Hi11 Book Company (1987).