Embed Size (px)
Citation preview

Joint Completion Report on IDNP Result#l “A Methodology for ldentijcation of Waterlogging and Soil Salinity Conditions Using Remote Sensing“
5.3.1 Dynamics of Salinization and Waterlogging using Supervised Classification
For the delineation of the saline and waterlogged areas within the irrigation command, the commonly recommended supervised classification was used. The following five classes i.e. cropped area, ponded water area, waterlogged area, saline area and salt-affected crop area were identified on the satellite image. To illustrate the dynamics, the classification was done on the SPOT image of January 1989, the TM image of November 1995 and the February image of 1996. The generated raster map was filtered using majority filter in order to correct the wrongly classified pixels.
Care was taken to select for each class a reasonable homogeneous area, which was indicated in the sample statistics. Once the sample set was ready for all the classes, the supervised classification was attempted and the classified map was obtained. Statistics of area distribution of the various classes was analysed. It is indicated that a good set of ground truth was not available for all the dates. The training-sets were established mostly based on insight of the cropping patterns and the location in the study area.
5.3.2 Spatial Distribution of ECe
An attempt was made to verify the applicability of interpolation techniques for predicting the salinity at different locations from a limited number of point observations. A total of 238 soil samples were analysed for the determination of ECe values. Various types of interpolation procedures were executed on 224 points, excluding 14 points that were used to assess the interpolation results. Nearest neighbour, moving average, trend surface, and moving surface interpolation techniques were used. Once the interpolated map was prepared, the interpolated (estimated) values of salinity for the 14 selected points were compared with the measured ones.
The degree of correctly assessing the salinity values by different techmque was decided on the basis of minimum value of error term defined as follows:
Error term = Observed values - Estimated values
To compare the accuracy of the interpolation methods, the Students’-t distribution test was applied on predicted values calculated using various interpolation techniques.
5.4 Results
In Fig. 3, the result from the classification can be seen. In Table 7, the area-wise distribution of the main classes excluding villages and the infrastructure is given. It is clear that the outcome of the classification depends not only on the satellite configuration but also highly on the date of the recording. Classification differences due to spatial and radiometric resolutions could not be assessed.
The sowing of wheat starts from mid-November and the fractional vegetation cover remains low in the month of January. A large part of the bare lands have a dark colour and are seen as wet, which may be due to the winter rains. Ths resulted in a large area classified as ‘waterlogged’. In the month of November large area is bare, hence the cropped area is low. A large area with dry,
18

Joint Completion Report on IDNP Result#l "A Methodology for Identification of Waterlogging and Soil Salinity Conditions Using Remote Sensing''
SPOT January 1989 Landsat 5 TM November 1995 IRSlC February 1996
0 salt-affected crops Based on supeMd image classification. 0 waterlogged area drain No.8 -
saline area JLNfeeder O mm
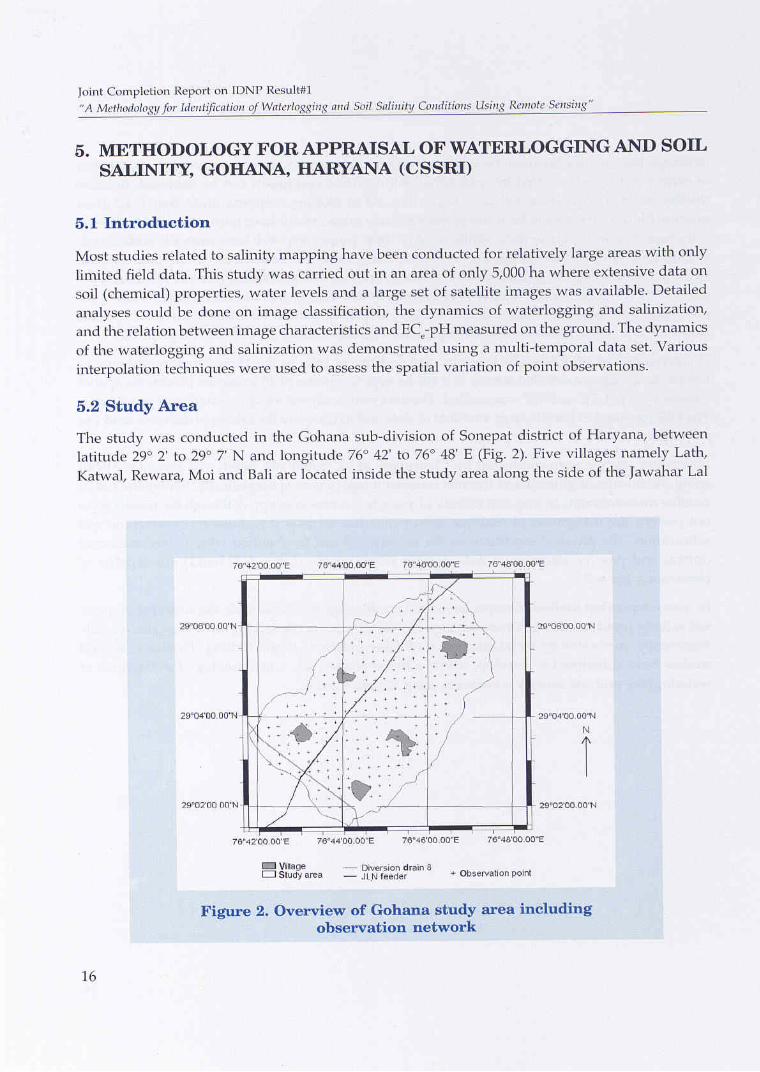
Figure 3. Dynamics of soil salinization and waterlogging in the study area
bare soils have a relatively high reflectance resulting in a large area classified as 'saline'. Not many soils seem to be wet.
A large area is cropped in February. Winter 1996 was very wet such that over a large part of the area crops could be grown. Most likely the class 'salt-affected crops' is not well classified. Some delay in crop growth could have occurred due to adverse moisture conditions. When evaluating the spatial variances, it was observed that the class representing ponded water area was relatively stable both in size as well as in location. Most cross-over took place between salt-affected crops, waterlogged and cropped areas.
Table 7. Extent (%) of various classes based on supervised classification
Class January 1989 SPOT
November 1995 Landsat-TM
February 1996 Í IRS I
Cropped area
Ponded water area
Waterlogged area
27.3
1.6'
41.8
17.7
2.9
6.8
31.8 I I
6.4 ' I I
1.2
Saline area 9.3 43.9 . 11.9
Salt-affected crops 12.5 21.2 41.2 I
19

Joint Completion Report on IDNP Result#l "A Methodology for Identification of Waterlogging and Soil Salinity Conditions Using Remote Sensing"
The t-tests revealed that for all the methods, the minimum level of significance were quite high indicating the limitation of interpolation techniques for predicting the salinity in the field. The interpolation technique using 'trend surface of the 4th degree' gave the best result out of the methods tested. The result clearly indicates that EC is a point-observation containing limited spatial information. 20-30 meters away from the measurement the EC can be totally different.
5.5 Conclusions
Satellite images can be used to get insight in the dynamics of the salinity and waterlogging in the area. However general conclusions, even on broad classes such as cropped area, saline areas etc., have to be drawn with great care.
A good knowledge of cropping pattern, meteorological conditions at recording time of the image and agricultural practices are needed in order to correctly assess the classification results.
In the irrigation command, it is observed that salinity developed at a particular location has no relationship with the nearby point locations.
The variation of reflectance properties of different land uses in an irrigation command affected with waterlogging and salinity problems makes it possible to diagnose the waterlogging and salinity affected area.
5.6 Recommendations
A more elaborate study need to be undertaken on the information content of the various images within one crop cycle and in-between crop cycles. An attempt should be made to obtain land cover data for the study at the time the images were taken.
Local farmers could be asked to indicate good / poor and waterlogged areas. Local knowledge could be helpful in understanding the dynamics of the system.
Field data should be procured in a more systematic way. A good pre-field satellite image interpretation could be helpful to set-up a stratified sampling scheme. With the stratified sampling, expected differences in EC, pH, water table and crop status between indicated classes should come out.
The use of additional thematic layers such as elevation, water table and physiography to improve the results should be explored. Relational modelling in which these layers are introduced should be attempted.
20

Joint Completion Report on IDNP Result#l "A Methodology for ldentijïcation of Waterlogging and Soil Salinity Conditions Using Remote Sensing"
6. MAPPING SOIL SALINITY USING DIGITAL IMAGE ANALYSIS AND GIS, SONEPAT DISTRICT, HARYANA (CSSRI)
6.1 Introduction
Large irrigation systems in India lack accurate information on the extent and distribution of the problem of waterlogging and salinity. At the national level, this greatly handicaps policy formulation and project preparation. A study was undertaken to identify and map saline soils and waterlogging using digital analysis of satellite data. Field data were used to determine the dominant land- cover classes and to assess the accuracy of the digital classification. Spatial and attribute data were integrated in a GIS to obtain a digital database which can be used for soil salinity assessment and management.
6.2 Study Area
An area in the Sonepat district in the State of Haryana, located between latitude 29" 00' to 29" 15' N and longitude 76" 30' to 77" 00' E, was selected. The area is a part of the low-lying flat Indo- Gangetic basin.,The average annual rainfall is 550 mm and the annual evapotranspiration is 1650 mm. Introduction of irrigation coupled with poor surface drainage and poor quality groundwater are mainly responsible for the regional problems of waterlogging and secondary salinization in agricultural fields.
6.3 Methodology
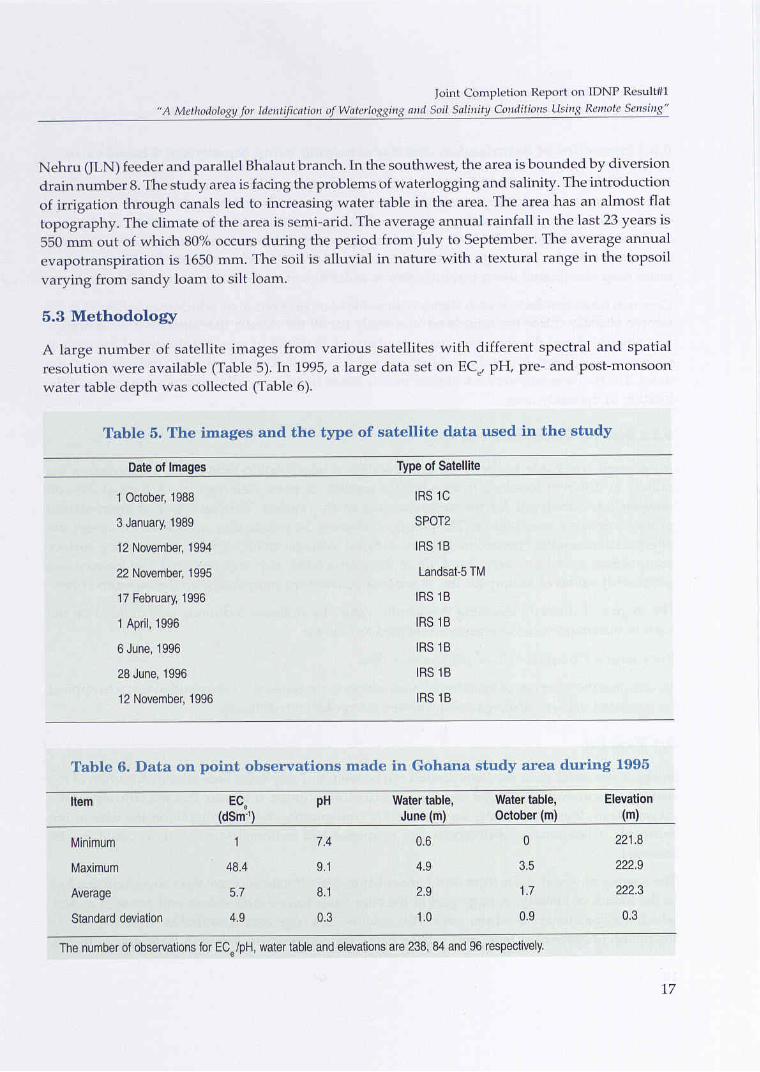
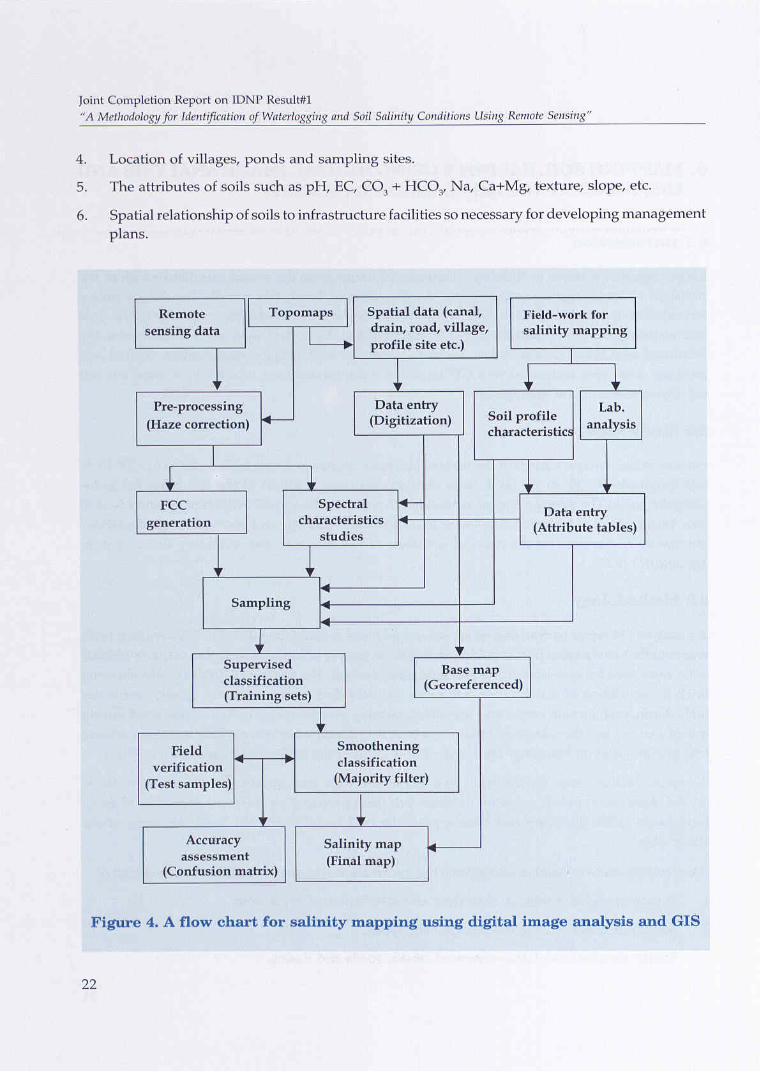
A Landsat-TM scene comprising of all seven bands for a cloud free date (22nd November 1995) was obtained. In the same period fieldwork was done. Survey of India topographic maps on 1:50,000 scale were used for geo-referencing and base map creation. The soil map 1:250,000 scale, showing units in association of soil families, and other ancillary data on groundwater quality and water table depth, crop growth stages and prevailing farming practices were reviewed and used during image analysis and the selection of training sets. ILWIS 2.3 software was used for image processing and geo-information handling. The detailed flow chart of the methodology is shown in Fig. 4.
A spatial database was standardised to a single reference and all non-spatial data were taken on the observation point. A spatial database has been prepared on the basis of Survey of India toposheets (1:50,000 scale) and thus a graticule of 2 maps forms the base reference of the study area.
After editing and verification procedures the information was stored as database consisting of
1.
2.
3.
A map in digital format on the extent and distribution of saline soils.
Spatial distribution of geo-referenced soil types.
Spatial distribution of geo-referenced canals, roads and drains.
21
Joint Completion Report on IDNP Result#l "A Methodology for ldent$ication of Waterlogging and Soil Salinity Conditions Using Remote Sensing''
I levels of saline and sodic conditions of the soils and 4 representing normal cropped area, sand dune, submerged soil, and waterlogged soils were identified (Table 8; also see Fig. 5).
6.3.1 Ground Truth for Soil Salinity Assessment
An initial field traverse was made to record various degrees of salinized areas. Seventeen soil profiles were studied for field morphology. Horizon-wise soil samples were collected for laboratory analysis. Random auger bores and surface sampling was also done to correlate with image signatures. The soil samples were analysed for soil pH, EC, soluble ions, soil texture and organic matter for salinity assessment. Morphologically, all the soils are similar in colour, texture, structure, distribution of pores and roots. In saline soils, shallow water table and capillary rise of water is common leading to a moistened appearance of soil surface with presence of salt crusts. However, the saline soils near village Lath (profile no. 17) have a compact and dense petrocalcic layer at 80- 90 cm depth which restricts free capillary rise of groundwater and keeps the salt crust on the surface in a relatively dry state. The soils with higher degree of salinity have predominance of neutral salts comprising mainly, chlorides and sulphates of sodium, calcium and magnesium. The sodic soils with a thin 2-5 mm thick, platy structure on the surface have a dense and compact solum restricting water movement, higher pHs (9.9 to 10.2) and dominance of CO, and HCO,. The total salt content in saline soils is much larger than in sodic soils.
6.3.2 Satellite Image Analysis
Haze correction was applied on TM band 1. Eleven well distributed tie points on canal, drain and road intersections, clearly identifiable both on the map and image were used for geo-referencing the image. In the present case the Lambert Conical Conformal map Projection was used. A FCC consisting of band 4 (red), band 3 (green) and band 2 (blue) was used for further analysis.
Spatial, spectral, field and laboratory data were used in deriving salinity and land cover classes and also in the selection of training sets for each of the classes. The position of the clusters and class statistics were continually checked through the feature space. After preliminary training sets, clustering of pixels in the feature space was found overlapping in salinity classes of lower degree of salt concentration. Based on the field observations and critical examination of laboratory data, a number of training sets were redesigned. Subsequently the classification was done using maximum likellhood classifier. Different threshold values were iterated based on the variance and covariance of clusters. A threshold value of 30 gave the most satisfactory results. After classification, a majority filter was applied.
6.4 Results
23


Joint Completion Report on IDNP Result#l “ A Methodology for ldentijïcation of Waterlogging and Soil Salinity Conditions Using Remote Sensing”
Sodic and saline areas reflect almost similar in band 3 (red) and band 4 (near infrared band). But sodic soils could be separated from saline soils based on their spectral characteristics in band 5 where increase in reflectance is relatively less in case of sodic than saline soils.
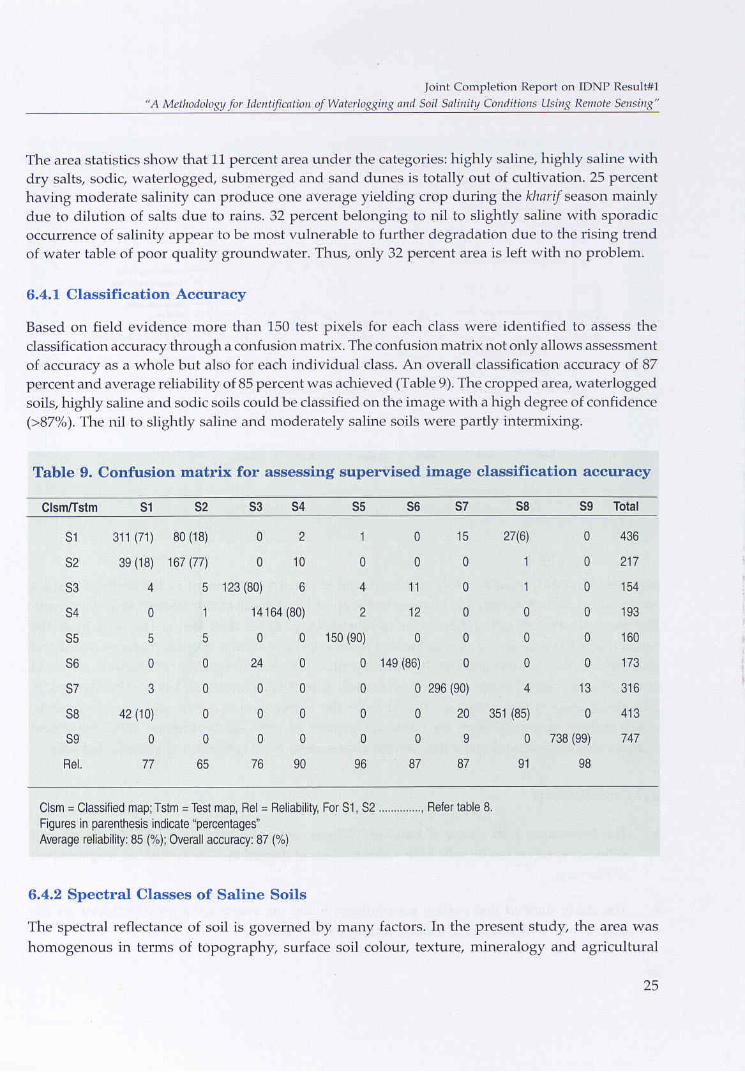
The saline soils of the area have been mapped with an average reliabilityof 85% while the overall classification accuracy was 87%.
The image processing and GIS capability of ILWIS was demonstrated in integrating image features with a geo-referenced base map.
6.6 Recommendations
In order to assess the ’universality’ of the method applied, it is recommended to execute similar studies in pilot-areas in the Indo-Gangetic plain having similar agro-ecological conditions.
To understand dynamics of soil salinity, it is recommended to analyse multi-date satellite data complimented with sound fieldwork. In the fieldwork, attention should be paid to the correct positioning of the observation points through the use of GPS. Physiography, land drainage conditions and information on groundwater depth and quality should be used during analysis.
The November data proved to be useful in identifying various stages of salinity degradation. The usefulness of other dates to monitor salinity built-up in a crop cycle should be assessed. Promising indicators such as NDVI and albedo could be used.
27